Abstract
The presence of concrete cracks in structures indicates possible structural deterioration, but it is quite difficult to measure crack width accurately. While much research has been conducted on crack detection using image processing, there is a gap in the accurate quantification of crack width in millimeters. Current methods either measure in pixels or require the attachment of scales or markers onto a measured surface, which can pose safety hazards in hard-to-reach areas. This paper addresses these issues by proposing a novel image-based method for measuring concrete crack width in millimeters using a laser beam and image processing. The proposed method was validated in the laboratory by capturing images of concrete cracks with two cameras of different resolutions, each attached with lasers. The lasers projected a circular laser beam onto the surface of the concrete under inspection. The images were then pre-processed, segmented, and skeletonized for crack width measurement in pixels. The relationship between the laser diameter and camera distance from the surface was used to convert the measured crack width from pixels to millimeters. The method was performed with high accuracy, as indicated by the absolute error. The largest absolute error was 0.57 mm, while the smallest absolute error was 0.02 mm. The proposed method allows real-world interpretation of results in millimeters. As a result, measured crack widths can easily be compared to allowable limits in international standards, which are typically expressed in metric or SI units. The proposed method can also promote safer inspections in areas of low accessibility by attaching the laser to devices such as drones.
1. Introduction
Concrete structures are increasingly experiencing deterioration due to various factors such as aging, increased traffic loads, and extreme weather conditions [1,2]. While concrete structures experience various kinds of damage, cracks are typically one of the most common indicators of the presence of damage. The presence of cracks does not always indicate imminent collapse; however, they often lead to reduced structural integrity. Cracks weaken structures by leading to issues such as corrosion of internal rebar and reduced loading capacity [3]. It is important to detect and measure cracks in a timely manner in order to infer decisions on necessary repairs and maintenance [4]. Failure to do so can lead to catastrophic failures with a high cost to human life and the economy [5]. It is worth noting that it is common for concrete to crack, and not all cracks are a cause of concern. The width of cracks is typically a good indicator of the severity of the cracks.
The conventional method for detecting and measuring concrete cracks has been through visual inspections performed by trained professionals on-site. However, this method has limitations such as a potential for human error, high costs of operation, disruptions to traffic, and access limitations [2,6]. Crack widths are typically recorded manually during the visual inspection using crack-width comparator gauges [7], crack scales, or specialized bridge inspection vehicles.
Extensive research has been conducted on image-based crack detection methods. The images of the concrete surfaces are captured using a variety of image acquisition devices. The most common devices include DSLR cameras [6,8,9,10], unmanned aerial vehicles [6,8,11,12], and smartphones [9,13,14]. Other techniques include infrared cameras, 3D laser microscopes [15], and stereovision [16]. Early works looked at the use of image-processing techniques that used threshold-based methods [17]. Threshold-based methods rely on pixel intensity information for the detection of cracks. Fujita and Hamamoto [18] proposed a method for the detection of cracks on noisy concrete surfaces which applied locally adaptive thresholding to an image that had undergone pre-processing and probabilistic relaxation. Kim et al. [19] detected cracks using a hybrid image processing method that used the image binarization technique by Sauvola [20]. The technique was initially designed for detecting text in noisy backgrounds. The detected cracks were then skeletonized, allowing crack width to be measured as the distance between the two extreme ends of the crack skeleton. Ioli et al. [21] also used binarization and skeletonization based on medial axis transform and the Canny edge detection algorithm for crack detection and measurement. Yang et al. [4] measured crack widths in pixels by using a medial axis transform for the skeletonization of cracks. Thus, representing the cracks as single-pixel wide crack representations. The use of morphological operations prior to skeletonization is a widely adopted technique in image-based concrete crack detection. Common morphological operations include thinning, edge detection, closing, opening, erosion, and dilation. This step is often applied to improve the accuracy of the results [4,19]. Other skeletonization algorithms have been proposed, such as the Hilditchs approach [22] and the 3D medial axis thinning algorithm [23,24]. However, these methods tend to be computationally demanding due to their iterative nature [4].
The majority of existing studies in the literature measure concrete crack width in pixels and do not provide a direct understanding of the extent of damage in the real world. Recent studies have explored methods for measuring concrete crack width in millimeters from images. Tomczak et al. [25] measured the change in crack width in millimeters by keeping the distance between the concrete surface and the image scanner of known resolution constant. The estimated standard uncertainty of average crack width was found to be ±0.008 mm. Ito et al. [26] attached a transparent scale to the surface of a concrete block being measured and used image processing techniques such as thresholding and sub-pixel interpolation for crack width measurement in millimeters. Peng et al. [6] were able to measure the width of cracks on images in millimeters by utilizing a rangefinder and three laser points projected onto the measured surface, which were used to calculate the corrected angle of the measured plane, . Peng et al. [6] then used the corrected angle of the measured plane in Equation (1) to find the ratio of actual width and pixel width ().
where is distance, is the focal length, is the longest dimension of the image sensor, and is the number of pixels along the long side of the image sensor.
Li and Zhao [13] measured the maximum crack width using the Euclidean distance transform and the least squares principle. The maximum crack width was measured in millimeters by using the relation between pixel distance and real distance, acquired using a laser range finder, camera field of view, and camera distance to the surface. Kim et al. [19] and Kim and Cho [27] converted the crack widths measured in pixels to millimeters by using the camera pinhole model [28], as shown in Equation (2).
where is the real crack width in millimeters, is the camera resolution, is the crack width in pixels, is the working distance in mm, is the pixels per centimeter of the camera and is the focal length of the camera in mm.
Jeong et al. [29] used Otsu image processing to measure crack width in pixels. The crack width was converted to millimeters using a proposed equation shown in Equation (3).
where is the crack width in millimeters, is the ground sample distance, is the number of measured pixels, is the working distance, is the focal length, is the horizontal dimensions of the sensor, is the horizontal or vertical resolution values in pixels of the sensor.
Previous methods for measuring concrete crack width are effective, but they are not without limitations. The need for knowledge of key parameters such as the camera properties such as resolution and focal length has a direct impact on accuracy. The use of incorrect parameters can lead to inaccurate measurements. Other methods face limitations, such as the requirement for markers or scales to be attached to the measured surface. These methods pose significant safety hazards in areas of low accessibility.
The aim of this paper is to overcome these limitations by developing a novel concrete crack width measurement method. This is achieved by proposing an affordable and highly flexible approach that utilizes laser beam and image processing algorithms. The crack width is measured in millimeters without the need to know any camera parameters or the need to attach markers or scales to the structure. The effectiveness of this approach is demonstrated through a laboratory experiment and images captured in the real world. The advantages of this method include its ease of application, promotion of safer inspections in hazardous cases, and the ability to measure crack width in millimeters. This method will allow inspectors to interpret results and compare them to allowable limits in international guidelines and codes typically stated in SI or metric units.
2. Materials and Methods
2.1. Overview of Proposed Method
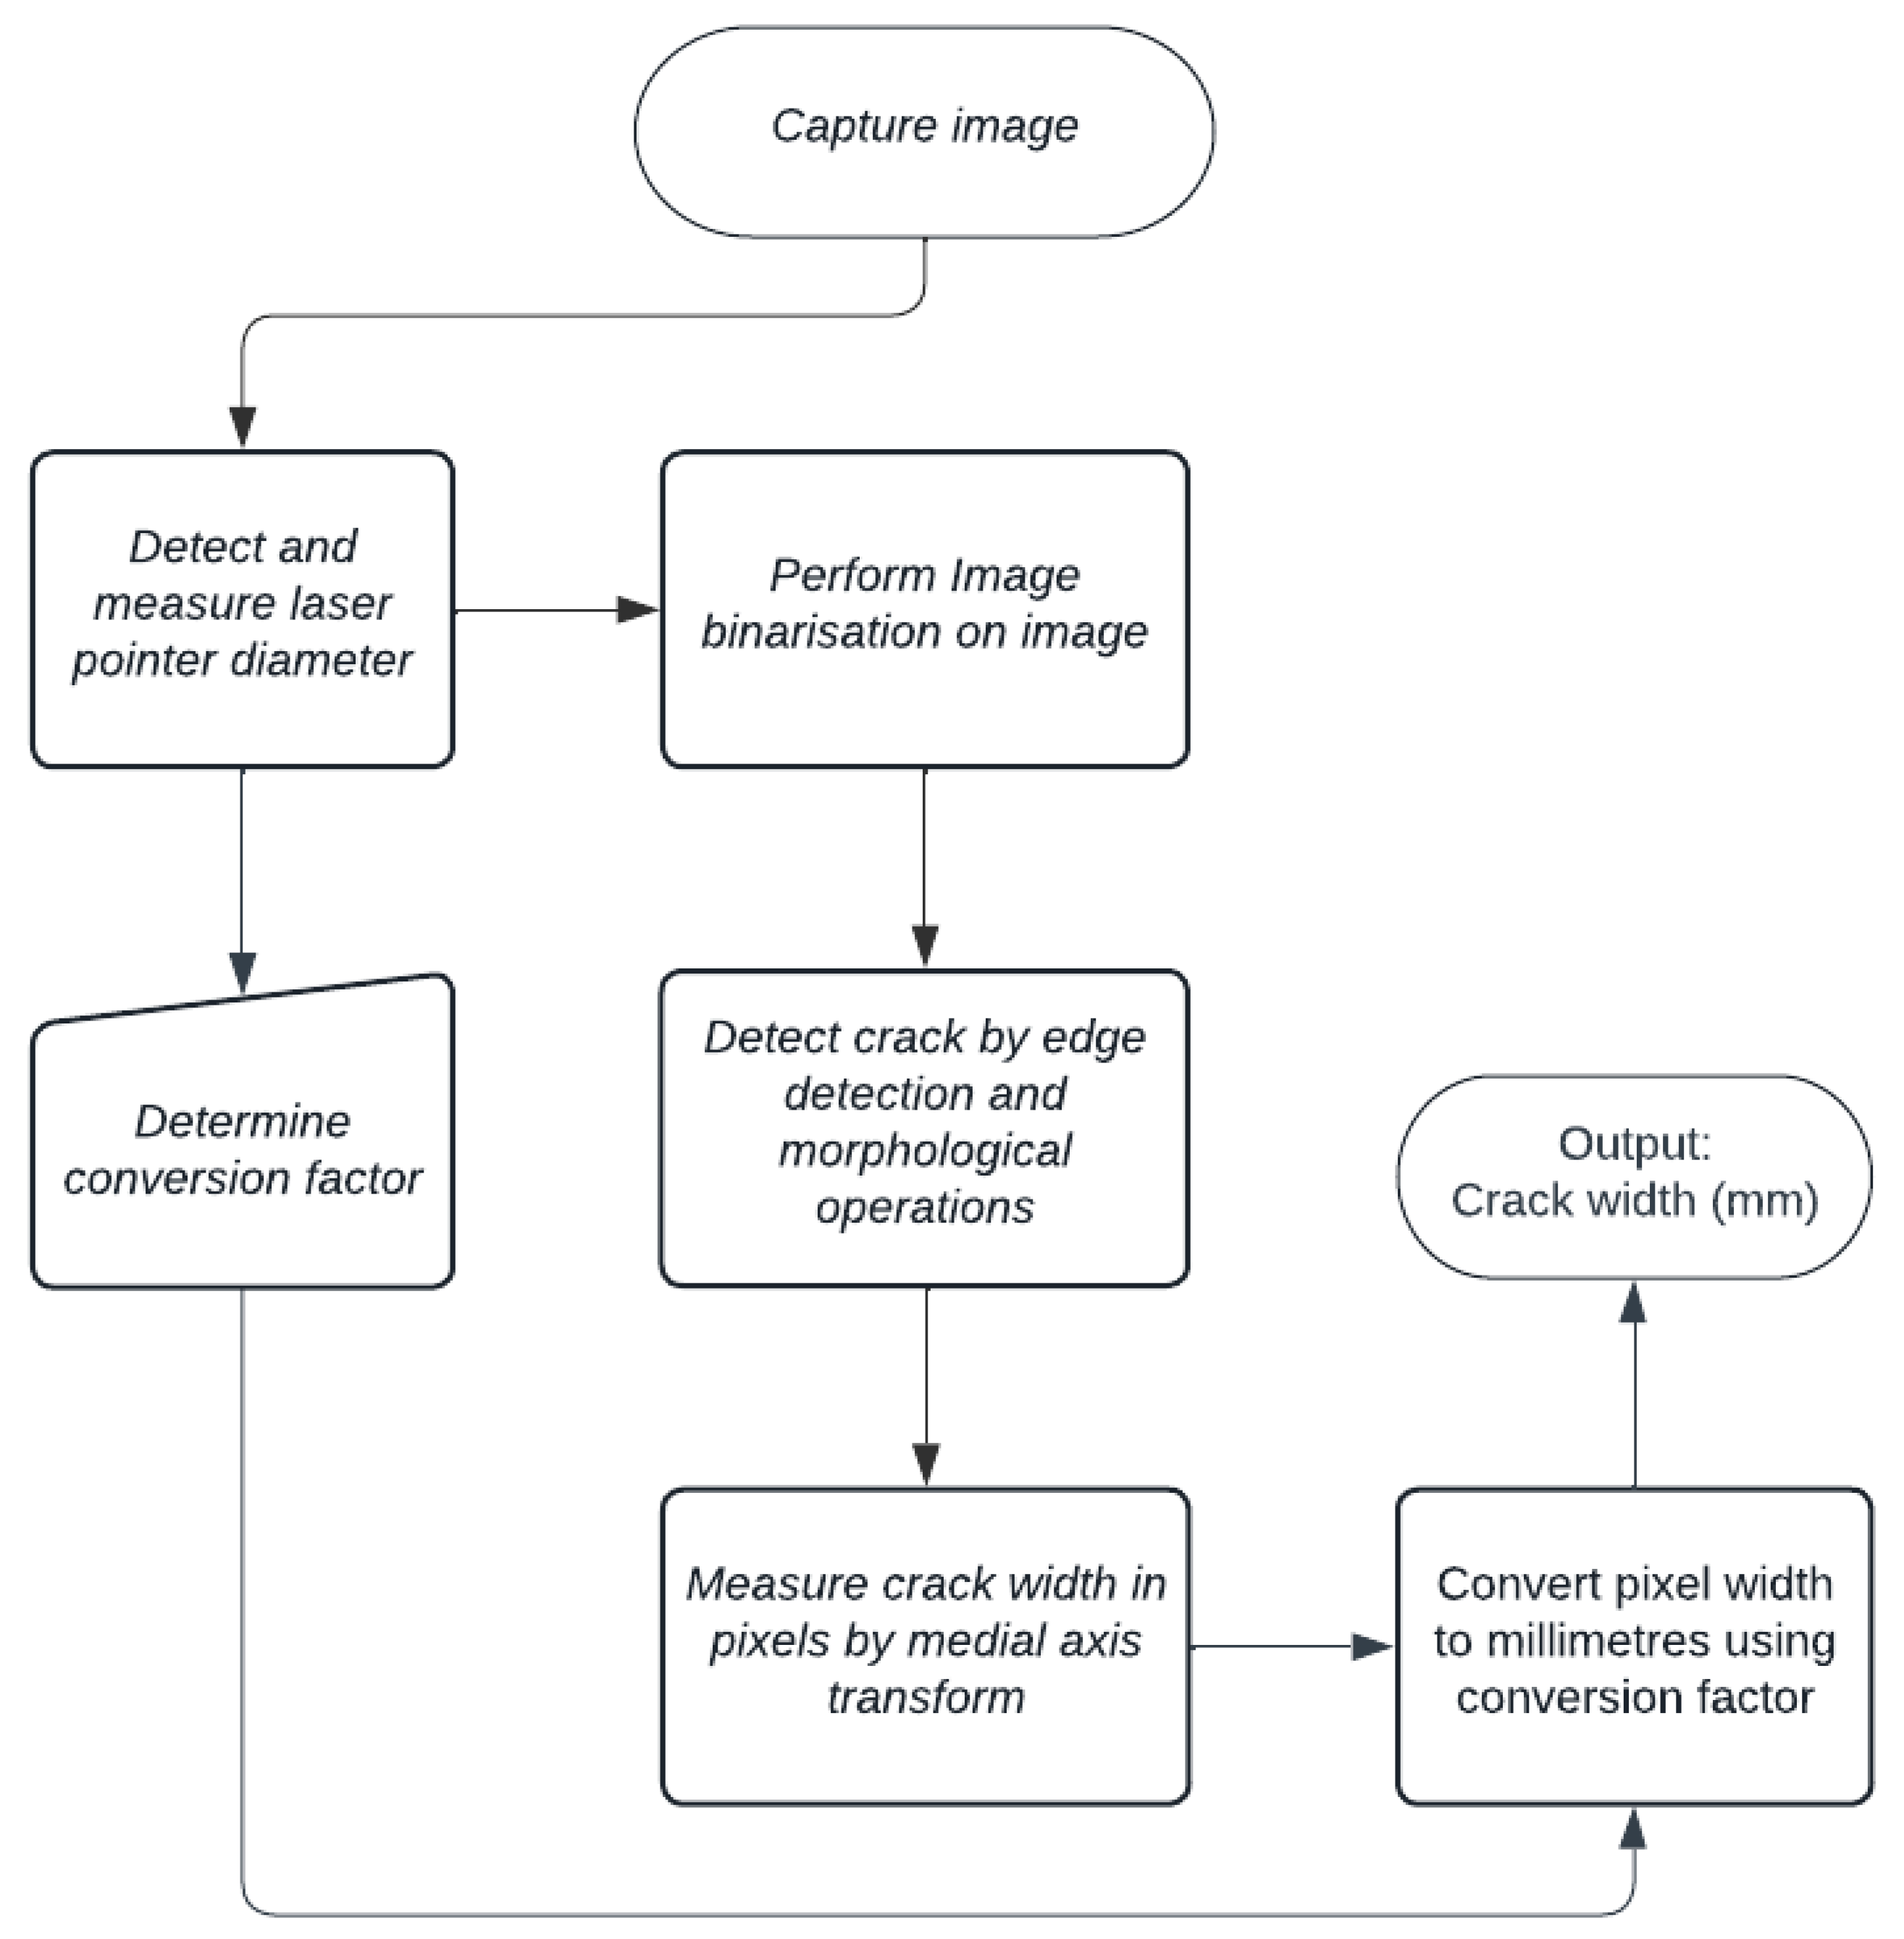
The proposed crack width measuring technique uses a laser beam and image processing algorithms to accurately measure concrete crack widths in millimeters. An overview of the proposed method is illustrated in the flow chart shown in Figure 1. The steps involved in the crack width measurement process, such as image acquisition, crack segmentation, morphological operations, and skeletonization, are presented in the subsequent sections.
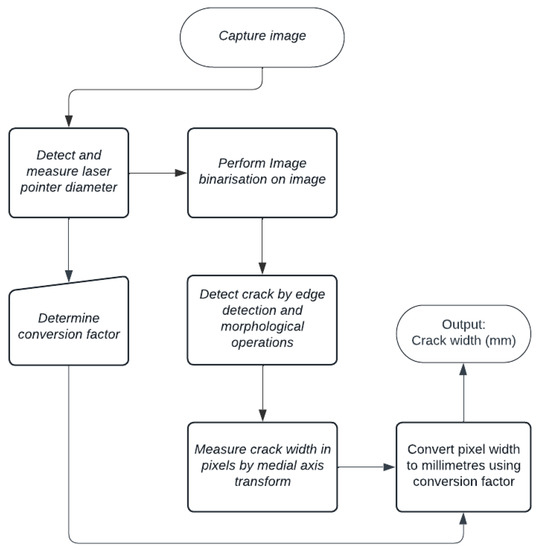
Figure 1.
Flowchart showing the crack width measurement process.
2.2. Determining the Pixel to Millimeter Conversion Factor Using the Laser Beam
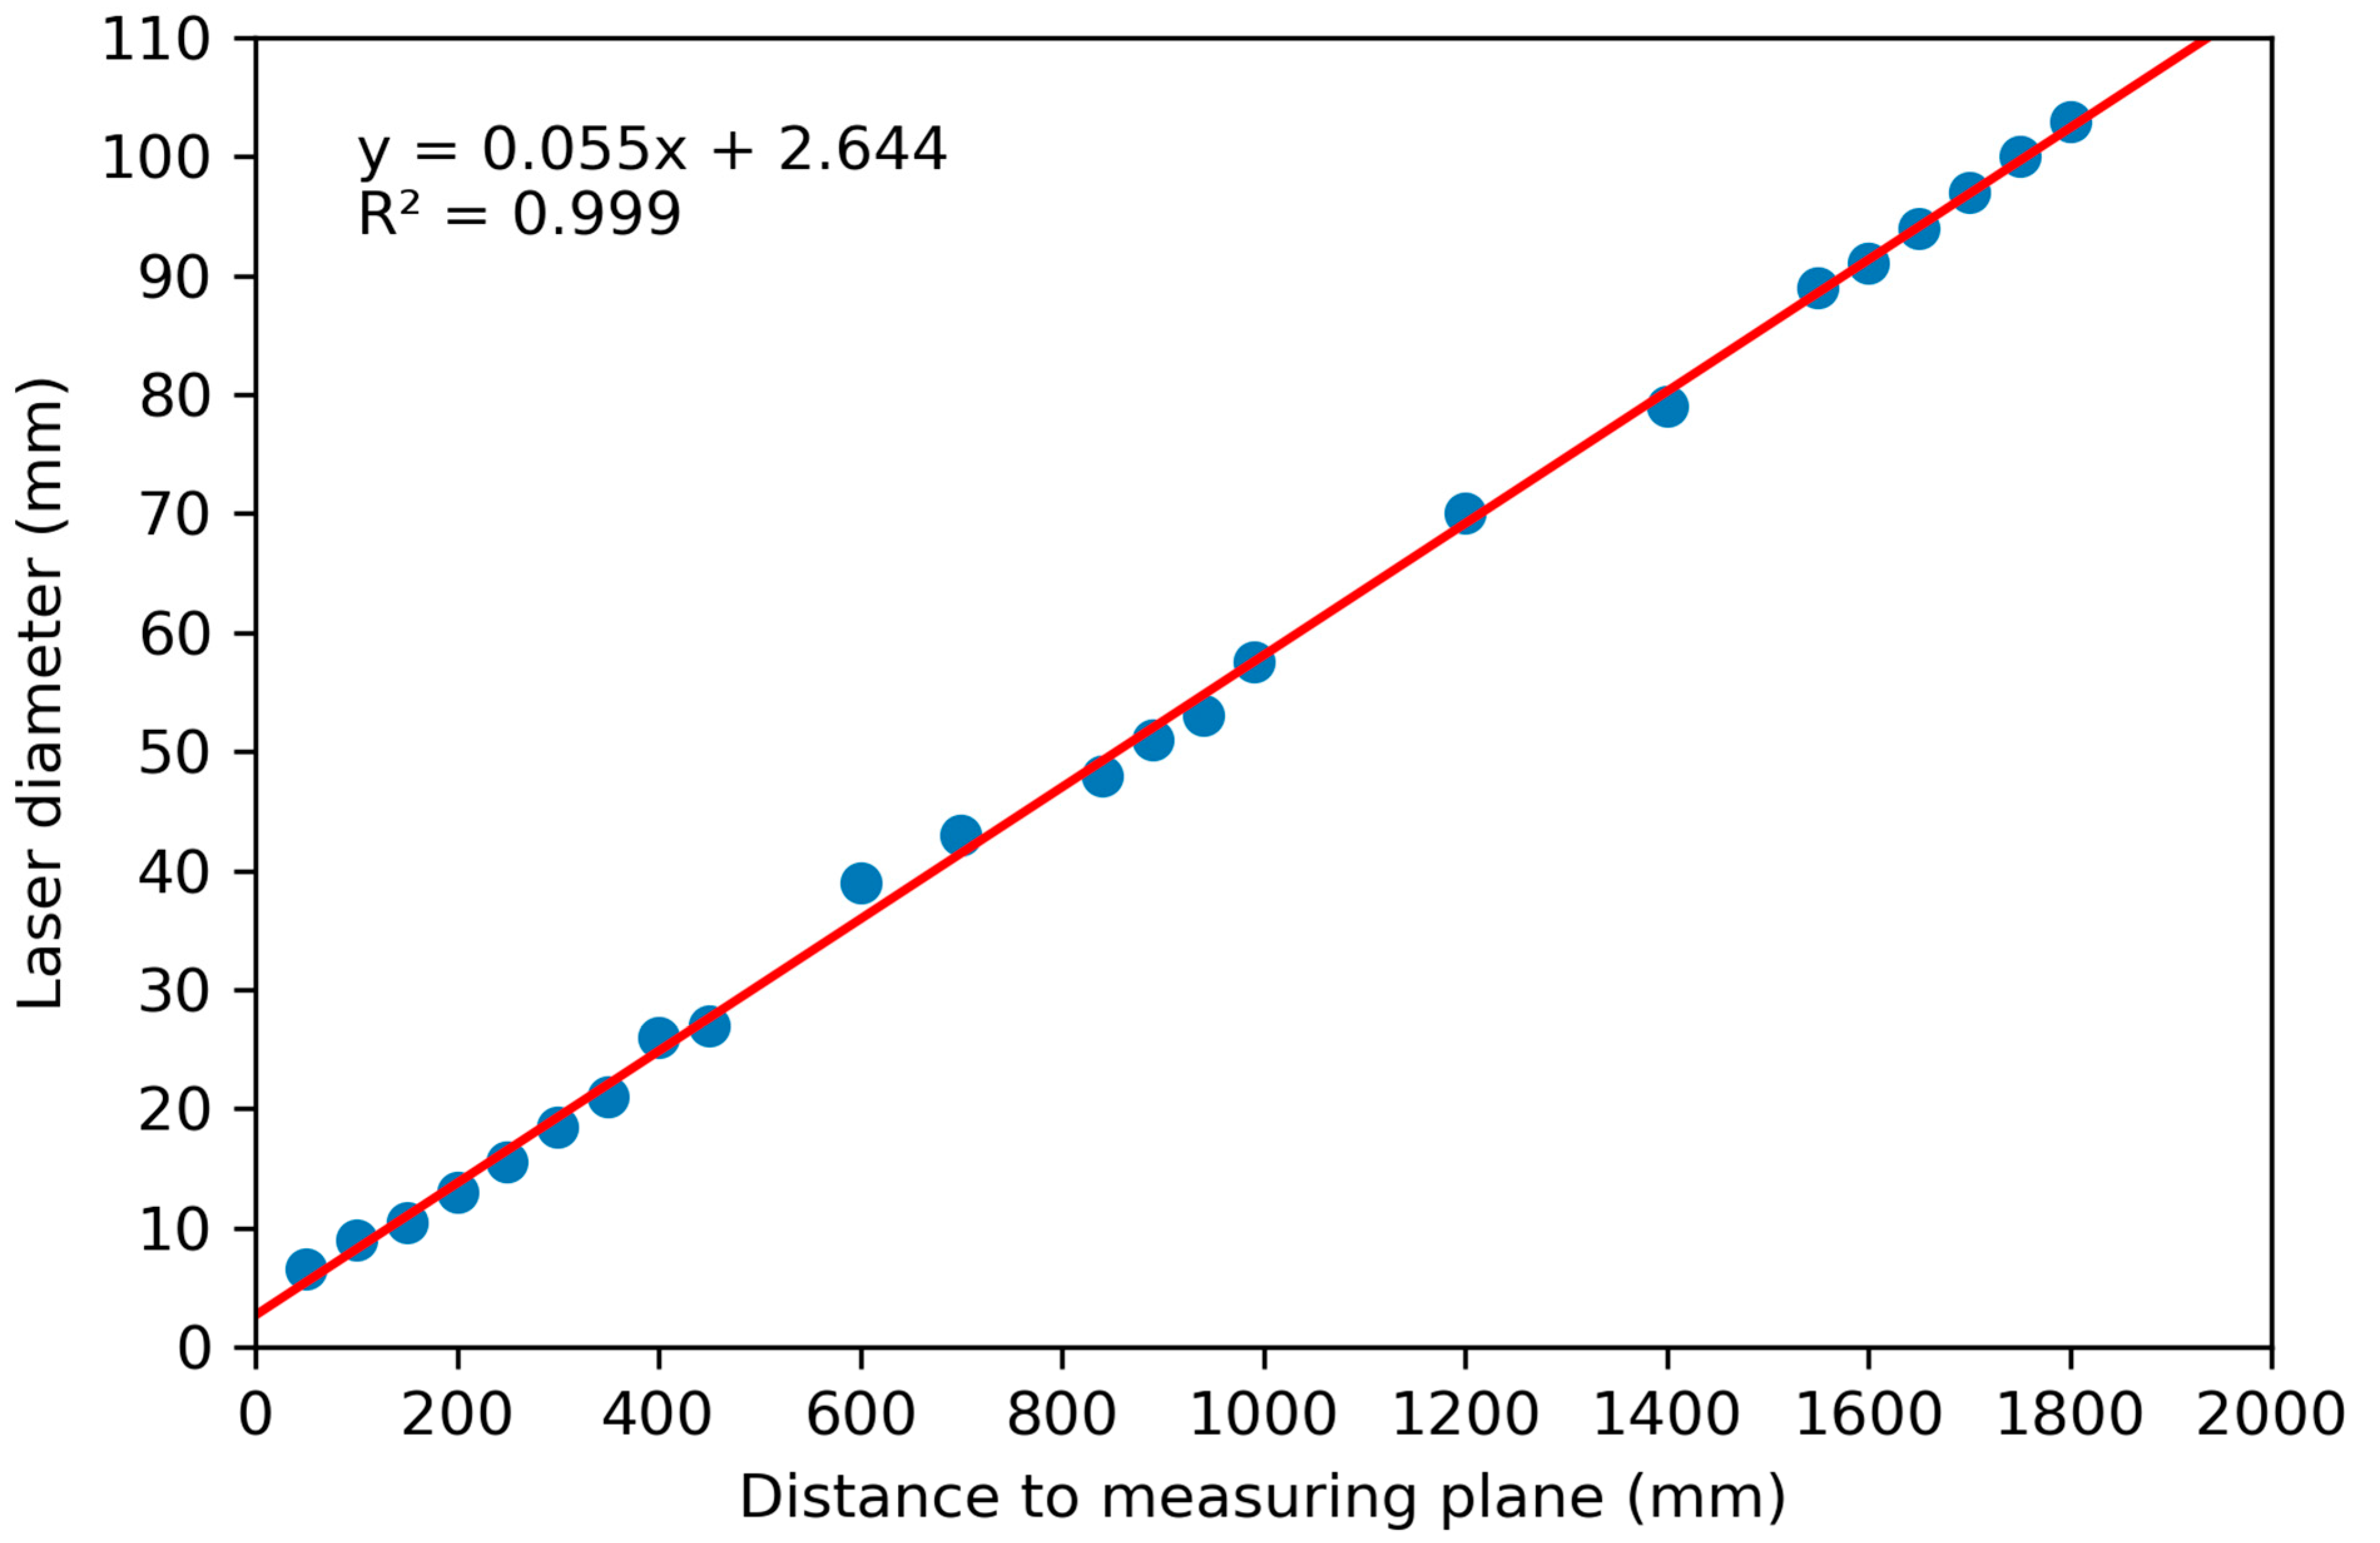
The laser beam is a key factor in the ability of the proposed method to accurately measure concrete crack width in millimeters. A circular laser beam was chosen because it is easier to detect and measure its diameter more accurately using image processing algorithms. Prior to crack width measurement, the relationship between the laser diameter and the distance to the measuring plane was first established. Knowledge of this relationship is essential because the diameter of the laser beam projected onto the measuring plane changes with distance. Understanding the behavior of this change in diameter allowed the calculation of a conversion factor, . The conversion factor converts concrete crack widths from pixels to millimeters. An indoor experiment was conducted to establish this relationship. A camera with an attached laser was placed at varying distances from the measured plane, ranging from 50 mm to 1800 mm. The distance and diameter of the laser beam were recorded for each instance and plotted, as shown in Figure 2. The relationship between the diameter of the laser beam and the distance to the measured plane was found to be directly proportional. The relationship is defined by Equation (4).
where is the actual diameter of the laser in millimeters, and is the distance to the measuring plane in millimeters.
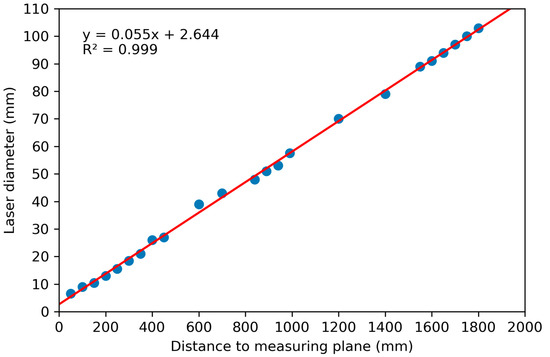
Figure 2.
Relationship between distance to measuring plane and laser beam diameter.
Using this relationship, in conjunction with the diameter of the laser beam measured in pixels, the conversion factor, , is defined by Equation (5).
where is the conversion factor, is the actual diameter of the laser in millimeters and is the diameter of the laser in the image measured in pixels.
2.3. Image Acquisition
In order to develop and validate the proposed crack width measurement method, reinforced concrete beams were subjected to four-point bending loading until failure in the laboratory. The width of the cracks on the beams was manually measured in millimeters. Images of the cracks were captured using two different image acquisition devices. The first device was an iPhone 11 Pro Max smartphone equipped with a 12 mega-pixel f/1.8 aperture wide lens. The second device was a Trust webcam with a resolution of 640 × 480 pixels. The reason for choosing these two devices was their difference in image resolution, with the iPhone producing high-quality images while the Trust webcam produced low-quality images. The distance at which some of the images were captured is shown in Table 1, along with details of the image acquisition devices. This measurement and acquisition process was repeated on cracks in buildings for validation purposes.

Table 1.
Some of the images of cracks were captured using two different devices.
2.4. Image Processing
Image processing algorithms were applied to the captured images using Python. Libraries such as NumPy, and Matplotlib were used, but the main library used for the image processing was the Open Computer Vision (OpenCV) Library [30].
Before the crack width could be measured, it was necessary to pre-process the images. Image processing was carried out in two stages: (1) detecting the laser beam in the image and measuring its pixel diameter and (2) further image processing to segment cracks and measure their respective crack widths. The steps taken in carrying out these operations are briefly explained below:
- Cropping: The images were cropped based on the region of interest, which was the area with the crack pattern that was to be measured. This was conducted to remove unnecessary information from the image that might affect the accuracy of measurements or lead to increased computation costs.
- Laser beam detection and diameter measurement: In order to detect the presence of the laser beam in the images captured in the laboratory and in the field, a color filtering technique was used to isolate the color red in the image. The projected laser beam was red in color, as shown in Figure 3a. The color filtering approach allowed for red pixels in the image to be identified, as shown in Figure 3b. Hough Circle Transform, a technique commonly used in computer vision for the task of circle detection, was then applied to the filtered image. Hough Circle Transform is defined by Equation (6) and detects circles by searching for points () in the image that satisfy Equation (6) for a given set of values of () and . Figure 3c shows the detected circle and the center of the circle.
 Figure 3. (a) Original image; (b) color filtered image (c) grayscale image with laser detected and center marked.The radius of the detected circle can then be used to determine the diameter of the circle in pixels, , which is inputted into Equation (5), enabling the conversion factor, , to be calculated. This specific approach was chosen because the Hough Circle Transform is a well-established method for detecting circular shapes in images, and it has been widely used in various applications [8,31,32,33]. Additionally, filtering out the color red was the most effective approach in eliminating the chance of other objects that might resemble circles from being falsely detected.
 - BGR to grayscale conversion: Images are made up of thousands of pixels, which are typically represented by three color components; red (R), green (G), and blue (B), commonly referred to as RGB. Each pixel has an R, G, and B value between 0 and 255. However, OpenCV reads images in BGR format. Converting the images from BGR to Grayscale simplifies the representation of the pixels into a single value between 0 (black) and 255 (white). The BGR images are converted to grayscale by Equation (7).
- Edge detection and morphological operations: Some of the images containing text on the surface needed removal of the text, as it could easily be mistaken for a crack. The image’s noise was reduced through image filters to improve the visibility of the cracks. These filters were chosen because they are effective in removing noise while preserving the edges of the cracks. The specific parameter values for the filters were chosen through trial and error to achieve the best results. The canny edge detection algorithm [34] was used to detect the cracks in the images by identifying gradient changes in the image intensity. After successful edge detection, morphological opening and closing operations were performed on the image to remove noise and fill small holes in the image. The initial kernel sizes used for each image differed and were chosen at random and fine-tuned until satisfactory results were achieved.
2.5. Crack Width Calculation
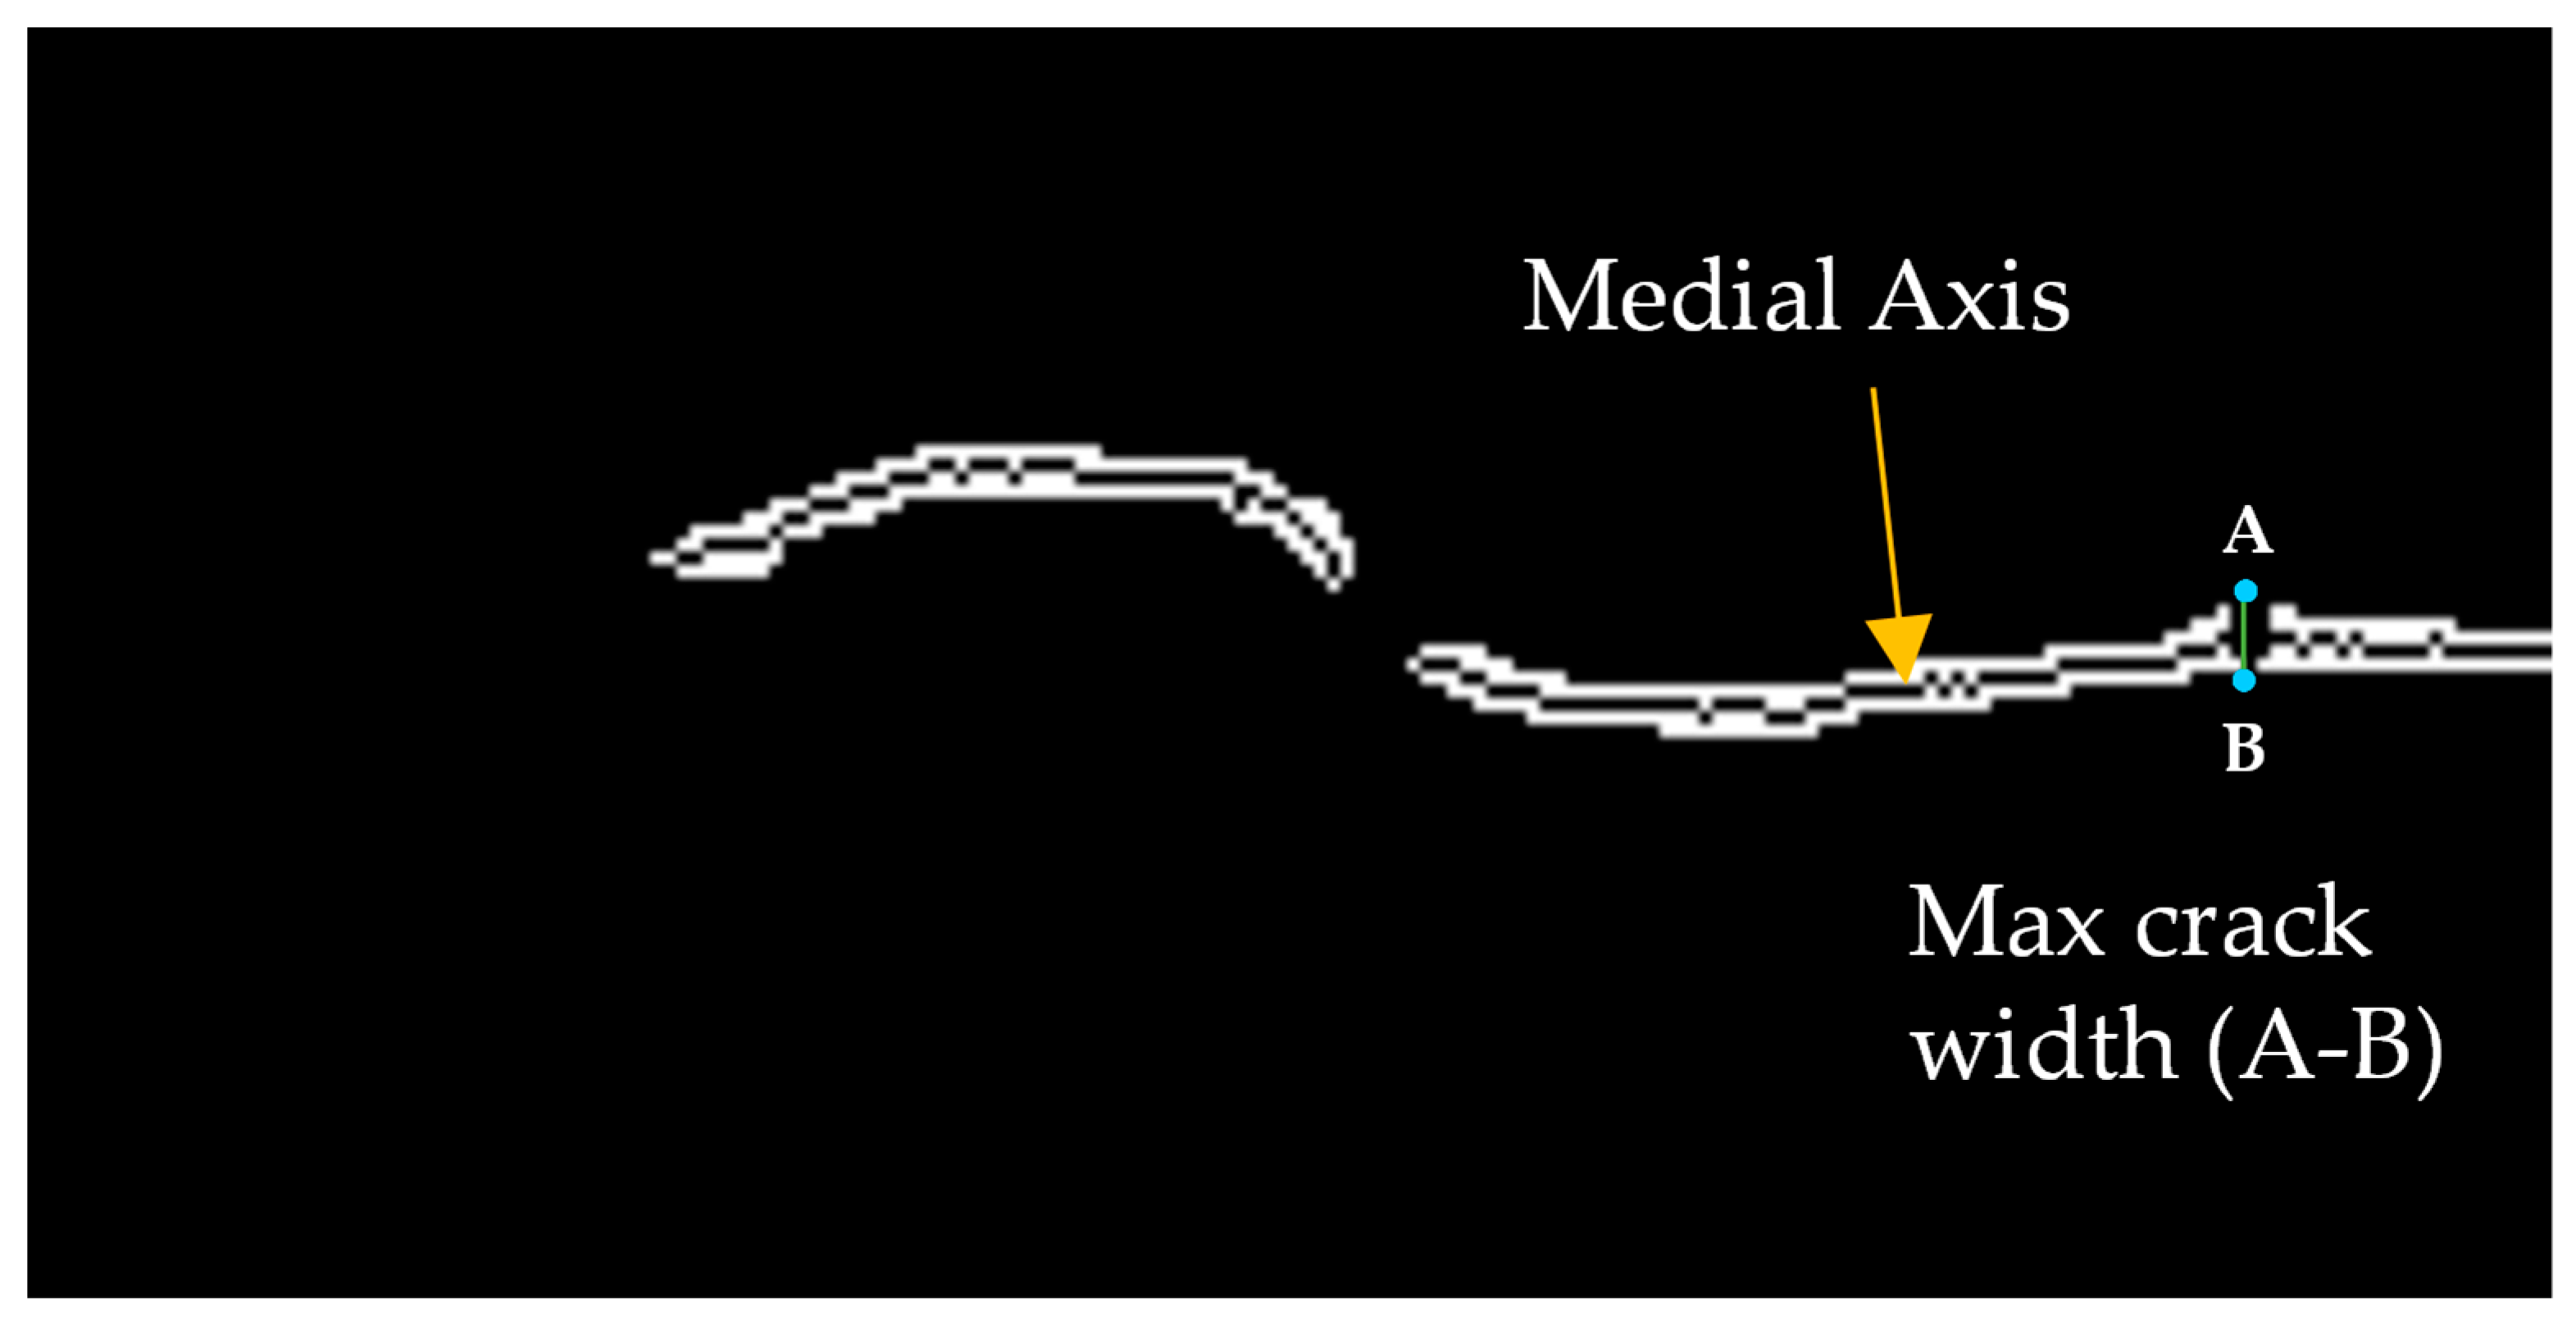
The images resulting from the image processing step are then further processed by skeletonization of the crack. Skeletonization is conducted using a method known as medial axis transform, which converts an object shape into a single-pixel-wide representation, thus clearly outlining the crack’s topology. The maximum crack width is measured in pixels as the maximum distance from the center of the medial axis to the two edges of the crack on either side of the medial axis, as shown in Figure 4.
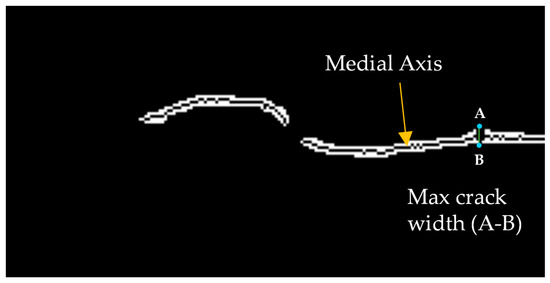
Figure 4.
Calculation of maximum crack width based on medial axis.
The medial axis is calculated by using the distance transform a technique that assigns to each pixel in the image the minimum distance to the nearest non-zero pixel. The crack width in pixels is converted to millimeters by multiplying it by the conversion factor derived in Equation (5), as shown in Equation (8).
where is the crack width in millimeters, is the crack width in pixels and is the conversion factor in (mm/pixels).
Table 2 shows a comparison of the necessary parameters required by different methods to calculate crack width in millimeters. It can be seen that the proposed method only depends on one parameter, which is the distance to the measuring plane. The distance to the measuring plane is unaffected by lens size and zooming, unlike focal length, which is used in other studies. Therefore, this promotes flexibility and higher accuracy as this minimizes accumulative error due to multiple parameters, which may not also be readily known. The proposed method allows the quick use of any available camera device to capture images with cracks.

Table 2.
Comparison of image-based crack width measurement methods.
3. Results and Discussion
This section presents and discusses the results obtained from the proposed method. The results of the crack segmentations, which were achieved through image processing techniques, are presented first. Their impact on the accuracy of crack width measurement and the overall performance of the method are then discussed. Finally, the results of the concrete crack width measurement are presented, discussed, and compared to other approaches in the literature.
3.1. Crack Segmentation
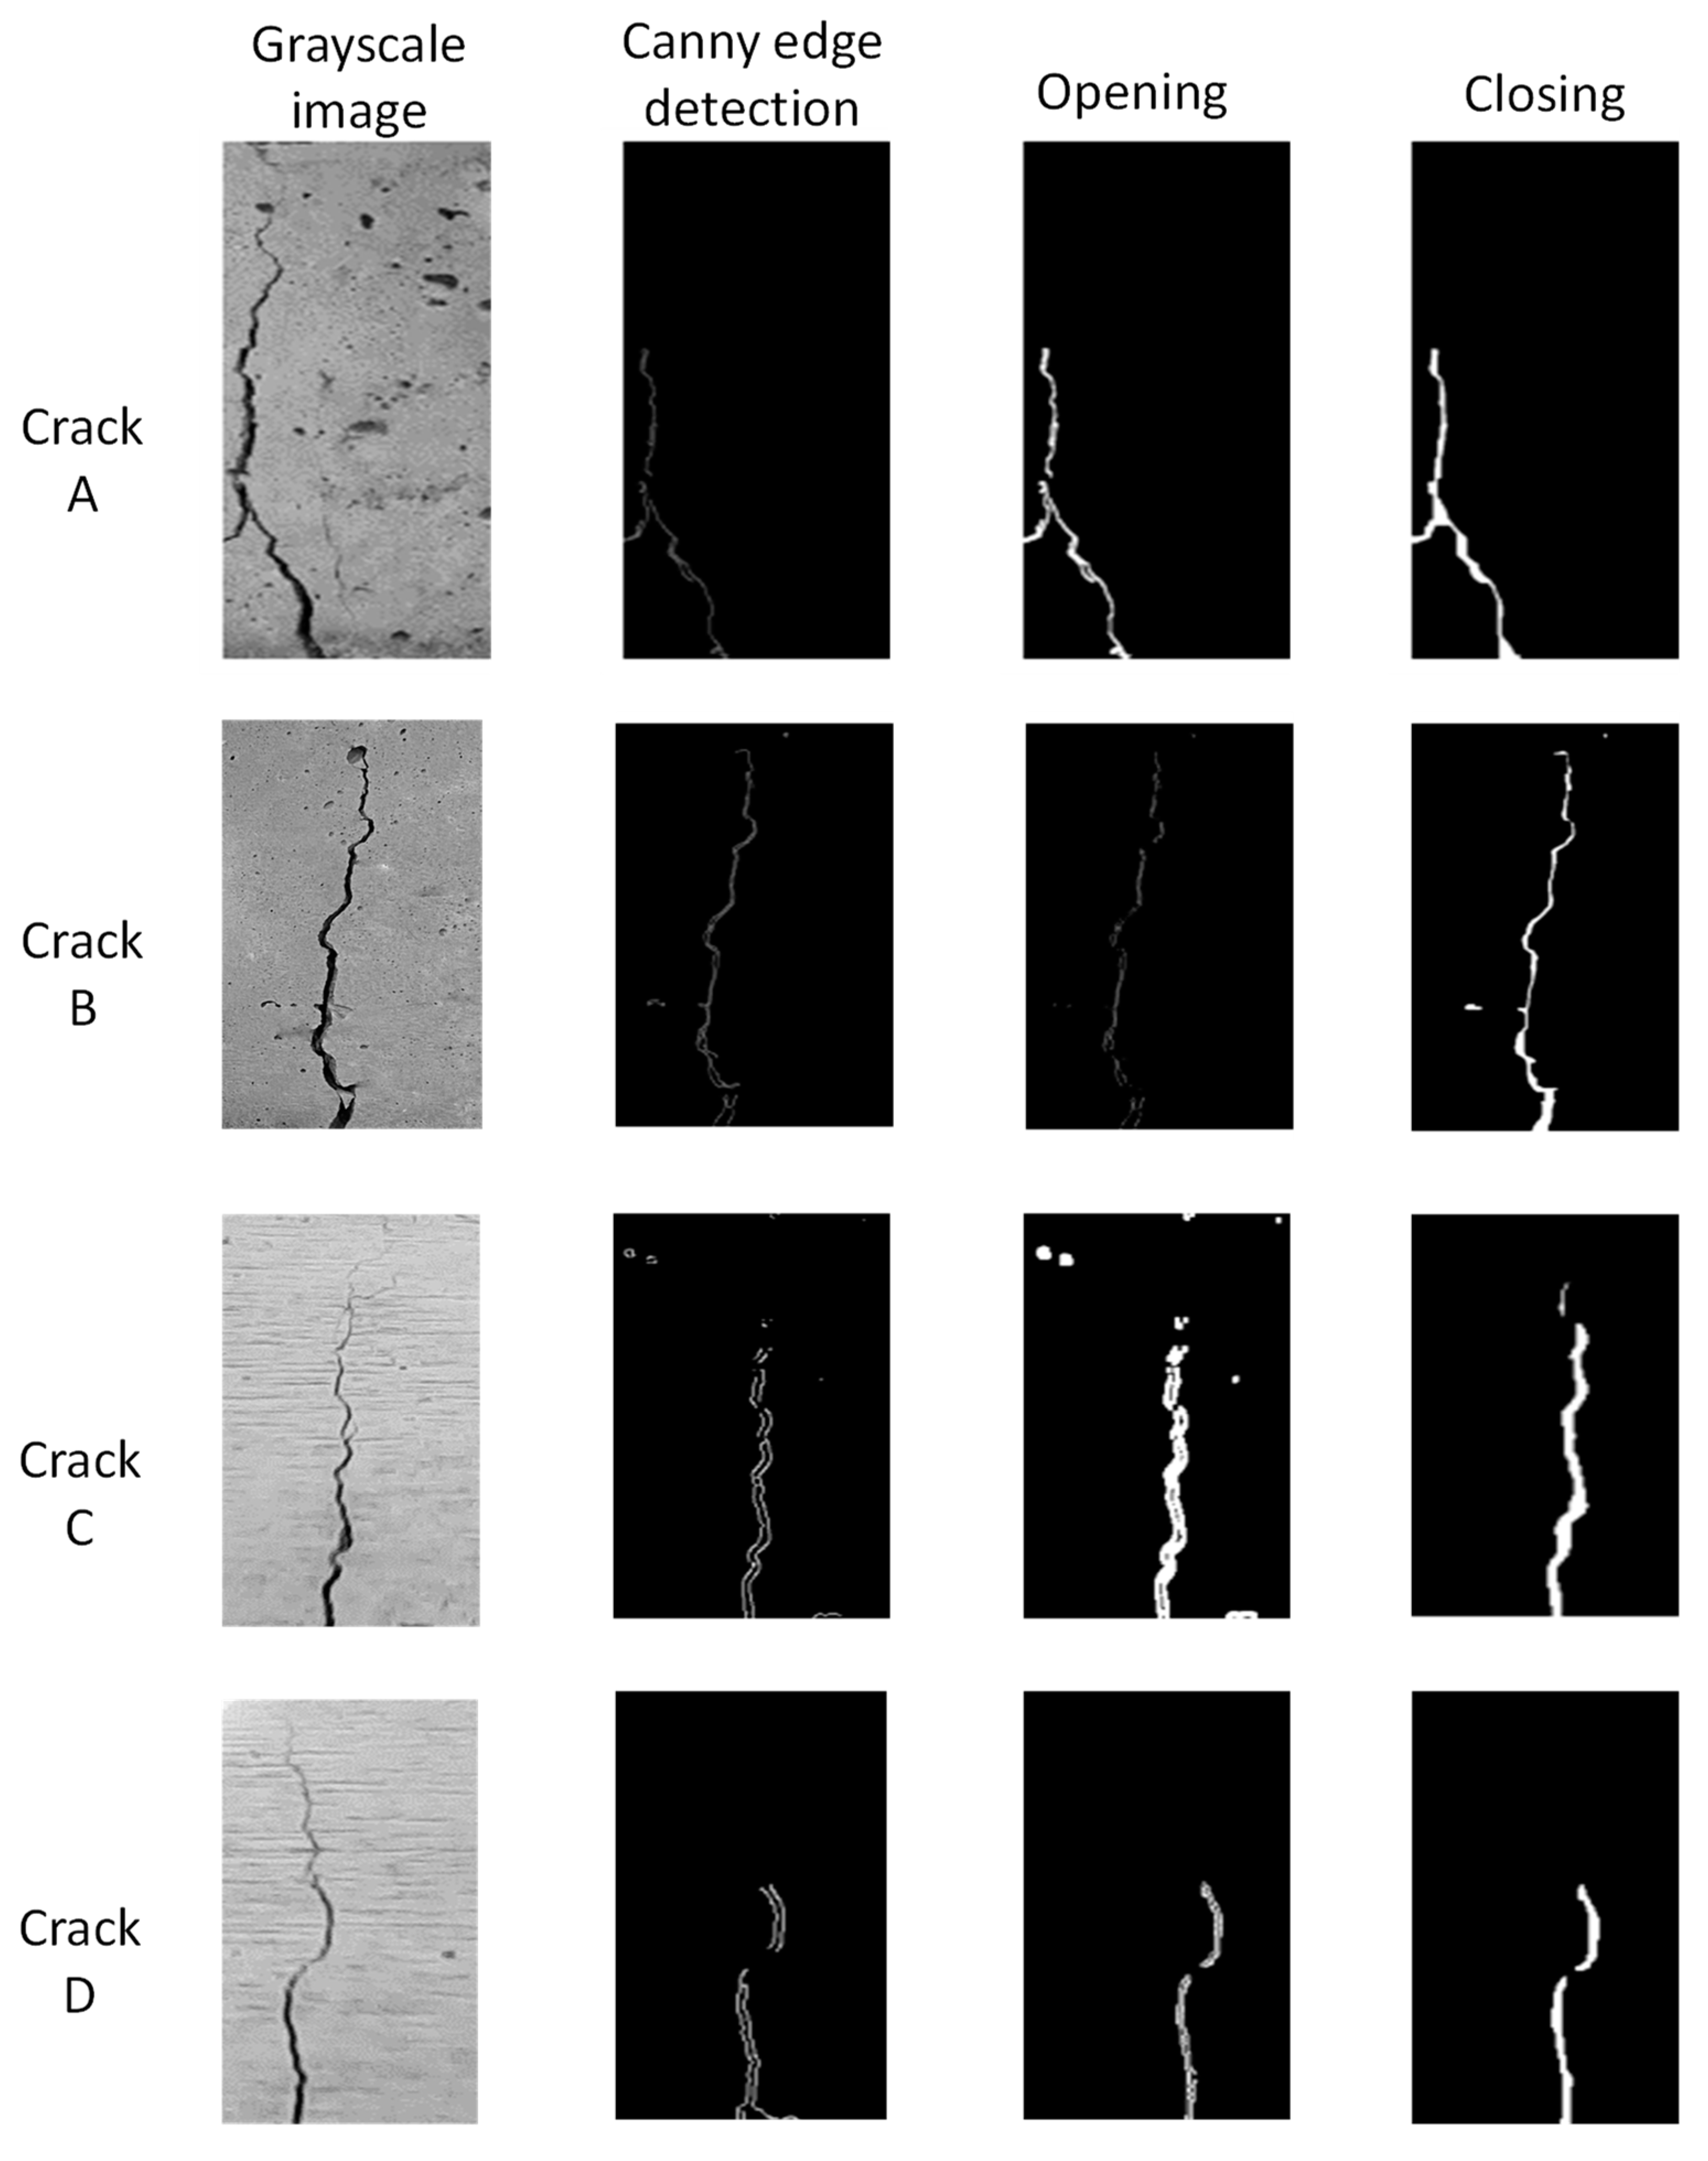
Figure 5 shows the image processing steps that were applied to the images to create a crack mask through segmentation. The crack masks, seen after the morphological closing stage, were used for the maximum crack width measurement.
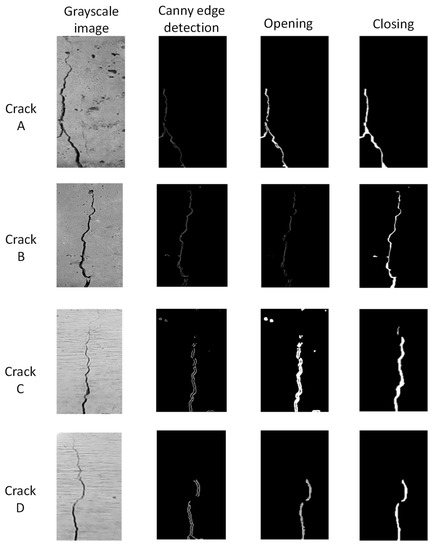
Figure 5.
Segmentation of cracks using image processing algorithms.
The proposed implementation of the image processing algorithms achieved reasonably accurate crack segmentation. The initial parameters used in the image processing algorithms were manually specified and fine-tuned until satisfactory results were achieved. The reliance on the user to specify the initial parameters means the efficiency can vary depending on the experience of the user specifying the initial parameters. Kim et al. [19] also highlighted how this could affect the overall accuracy of methods relying on manual parameter selection.
Although this study does not focus on the measurement of crack lengths, it can be seen from Figure 5 that the lengths of cracks A, C, and D are shorter than before segmentation. Crack A and crack D were the most affected, followed by crack C. Crack B retained its length even after segmentation. This is a common problem. Kim et al. [19] found there to be a conflict between obtaining high accuracy for both crack width and crack length and, as a result, proposed a hybrid method [19]. There are several factors that generally lead to this when using image processing algorithms for segmentation, such as image quality, lighting conditions, and distance from the surface [5,35]. These factors also have a direct effect on the accuracy of crack width measurement.
3.2. Maximum Crack Width Measurement
The proposed method was validated on a total of eight images with cracks, four of which were captured indoors in a laboratory, while the other four were captured outdoors on a sunny day. Table 3 presents the results of the maximum crack width measurements obtained from the images.

Table 3.
Measured maximum crack widths.
3.2.1. Accuracy
It can be observed from Table 3 that the method was capable of measuring crack widths as small as 0.85 mm, as observed with crack E. The overall performance of the method by calculating the mean absolute error (MAE) by taking a summation of the absolute errors and dividing it by the number of measured cracks. The MAE was found to be 0.26 mm; this means that, on average, our method will tend to measure crack widths to a value ±0.26 mm away from the true value. Park et al. [2] also used lasers to measure maximum crack width and achieved results with errors of less than 1.5 mm. While Yang et al. [4] had a relative error of between −13.27% and 24.01%. The results are within a reasonable error margin compared to previous studies.
The smallest absolute error was observed for crack E, with a converted maximum crack width of 0.83 mm, which was an underestimation of 0.02 mm. Crack G, measured to be 5.57 mm instead of 5.00 mm, had the largest observed absolute error of 0.57 mm, which was an overestimation.
3.2.2. Effect of Distance Away from Measuring Plane
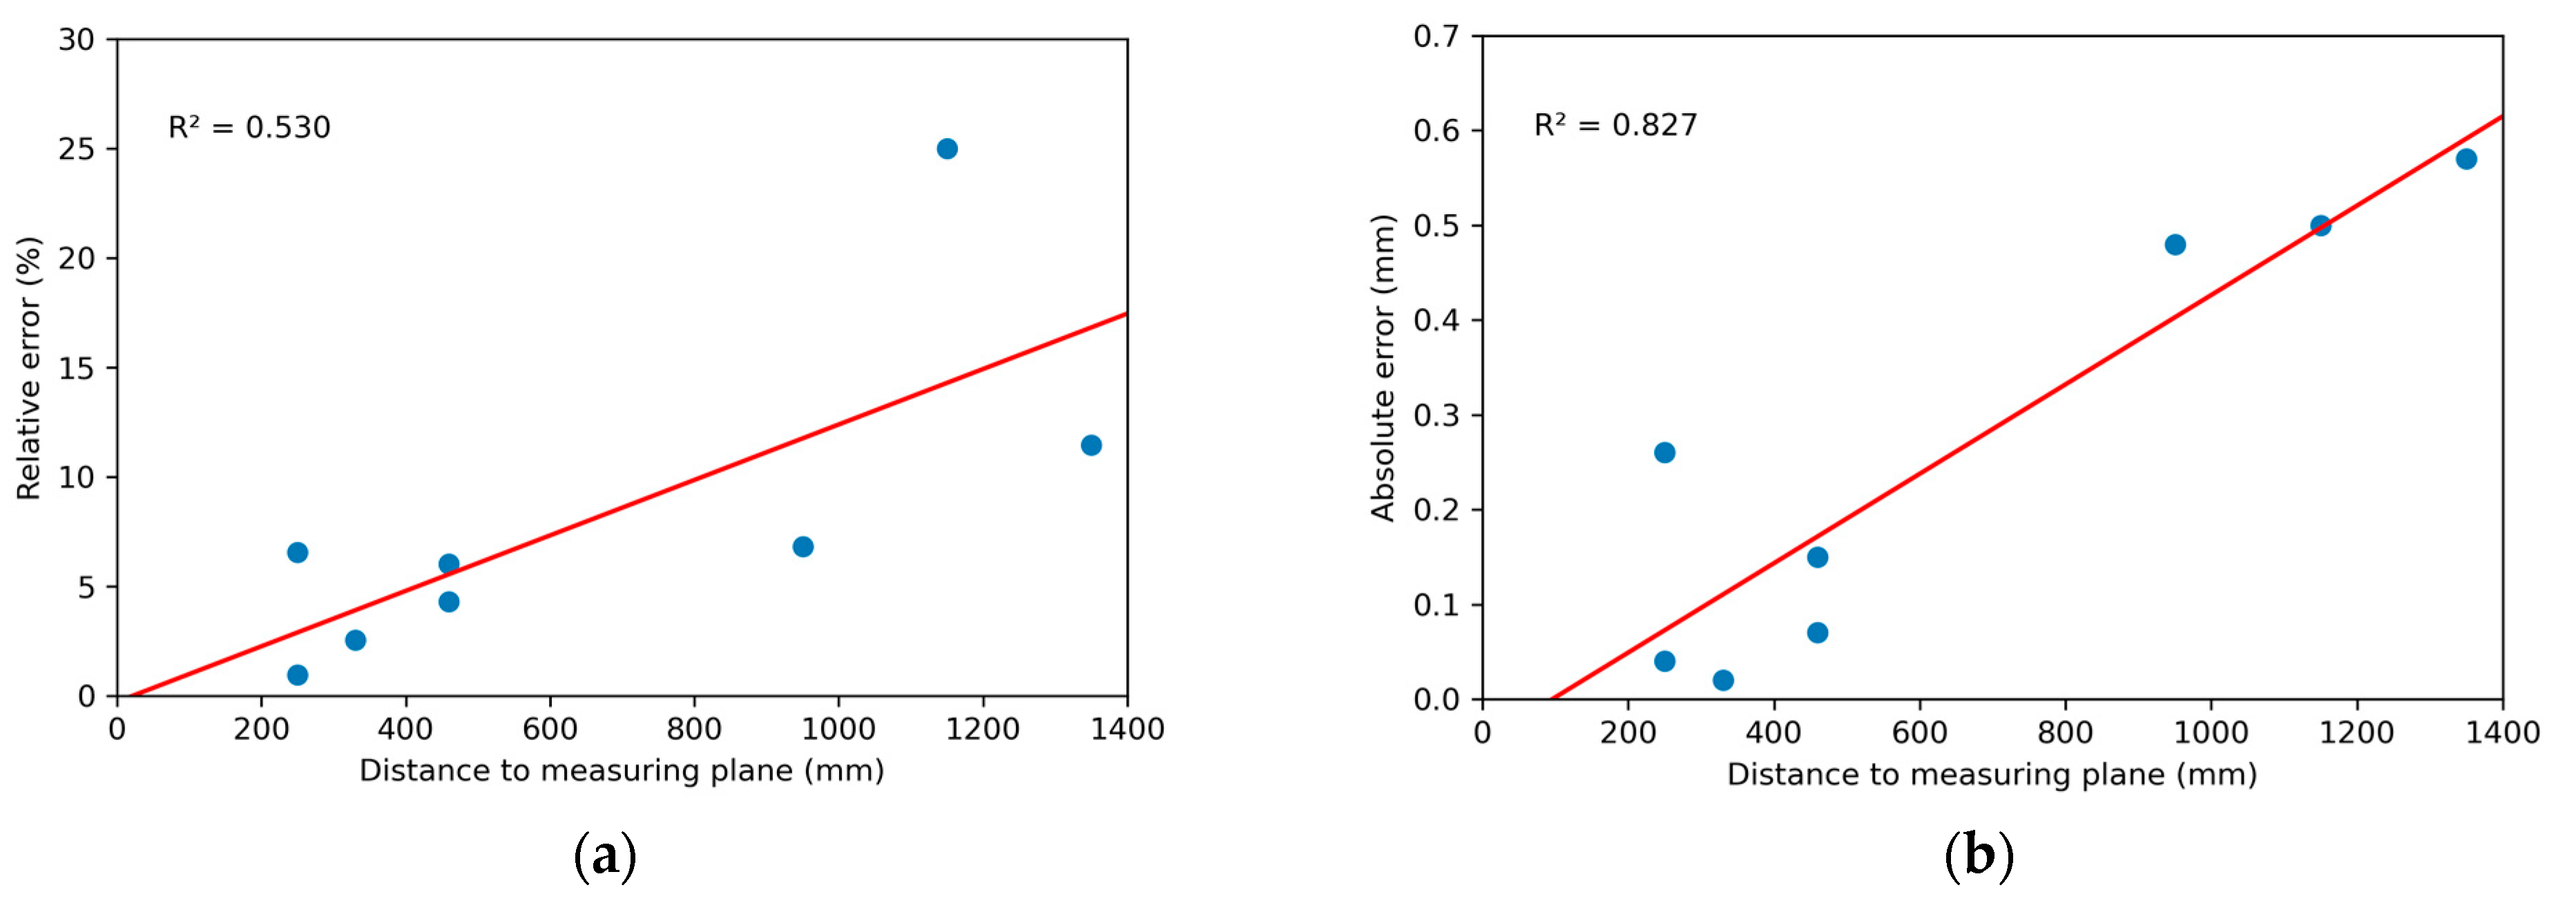
Figure 6a shows the relative error (RE) is sensitive to the distance away from the measuring surface. Crack F, captured at a distance of 1150 mm from the surface, had an RE of 25% which was higher than that of crack G, 13.5%, captured at 1350 mm. The larger error of crack F is most likely due to image processing error in the segmentation stage, more than it is due to the distance away from the surface. Figure 6b shows that the absolute error is affected by the distance to the measuring plane. The R2 value of 0.827 shows that the absolute error is highly dependent on the distance to the measuring plane. The high level of variability can be explained by other factors that can affect the accuracy of the proposed method, such as the camera quality and parameter selection in segmentation processing. If a camera of low resolution is used, there will be an increase in errors with an increase in the distance away from the surface increases, especially for smaller cracks. This is in line with the study by Kim et al. [23] that found when measuring smaller crack widths, larger errors can be expected.
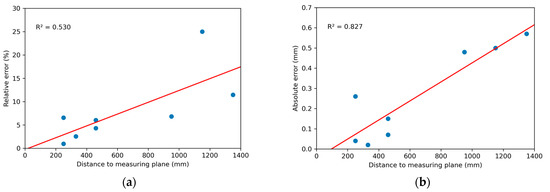
Figure 6.
(a) Effect of distance to measuring plane on the relative error; (b) Effect of distance to measuring plane on the absolute error.
3.2.3. Performance in Outdoor Scenarios
To evaluate the method’s suitability for use in outdoor scenarios, images for crack E to crack H were captured outside on a sunny day, as shown in Figure 7. The yellow bounding boxes in the images show how the images were cropped to focus on the critical regions that need measuring. Cropping or resizing an image does not affect the accuracy of the laser measurement method if the distance from the camera to the measurement surface is known. The proposed method in this study only requires knowledge of the camera-to-surface distance and uses image processing techniques to calculate other necessary parameters. This makes it usable with any camera without the need to know its specifications, unlike other methods [6,19] that require additional information such as focal length and the number of pixels. It can be seen from Table 3 that the proposed method achieves results of low absolute error and low mean relative error even for outdoor scenarios. The MAE for cracks measured indoors was 0.13 mm, while the MAE for cracks measured outdoors was 0.39 mm. Maximum crack widths measured on images captured outdoors had higher MAE mainly because the images captured outdoors were captured from long distances away from the surface being measured. The absolute error increases as the distance away from the measuring plane increases, as shown in Figure 6b.

Figure 7.
Application of the laser method in outdoor scenarios.
The conversion factor developed using the laser beam is effective in converting the results of the maximum crack width from pixels to millimeters. We achieved this by attaching a laser to the image acquisition devices. Kim et al. [36] measured crack width in millimeters by using planer markers which needed to be physically attached to the surface being measured. Good results with a 1–2% relative error were achieved. However, the attachment of markers to structures with low accessibility poses a safety hazard. The proposed method does not require any physical attachment of markers onto the surface of the structure being measured and thus promoting safety. The laser is easily attachable to any image acquisition device; attaching it to an unmanned aerial vehicle will promote safer inspections of structures.
4. Conclusions and Recommendations
This paper presented a novel method for measuring crack width in millimeters using image processing algorithms coupled with a unique laser beam technique. The main contribution of this method is the use of the laser beam projected onto the measuring surface to allow for the conversion of the crack width measured in pixels to millimeters. The following conclusions can be drawn from the study:
- The relationship between the distance to the measurement plane and the diameter of the laser beam is well established.
- The conversion factor, αc, is defined and can be obtained using the established relationship between the distance to the plane of the measurement and the laser beam diameter, in conjunction with the laser beam diameter in pixels resulting from image processing algorithms.
- A unique method for determining the width of concrete cracks in millimeters has been devised using a laser beam and image processing algorithms through the conversion factor.
- The developed method is innovative and produced highly accurate findings that were closely in agreement with the actual crack width.
- The outcomes obtained through this method are suitable for verifying compliance with the allowable limits established in international standards, which are commonly expressed in metric or SI units.
It is expected further work could maximize the effective use of the developed method, such as expanding the image database for refined deep learning for the binarization and segmentation process and acquiring images by attaching the laser to a drone with cameras. Moreover, it is highly desirable to automate the process of performing calculations and crack segmentations on acquired images.
Author Contributions
Conceptualization, M.A.N., J.B. and I.D.W.; methodology, M.A.N., J.B. and I.D.W.; software, M.A.N.; validation, J.B. and I.D.W.; investigation, M.A.N.; resources, J.B.; data curation, M.A.N.; writing—original draft preparation, M.A.N.; writing—review and editing, J.B. and I.D.W.; visualization, M.A.N.; supervision, J.B. and I.D.W.; project administration, J.B. and I.D.W.; funding acquisition, J.B. All authors have read and agreed to the published version of the manuscript.
Funding
This research received no external funding.
Institutional Review Board Statement
Not applicable.
Informed Consent Statement
Not applicable.
Data Availability Statement
Not applicable.
Conflicts of Interest
The authors declare no conflict of interest.
References
- Choudhary, G.K.; Dey, S. Crack Detection in Concrete Surfaces Using Image Processing, Fuzzy Logic, and Neural Networks. In Proceedings of the 2012 IEEE 5th International Conference on Advanced Computational Intelligence, ICACI 2012, Nanjing, China, 18–20 October 2012; pp. 404–411. [Google Scholar] [CrossRef]
- Park, S.E.; Eem, S.H.; Jeon, H. Concrete Crack Detection and Quantification Using Deep Learning and Structured Light. Constr. Build. Mater. 2020, 252, 119096. [Google Scholar] [CrossRef]
- Chen, J.; Xiong, F.; Zhu, Y.; Yan, H. A Crack Detection Method for Underwater Concrete Structures Using Sensing-Heating System with Porous Casing. Measurement 2020, 168, 108332. [Google Scholar] [CrossRef]
- Yang, X.; Li, H.; Yu, Y.; Luo, X.; Huang, T.; Yang, X. Automatic Pixel-Level Crack Detection and Measurement Using Fully Convolutional Network. Comput.-Aided Civ. Infrastruct. Eng. 2018, 33, 1090–1109. [Google Scholar] [CrossRef]
- Munawar, H.S.; Hammad, A.W.A.; Haddad, A.; Soares, C.A.P.; Waller, S.T. Image-Based Crack Detection Methods: A Review. Infrastructures 2021, 6, 115. [Google Scholar] [CrossRef]
- Peng, X.; Zhong, X.; Zhao, C.; Chen, A.; Zhang, T. A UAV-Based Machine Vision Method for Bridge Crack Recognition and Width Quantification through Hybrid Feature Learning. Constr. Build. Mater. 2021, 299, 123896. [Google Scholar] [CrossRef]
- Carrasco, M.; Araya-letelier, G.; Velázquez, R.; Visconti, P. Image-Based Automated Width Measurement of Surface Cracking. Sensors 2021, 21, 7534. [Google Scholar] [CrossRef]
- Dobson, R.J.; Brooks, C.; Roussi, C.; Colling, T. Developing an Unpaved Road Assessment System for Practical Deployment with High-Resolution Optical Data Collection Using a Helicopter UAV. In Proceedings of the 2013 International Conference on Unmanned Aircraft Systems, ICUAS 2013-Conference Proceedings, Atlanta, GA, USA, 28–31 May 2013; pp. 235–243. [Google Scholar] [CrossRef]
- Kim, B.; Cho, S. Automated Vision-Based Detection of Cracks on Concrete Surfaces Using a Deep Learning Technique. Sensors 2018, 18, 3452. [Google Scholar] [CrossRef]
- Chaiyasarn, K.; Buatik, A.; Mohamad, H.; Zhou, M.; Kongsilp, S.; Poovarodom, N. Integrated Pixel-Level CNN-FCN Crack Detection via Photogrammetric 3D Texture Mapping of Concrete Structures. Autom. Constr. 2022, 140, 104388. [Google Scholar] [CrossRef]
- Sankarasrinivasan, S.; Balasubramanian, E.; Karthik, K.; Chandrasekar, U.; Gupta, R. Health Monitoring of Civil Structures with Integrated UAV and Image Processing System. Procedia Comput. Sci. 2015, 54, 508–515. [Google Scholar] [CrossRef]
- Yoon, J.; Shin, H.; Song, M.; Gil, H.; Lee, S. A Crack Width Measurement Method of UAV Images Using High-Resolution Algorithms. Sustainability 2022, 15, 478. [Google Scholar] [CrossRef]
- Li, S.; Zhao, X. Automatic Crack Detection and Measurement of Concrete Structure Using Convolutional Encoder-Decoder Network. IEEE Access 2020, 8, 134602–134618. [Google Scholar] [CrossRef]
- Zhao, W.; Liu, Y.; Zhang, J.; Shao, Y.; Shu, J. Automatic Pixel-Level Crack Detection and Evaluation of Concrete Structures Using Deep Learning. Struct. Control Health Monit. 2022, 29, e2981. [Google Scholar] [CrossRef]
- Khosravani, M.R.; Silani, M.; Weinberg, K. Fracture Studies of Ultra-High Performance Concrete Using Dynamic Brazilian Tests. Theor. Appl. Fract. Mech. 2018, 93, 302–310. [Google Scholar] [CrossRef]
- Kim, H.; Sim, S.H.; Spencer, B.F. Automated Concrete Crack Evaluation Using Stereo Vision with Two Different Focal Lengths. Autom. Constr. 2022, 135, 104136. [Google Scholar] [CrossRef]
- Ai, D.; Jiang, G.; Lam, S.K.; He, P.; Li, C. Computer Vision Framework for Crack Detection of Civil Infrastructure—A Review. Eng. Appl. Artif. Intell. 2023, 117, 105478. [Google Scholar] [CrossRef]
- Fujita, Y.; Hamamoto, Y. A Robust Automatic Crack Detection Method from Noisy Concrete Surfaces. Mach. Vision Appl. 2010, 22, 245–254. [Google Scholar] [CrossRef]
- Kim, H.; Lee, J.; Ahn, E.; Cho, S.; Shin, M.; Sim, S.H. Concrete Crack Identification Using a UAV Incorporating Hybrid Image Processing. Sensors 2017, 17, 2052. [Google Scholar] [CrossRef]
- Sauvola, J.; Pietikäinen, M. Adaptive Document Image Binarization. Pattern Recognit. 2000, 33, 225–236. [Google Scholar] [CrossRef]
- Ioli, F.; Pinto, A.; Pinto, L. UAV PHOTOGRAMMETRY FOR METRIC EVALUATION OF CONCRETE BRIDGE CRACKS. Int. Arch. Photogramm. Remote Sens. Spat. Inf. Sci. 2022, XLIII-B2-2, 1025–1032. [Google Scholar] [CrossRef]
- Naccache, N.J.; Shinghal, R. An Investigation into the Skeletonization Approach of Hilditch. Pattern Recognit. 1984, 17, 279–284. [Google Scholar] [CrossRef]
- Lee, T.C.; Kashyap, R.L.; Chu, C.N. Building Skeleton Models via 3-D Medial Surface Axis Thinning Algorithms. CVGIP Graph. Model. Image Process. 1994, 56, 462–478. [Google Scholar] [CrossRef]
- Zhang, T.Y.; Suen, C.Y. A Fast Parallel Algorithm for Thinning Digital Patterns. Commun. ACM 1984, 27, 236–239. [Google Scholar] [CrossRef]
- Tomczak, K.; Jakubowski, J.; Fiołek, P. Method for Assessment of Changes in the Width of Cracks in Cement Composites with Use of Computer Image Processing and Analysis. Stud. Geotech. Mech. 2017, 39, 73–80. [Google Scholar] [CrossRef]
- Ito, A.; Aoki, Y.; Hashimoto, S. Accurate Extraction and Measurement of Fine Cracks from Concrete Block Surface Image. IECON Proc. (Ind. Electron. Conf.) 2002, 3, 2202–2207. [Google Scholar] [CrossRef]
- Kim, B.; Cho, S. Image-Based Concrete Crack Assessment Using Mask and Region-Based Convolutional Neural Network. Struct. Control Health Monit. 2019, 26, e2381. [Google Scholar] [CrossRef]
- Kim, H.; Ahn, E.; Cho, S.; Shin, M.; Sim, S.H. Comparative Analysis of Image Binarization Methods for Crack Identification in Concrete Structures. Cem. Concr. Res. 2017, 99, 53–61. [Google Scholar] [CrossRef]
- Jeong, H.; Jeong, B.; Han, M.; Cho, D. Analysis of Fine Crack Images Using Image Processing Technique and High-Resolution Camera. Appl. Sci. 2021, 11, 9714. [Google Scholar] [CrossRef]
- Culjak, I.; Abram, D.; Pribanic, T.; Dzapo, H.; Cifrek, M. A Brief Introduction to OpenCV. In Proceedings of the 2012 Proceedings of the 35th International Convention MIPRO, Opatija, Croatia, 21–25 May 2012. [Google Scholar]
- Supriyanti, R.; Setiawan, B.; Widodo, H.B.; Murdyantoro, E. Detecting Pupil and Iris under Uncontrolled Illumination Using Fixed-Hough Circle Transform. Int. J. Signal Process. 2012, 5, 175–188. [Google Scholar]
- Cornelia, A.; Setyawan, I. Ball Detection Algorithm for Robot Soccer Based on Contour and Gradient Hough Circle Transform. In Proceedings of the 2017 4th International Conference on Information Technology, Computer, and Electrical Engineering, ICITACEE 2017, Semarang, Indonesia, 18–19 October 2017; pp. 136–141. [Google Scholar] [CrossRef]
- Liu, T.; Lei, Y.; Mao, Y. Computer Vision-Based Structural Displacement Monitoring and Modal Identification with Subpixel Localization Refinement. Adv. Civ. Eng. 2022, 2022, 5444101. [Google Scholar] [CrossRef]
- Canny, J. A Computational Approach to Edge Detection. IEEE Trans. Pattern Anal. Mach. Intell. 1986, PAMI-8, 679–698. [Google Scholar] [CrossRef]
- Dorafshan, S.; Thomas, R.J.; Maguire, M. Benchmarking Image Processing Algorithms for Unmanned Aerial System-Assisted Crack Detection in Concrete Structures. Infrastructures 2019, 4, 19. [Google Scholar] [CrossRef]
- Kim, I.H.; Jeon, H.; Baek, S.C.; Hong, W.H.; Jung, H.J. Application of Crack Identification Techniques for an Aging Concrete Bridge Inspection Using an Unmanned Aerial Vehicle. Sensors 2018, 18, 1881. [Google Scholar] [CrossRef] [PubMed]
Disclaimer/Publisher’s Note: The statements, opinions and data contained in all publications are solely those of the individual author(s) and contributor(s) and not of MDPI and/or the editor(s). MDPI and/or the editor(s) disclaim responsibility for any injury to people or property resulting from any ideas, methods, instructions or products referred to in the content. |
© 2023 by the authors. Licensee MDPI, Basel, Switzerland. This article is an open access article distributed under the terms and conditions of the Creative Commons Attribution (CC BY) license (https://creativecommons.org/licenses/by/4.0/).

