
Analysis of Phonetic Segments of Oesophageal Speech in People Following Total Laryngectomy

Abstract
:Featured Application
Abstract
1. Introduction
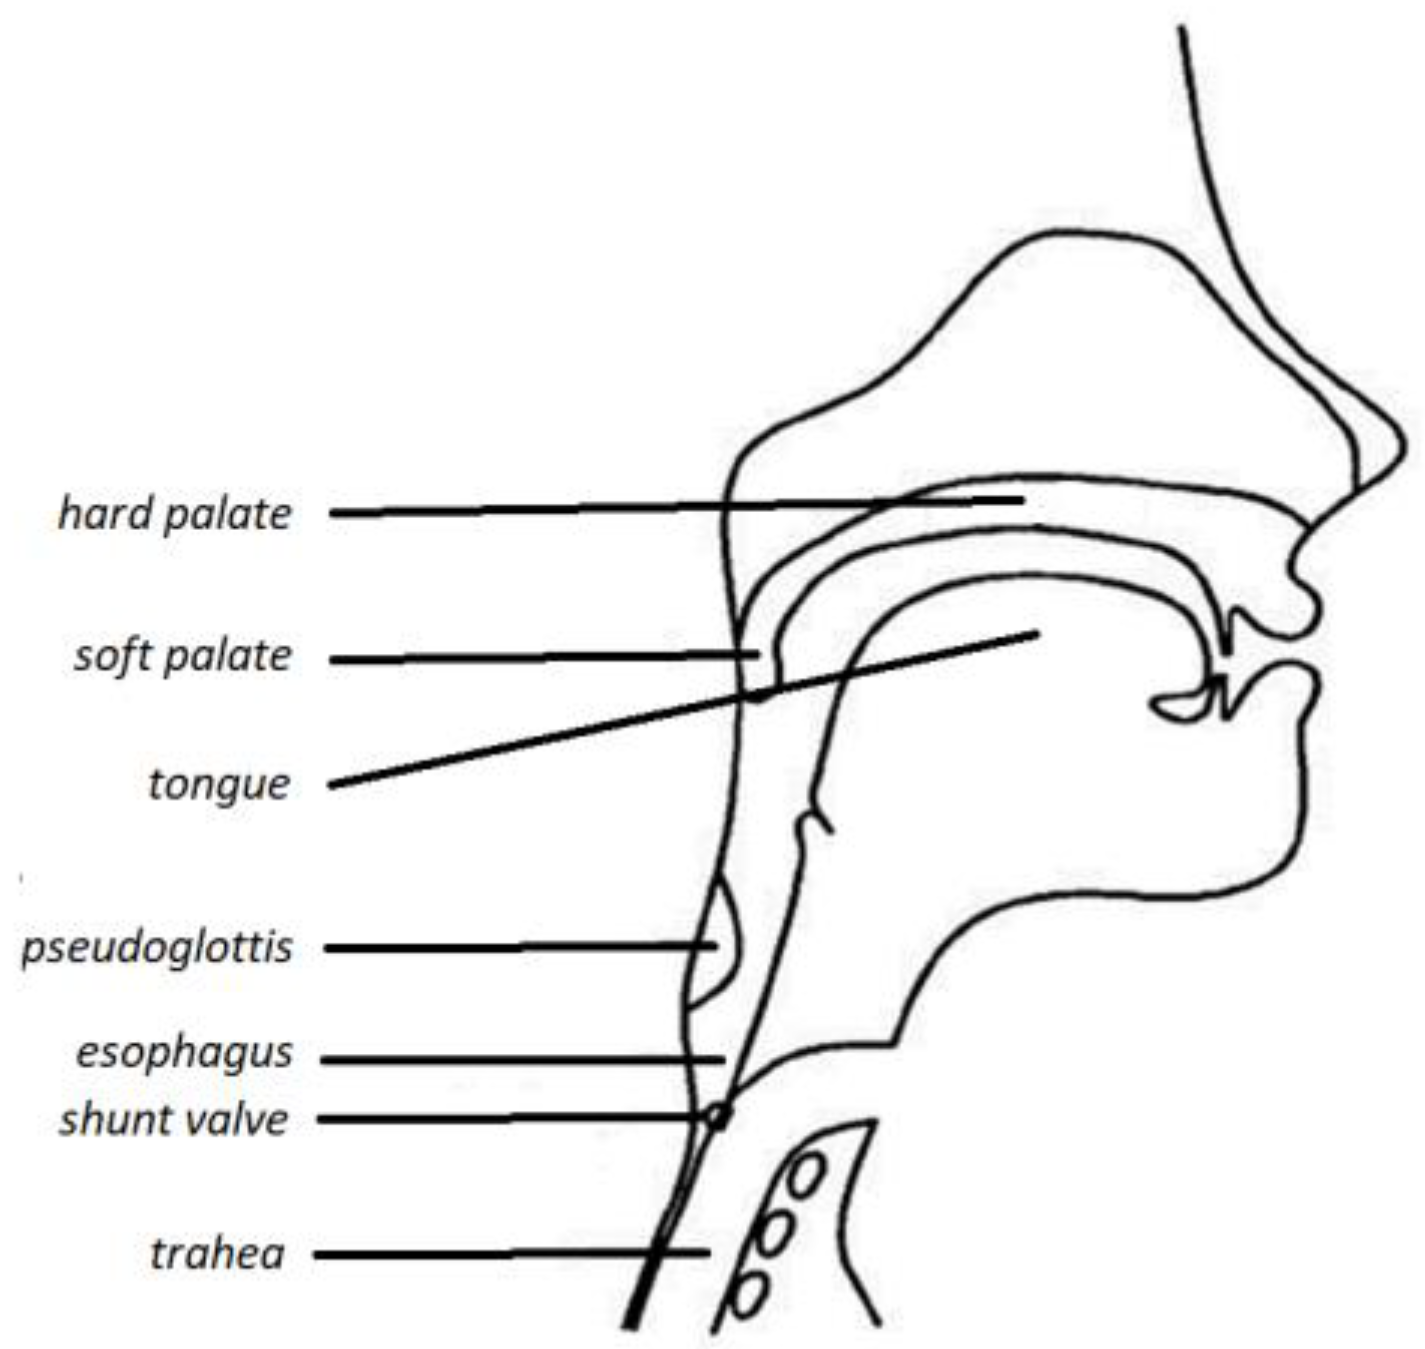
- Oesophageal speech: This is a kind of substitute speech following laryngectomy. After a laryngectomy, the folds of the esophageal mucosa may act as a sound source of sound. This is the so-called pseudoglottis in the oesophagus. During oesophageal speech, it is necessary to swallow small amounts of air, which then comes back up via “burping”. The column of swallowed air causes the oesophagus to vibrate and generate sound, which is modified by the tongue and lips to form words.The advantages of oesophageal speech is are:
- Non-surgical method;
- Hands-free talking;
- Closest to physiological speech;
- No need to implement a foreign body.
Disadvantages of oesophageal speech are:- Learning takes a lot of time and must be intensive;
- Not all people are able to master this method well;
- Speech may be incomprehensible;
- Speaking in short sentences and at a slower pace—having to swallow air while speaking.
- Speaking with a voice prosthesis provides the most natural-sounding and easiest-to-understand voice. The prosthesis is placed between the oesophagus and the trachea during a total laryngectomy procedure. The prosthesis has a one-way valve that opens during speak and closes during breathing and eating. When speaking, it is necessary to close the valve with a finger. There are many models of voice prostheses, such as Provox.The advantages of voice prostheses are:
- Ability to speak immediately after a laryngectomy;
- Greater speech efficiency (no need to swallow air);
- Clearer speech.
The disadvantages of voice prostheses are:- Need to implant a foreign body, which may result in tinea or infections;
- Periodic replacement;
- Occurrence of leaks around the prosthesis;
- Spontaneous prolapse of the prosthesis;
- Appearance of inflammation.
- Electrolarynx speech—this is an electrolarynx device. This method requires the use of a hand-held device which, when applied to the neck, generates vibrations that are then shaped by the tongue and mouth into speech. The voice produced by this method sounds very artificial and the modulation depends on the device used.Advantages:
- Easy- to- master speech;
- Non-surgical method.
Disadvantages:- The artificial sound of speech;
- The need to wear the device;
- The need to use the hand when speaking;
- Periodic service of the device required.
- Based on the so-called signal macrostructure—calculations are performed in time segments after initial segmentation, the obtained parameters are the amplitude and rate of change;
- Based on the so-called the signal microstructure, i.e., the time course, analyzing the zero-crossing rate of the speech signal. This leads to obtaining two types of parameters: the density of zero crossings and the distribution of time intervals.
- Introduction: This section covers general issues related to laryngeal cancer, laryngectomy and available speech rehabilitation options, including their advantages and disadvantages;
- Materials and methods: This section lists the studied words, indicates the phonetic segments, and describes the recording conditions of the test words;
- Approach for obtaining feature vectors: This section discusses the time domain and spectrum domain descriptor definitions that were used during the research;
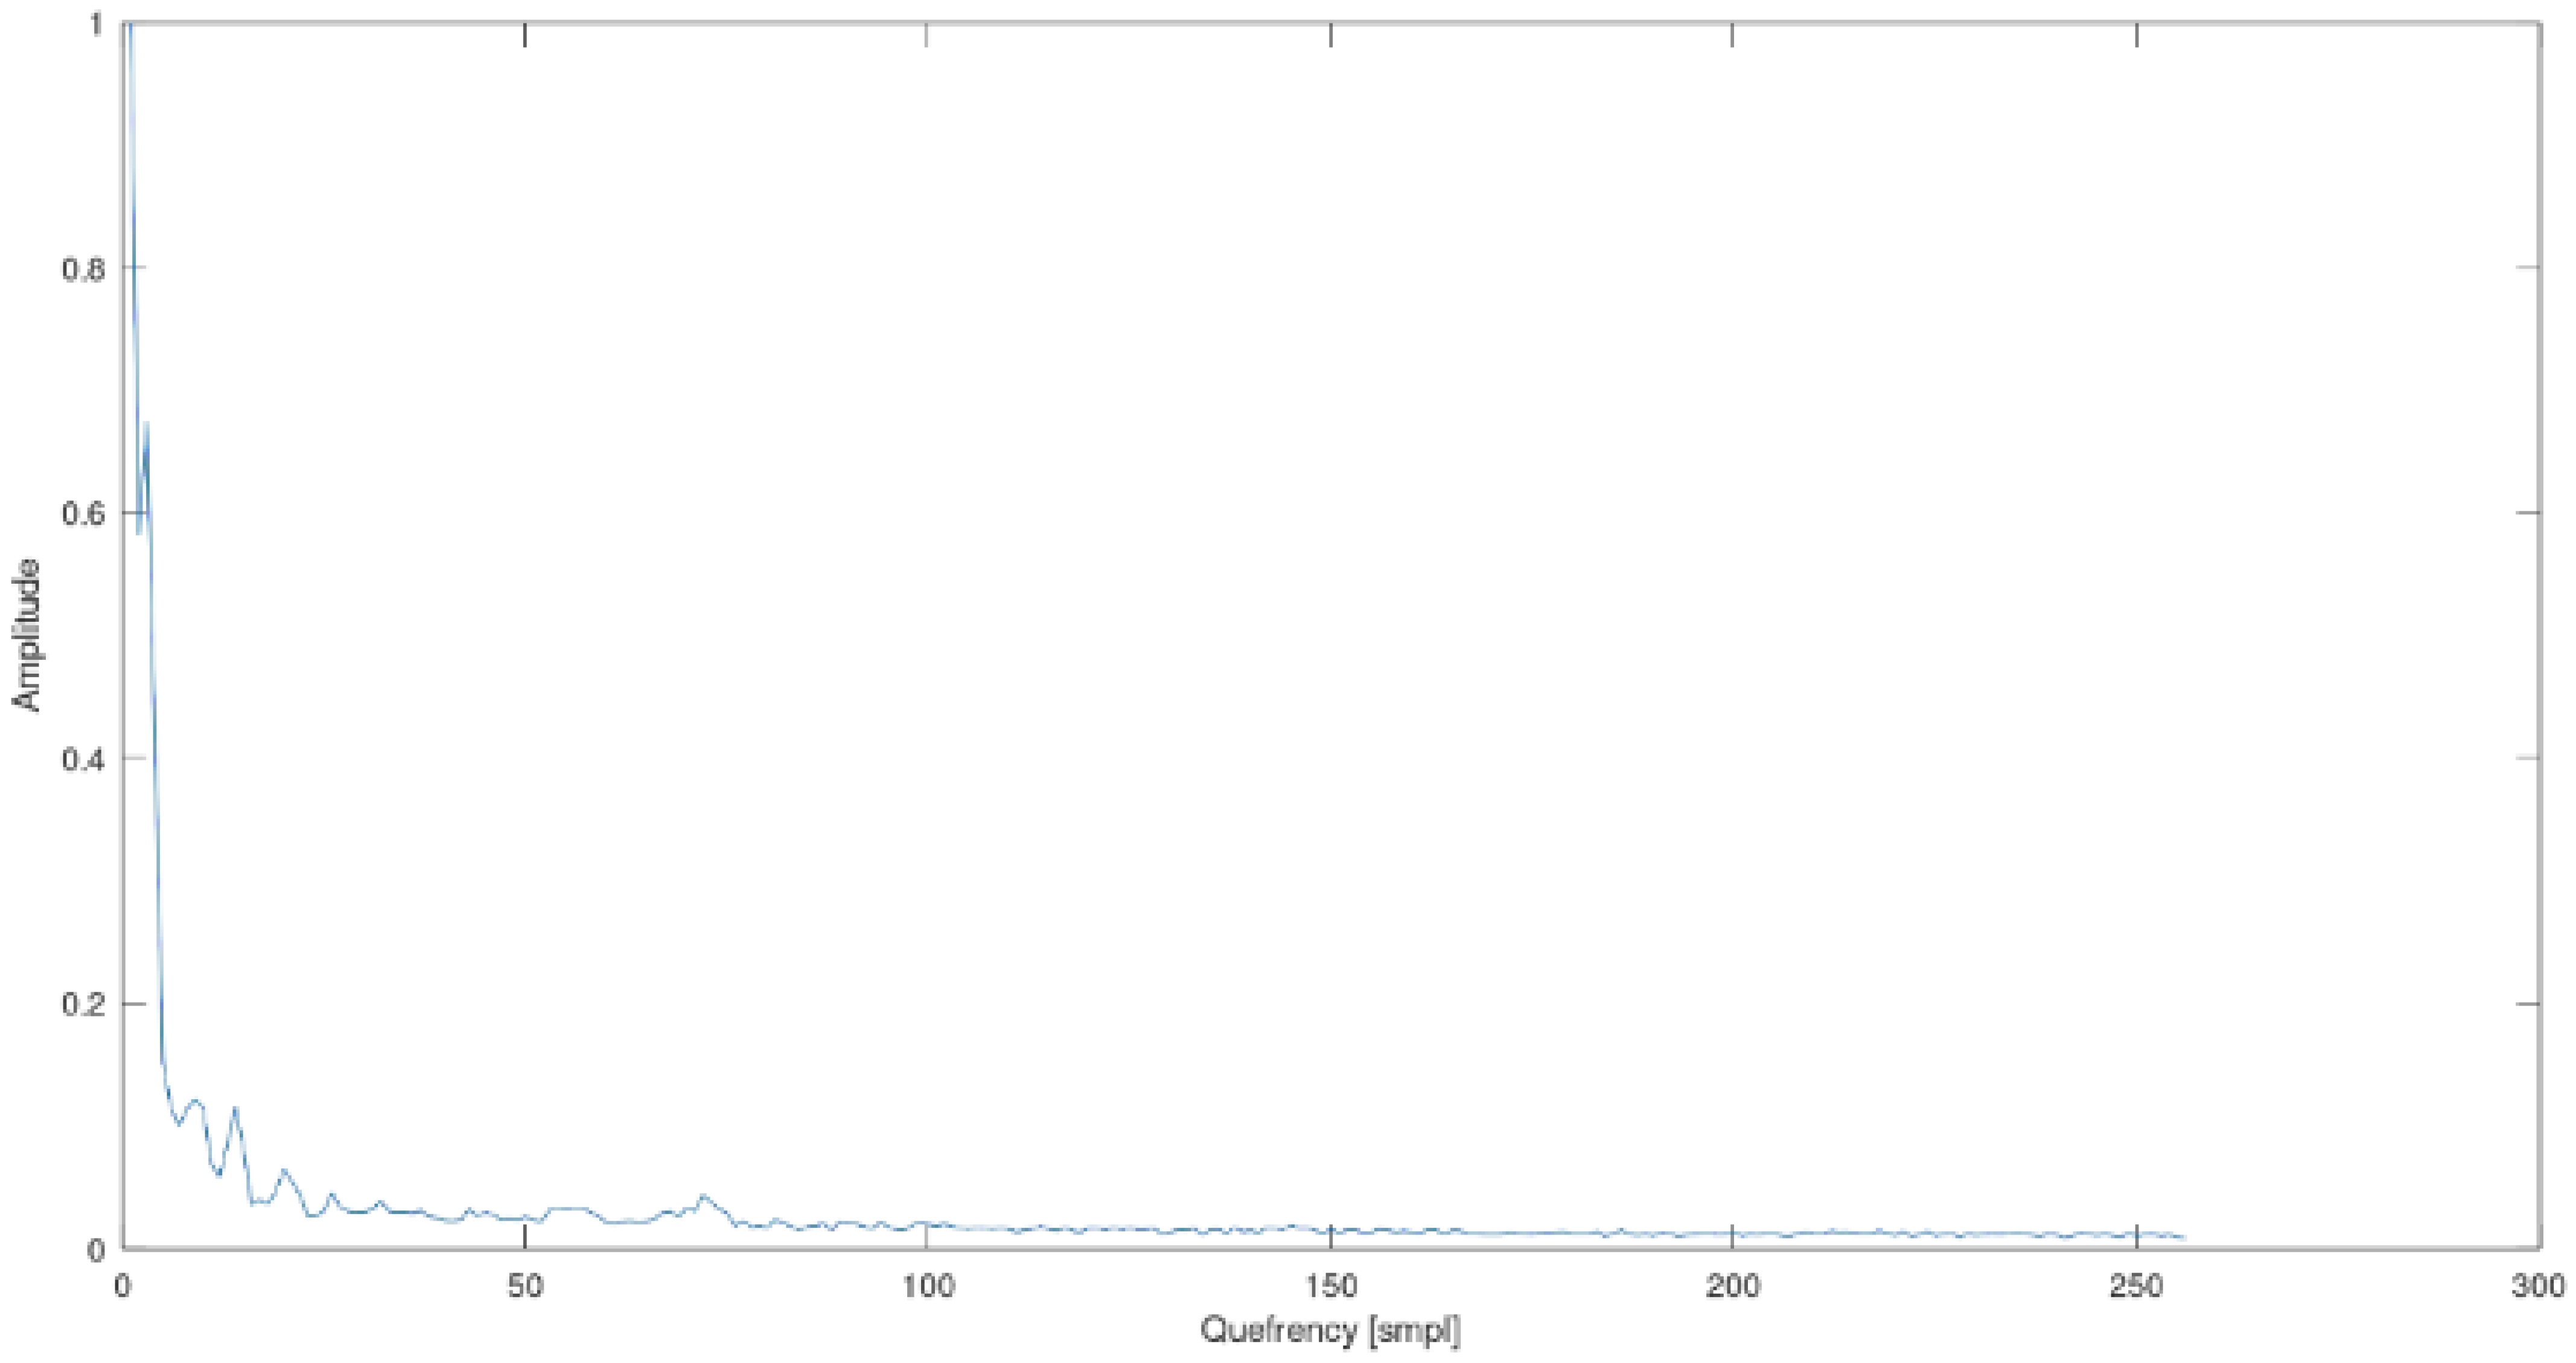
- Cepstrum analysis: This section discusses the definition of cepstrum and its interpretations;
- Mel-frequency cepstral coefficient (MFCC): This section of the paper discusses the MFCCs coefficients and how to extract them from a speech signal;
- Results: The results of the research are discussed here, and the effectiveness of the applied classification algorithms and learning methods in relation to the defined vectors of oesophageal speech features is indicated;
- Discussion: This is a place for summarizing the research and planning further research related to speech analysis.
2. Material and Methods
2.1. Material
2.2. Methods
- paczka—/paʧ̑ka/;
- jajko—/jæjkɔ/;
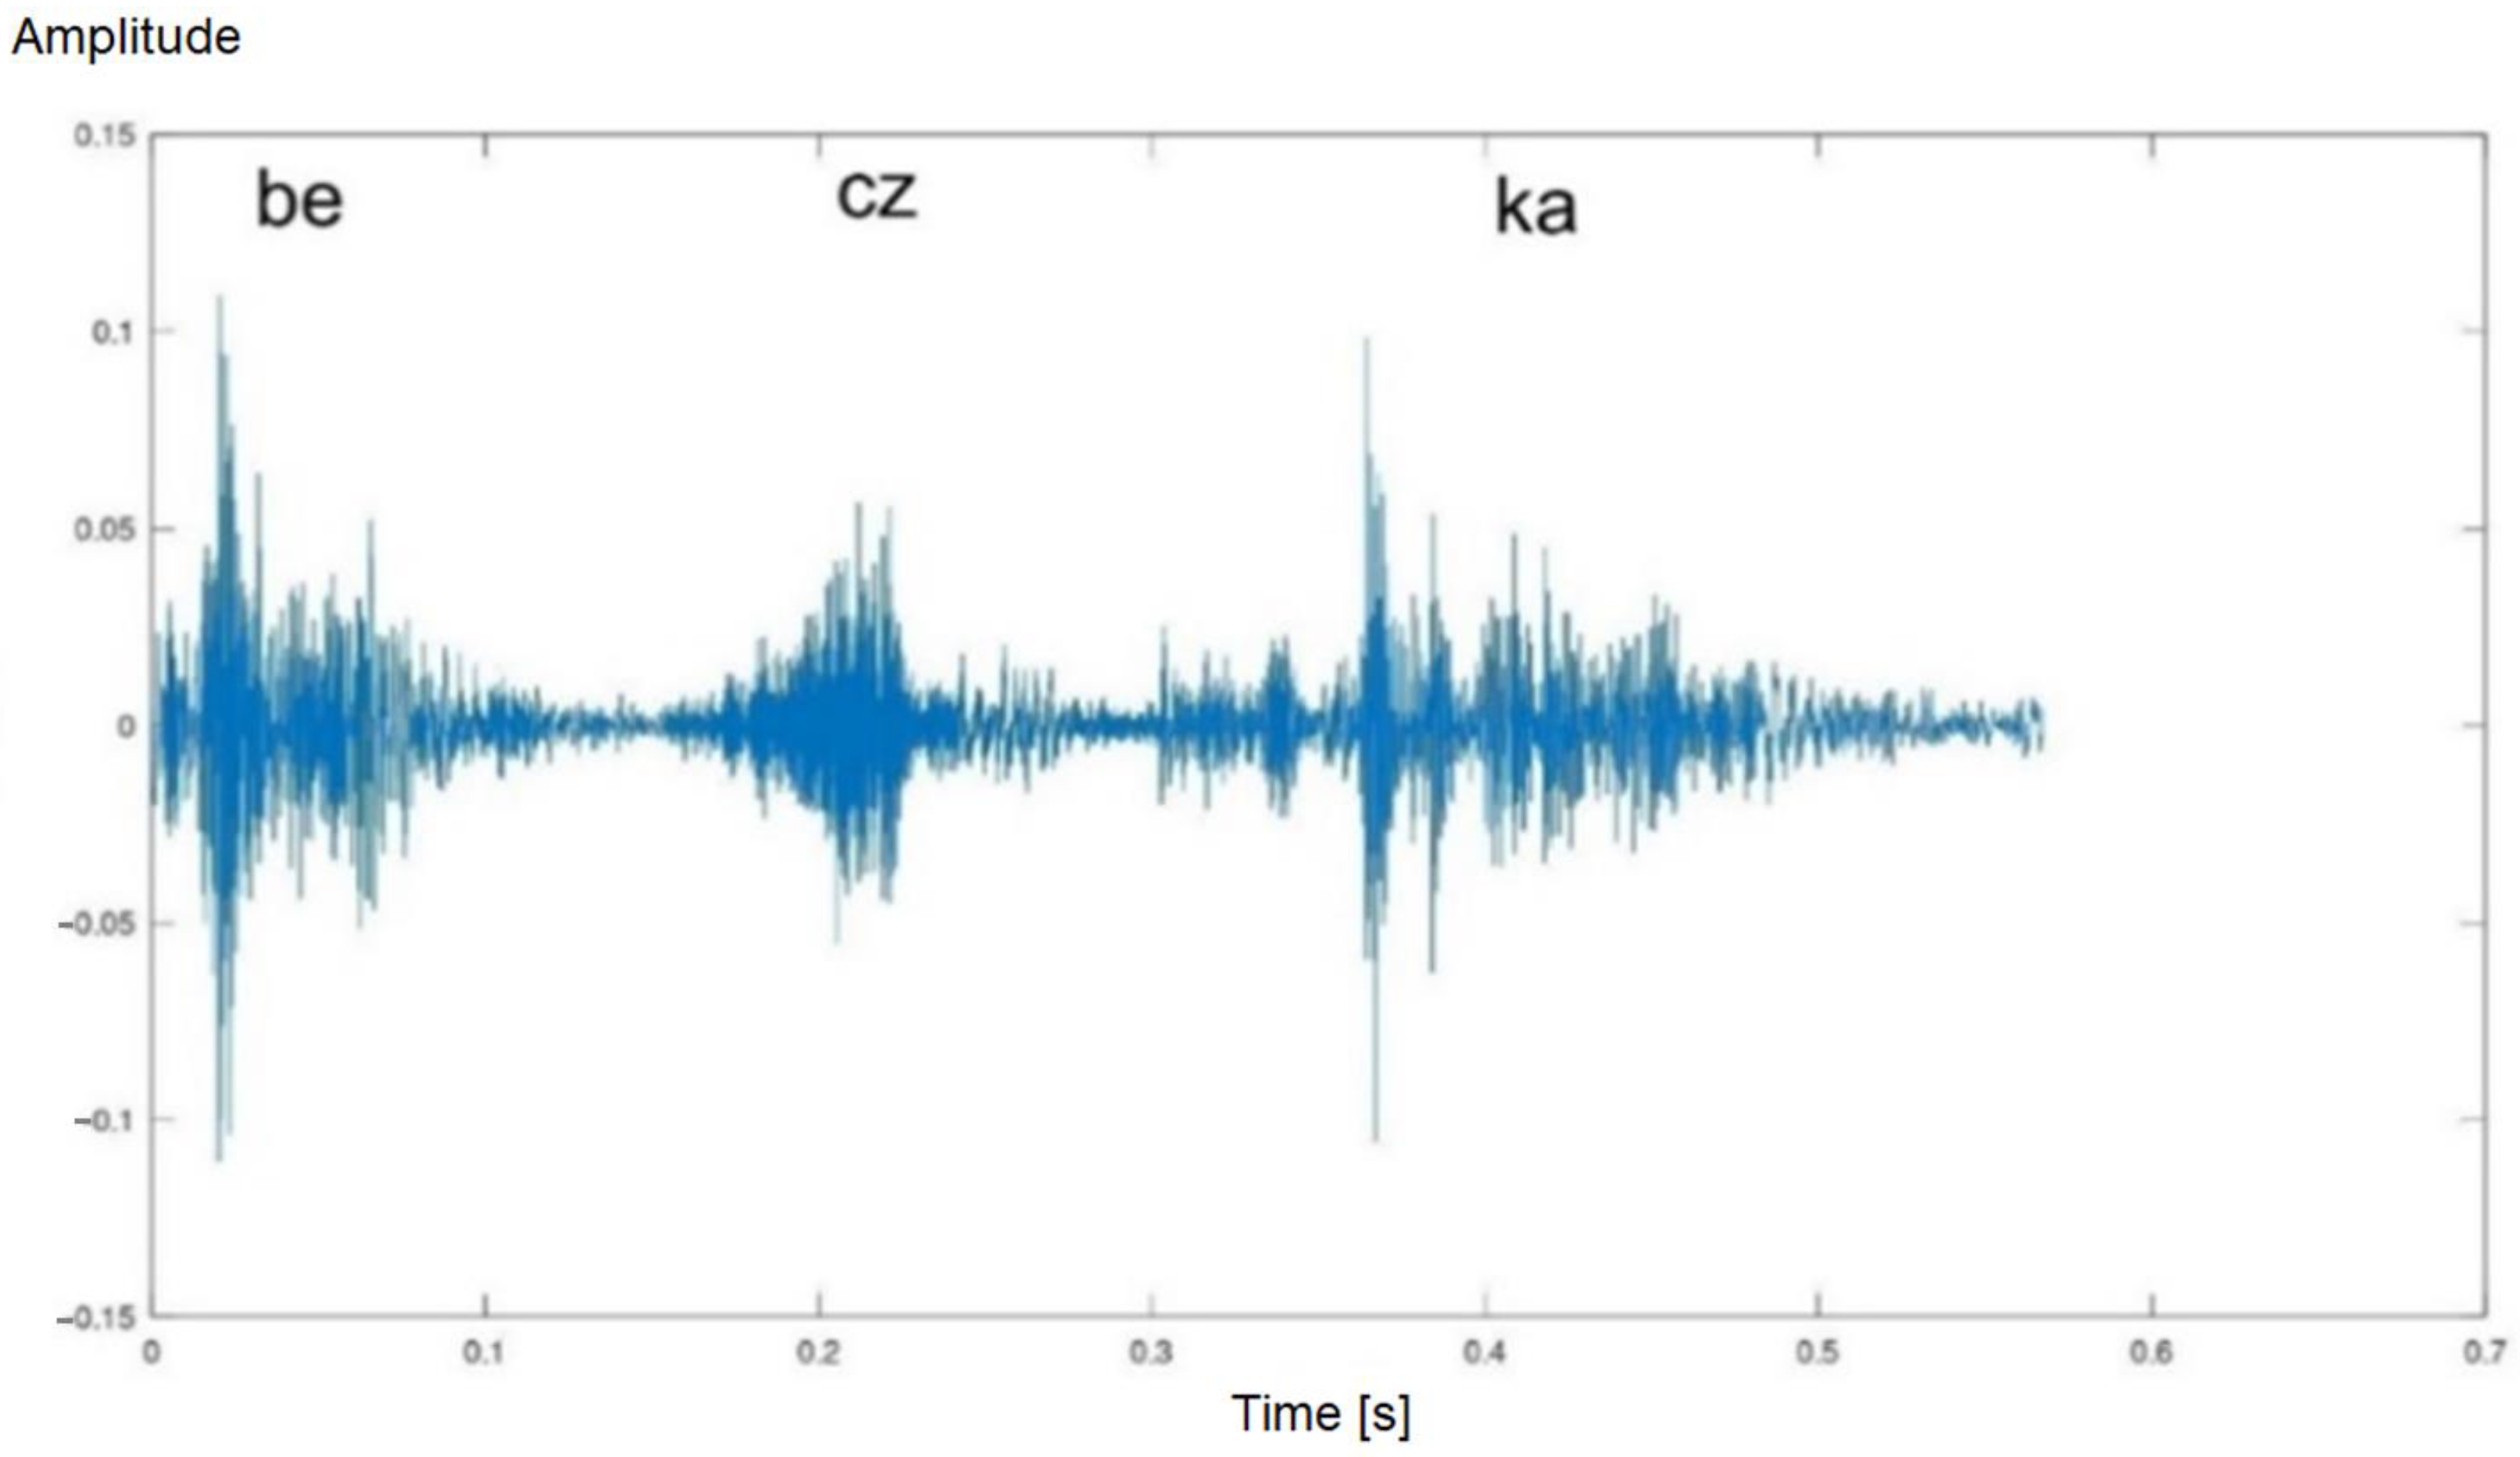
- beczka—/bɛʈ͡ʂka/;
- bułka—/buwka/.

| Researched Phonetic Segments | ||||
|---|---|---|---|---|
| In English | In Polish | Seg 1 | Seg 2 | Seg 3 |
| a barrel | beczka | be | cz | ka |
| a bread roll | bułka | buł | ka | - |
| an egg | jajko | jaj | ko | - |
| a package | paczka | pa | cz | ka |
Feature Vectors Obtained Approach
2.3. Time Domain Descriptors
- (1)
- ZCR (zero-crossing rate) is a measurement used to determine the ratio of zero crossings (the crossing of the OX axis). This is determined as the percentage of audio samples in a given fragment that change sign. The ZCR is defined by the following equation [17]:where sgn(*) is the function, i.e.,In the research, the value of the ZCR descriptor was calculated in each phonetic segments of the speech of the healthy and laryngectomised people.
- (2)
- Short-time energy (STE) is an audio descriptor from the MPEG-7 standard, also used in speech classification [6,18,19]. It describes the envelope of the signal. STE is the sum of squares computed in the time domain over the length of the test frame of the signal. The STE is expressed by the formula:where: x(n)—is the value of n-th sample, n—Index of the sample, N—signal length (total number of samples in the processing window, corresponding to the one phonetic segments).
- (3)
- The signal mean value (SMV) descriptor expresses the average value of the input speech signal. Its value is estimated in the tested frame of the audio signal. It is calculated by summing the values of all samples and dividing by N. The SMV is given by:
- (4)
- Root mean square is the RMS value of a (periodic) signal, also known as nominal or continuous. This feature is widely used in speech parameterization. It is expressed by the formula [6,20]:where: N—signal length (total number of samples in the processing window, corresponding to the one phonetic segments), x—is the value of nth sample.
- (5)
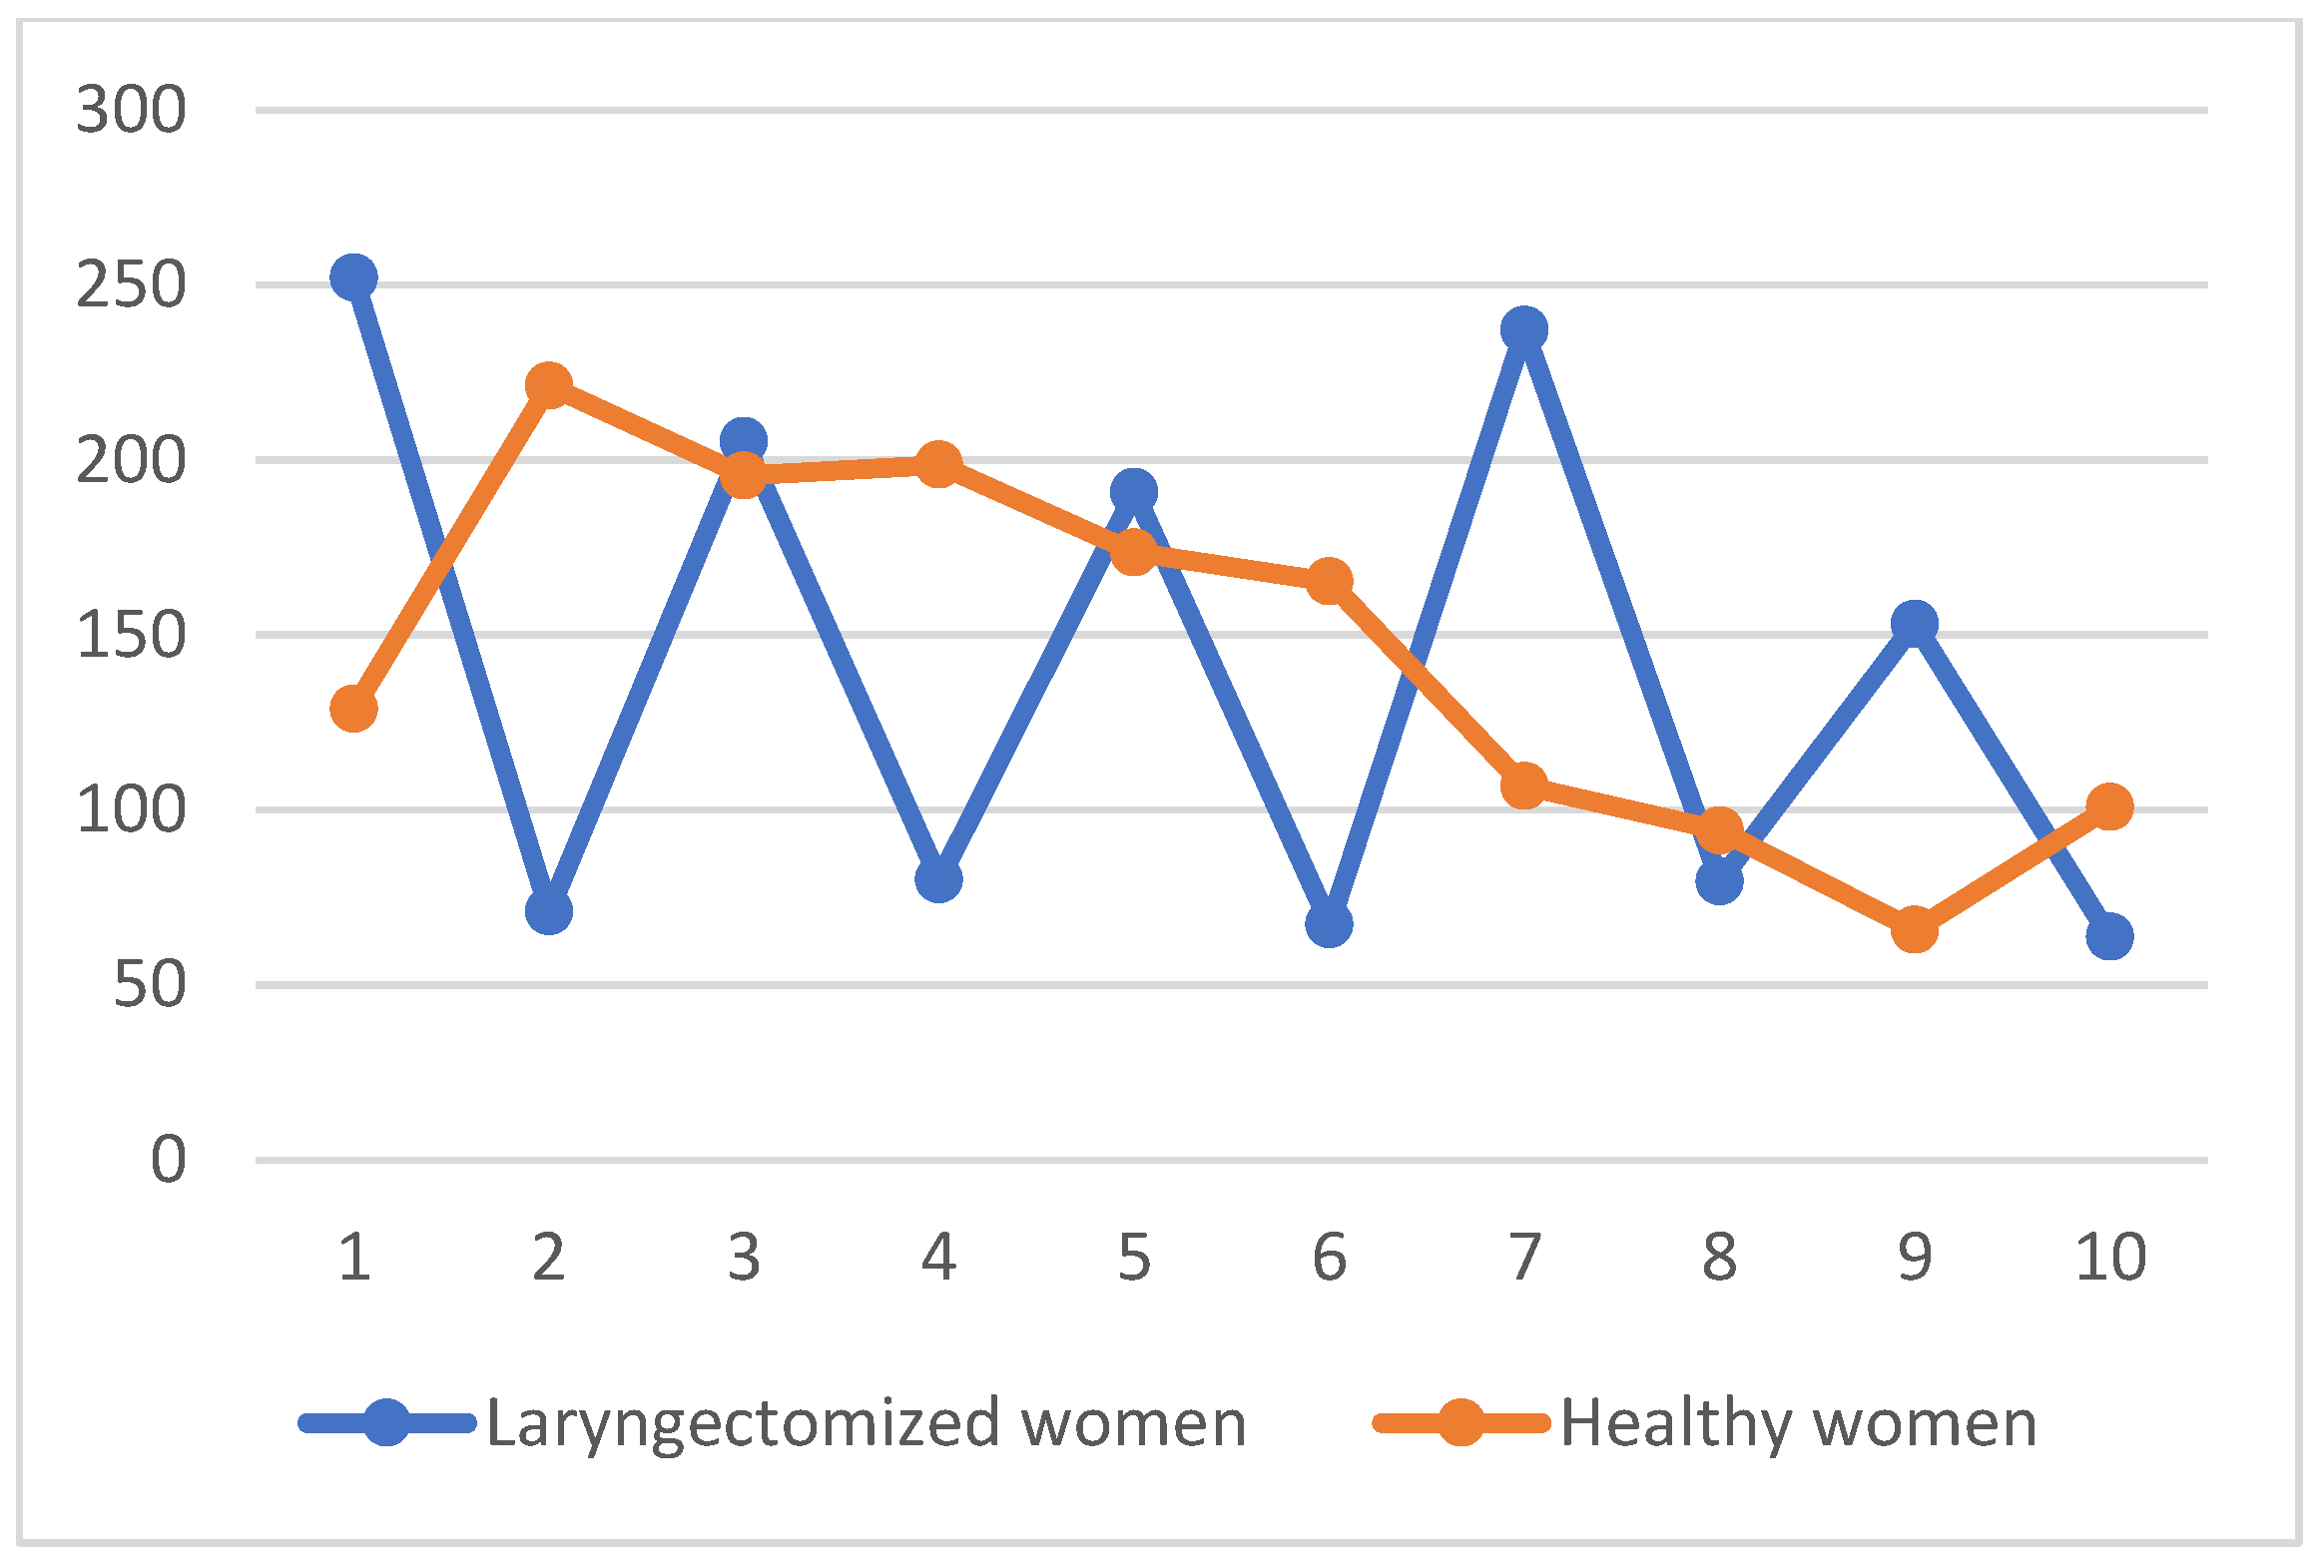
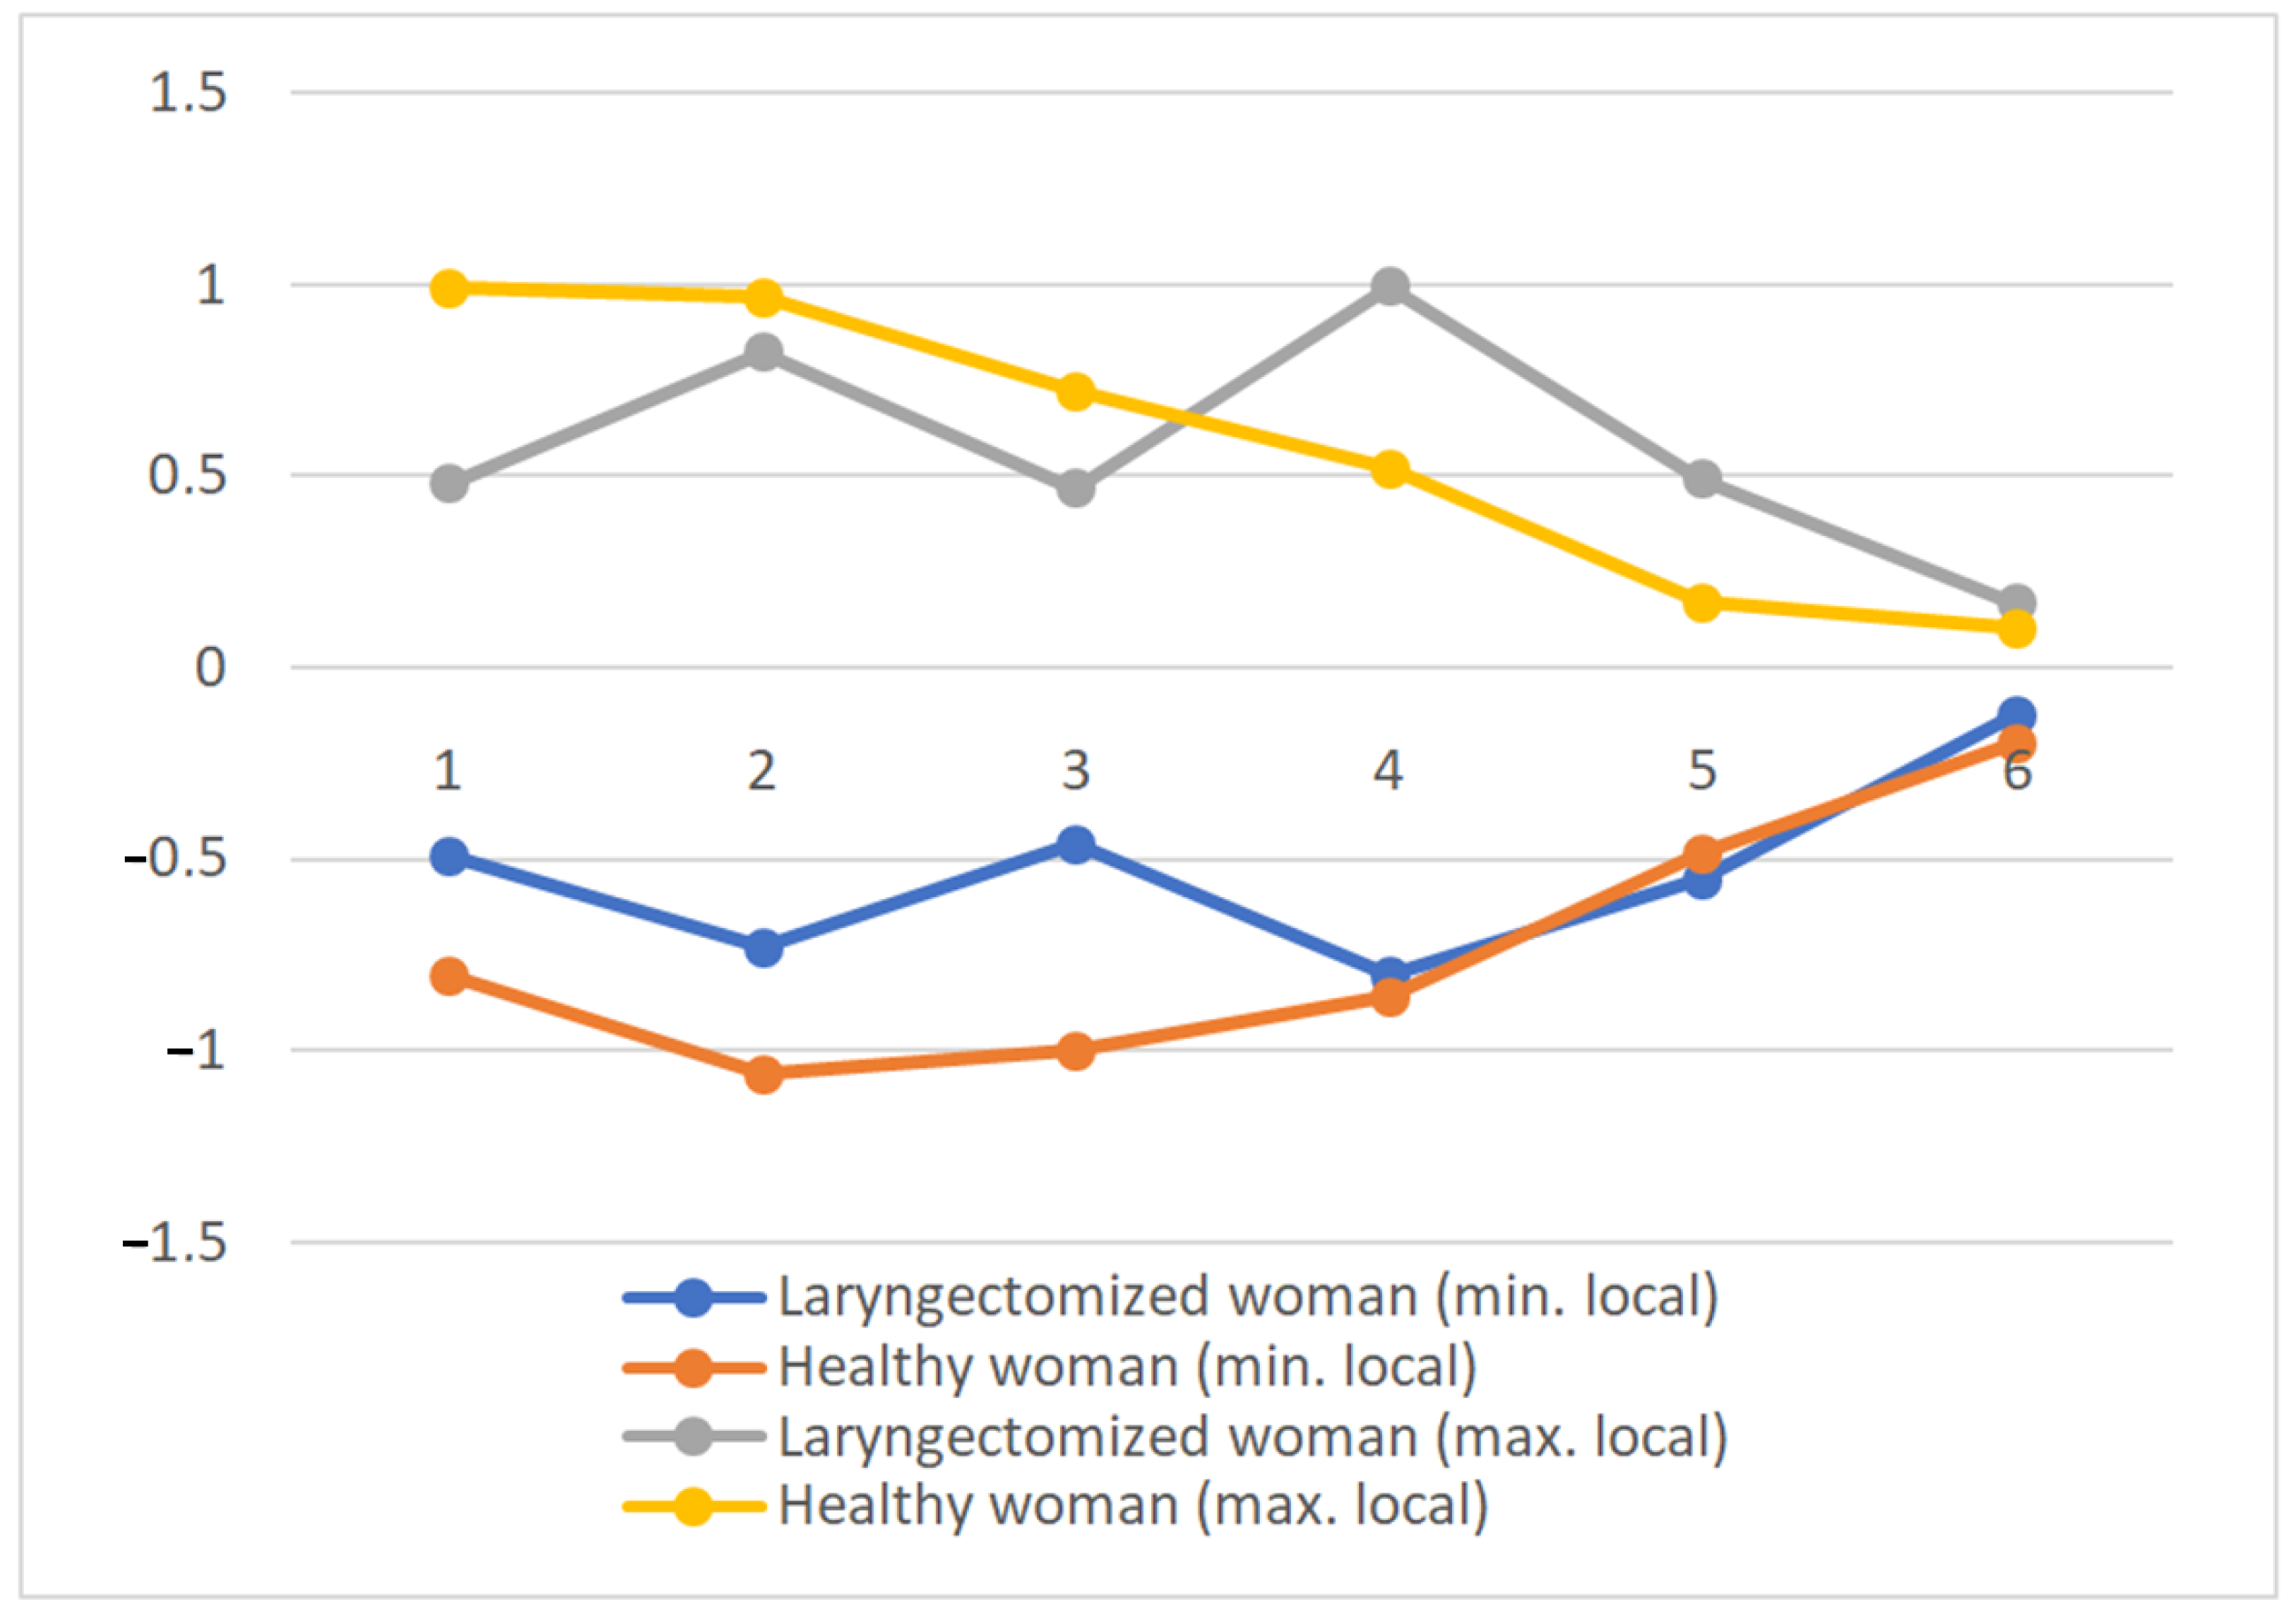
- Local minimum and maximum: The local maximum is the point at which the function changes from ascending to descending. Also, the local minimum is the point at which the function changes from descending to ascending. In the research, each phonetic segment in the time domain was divided into 20 ms long windows. In each of these windows, the local minimum and maximum values were found.
2.4. Frequency Domain Descriptors
- (1)
- Spectral centroid (SC) is a way of describing the shape of the power spectrum. It shows whether the spectrum is dominated by low or high frequencies. This descriptor also refers to the timbre of the sound and allows the separation of tonal sounds from noise.where: A(i) is amplitude of the i-th component (harmonic), i—index of the i-th partial.
- (2)
- Irregularity of spectrum (Ir)
2.4.1. Cepstrum Analysis
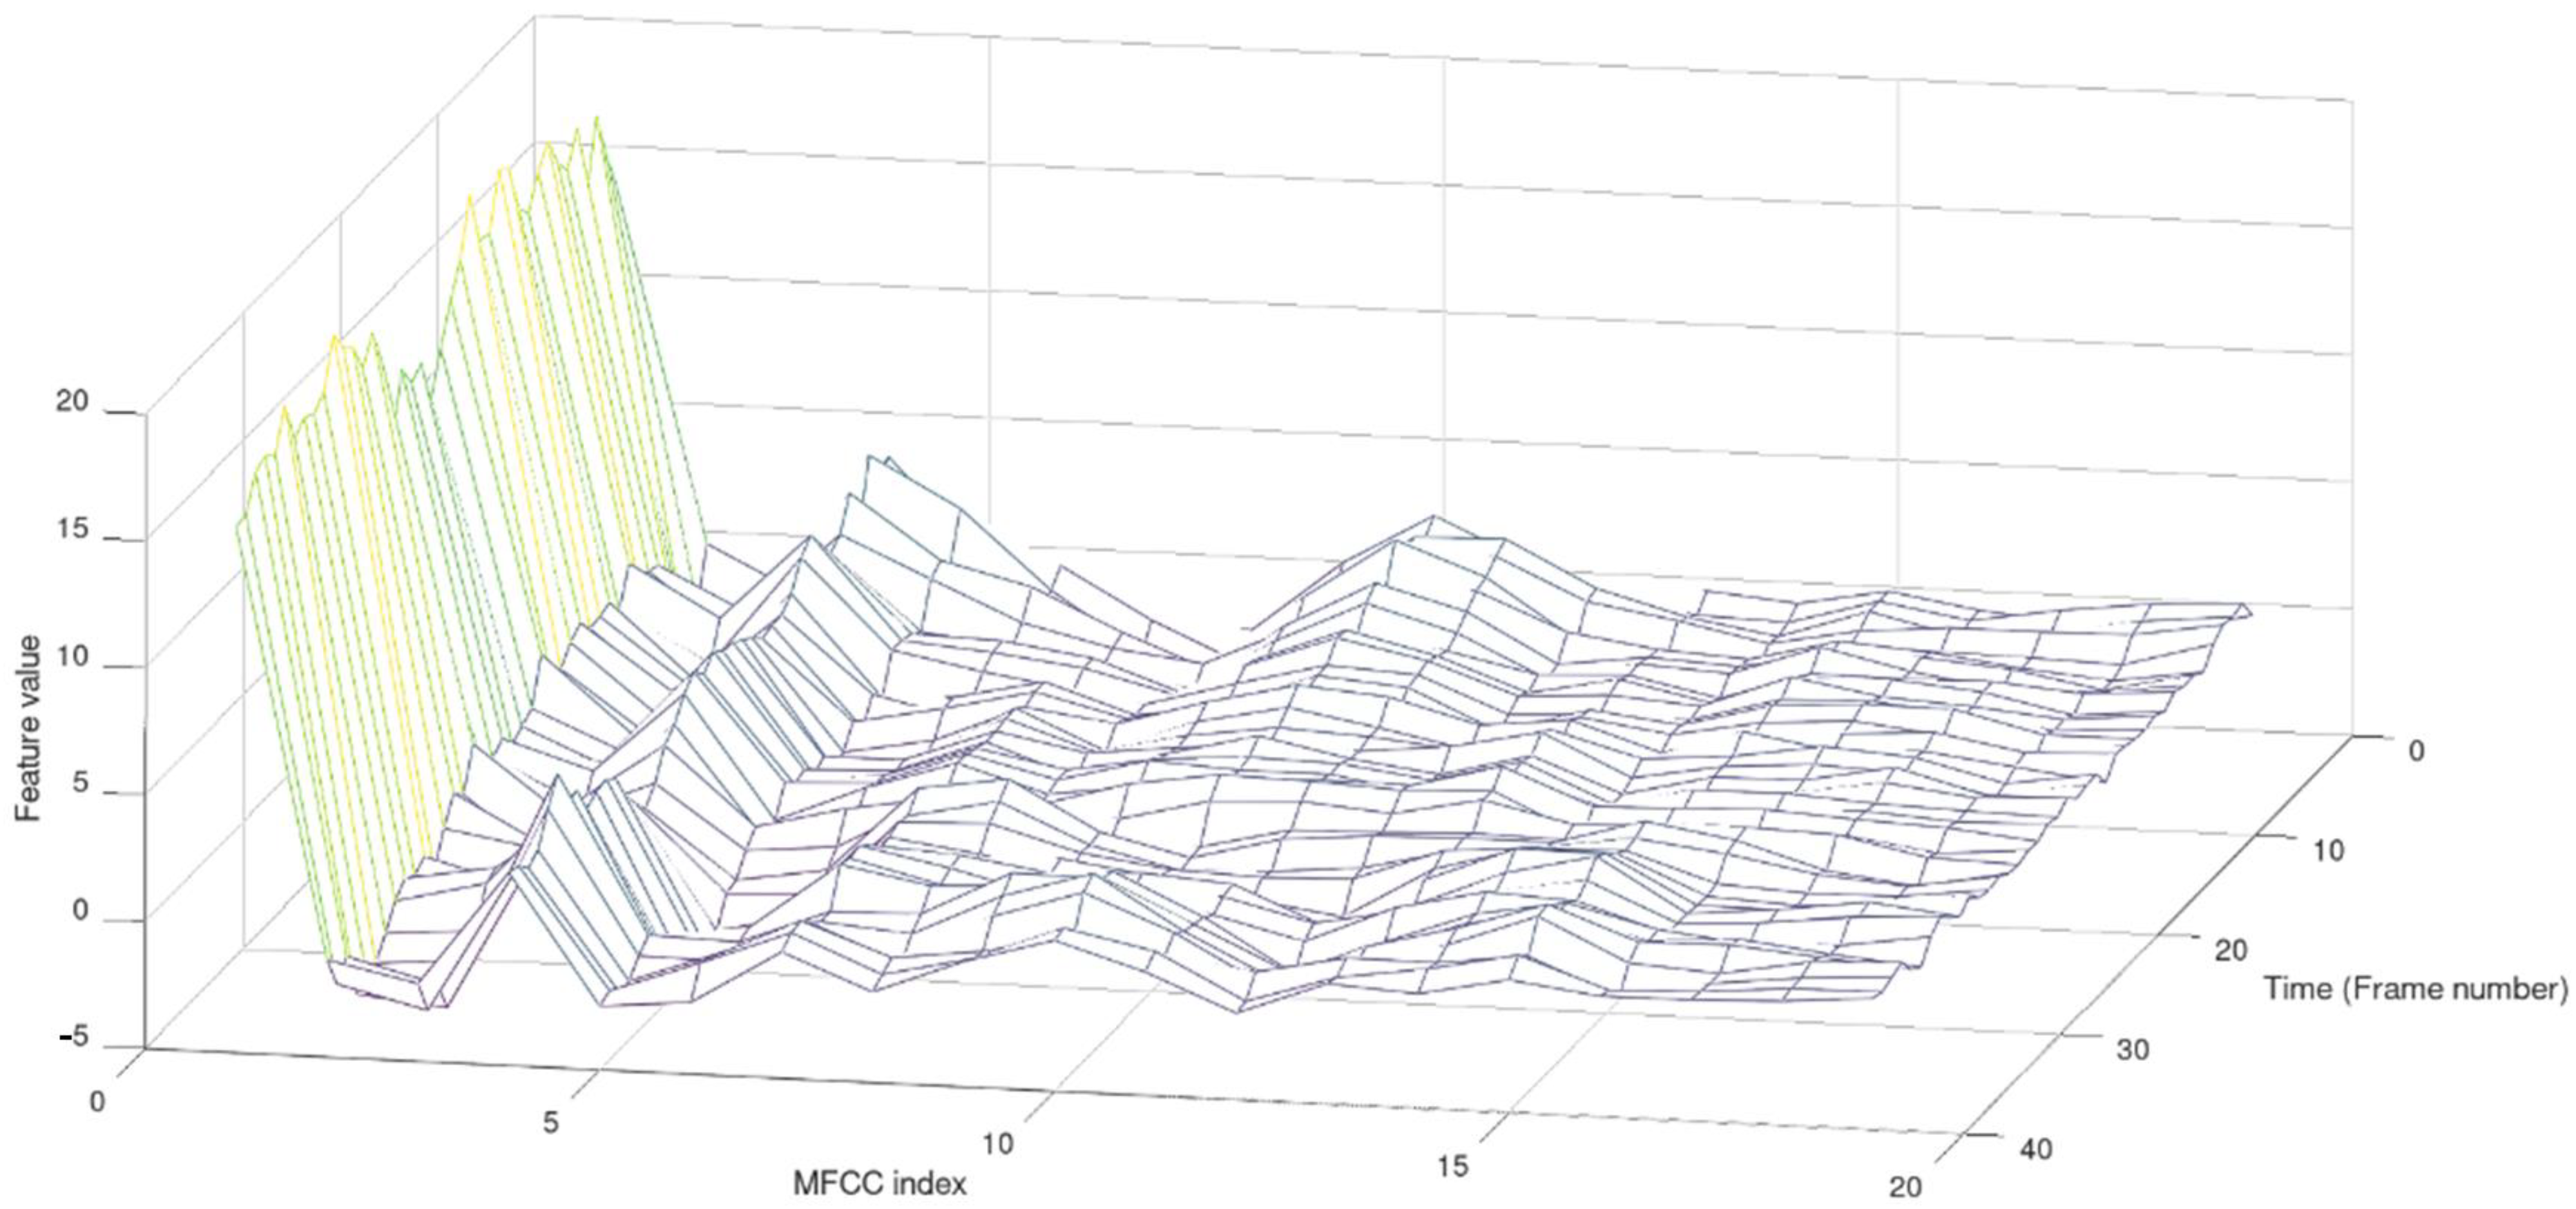
2.4.2. Mel-Frequency Cepstral Coefficient
3. Results
- Zero-crossing rate (ZCR);
- Short-time energy (STE);
- Signal mean value (SMV);
- The root mean square (RMS);
- Local minimum and maximum;
- Spectral centroid (SC);
- Irregularity of spectrum (Ir);
- Cepstrum;
- MFCC—mel-frequency cepstral coefficient.
- Markings “a” and “b” as a group of examined people (laryngectomized and healthy);
- Shaded cells in the table contain the correct classification. For example, in Table 5, in1st row, 93.75% means the correct classification of samples from laryngectomised people, and 6.25% means incorrect classification.
- For ZCR, STE, SMV, RMS descriptors:
- Seg. 1: 6 features;
- Seg. 2: 3 features;
- Seg. 3: 6 features;
- For Ir and Br descriptors:
- Seg. 1: 10 features;
- Seg. 2: 4 features;
- Seg. 3: 12 features.
4. Discussion
- Indication that the classification based on a temporal feature vector is more effective than a frequency feature vector;
- Identifying the first phonetic segment as the part of the word under study with the highest number of features is relevant for classification purposes—of all the phonetic segments, the first segment showed the highest classification performance—especially on the temporal feature index;
- High classification performance of the feature vector containing MFCC coefficients (across all three segments, the average recognition performance is about 83%);
- High classification performance of the feature vector for one phonetic segment: about 84% overall recognition performance;
- High classification efficiency resulting from the analysis of local minima and maxima: about 86% for the 1st phonetic segment and about 81% for the 3rd phonetic segment.
Directions for Further Research
5. Conclusions
Author Contributions
Funding
Institutional Review Board Statement
Informed Consent Statement
Data Availability Statement
Conflicts of Interest
References
- Report: National Health Fund Headquarters, The Analysis and Innovation Department, Warszawa, Poland. July 2021. Available online: https://ezdrowie.gov.pl/pobierz/nfz-o-zdrowiu-choroby-odtytoniowe-popr (accessed on 28 January 2023).
- Guidotti, L.; Negroni, D.; Sironi, L.; Stecco, A. Neural Correlates of Esophageal Speech: An fMRI Pilot Study. J. Voice 2022, 36, 288.e1–288.e14. [Google Scholar] [CrossRef] [PubMed]
- Doyle, P.C.; Damrose, E.J. Has Esophageal Speech Returned as an Increasingly Viable Postlaryngectomy Voice and Speech Rehabilitation Option? J. Speech Lang. Hear. Res. 2022, 65, 4714–4723. [Google Scholar] [CrossRef] [PubMed]
- Hong, S.-W.; Chan, R.W. Acoustic Analysis of Taiwanese Tones in Esophageal Speech and Pneumatic Artificial Laryngeal Speech. J. Speech Lang. Hear. Res. 2022, 65, 1215–1227. [Google Scholar] [CrossRef] [PubMed]
- Kresic, S.; Veselinovic, M.; Mumovic, G.; Mitrović, S.M. Possible factors of success in teaching esophageal speech. Med. Rev. 2015, 68, 5–9. [Google Scholar] [CrossRef]
- Sokal, W. Possibilities of Verbal Communication in Patients after Complete Removal of the Larynx. Ph.D. Dissertation, Poznan University of Medical Science, Poznań, Poland, 2011. [Google Scholar]
- Tyburek, K. Parameterisation of human speech after total laryngectomy surgery. Comput. Speech Lang. 2022, 72, 101313. [Google Scholar] [CrossRef]
- Ezzine, K.; Di Martino, J.; Frikha, M. Intelligibility Improvement of Esophageal Speech Using Sequence-to-Sequence Voice Conversion with Auditory Attention. Appl. Sci. 2022, 12, 7062. [Google Scholar] [CrossRef]
- Uloza, V.; Maskeliunas, R.; Pribuisis, K.; Vaitkus, S.; Kulikajevas, A.; Damasevicius, R. An Artificial Intelligence-Based Algorithm for the Assessment of Substitution Voicing. Appl. Sci. 2022, 12, 9748. [Google Scholar] [CrossRef]
- Zenga, J.; Goldsmith, T.; Bunting, G.; Deschler, D.G. State of the art: Rehabilitation of speech and swallowing after total laryngectomy. Oral Oncol. 2018, 86, 38–47. [Google Scholar] [CrossRef]
- Sinkiewicz, A. Laryngeal Cancer. In A Guide for Patients, Speech Therapists and Doctors; Polish Society of Laryngectomes; Polish Society of Otolaryngologists; Head and Neck Surgeons: Poznań, Poland, 1999. [Google Scholar]
- Amin, T.B.; Mahmood, I. Speech Recognitionusing Dynamic Time Warping. In Proceedings of the 2008 2nd International Conference on Advances in Space Technologies, Islamabad, Pakistan, 29–30 November 2008; pp. 74–79. [Google Scholar] [CrossRef]
- Vyas, M. A Gaussian Mixture Model Based Speech Recognition System Using Matlab. Signal Image Process. Int. J. 2013, 4, 109. [Google Scholar] [CrossRef]
- Patel, K.; Prasad, R.K. Speech Recognition and Verification Using MFCC & VQ. Int. J. Emerg. Sci. Eng. 2013, 1, 7. [Google Scholar]
- Shim, H.J.; Jang, H.R.; Shin, H.B.; Ko, D.H. Cepstral, Spectral and Time-Based Analysis of Voices of Esophageal Speakers. Folia PhoniatrLogop. 2015, 67, 90–96. [Google Scholar] [CrossRef] [PubMed]
- Lachhab, O.; Di Martino, J.; Elhaj, E.I.; Hammouch, A. A preliminary study on improving the recognition of esophageal speech using a hybrid system based on statistical voice conversion. Springerplus 2015, 4, 644. [Google Scholar] [CrossRef]
- Giannakopoulos, T.; Pikrakis, A. Introduction to Audio Analysis: A Matlab Approach; Academic Press Books—Elsevier: Amsterdam, The Netherlands, 2014. [Google Scholar]
- Tyburek, K.; Prokopowicz, P.; Kotlarz, P.; Repka, M. Comparison of the Efficiency of Time and Frequency Descriptors Based on Different Classification Conceptions. In Proceedings of the Artificial Intelligence and Soft Computing: 14th International Conference, ICAISC 2015, Zakopane, Poland, 14–18 June 2015. [Google Scholar]
- Tyburek, K.; Cudny, W.; Kosiński, W. Pizzicato sound analysis of selected instruments in the freguency domain. Image Process. Commun. 2006, 11, 53–57. [Google Scholar]
- Titze, I.R.; Sundberg, J. Vocal intensity in speakers and singers. J. Acoust. Soc. Amer. 1992, 91, 2936–2946. [Google Scholar] [CrossRef] [PubMed]
- Lindsay, A.T.; Burnett, I.; Quackenbush, S.; Jackson, M. Fundamentals of Audio Descriptions in Introduction to Mpeg-7: Multimedia Content Description Interface; Wiley and Sons Ltd.: Hoboken, NJ, USA, 2002; pp. 283–298. [Google Scholar]
- Tyburek, K.; Kotlarz, P. An expert system for automatic classification of sound signals. J. Telecommun. Inf. Technol. 2020, 2, 86–90. [Google Scholar] [CrossRef]
- Prokopowicz, P.; Mikołajewski, D.; Tyburek, K.; Mikołajewska, E. Computational gait analysis for post-stroke rehabilitation purposes using fuzzy numbers, fractal dimension and neural networks. Bull. Pol. Acad. Sci. Tech. Sci. 2020, 68, 191–198. [Google Scholar] [CrossRef]
- Marechal, C.; Mikołajewski, D.; Tyburek, K.; Prokopowicz, P.; Bougueroua, L.; Ancourt, C.; Węgrzyn-Wolska, K. Survey on AI-Based Multimodal Methods for Emotion Detection. In High-Performance Modelling and Simulation for Big Data Applications; Kołodziej, J., González-Vélez, H., Eds.; Lecture Notes in Computer Science; Springer: Cham, Switzerland, 2019; Volume 11400. [Google Scholar]
- Balemarthy, S.; Sajjanhar, A.; Zheng, J.X. Our Practice of Using Machine Learning to Recognize Species by Voice. arXiv 2018, arXiv:1810.09078. [Google Scholar]
- Fayek, H. Speech Processing for Machine Learning: Filter Banks, Mel-Frequency Cepstral Coefficients (mfccs) and What’s in between. Available online: https://haythamfayek.com/2016/04/21/speech-processing-for-machine-learning.html (accessed on 28 January 2023).
- Dobres, R.; Lee, L.; Stemple, J.C.; Kummer, A.W.; Kretschmer, L.W. Description of Laryngeal Pathologies in Children Evaluated by Otolaryngologists. J. Speech Hear. Disord. 1990, 55, 526–532. [Google Scholar] [CrossRef] [PubMed]
- Liu, H.; Wana, H.; Wang, S.; Wang, X. Acoustic characteristics of Mandarines ophagealspeech. J. Acoust. Soc. Am. 2005, 118, 1016. [Google Scholar] [CrossRef]
- Vojtech, J.M.; Chan, M.D.; Shiwani, B.; Roy, S.H.; Heaton, J.T.; Meltzner, G.S.; Contessa, P.; De Luca, G.; Patel, R.; Kline, J.C. Surface Electromyography-Based Recognition, Synthesis, and Perception of Prosodic Subvocal Speech. J. Speech Lang. Hear. Res. 2021, 64, 2134–2153. [Google Scholar] [CrossRef]
- Wang, H.; Roussel, P.; Denby, B. Improving ultrasound-based multimodal speech recognition with predictive features from representation learning. JASA Express Lett. 2021, 1, 015205. [Google Scholar] [CrossRef]
- Allegra, E.; La Mantia, I.; Bianco, M.R.; Drago, G.D.; Le Fosse, M.C.; Azzolina, A.; Grillo, C.; Saita, V. Verbal performance of Total laryngectomized patients rehabilitated with esophageal speech and tracheoesophageal speech: Impacts on patient quality of life. Psychol. Res. Behav. Manag. 2019, 12, 675–681. [Google Scholar] [CrossRef] [PubMed]
- Wszołek, W.; Modrzejewski, M.; Przysiężny, M. Acoustic analysis of esophageal speech in patients after tallaryngectomy. Arch. Acoust. 2014, 32, 151–158. [Google Scholar]
- Wamka, M.; Mackiewicz-Nartowicz, H.; Sinkiewicz, A. Nursing care of patients after laryngeal surgery. Surg. Angiol. Nurs. 2018, 4, 136–140. [Google Scholar]
- Mackiewicz-Nartowicz, H.; Mackiewicz-Milewska, M. Epidemiology, Etiology and Diagnosis of Laryngeal Cancer. In Patient after Larynx Surgery; Sinkiewicz, A., Ed.; Bydgoszcz Laryngectomy Association: Bydgoszcz, Poland, 2009. [Google Scholar]
- Botinis, A.; Granström, B.; Möbius, B. Developments and paradigms in intonationresearch. Speech Commun. 2001, 33, 263–296. [Google Scholar] [CrossRef]
- Tadeusiewicz, R. Signal of Speech; Publishing House of Communications: Warsaw, Poland, 1988. [Google Scholar]
- Sawicka, I. Phonology. In Grammar of Contemporary Polish. Phonetics and Phonology; Wrobel, H., Ed.; “Od Nowa” Publishing House: Cracow, Poland, 1995; pp. 105–195. [Google Scholar]
- Dłuska, M. Prosody of the Polish Language; PWN: Warsaw, Poland, 1976. [Google Scholar]
- Pruszewicz, A. On the classification of voice quality and substitute speech in laryngectomized patients. Otolaryngologia Polska 1975, 29, 487–491. [Google Scholar] [PubMed]
- Geertsema, A.A.; De Vries, M.P.; Schutte, H.K.; Lubbers, J.; Verkerke, G.J. In vitro measurements of aerodynamic characteristics of an improved tracheostoma valve for laryngectomees. Eur. Arch. Otorhinolaryngol. 1998, 255, 5, 244–249. [Google Scholar] [CrossRef]
- Hook, J.; Noroozi, F.; Toygar, O.; Anbarjafari, G. Automatic speech based emotion recognition using paralinguistics features. Bull. Pol. Acad. Sci. Tech. Sci. 2019, 67, 3. [Google Scholar] [CrossRef]
- Mik, Ł.; Lorenc, A.; Król, D.; Wielgat, R.; Święciński, R.; Jędryka, R. Fusing the electromagnetic articulograph, high-speed video cameras and a 16-channel microphone array for speech analysis. Bull. Pol. Acad. Sci. Tech. Sci. 2018, 66, 2018. [Google Scholar] [CrossRef]
- Freitas, J.; Teixeira, A.; Dias, M.S.; Silva, A. An Introduction to Silent Speech Interfaces. In SpringerBriefs in Speech Technology; Springer: Berlin/Heidelberg, Germany, 2017; ISBN 978-3-319-40173-7. [Google Scholar]
- Denby, B.; Csapó, T.G.; Wand, M. Future Speech Interfaces with Sensors and Machine Intelligence. Sensors 2023, 23, 1971. [Google Scholar] [CrossRef]
- Wand, M.; Himmelsbach, A.; Heistermann, T.; Janke, M.; Schultz, T. Artifact removal algorithm for an EMG-based Silent Speech Interface. In Proceedings of the 2013 35th Annual International Conference of the IEEE Engineering in Medicine and Biology Society (EMBC), Osaka, Japan, 3–7 July 2013. [Google Scholar] [CrossRef]
- Fagan, M.J.; Ell, S.R.; Gilbert, J.M.; Sarrazin, E.; Chapman, P.M. Development of a (silent) speech recognition system for patients following laryngectomy. Med. Eng. Phys. 2008, 30, 419–425. [Google Scholar] [CrossRef] [PubMed]
- Gonzales, M.G.; Backer, K.C.; Yan, Y.; Miller, L.M.; Bortfeld, H.; Shahin, A.J. Audition controls the flow of visual time during multisensory perception. iScience 2022, 25, 104671. [Google Scholar] [CrossRef] [PubMed]
- Gonzalez-Lopez, J.A.; Gomez-Alanis, A.; MartínDoñas, J.M.; Pérez-Córdoba, J.L.; Gomez, A.M. Silent Speech Interfaces for Speech Restoration: A Review. IEEE Access 2020, 8, 177995–178021. [Google Scholar] [CrossRef]
- Gonzalez, J.A.; Cheah, L.A.; Gilbert, J.M.; Bai, J.; Ell, S.R.; Green, D.; Moore, R.K. A silent speech system based on permanent magnet articulography and directsynthesis. Comput. Speech Lang. 2016, 39, 67–87. [Google Scholar] [CrossRef]
- Denby, B.; Schultz, T.; Honda, K.; Hueber, T.; Gilbert, J.M.; Brumberg, J.S. Silent speech interfaces. Speech Commun. 2010, 52, 270–287. [Google Scholar] [CrossRef]


| ZCR | STE | SMV | RMS | |
|---|---|---|---|---|
| Laryngectomized persons | ||||
| average | 431.67 | 251.13 | 0.034 | 0.181 |
| min | 169.00 | 113.40 | 0.016 | 0.126 |
| max | 621.00 | 376.75 | 0.055 | 0.234 |
| SD | 162.65 | 110.80 | 0.015 | 0.042 |
| Healthy persons | ||||
| average | 209.75 | 606.79 | 0.083 | 0.286 |
| min | 80.00 | 374.83 | 0.064 | 0.252 |
| max | 269.00 | 854.15 | 0.107 | 0.327 |
| SD | 87.37 | 209.28 | 0.018 | 0.031 |
| ZCR | STE | SMV | RMS | |
|---|---|---|---|---|
| Laryngectomized persons | ||||
| average | 543.67 | 152.25 | 0.039 | 0.187 |
| min | 214.00 | 37.93 | 0.012 | 0.110 |
| max | 916.00 | 398.20 | 0.078 | 0.280 |
| SD | 274.73 | 128.06 | 0.028 | 0.071 |
| Healthy persons | ||||
| average | 464.50 | 384.22 | 0.128 | 0.322 |
| min | 148.00 | 108.09 | 0.045 | 0.211 |
| max | 1311.00 | 908.49 | 0.350 | 0.591 |
| SD | 564.95 | 376.96 | 0.148 | 0.181 |
| ZCR | STE | SMV | RMS | |
|---|---|---|---|---|
| Laryngectomized persons | ||||
| average | 789.33 | 284.26 | 0.026 | 0.156 |
| min | 383.00 | 121.42 | 0.010 | 0.102 |
| max | 1217.00 | 625.81 | 0.043 | 0.207 |
| SD | 303.23 | 186.58 | 0.013 | 0.043 |
| Healthy persons | ||||
| average | 339.25 | 766.80 | 0.073 | 0.268 |
| min | 306.00 | 571.78 | 0.053 | 0.231 |
| max | 378.00 | 983.39 | 0.095 | 0.309 |
| SD | 38.13 | 225.05 | 0.019 | 0.036 |
| a | b | Classified as |
|---|---|---|
| 93.75 | 6.25 | a = laryngectomized |
| 6.25 | 93.75 | b = healthy |
| a | b | Classified as |
|---|---|---|
| 56.25 | 43.75 | a = laryngectomized |
| 31.25 | 68.75 | b = healthy |
| a | b | Classified as |
|---|---|---|
| 100 | 0 | a = laryngectomized |
| 25 | 75 | b = healthy |
| Br | Ir | |
|---|---|---|
| Laryngectomized persons | ||
| average | 115.645 | 3.79 |
| min | 96.463 | 3.67 |
| max | 129.080 | 3.83 |
| SD | 13.414 | 0.07 |
| Healthy persons | ||
| average | 124.615 | 3.84 |
| min | 118.576 | 3.84 |
| max | 132.847 | 3.85 |
| SD | 6.279 | 0.01 |
| Br | Ir | |
|---|---|---|
| Laryngectomized persons | ||
| average | 105.538 | 3.69 |
| min | 78.601 | 3.58 |
| max | 114.724 | 3.80 |
| SD | 15.127 | 0.10 |
| Healthy persons | ||
| average | 114.653 | 3.75 |
| min | 106.213 | 3.69 |
| max | 128.502 | 3.80 |
| SD | 12.089 | 0.06 |
| Br | Ir | |
|---|---|---|
| Laryngectomized persons | ||
| average | 112.193 | 3.74 |
| min | 99.956 | 3.68 |
| max | 120.649 | 3.83 |
| SD | 7.982 | 0.06 |
| Healthy persons | ||
| average | 146.588 | 3.81 |
| min | 123.233 | 3.78 |
| max | 159.358 | 3.86 |
| SD | 15.969 | 0.03 |
| a | b | Classified as |
|---|---|---|
| 43.75 | 56.25 | a = laryngectomized |
| 43.75 | 56.25 | b = healthy |
| a | b | Classified as |
|---|---|---|
| 43.75 | 56.25 | a = laryngectomized |
| 56.25 | 43.75 | b = healthy |
| a | b | Classified as |
|---|---|---|
| 100 | 0 | a = laryngectomized |
| 25 | 75 | b = healthy |
| Segment | Features Vector | General Recognition | Laryngectomized | Healthy | |||
|---|---|---|---|---|---|---|---|
| Correctly Classified | Incorrectly Classified | Correctly Classified | Incorrectly Classified | Correctly Classified | Incorrectly Classified | ||
| Seg 1 | MFCC (19 coefficients) | 79.42% | 20.58 % | 94.12% | 5.88% | 64.7% | 35.29% |
| Seg 2 | MFCC (19 coefficients) | 87.5% | 12.5% | 87.5% | 12.5% | 87.5% | 12.5% |
| Seg 3 | MFCC (19 coefficients) | 81.25% | 18.75% | 87.5% | 12.5% | 75% | 25% |
| Seg 1 | Cepstrum (40 features) | 84.4% | 15.6% | 93.75% | 6.25% | 75% | 25% |
| Seg 2 | Cepstrum (40 features) | 40.63% | 59.37% | 56.25% | 43.75% | 25% | 75% |
| Seg 3 | Cepstrum (40 features) | 62.5% | 37.5% | 62.5% | 37.5% | 62.5% | 37.5% |
| Seg 1 | local maximum distributions (6 features) | 85.7% | 14.3% | 71.43% | 28.57% | 100% | 0 |
| Seg 2 | local maximum distributions (3 features) | 64% | 36% | 61.54% | 38.46% | 66.66% | 33.33% |
| Seg 3 | local maximum distributions (6 features) | 81.25% | 18.75% | 62.5% | 37.5% | 100% | 0 |
| Seg 1 | local minimum distributions (6 features) | 57.15% | 42.85% | 50% | 50% | 64.3% | 35.7% |
| Seg 2 | local minimum distributions (3 features) | 75% | 25% | 83.33% | 16.66% | 66.66% | 33.33% |
| Seg 3 | local minimum distributions (6 features) | 81.25% | 18.75% | 62.5% | 37.5% | 100% | 0 |
| Seg 1 | ZCR features distributions (6 features) | 87.5% | 12.5% | 81.25% | 18.75% | 93.75 | 6.25% |
| Seg 2 | ZCR features distributions (3 features) | 60% | 40% | 66.66% | 33.33% | 53.33% | 46.66% |
| Seg 3 | ZCR features distributions (6 features) | 81.25% | 18.75% | 87.5% | 12.5% | 75% | 25% |
| Seg 1 | STE features distributions (6 features) | 68.75% | 31.25% | 62.5% | 37.5% | 75% | 25% |
| Seg 2 | STE features distributions (3 features) | 70.83% | 29.16% | 83.33% | 16.66% | 58.33% | 41.66% |
| Seg 3 | STE features distributions (6 features) | 81.25% | 18.75% | 87.5% | 12.5% | 75% | 25% |
| Seg 1 | SMV features distributions (6 features) | 75% | 25% | 75% | 25% | 75% | 25% |
| Seg 2 | SMV features distributions (3 features) | 63.33% | 36.66% | 66.66% | 33.33% | 60% | 40% |
| Seg 3 | SMV features distributions (6 features) | 81.25% | 18.25% | 87.5% | 12.5% | 75% | 25% |
| Seg 1 | RMS features distributions (6 features) | 78.13% | 21.87% | 68.75% | 31.25% | 87.5% | 12.5% |
| Seg 2 | RMS features distributions (3 features) | 63.33% | 36.66% | 66.66% | 33.33% | 60% | 40% |
| Seg 3 | RMS features distributions (6 features) | 81.25% | 18.75% | 87.5% | 12.5% | 75% | 25% |
| Seg 1 | Br features distribution (10 features) | 60% | 40% | 60% | 40% | 60% | 40% |
| Seg 2 | Br features distribution (4 features) | 63.33% | 36.66% | 66.66% | 33.33% | 60% | 40% |
| Seg 3 | Br features distribution (12 features) | 68.75% | 31.25% | 100% | 0% | 62.5% | 37.5% |
| Seg 1 | Ir features distribution (10 features) | 62.5% | 37.5% | 37.5% | 62.5% | 87.5% | 12.5% |
| Seg 2 | Ir features distribution (4 features) | 43.75% | 56.25% | 37.5% | 62.5% | 50% | 50% |
| Seg 3 | Ir features distribution (12 features) | 62.5% | 37.5% | 50% | 50% | 75% | 25% |
Disclaimer/Publisher’s Note: The statements, opinions and data contained in all publications are solely those of the individual author(s) and contributor(s) and not of MDPI and/or the editor(s). MDPI and/or the editor(s) disclaim responsibility for any injury to people or property resulting from any ideas, methods, instructions or products referred to in the content. |
© 2023 by the authors. Licensee MDPI, Basel, Switzerland. This article is an open access article distributed under the terms and conditions of the Creative Commons Attribution (CC BY) license (https://creativecommons.org/licenses/by/4.0/).
Share and Cite
Tyburek, K.; Mikołajewski, D.; Rojek, I. Analysis of Phonetic Segments of Oesophageal Speech in People Following Total Laryngectomy. Appl. Sci. 2023, 13, 4995. https://doi.org/10.3390/app13084995
Tyburek K, Mikołajewski D, Rojek I. Analysis of Phonetic Segments of Oesophageal Speech in People Following Total Laryngectomy. Applied Sciences. 2023; 13(8):4995. https://doi.org/10.3390/app13084995
Chicago/Turabian StyleTyburek, Krzysztof, Dariusz Mikołajewski, and Izabela Rojek. 2023. "Analysis of Phonetic Segments of Oesophageal Speech in People Following Total Laryngectomy" Applied Sciences 13, no. 8: 4995. https://doi.org/10.3390/app13084995