Article

Detection and Identification of Potato-Typical Diseases Based on Multidimensional Fusion Atrous-CNN and Hyperspectral Data

Department of Electric Power, Inner Mongolia University of Technology, Hohhot 010051, China
*
Author to whom correspondence should be addressed.
Appl. Sci. 2023, 13(8), 5023; https://doi.org/10.3390/app13085023
Submission received: 16 March 2023 / Revised: 8 April 2023 / Accepted: 12 April 2023 / Published: 17 April 2023
(This article belongs to the Special Issue Advances in Pests and Pathogens Treatment and Biological Control)

Abstract

:
As one of the world’s most crucial crops, the potato is an essential source of nutrition for human activities. However, several diseases pose a severe threat to the yield and quality of potatoes. Timely and accurate detection and identification of potato diseases are of great importance. Hyperspectral imaging has emerged as an essential tool that provides rich spectral and spatial distribution information and has been widely used in potato disease detection and identification. Nevertheless, the accuracy of prediction is often low when processing hyperspectral data using a one-dimensional convolutional neural network (1D-CNN). Additionally, conventional three-dimensional convolutional neural networks (3D-CNN) often require high hardware consumption while processing hyperspectral data. In this paper, we propose an Atrous-CNN network structure that fuses multiple dimensions to address these problems. The proposed structure combines the spectral information extracted by 1D-CNN, the spatial information extracted by 2D-CNN, and the spatial spectrum information extracted by 3D-CNN. To enhance the perceptual field of the convolution kernel and reduce the loss of hyperspectral data, null convolution is utilized in 1D-CNN and 2D-CNN to extract data features. We tested the proposed structure on three real-world potato diseases and achieved recognition accuracy of up to 0.9987. The algorithm presented in this paper effectively extracts hyperspectral data feature information using three different dimensional CNNs, leading to higher recognition accuracy and reduced hardware consumption. Therefore, it is feasible to use the 1D-CNN network and hyperspectral image technology for potato plant disease identification.

1. Introduction

As one of the most important food crops for humans, potato is a significant source of carbohydrates, vitamins, and minerals, with an annual production of up to 370 million tons [1,2], but because of the complex growing environment, potato is susceptible to diseases during growth [3]. For example, blackleg and soft tuber rot are significant bacterial diseases associated with potatoes worldwide [3,4,5]. These pathogens are plant-pathogenic bacteria from the genus Pectobacterium [3]. They produce enzymes that cause the decay of plant tissues [6], leading to damage to roots, stems, and leaves, resulting in a severe reduction in yield and storability [7,8,9,10]. Such bacteria can remain latent during plant growth until favorable conditions for their development, reproduction, and infection prevail [11]. Once pest and disease toxicity occur, they not only cause losses to agricultural production but also significantly impact human health and the ecological environment [12,13,14,15,16]. Therefore, timely and accurate detection and identification of potato diseases is essential to maintain crop yield and quality.
To detect crop disease, traditional methods are based on manual visual inspection and human empirical analysis, which cannot meet the need for rapid and accurate detection of potato diseases [17]. To accurately identify potato diseases and achieve disease control, management, and prevention, the most popular approach is to combine machine learning and image classification methods with multiple imaging techniques for disease detection of plants [18,19,20,21]. However, traditional image-based classification methods cannot identify diseases that are difficult to detect beyond RGB images because they only consider image information and lack depth data features [22].
Hyperspectral imaging has emerged as a crucial technique in recent years, providing valuable spectral and spatial information for potato disease detection and identification [23,24,25]. The combination of hyperspectral image techniques, preprocessing methods, and deep learning convolutional neural networks has proved effective in detecting potato late blight [26]. Other researchers have used multispectral image systems to detect plant growth in a noninvasive manner [27], while the Cube CNN SVM (CCS) method has been shown to improve spectral image classification by extracting high-level features directly from raw data [28]. Previous studies have also shown that 3D-CNN can achieve better classification accuracy than 2D-CNN without preprocessing [29]. Multiscale wavelets, combined with in-depth feature information extracted by 3D-CNN, can generate super-resolution hyperspectral images from low-resolution ones [30]. However, initial 3D-CNN networks tend to suffer from overfitting and higher training costs, necessitating more hardware resources and training time, resulting in poor generalization of the overall network model [31]. To address these issues, a combined 2D–3D model approach can extract both spatial and spectral features, resulting in better fusion features for hyperspectral image classification (HSIC) [32], while reducing the network structure parameters [33].
Computer vision application in agriculture has become an alternative solution to manual detection [34]. Polder et al. designed a hyperspectral line scan device for virus damage detection in different potatoes [35]. They demonstrated that a deep learning approach improved the accuracy of real-world potato disease detection. Hyperspectral imaging is a valuable tool for disease detection in various crops from different angles (tissue to canopy) [36]. Atherton et al. [37,38] used hyperspectral remote sensing to detect disease in potato plants; they only used spectral information but not imaging sensors. Ray et al. used a point-spectrum approach without considering spatial information [39]. Hu et al. successfully detected late blight on potato leaves using hyperspectral imaging to improve disease recognition [40]. Griffel et al. [41] used SVM to classify spectral features of potato plants infected with PVY obtained with a handheld device with recognition accuracy close to 90%. Kang et al. proposed a lightweight convolutional neural network model [42] that could identify potato leaves with three different diseases, reducing the number of parameters and improving accuracy. Shi et al. proposed a novel end-to-end deep learning model (CropdocNet) [43] for accurate and automated late blight diagnosis based on UAV-based hyperspectral images with an average accuracy of 98.09% on the test dataset. Gao et al. [44], based on high-resolution field-of-view images and deep learning algorithms to extract late blight spots from unstructured field environments, demonstrated that unbalanced weighting of lesion and background categories could improve segmentation performance. Qi et al. [45] proposed a deep collaborative attention network (PLB-2D-3D-A) by combining 2D convolutional neural network (2D-CNN) and 3D-CNN with a deep collaborative attention network (PLB-2D-3D-A) for hyperspectral deep learning classification architecture for images, showing promising results for early detection of potato late blight by deep learning and near-end hyperspectral imaging. Chen et al. [46] proposed a weakly supervised learning approach to identify potato plant diseases by extracting high-dimensional features through a hybrid attention mechanism.
Although potato disease detection technology has advanced significantly, there remain some challenges that impede the accurate and rapid identification of diseases. One such obstacle is the variety of potato diseases, which often present with similar symptoms, making them difficult to differentiate. Additionally, the complexity of diseases, which can result from a range of factors such as genetic and environmental conditions, further exacerbates this issue. Moreover, while 3D convolutional neural networks are commonly used for processing hyperspectral data, they are known to have high hardware requirements, and the accuracy of 1D convolutional neural networks for hyperspectral data is often suboptimal. Furthermore, numerous factors such as light, noise, distortion, and color changes present further challenges to disease detection, underscoring the need for increased algorithmic robustness and repeatability.
To address these issues, this paper proposes a novel network architecture that leverages 1D, 2D, and 3D convolutional neural networks [47] in a multidimensional fusion approach. The network uses dilated convolution [48,49,50] for feature extraction, which avoids data loss and increases the perceptual field compared to the conventional convolution-pooling layer in CNNs. The proposed convolutional operation in different dimensions takes full advantage of hyperspectral data’s spectral and spatial information, reducing network parameters and improving the model’s generalization and classification accuracy. The purpose of this paper is the following:
(1) To address the current problems of potato diseases that can cause serious harm to human health and crop yield and economic losses, we use deep learning technology to provide a new solution for detecting potato diseases to ensure their product and healthy growth. (2) By analyzing the existing technologies for potato disease detection, we innovatively propose a multidimensional fusion Atrous-CNN architecture to solve the problems of insufficient accuracy, low disease recognition rate, high hardware resource consumption, and data loss of current detection technologies. Testing the proposed model on multiple datasets confirmed that it has good detection capability and reduces hardware consumption, which to a large degree meets the current needs of potato disease detection.

2. Materials and Methods

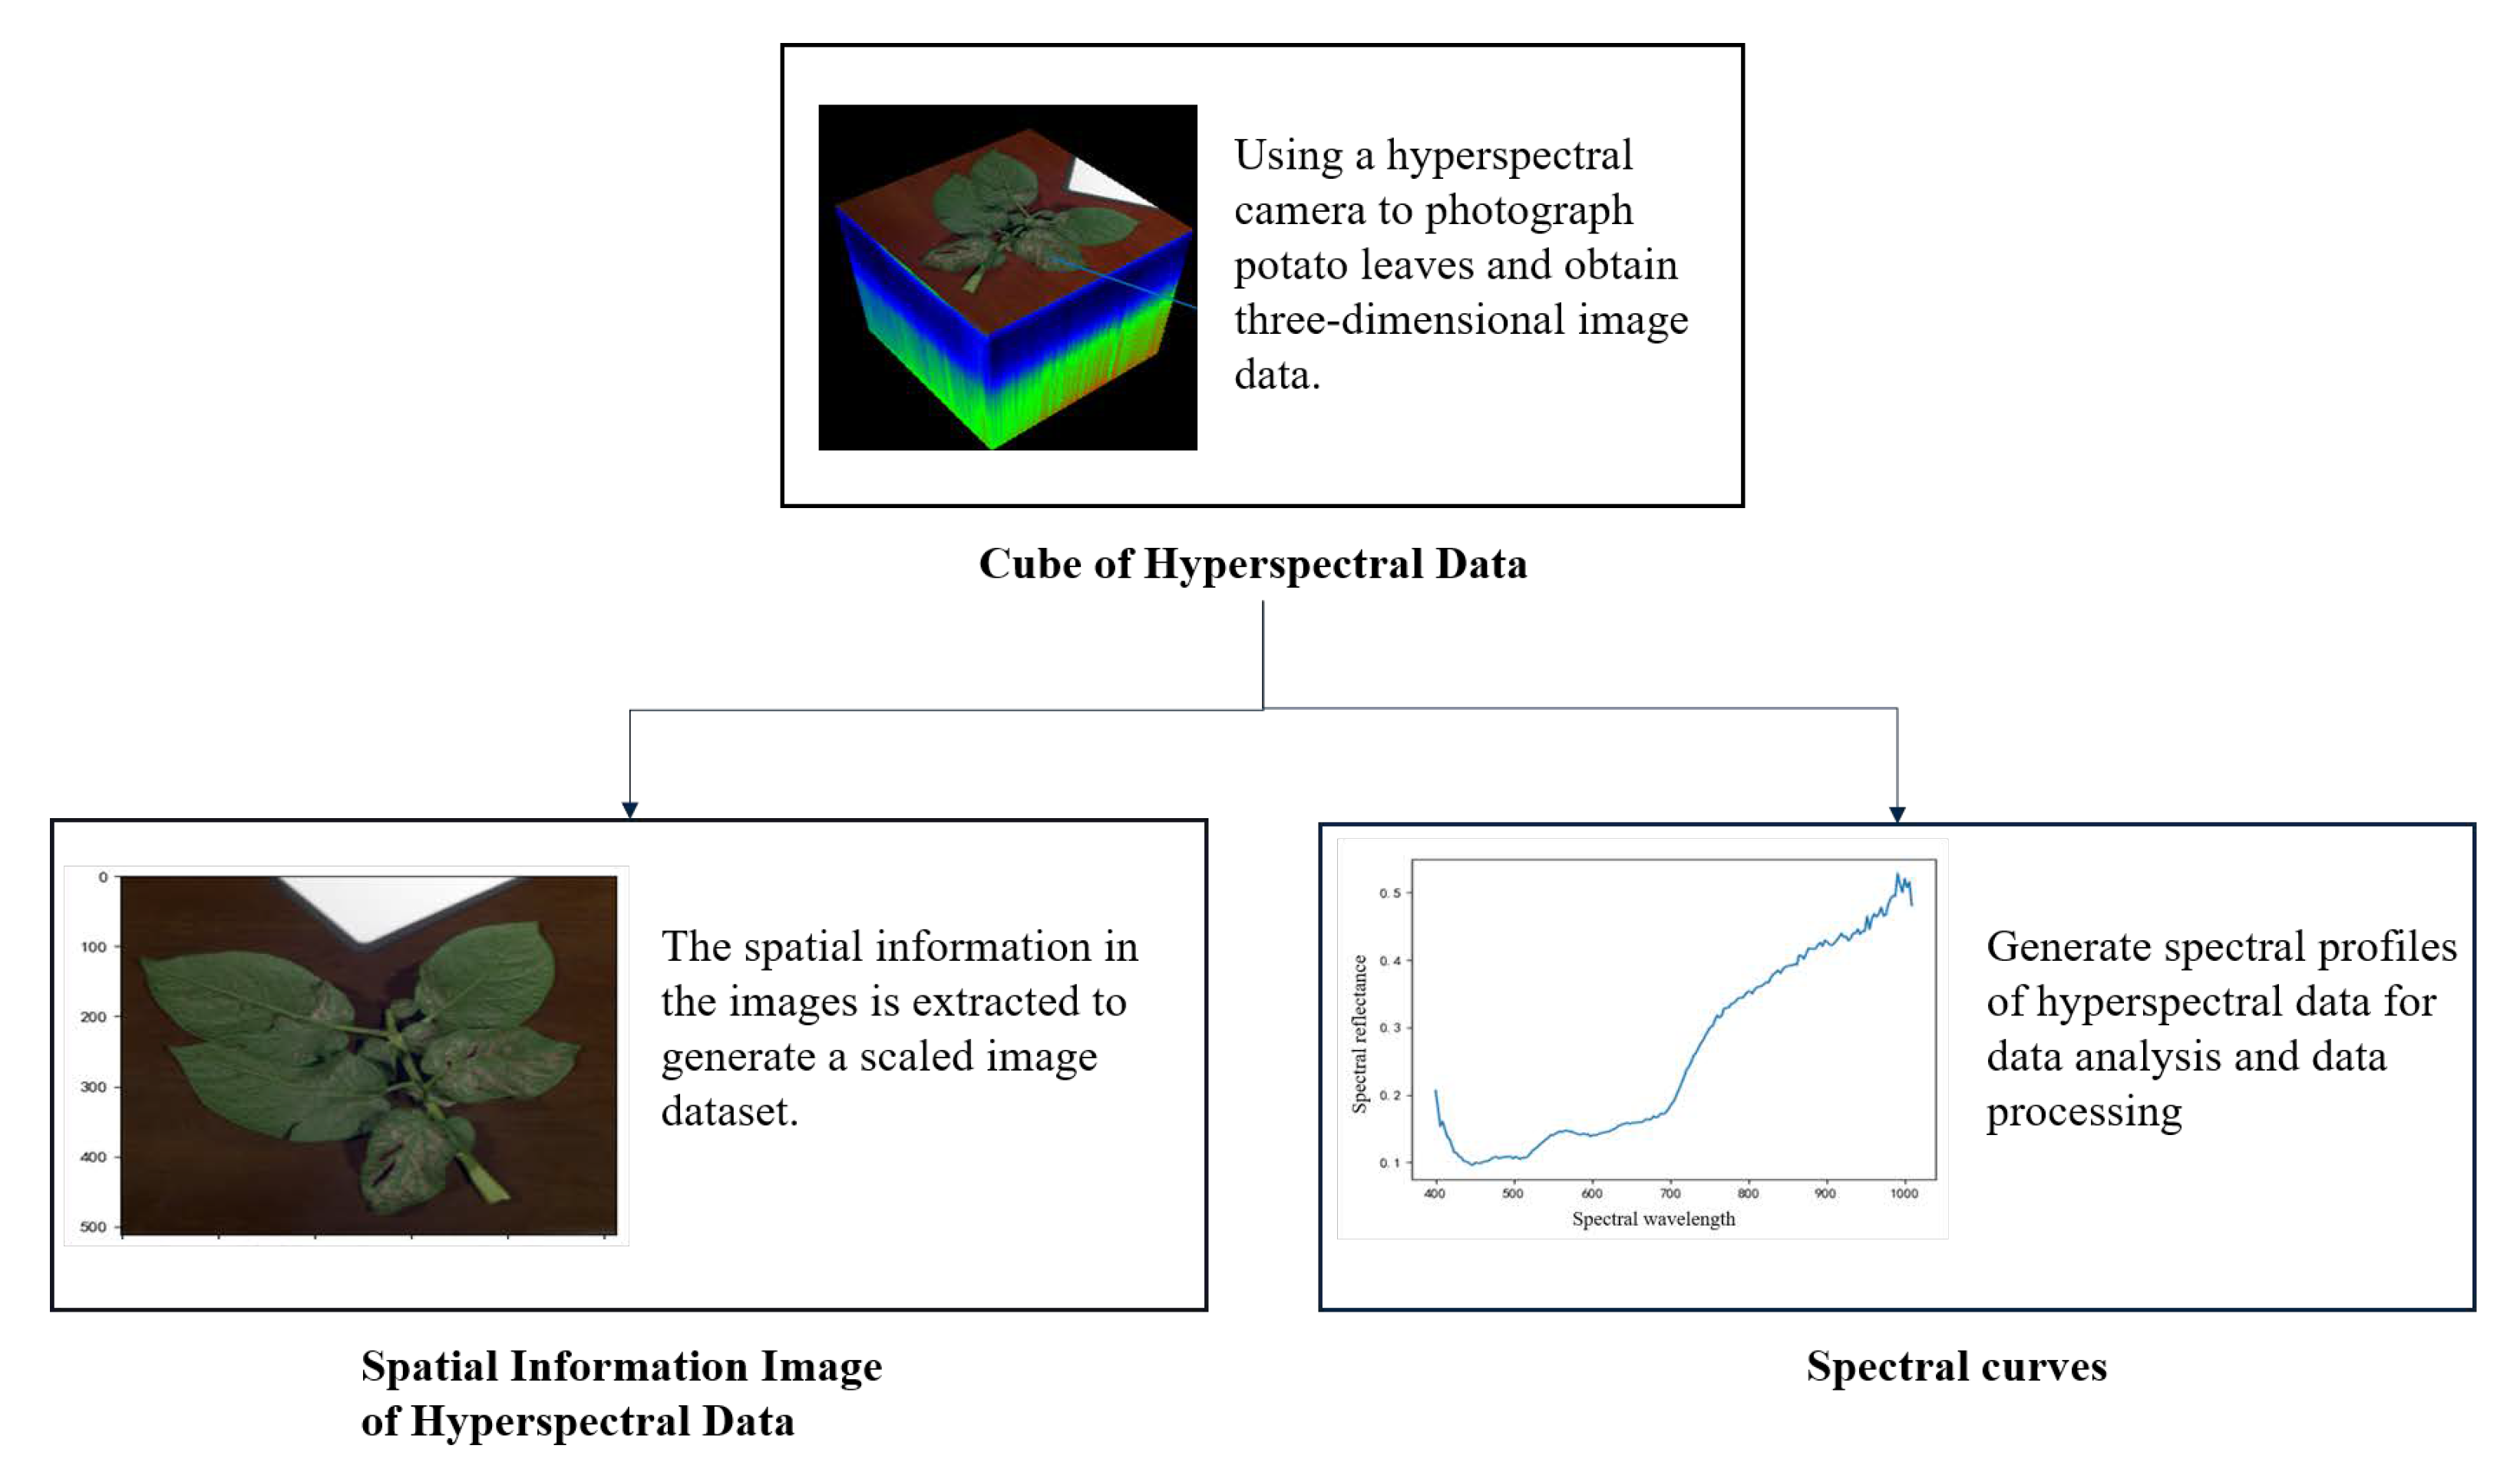
2.1. Data Acquisition and Preprocessing

The hyperspectral data were collected at the potato demonstration base of Chahar Right Wing Banner in Hohhot, and the camera used was a new handheld hyperspectral camera Specim IQ. The resolution of the hyperspectral camera was 512 × 512 pixels, and the total number of bands collected was 204, with a spectral range of 400–1000 nm and a spectral resolution of 7 nm. In this study, potato leaves were picked and photographed in the laboratory with the Specim IQ hyperspectral camera to address the problem that hyperspectral cameras are susceptible to environmental interference during photography. During the shooting, the white plate and the leaf were photographed simultaneously to eliminate the environmental mismatch, the integration time of the hyperspectral camera was adjusted to 5 ms, and the shooting height was 20 cm from the leaf height. A total of 126 hyperspectral potato disease data points, including 49 leaf blight, 28 anthracnoses, 7 early blight, and 42 mixed hyperspectral images of three different diseases, were obtained. For data with mixed pixels, the pixels within a region are labeled as the same category based on the artificial region calibration of the RGB image at the time of acquisition, so the data with mixed pixels will have multiple disease category labels. Still, these disease category labels will not be pursued for disease species when they belong to the same disease category at the first classification. When performing the disease category identification, the second classification task needs to be completed based on the specific disease category labels calibrated and combined with the determination of the corresponding spectral information found on the disease pixels. The potato disease leaves taken with the Specim IQ hyperspectral camera are shown in Figure 1.

2.2. Methods

2.2.1. Method of Label Category Selection

When using multidimensional Atrous-CNN for feature extraction, the input data size is (7 × 7 × 204), among which the hyperspectral data spatial information size is (7 × 7), and this size is beneficial to reducing the loss of edge feature data with the number of spectral information bands of 204. The label attributes are the categories of central pixel locations, as shown in Figure 2a.
In hyperspectral imaging technology, defining precise attributes at the edges of the data is often difficult, which poses a challenge to disease detection and identification. In order to solve this problem, this paper proposes a mirror extension method. This method mirrors the pixel values at the edges symmetrically and places the edge pixels at the center to extend the information of the data at the edges. The specific operation is shown in Figure 2b.
The specific implementation of the mirror extension method is accomplished by symmetrically complementing the neighboring pixel values of the pixels at the edges. Specifically, for the pixels at the edges, the complementary values are selected from their neighboring pixels closer in the distance and spectrally similar to the original pixels. Therefore, the complementary pixel values can better preserve the original pixels’ features and increase the amount of available information in the data.

2.2.2. Atrous-CNN

In a conventional CNN, convolution and pooling operations extract data features. However, due to downsampling in the pooling layer, some feature information of the data needs to be recovered. This problem is especially serious in hyperspectral data, which contains rich information, and pooling causes some information loss.
This paper proposes a new approach to solve this problem: using a null convolution layer instead of the conventional convolution pooling operation. The null convolution structure is very simple and based on the zero-padding principle in regular convolution. Compared with the regular convolutional layer, the hollow convolutional layer can maintain no loss of data information in the response layer and substantially increase the perceptual field of the convolutional computation.
The formula for calculating atrous convolution is as follows:
o [ i ] = j = 1 J f [ i + r · j ] w [ i ]
In this equation, f [ i ] stands for the input vector, o [ i ] for the value of the output vector o at position i. The dilation rate of the atrous convolution is r, the convolution size is w, and the total number of convolutions between the vectors f [ i ] and w is j. Formula (1) shows that the hole convolution is filled with r 1 times of 0 adjacent to the conventional convolution. When r is 1, the hole convolution is equivalent to the conventional convolution, indicating that there is no convolution expansion. The atrous convolution receptive field calculation formula is as follows:
F [ i ] = F [ i 1 ] + k 1 × S i 1 k = k + ( k 1 ) × ( d 1 ) S i = i = 1 i Stride i
where F [ i ] is the receptive field of the convolution kernel in the current convolution layer and k is the size of the convolution kernel, k represents the actual size of the convolution kernel after expansion, and the number of holes is d. The product of all previous layer steps is represented by S i , and the step size of each layer is represented by Stride.

2.2.3. Multidimensional Fusion Atrous-CNN

Figure 3 shows the multidimensional fusion Atrous-CNN structure, in which the hyperspectral size data (7 × 7 × 204) is input into the network model in the first step. In the second step, the “space-spectrum” features of the hyperspectral data are extracted using the 3D-CNN part, which includes three 3D convolutional layers and one 3D top pooling layer, where the size of the convolutional kernel in the 3D convolutional layer is (8 × 3 × 3 × 3). The size of the pooling window in the pooling layer is (2 × 2 × 4). The pooling step is (1,1,2). In the third step, the output of 3D-CNN is adjusted from (7 × 7 × 102 × 8) to (7 × 7 × 816), which is used as the input of 2D-CNN. Thus, 2D-CNN is used to extract spatial information from hyperspectral data using 2D-hole convolution, where the convolution kernel size in the 2D-hole convolution layer is (8 × 3 × 3) and the expansion rate of 2D-hole convolution is (2, 2). The fourth step is to adjust the output of the 2D-CNN part (3 × 3 × 8) to (72 × 1) as the input of the 1D-CNN part. The 1D-CNN performs feature extraction of the spectral information of the hyperspectral data using the 1D-hole convolution, where the size of the convolution kernel in the 1D-hole convolution is (16 × 3). The dilation rate of the 1D-hole convolution is 2. The fifth step is to tile the output of the 1D-CNN part. Output is tiled, expanded, and connected to the Dropout layer (20–22) to avoid overfitting the network model. Finally, the Dropout layer is connected to two fully connected layers (Dense). The activation function of the second Dense layer is set to Softmax and used as the output layer of the whole network. The distribution of specific network parameters is shown in Table 1.

2.2.4. Leaf Pixel Classification Based on Multidimensional Fusion Atrous-CNN

In conventional hyperspectral image processing, the conventional 1D-CNN network can only process the spectral information of hyperspectral data while ignoring the spatial information of hyperspectral data. Although 3D-CNN-based networks can synthesize hyperspectral data’s spatial and spectral information, the model structure is complex and requires high hardware consumption. Figure 4 shows the process of CNN fusion in three dimensions—1D-CNN, 2D-CNN, and 3D-CNN. The network can effectively utilize the feature information of hyperspectral data extracted from three different dimensional CNNs with higher recognition accuracy and can further reduce hardware consumption. In the data fusion process, this paper utilizes the reshape method to adjust the dimensionality of the data and achieves the fusion of the data by connecting the CNNs of two dimensions.
As shown in Figure 4, the multidimensional fusion Atrous-CNN makes full use of the spatial and spectral information of the hyperspectral data. In the 3D-CNN part, the “null-spectral” information of the hyperspectral data is extracted using the 3D convolution-pooling operation, with a feature size of (7 × 7 × 102) and many features of 8. In the 2D-CNN part, the hyperspectral data’s spatial information is extracted using the 2D-hole convolution operation with the feature size of (3 × 3) and the number of features of 8. In the 1D-CNN part, the spectral information of the hyperspectral data is extracted by using the 1D-hole convolution operation with a feature size of 68 and many features of 16.
Figure 5 shows the structural comparison of the three CNNs. As noted, 3D-CNN uses only 3D convolution (Conv3D) and 3D maximum pooling (MaxPooling3D) for feature extraction of hyperspectral data. Due to the large Conv3D computation with high hardware consumption during model training, the multidimensional fusion CNN and Atrous-CNN use 2D-CNN and 1D-CNN for feature extraction in the intermediate layer to reduce computational loss. Among the feature extraction methods in the middle layer, multidimensional fused CNN utilizes convolution-pooling operation and Multidimensional fusion Atrous-CNN with specific feature extraction capability. In the last two layers (D1, out) of the whole network, D1 acts as a fully connected layer to integrate and combine the features of the previous flattened layer spread out. Finally, the four neurons in the out layer correspond to the categories to which the four leaf pixels belong. Using the activation function softmax, the results of the four neurons can be processed as probability values between 0 and 1, and the one with the largest probability value is determined as the category to which they belong.

2.2.5. Disease Classification Method: 1D-CNN

The network structure and parameter distribution of the 1D-CNN network, which was utilized to classify Anthrax, leaf blight, and early blight, are given in Table 2. The multidimensional fusion’s identification of the sick area’s hyperspectral information (1 × 204). By applying the cubic convolution pooling procedure, Atrous-CNN is used to extract the spectral curve features of the diseased area. The flattened layer is then used for tile expansion and linkage with the Dense layer. Parameter 3 in the output layer represents model confidence for disease prediction.
This study takes potato leaves as the research object. The overall flow chart is shown in Figure 6. Firstly, its hyperspectral image information is obtained as input features by hyperspectral cameras. A mirror extension method is designed for the attribute definition of edge labels of the data. Regarding extracting the hyperspectral information features, the proposed multidimensional fusion Atrous-CNN utilizes 1D-Atrous-CNN, and 2D-Atrous-CNN instead of the traditional convolution-pooling for feature extraction, thus substantially increasing the perceptual field of convolutional computation while ensuring no loss of data information. The paper then uses multidimensional fusion Atrous-CNN to classify the hyperspectral information of potato leaves, achieving the extraction of disease regions for the subsequent identification of disease species.

3. Analysis of Experimental Results

For the method part, we use the dilated convolution layer instead of the conventional convolution pooling operation to solve the data loss problem in information extraction. We compare the standard convolution with the dilated convolution, as shown in Figure 7. By comparing the experimental results, using the dilated convolution layer can improve the efficiency of data feature extraction and increase the convolutional computational field while maintaining information integrity.
To better validate the detection performance of the proposed algorithm, the traditional 3D-CNN and multidimensional fusion CNN and multidimensional fusion Atrous-CNN are compared in training experiments. The total data volume is 262,144 (512 × 512), with 209,715 data in training set accounting for 80% of the total data and 52,429 data in the validation set accounting for 20% of the total data. The hardware environment is an Intel Xeon E5-2650 v4 processor, NVIDIA Tesla V100-PCIE-16GB graphics card, and 256G RAM. Figure 8 shows the training process of hyperspectral data disease detection of potato leaves using three network models. The training results show that the loss function of the training process using the proposed multidimensional Atrous-CNN model decreases faster and converges better than the other two network models. Furthermore, the accuracy of prediction using the multidimensional Atrous-CNN model is also significantly higher than the other two network models. The training performance of this method outperformed the other two models in both 100 and 500 training sessions.
Table 3 shows the comparative training results for classifying potato leaf hyperspectral image data using three network models: 3D-CNN, multidimensional fusion CNN, and multidimensional fusion Atrous-CNN. According to the training results, the training time of the 3D-CNN model is longer than that of the multidimensional CNN structure at 100 training times, the prediction accuracy of feature extraction using null convolution is higher than that of the traditional convolution-pooling operation, and the accuracy of the proposed multidimensional fusion Atrous-CNN model is improved by 0.69% over the multidimensional fusion CNN model in the validation set at 100 training times. The accuracy of the proposed multidimensional fusion Atrous-CNN model is improved by 0.69% compared to the multidimensional fusion CNN model in the validation set at 100 training cycles. The training time is significantly reduced compared to the 3D-CNN network. At 500 training cycles, the accuracy of all three network models for potato plant leaf disease classification improved with increasing training times on the training set performance. Among them, the accuracy of the training set using the multidimensional fusion Atrous-CNN method was as high as 99.78% after the 500th training. The accuracy of this method on the training set was improved by 0.6% compared to the 500th-training 3D-CNN method and by 0.21% compared to the multidimensional fusion CNN. In the validation set, the accuracy of this method improves by 0.15% compared to the training 500 times 3D-CNN method and 0.45% compared to the multidimensional fusion CNN method.
Table 4 shows the results of disease detection using three network models for potato hyperspectral data. The potato hyperspectral data included four types of hyperspectral images: normal leaf pixels, diseased leaf pixels, background pixels, and whiteboard pixels. The results showed the highest prediction accuracy of the four types of pixels using the multidimensional fusion Atrous-CNN model. The recognition accuracy of all types of pixels reached more than 99.7%. Among them, in recognizing diseased leaf pixels, the accuracy was improved by 7.09% compared with the 3D-CNN method and 1.7% compared with the multidimensional fusion CNN method. The results proved that recognizing diseased leaves using multidimensional fusion Atrous-CNN has high effectiveness. Regarding the recognition accuracy of total pixels, the recognition accuracy using the multidimensional fusion Atrous-CNN model improved by 0.51% compared with the 3D-CNN method and by 0.94% compared with the multidimensional fusion CNN method.
In order to evaluate the performance of the model independently of the data set, this study uses the k-fold cross-validation method to divide the hyperspectral data of the diseased pixels five times, that is, the k-fold cross-validation species k = 5, and the number of training sets for each division is 50,508. The number of test sets is 12,627. The data division is shown in Figure 9. This study trained the five-times-divided data with 1DCNN, SVM, gradient_boosting_model, and multinomial naive Bayesian classification. The evaluation results are shown in Table 5 and Figure 10. The average accuracy of k-fold cross-validation of 1DCNN. Compared with the polynomial naive Bayesian model, the accuracy rate increased by 0.3401. Compared with the gradient_boosting_model model, the accuracy rate increased by 0.0276 and the average accuracy rate of SVN increased by 0.047.
The proposed multidimensional fusion Atrous-CNN fuses 3D convolution with 2D-AtrousCNN and 1D-AtrousCNN, which can not only reduce the training parameters of the network but also ensure the model’s effective spatial feature extraction of hyperspectral data compared with the training of the classification task by processing hyperspectral data features entirely through the use of 3D convolution operation. The ability to extract the spatial characteristics of hyperspectral data is also ensured. Compared with the traditional 1D and 2D convolution pooling for feature extraction, the null convolution operation provides no loss of data information. It significantly increases the perceptual field of convolution calculation, which ensures the feature extraction capability of the model. From the spectral data classification performance of leaves, the classification results of hyperspectral data of potato leaves using the proposed algorithm in this paper are more accurate than the other two deep learning models, and the multidimensional fusion Atrous-CNN with cavity convolution is used to train the loss function to fall faster and converge better during the training process.
1DCNN uses convolutional operation for feature extraction, which can more effectively identify the deeper feature information of hyperspectral data than traditional machine learning methods. In the model’s training, the difference between predicted and accurate labels is used to construct the loss function, the gradient descent method minimizes the loss function, and the optimal model is finally obtained through continuous training. From the five tests of k-weight cross-validation, we can see that the potato disease identification model trained by 1DCNN has better accuracy than the three machine learning algorithms. It indicates that the deep learning network using convolutional operations is more effective for feature extraction of hyperspectral data and performs better in the task of spectral classification than the traditional machine learning methods using polynomial and kernel techniques.
After k-fold cross-validation, this study re-divided the data set. The number of training sets was 47,352, including 11,782 pieces of spectral information of anthracnose leaves, 25,402 pieces of spectral information of leaf blight leaves, and 10,168 pieces of spectral information of early blight leaves information. The number of test sets is 15,784, including 3957 pieces of spectral information of anthracnose leaves, 8595 pieces of spectral information of leaf blight leaves, and 3232 pieces of spectral information of early blight leaves. Figure 11 shows the confusion matrix of the prediction results of the three diseases using the 1D-CNN network. The marked position is the number of disease categories correctly identified using the spectral information of the diseased leaves using the 1D-CNN. Table 6 shows the classification accuracy and recall rate of the three diseases calculated using the confusion matrix. The accuracy and recall rates of the three diseases in the training set using the 1D-CNN network are above 0.99. In the test set, the recognition accuracy rates of the three diseases were all above 0.98, among which the recognition accuracy rate of anthracnose reached 0.9987, and the recognition recall rates of the three disease test sets were all above 0.97, of which for the anthracnose and leaf blight, the recognition recall rate was above 0.99. In summary, using the 1D-CNN network and hyperspectral image technology to identify potato plant diseases is feasible.
Figure 12 shows the detection results of potato leaves with three anthracnose diseases, leaf blight, and early blight, using multidimensional fusion Atrous-CNN. The results show that this method can effectively extract the characteristic information of hyperspectral data and realize the accurate detection of potato leaf diseases.
In the two classification processes mentioned above, we classified four categories of healthy leaf pixels, diseased leaf pixels, background pixels, and whiteboard pixels, and the other for three diseases, respectively. The latter of these classifications is based on the classification task for the former. We labeled diseased leaf pixels from the first classification result as a new object of study. We performed a secondary classification using 1DCNN in combination with the hyperspectral number of diseased leaf pixels. Both varieties use the hyperspectral data of the leaves. However, because the four categories of objects on the leaves—healthy leaf pixels, diseased leaf pixels, background pixels, and whiteboard pixels—have specific regional connectivity and need to consider the influence of the spectral information of the pixels in their neighborhood, the structure of the network is enriched by considering the spatial, spectral data in the first classification. The second classification does not influence surrounding pixels, and the variety is predicted only based on the tremendous spectral details of the diseased pixels of the leaves.

4. Conclusions

In this paper, we propose a multidimensional fusion-based Atrous-CNN network structure and use the method to achieve disease detection and identification of potato hyperspectral images. The technique integrates hyperspectral data’s spatial and spectral information for analysis, effectively reducing the network’s computational cost compared with the traditional 3D-CNN. Since the network fuses multiple dimensional convolutions and uses null convolution to increase the perceptual field of the convolution kernel, it reduces the loss of hyperspectral data information. It makes the extracted spectral features more expressive, which in turn improves the performance of the classification of hyperspectral data. In this paper, Atrous-CNN is applied to potato leaf disease detection. The experimental results show that the proposed method has better classification results than the single 3D-CNN and the traditional method using convolution-pooling operation feature extraction and is an effective network structure for classification and feature extraction of hyperspectral data. Finally, combined with the use of the 1D-CNN network to classify and identify three types of diseases, anthracnose, leaf blight, and early blight leaves, the recognition accuracy of this structure is up to 0.9987. Therefore, this study can be a heuristic method for researchers to design crop disease detection and identification models and provide new solutions for the field.
The model proposed in this paper effectively solves the common problems in current agricultural disease image detection and has broad application prospects in precision agriculture and agricultural industry efficiency. Future work will expand this area of research to include more complex agrarian scenarios.

Author Contributions

Conceptualization, W.G.; methodology, Z.X.; software, W.G.; validation, T.B. and W.G.; formal analysis, Z.X.; Resources, Z.X.; writing—original draft preparation, W.G.; writing— review and editing, W.G. and T.B.; supervision, Z.X. and W.G. All authors have read and agreed to the published version of the manuscript.

Funding

This research was funded by National Natural Science Foundation of China [China] (61661042), Natural Science Foundation of Inner Mongolia [China] (2021GG0345), Natural Science Foundation of Inner Mongolia Autonomous Region [China] (2021MS06020).

Institutional Review Board Statement

Not applicable.

Informed Consent Statement

Not applicable.

Data Availability Statement

Datasets can be accessed upon request to the corresponding author.

Acknowledgments

The authors would like to appreciate all reviewers for their insightful comments and constructive suggestions to polish this paper’s in high quality.

Conflicts of Interest

The authors declare that there are no conflict of interest regarding the publication of this paper.

References

  1. Zhang, H.; Fen, X.; Yu, W.; Hu, H.H.; Dai, X.F. Progress of potato staple food research and industry development in China. J. Integr. Agric. 2017, 16, 2924–2932. [Google Scholar] [CrossRef]
  2. Bruckner, M.; Wood, R.; Moran, D.; Kuschnig, N.; Wieland, H.; Maus, V.; Börner, J. FABIO—The construction of the food and agriculture biomass input–output model. Environ. Sci. Technol. 2019, 53, 11302–11312. [Google Scholar] [CrossRef] [PubMed]
  3. Charkowski, A.; Sharma, K.; Parker, M.L.; Secor, G.A.; Elphinstone, J. Bacterial diseases of potato. In The Potato Crop: Its Agricultural, Nutritional and Social Contribution to Humankind; Springer Nature: Berlin/Heidelberg, Germany, 2020; pp. 351–388. [Google Scholar]
  4. Waleron, M.; Misztak, A.; Jońca, J.; Waleron, K. First report of Pectobacterium polaris causing soft rot of potato in Poland. Plant Dis. 2019, 103, 144. [Google Scholar] [CrossRef]
  5. Bergsma-Vlami, M.; Saddler, G.; Hélias, V.; Tsror, L.; Yedida, I.; Pirhonen, M.; Degefu, Y.; Tuomisto, J.; Lojkowska, E.; Li, S.; et al. Assessment of Dickeya and Pectobacterium spp. on Vegetables and Ornamentals (Soft Rot); Zenodo: Honolulu, HI, USA, 2020. [Google Scholar]
  6. Hadizadeh, I.; Peivastegan, B.; Hannukkala, A.; Van der Wolf, J.; Nissinen, R.; Pirhonen, M. Biological control of potato soft rot caused by Dickeya solani and the survival of bacterial antagonists under cold storage conditions. Plant Pathol. 2019, 68, 297–311. [Google Scholar] [CrossRef]
  7. Stark, J.C.; Thornton, M.; Nolte, P. Potato Production Systems; Springer Nature: Berlin/Heidelberg, Germany, 2020. [Google Scholar]
  8. Shukla, A.; Ratan, V. Management of Early Blight of Potato by Using Different Bioagents as Tuber Dressing and its Effect on Germination and Growth. Int. J. Curr. Microbiol. Appl. Sci. 2019, 8, 1965–1970. [Google Scholar] [CrossRef]
  9. Landschoot, S.; Vandecasteele, M.; De Baets, B.; Höfte, M.; Audenaert, K.; Haesaert, G. Identification of A. arborescens, A. grandis, and A. protenta as new members of the European Alternaria population on potato. Fungal Biol. 2017, 121, 172–188. [Google Scholar] [CrossRef]
  10. Abuley, I.K.; Hansen, J.G. An epidemiological analysis of the dilemma of plant age and late blight (Phytophthora infestans) susceptibility in potatoes. Eur. J. Plant Pathol. 2021, 161, 645–663. [Google Scholar] [CrossRef]
  11. Degefu, Y. Co-occurrence of latent Dickeya and Pectobacterium species in potato seed tuber samples from northern Finland: Co-colonization of latent Dickeya and Pectobacterium species in potato seed lots. Agric. Food Sci. 2021, 30, 1–7. [Google Scholar] [CrossRef]
  12. Meno, L.; Escuredo, O.; Rodríguez-Flores, M.S.; Seijo, M.C. Looking for a sustainable potato crop. Field assessment of early blight management. Agric. For. Meteorol. 2021, 308, 108617. [Google Scholar] [CrossRef]
  13. Peters, R.; Sturz, A.; Carter, M.; Sanderson, J. Influence of crop rotation and conservation tillage practices on the severity of soil-borne potato diseases in temperate humid agriculture. Can. J. Soil Sci. 2004, 84, 397–402. [Google Scholar] [CrossRef]
  14. Adolf, B.; Andrade-Piedra, J.; Bittara Molina, F.; Przetakiewicz, J.; Hausladen, H.; Kromann, P.; Lees, A.; Lindqvist-Kreuze, H.; Perez, W.; Secor, G.A. Fungal, oomycete, and plasmodiophorid diseases of potato. In The Potato Crop: Its Agricultural, Nutritional and Social Contribution to Humankind; Springer Nature: Berlin/Heidelberg, Germany, 2020; pp. 307–350. [Google Scholar]
  15. Kolychikhina, M.; Beloshapkina, O.; Phiri, C. Change in potato productivity under the impact of viral diseases. IOP Conf. Ser. Earth Environ. Sci. 2021, 663, 012035. [Google Scholar] [CrossRef]
  16. Garhwal, A.S.; Pullanagari, R.R.; Li, M.; Reis, M.M.; Archer, R. Hyperspectral imaging for identification of Zebra Chip disease in potatoes. Biosyst. Eng. 2020, 197, 306–317. [Google Scholar] [CrossRef]
  17. Iftikhar, S.; Shahid, A.A.; Halim, S.A.; Wolters, P.J.; Vleeshouwers, V.G.; Khan, A.; Al-Harrasi, A.; Ahmad, S. Discovering novel Alternaria solani succinate dehydrogenase inhibitors by in silico modeling and virtual screening strategies to combat early blight. Front. Chem. 2017, 5, 100. [Google Scholar] [CrossRef] [PubMed]
  18. Chen, L.; Yin, X. Image recognition of typical potato diseases and insect pests using deep learning. Fresenius Environ. Bull. 2021, 30, 9956–9965. [Google Scholar]
  19. Gold, K.M.; Townsend, P.A.; Herrmann, I.; Gevens, A.J. Investigating potato late blight physiological differences across potato cultivars with spectroscopy and machine learning. Plant Sci. 2020, 295, 110316. [Google Scholar] [CrossRef]
  20. Zheng, C.; Abd-Elrahman, A.; Whitaker, V. Remote sensing and machine learning in crop phenotyping and management, with an emphasis on applications in strawberry farming. Remote Sens. 2021, 13, 531. [Google Scholar] [CrossRef]
  21. Singh, A.; Kaur, H. Potato plant leaves disease detection and classification using machine learning methodologies. IOP Conf. Ser. Mater. Sci. Eng. 2021, 1022, 012121. [Google Scholar] [CrossRef]
  22. Iqbal, M.A.; Talukder, K.H. Detection of potato disease using image segmentation and machine learning. In Proceedings of the 2020 International Conference on Wireless Communications Signal Processing and Networking (WiSPNET), Chennai, India, 4–6 August 2020; pp. 43–47. [Google Scholar]
  23. Teke, M.; Deveci, H.S.; Haliloğlu, O.; Gürbüz, S.Z.; Sakarya, U. A short survey of hyperspectral remote sensing applications in agriculture. In Proceedings of the 2013 6th International Conference on Recent Advances in Space Technologies (RAST), Istanbul, Turkey, 12–14 June 2013; pp. 171–176. [Google Scholar]
  24. Agilandeeswari, L.; Prabukumar, M.; Radhesyam, V.; Phaneendra, K.L.B.; Farhan, A. Crop classification for agricultural applications in hyperspectral remote sensing images. Appl. Sci. 2022, 12, 1670. [Google Scholar] [CrossRef]
  25. Sulaiman, N.; Che’Ya, N.N.; Mohd Roslim, M.H.; Juraimi, A.S.; Mohd Noor, N.; Fazlil Ilahi, W.F. The application of Hyperspectral Remote Sensing Imagery (HRSI) for weed detection analysis in rice fields: A review. Appl. Sci. 2022, 12, 2570. [Google Scholar] [CrossRef]
  26. Zhang, F.; Li, X.; Qiu, S.; Feng, J.; Wang, D.; Wu, X.; Cheng, Q. Hyperspectral imaging combined with convolutional neural network for outdoor detection of potato diseases. In Proceedings of the 2021 6th International Symposium on Computer and Information Processing Technology (ISCIPT), Changsha, China, 11–13 June 2021; pp. 846–850. [Google Scholar]
  27. Martinez-Nolasco, C.; Padilla-Medina, J.A.; Nolasco, J.J.M.; Guevara-Gonzalez, R.G.; Barranco-Gutiérrez, A.I.; Diaz-Carmona, J.J. Non-Invasive Monitoring of the Thermal and Morphometric Characteristics of Lettuce Grown in an Aeroponic System through Multispectral Image System. Appl. Sci. 2022, 12, 6540. [Google Scholar] [CrossRef]
  28. Leng, J.; Li, T.; Bai, G.; Dong, Q.; Dong, H. Cube-CNN-SVM: A novel hyperspectral image classification method. In Proceedings of the 2016 IEEE 28th International Conference on Tools with Artificial Intelligence (ICTAI), San Jose, CA, USA, 6–8 November 2016; pp. 1027–1034. [Google Scholar]
  29. Li, Y.; Zhang, H.; Shen, Q. Spectral–spatial classification of hyperspectral imagery with 3D convolutional neural network. Remote Sens. 2017, 9, 67. [Google Scholar] [CrossRef]
  30. Yang, J.; Zhao, Y.Q.; Chan, J.C.W.; Xiao, L. A multi-scale wavelet 3D-CNN for hyperspectral image super-resolution. Remote Sens. 2019, 11, 1557. [Google Scholar] [CrossRef]
  31. Firat, H.; Hanbay, D. Classification of hyperspectral images using 3d cnn based resnet50. In Proceedings of the 2021 29th Signal Processing and Communications Applications Conference (SIU), Istanbul, Turkey, 9–11 June 2021; pp. 1–4. [Google Scholar]
  32. Sabokrou, M.; Fayyaz, M.; Fathy, M.; Klette, R. Deep-cascade: Cascading 3d deep neural networks for fast anomaly detection and localization in crowded scenes. IEEE Trans. Image Process. 2017, 26, 1992–2004. [Google Scholar] [CrossRef]
  33. Yu, C.; Han, R.; Song, M.; Liu, C.; Chang, C.I. A simplified 2D-3D CNN architecture for hyperspectral image classification based on spatial–spectral fusion. IEEE J. Sel. Top. Appl. Earth Obs. Remote Sens. 2020, 13, 2485–2501. [Google Scholar] [CrossRef]
  34. Bechar, A.; Vigneault, C. Agricultural robots for field operations: Concepts and components. Biosyst. Eng. 2016, 149, 94–111. [Google Scholar] [CrossRef]
  35. Polder, G.; Blok, P.M.; Villiers, H.; Wolf, J.; Kamp, J. Potato Virus Y Detection in Seed Potatoes Using Deep Learning on Hyperspectral Images. Front. Plant Sci. 2019, 10, 209. [Google Scholar] [CrossRef] [PubMed]
  36. Thomas, S.; Kuska, M.T.; Bohnenkamp, D.; Brugger, A.; Alisaac, E.; Wahabzada, M.; Behmann, J.; Mahlein, A.K. Benefits of hyperspectral imaging for plant disease detection and plant protection: A technical perspective. J. Plant Dis. Prot. New Ser. 2018, 125, 5–20. [Google Scholar] [CrossRef]
  37. Atherton, D.; Watson, D.G.; Zhang, M.; Qin, Z.; Liu, X. Hyperspectral Spectroscopy for Detection of Early Blight (Alternaria solani) Disease in Potato (Solanum tuberosum) Plants at Two Different Growth Stages. In Proceedings of the 2015 ASABE Annual International Meeting, New Orleans, LA, USA, 26–29 July 2015. [Google Scholar]
  38. Atherton, D.; Choudhary, R.; Watson, D. Hyperspectral Remote Sensing for Advanced Detection of Early Blight (Alternaria solani) Disease in Potato (Solanum tuberosum) Plants. In Proceedings of the 2017 ASABE Annual International Meeting Spokane, Washington, DC, USA, 16–19 July 2017. [Google Scholar]
  39. Ray, S.S.; Jain, N.; Arora, R.K.; Chavan, S.; Panigrahy, S. Utility of Hyperspectral Data for Potato Late Blight Disease Detection. J. Indian Soc. Remote Sens. 2011, 39, 161–169. [Google Scholar] [CrossRef]
  40. Hu, Y.H.; Ping, X.W.; Xu, M.Z.; Shan, W.X.; He, Y. Detection of Late Blight Disease on Potato Leaves Using Hyperspectral Imaging Technique. Spectrosc. Spec. Anal. 2016, 36, 515–519. [Google Scholar]
  41. Griffel, L.M.; Delparte, D.; Edwards, J. Using Support Vector Machines classification to differentiate spectral signatures of potato plants infected with Potato Virus Y. Comput. Electron. Agric. 2018, 153, 318–324. [Google Scholar] [CrossRef]
  42. Kang, F.; Li, J.; Wang, C.; Wang, F. A Lightweight Neural Network-Based Method for Identifying Early-Blight and Late-Blight Leaves of Potato. Appl. Sci. 2023, 13, 1487. [Google Scholar] [CrossRef]
  43. Shi, Y.; Han, L.; Kleerekoper, A.; Chang, S.; Hu, T. A Novel CropdocNet for Automated Potato Late Blight Disease Detection from the Unmanned Aerial Vehicle-based Hyperspectral Imagery. arXiv 2021, arXiv:2107.13277. [Google Scholar] [CrossRef]
  44. Gao, J.; Westergaard, J.C.; Sundmark, E.; Bagge, M.; Alexandersson, E. Automatic late blight lesion recognition and severity quantification based on field imagery of diverse potato genotypes by deep learning. Knowl.-Based Syst. 2021, 214, 106723. [Google Scholar] [CrossRef]
  45. Qi, C.; Sandroni, M.; Westergaard, J.C.; Sundmark, E.; Bagge, M.; Alexandersson, E.; Gao, J. In-field early disease recognition of potato late blight based on deep learning and proximal hyperspectral imaging. arXiv 2021, arXiv:2111.12155. [Google Scholar] [CrossRef]
  46. Chen, J.; Deng, X.; Wen, Y.; Chen, W.; Zeb, A.; Zhang, D. Weakly-supervised learning method for the recognition of potato leaf diseases. In Artificial Intelligence Review; Springer Nature: Berlin/Heidelberg, Germany, 2022; pp. 1–18. [Google Scholar]
  47. Chen, Y. Convolutional Neural Network for Sentence Classification. Master’s Thesis, University of Waterloo, Waterloo, ON, Canada, 2015. [Google Scholar]
  48. Huang, Y.; Wang, Q.; Jia, W.; Lu, Y.; Li, Y.; He, X. See more than once: Kernel-sharing atrous convolution for semantic segmentation. Neurocomputing 2021, 443, 26–34. [Google Scholar] [CrossRef]
  49. Chen, L.C.; Papandreou, G.; Schroff, F.; Adam, H. Rethinking atrous convolution for semantic image segmentation. arXiv 2017, arXiv:1706.05587. [Google Scholar]
  50. Qiao, S.; Chen, L.C.; Yuille, A. Detectors: Detecting objects with recursive feature pyramid and switchable atrous convolution. In Proceedings of the IEEE/CVF Conference on Computer Vision and Pattern Recognition, Nashville, TN, USA, 20–25 June 2021; pp. 10213–10224. [Google Scholar]
Figure 1. Hyperspectral image of potato diseased leaves.
Applsci 13 05023 g001
Figure 2. Label category selection for hyperspectral data.
Applsci 13 05023 g002
Figure 3. Multidimensional fusion of Atrous-CNN.
Applsci 13 05023 g003
Figure 4. Leafpixel classification based on multidimensional fusion of Atrous-CNN.
Applsci 13 05023 g004
Figure 5. Comparison of three CNN structures.
Applsci 13 05023 g005
Figure 6. Overall flow chart.
Applsci 13 05023 g006
Figure 7. Standard Convolution and Hole Convolution.
Applsci 13 05023 g007
Figure 8. Loss function and accuracy of three network model training.
Applsci 13 05023 g008
Figure 9. Data partition diagram.
Applsci 13 05023 g009
Figure 10. Comparison of evaluation results.
Applsci 13 05023 g010
Figure 11. Confusion matrix of the three disease identification results using 1D-CNN.
Applsci 13 05023 g011
Figure 12. Disease detection through multidimensional fusion of Atrous-CNN.
Applsci 13 05023 g012
Table 1. Multidimensional fusion of Atrous-CNN structure.
LayerTypeOutput ShapeParamConnected to
inputInputLayer(None, 7, 7, 204, 1)0
Conv3_1Conv3D(None, 7, 7, 204, 8)224input
Conv3_2Conv3D(None, 7, 7, 204, 8)1736Conv3_1
Conv3_3Conv3D(None, 7, 7,204, 8)1736Conv3_2
PoolMaxPooling3D(None, 7, 7, 102, 8)0Conv3_3
reshape1Reshape(None, 7, 7, 816)0Pool3
Conv2Conv2D(None, 3, 3, 8)58, 760reshape1
reshape2Reshape(None, 72, 1)0Conv2
Conv1Conv1D(None, 68, 16)64reshape2
flattenFlatten(None, 1088)0Conv1
DropoutDropout(None, 1088)0flatten
D1Dense(None, 50)54,450Dropout
outDense(None, 4)204D1
Table 2. 1D-CNN network structure.
LayerTypeOutput ShapeParamConnected to
inputInputLayer(None, 1, 204, 1)0
Conv1_1Conv1D(None, 204, 32)224input
Pool1MaxPooling1D(None, 51, 32)0Conv1_1
Conv2_1Conv1D(None, 51, 64)12,352Pool1
Pool2MaxPooling1D(None, 26, 64)0Conv2_1
Conv3_1Conv1D(None, 26, 128)49,280Pool2
Pool3MaxPooling1D(None, 13, 128)0Conv3_1
flattenFlatten(None, 1664)0Pool3
D1Dense(None, 128)213,120flatten
outDense(None, 3)387D1
Table 3. Training results of three network models.
DatasetsAssessment MetricsModels
3D-CNNMultidimensional Fusion CNNMultidimensional Fusion Atrous-CNN
Train-100
Time-1002:15:502:02:112:07:57
TrainLoss-1000.02590.02010.0141
Precision-10098.92%99.16%99.41%
ValLoss-1000.02310.03360.0233
Precision-10099.07%98.44%99.13%
Train-500
Time-50011:42:4010:52:1310:59:43
TrainLoss-5000.01950.01060.0054
Precision-50099.18%99.57%99.78%
ValLoss-5000.02140.02540.0226
Precision-50099.16%98.86%99.31%
Table 4. Test results of three network models.
Category LabelsModels
3D-CNNMultidimensional Fusion CNNMultidimensional Fusion Atrous-CNN
Correct PixelsPrecisionCorrect PixelsPrecisionCorrect PixelsPrecision
Healthy leaf pixels (16,970)16,89499.55%16,49997.22%16,93499.79%
Diseased leaves pixels (3173)294092.66%311198.05%316599.75%
Background pixels (29,773)29,75699.94%29,75299.93%29,75899.95%
Whiteboard pixels (2513)251099.88%250999.84%251199.92%
Total (52,429)52,10099.37%5187198.94%52,36899.88%
Table 5. Comparison of evaluation results.
DatasetK-Fold cross Validation1DCNNMultinomial Naive Bayes ClassifierGBDTSVM
Train setThe first time0.99790.65820.97070.9508
The second time0.99870.65830.97060.9509
The third time0.99890.65920.97080.9517
The fourth time0.99780.65810.97060.9522
The fifth time0.99820.65720.97060.9510
Average0.99830.65820.97070.9513
Test setThe first time0.99670.65770.96820.9527
The second time0.99800.65160.97350.9528
The third time0.99900.66640.97180.9482
The fourth time0.99760.65260.97110.9470
The fifth time0.99970.66270.96880.9554
Average0.99820.65820.97070.9512
Table 6. Accuracy and recall of prediction results for different disease categories.
DatasetsAccuracy and RecallDisease Category
AnthraxBlightEarly Blight
TrainAccuracy10.99690.9979
Recall10.99920.9923
TestAccuracy0.99870.98950.9842
Recall0.99970.99420.971
Disclaimer/Publisher’s Note: The statements, opinions and data contained in all publications are solely those of the individual author(s) and contributor(s) and not of MDPI and/or the editor(s). MDPI and/or the editor(s) disclaim responsibility for any injury to people or property resulting from any ideas, methods, instructions or products referred to in the content.

