Article

Analysis of Loose Surrounding Rock Deformation and Slope Stability at Shallow Double-Track Tunnel Portal: A Case Study

1
Guangxi Road Construction Engineering Group Co., Ltd., Nanning 530001, China
2
Key Laboratory of Disaster Prevention and Structural Safety, School of Civil Engineering and Architecture, Guangxi University, Nanning 530004, China
*
Author to whom correspondence should be addressed.
Appl. Sci. 2023, 13(8), 5024; https://doi.org/10.3390/app13085024
Submission received: 20 March 2023 / Revised: 11 April 2023 / Accepted: 16 April 2023 / Published: 17 April 2023
(This article belongs to the Special Issue Advances in Sustainable Geotechnical Engineering)

Abstract

:
A low-clearance tunnel portal in the shallow-buried, joint-developed, broken, and loose surrounding rock slope deposit may cause safety issues during construction. In this study, the Guanyin Mountain Tunnel of the Chong-Ai expressway was taken as a case study, and the characteristics of the loose and broken surrounding rocks, their low clearance, and shallow buried bias were comprehensively studied. The three-dimensional numerical model of the Guanyin Mountain tunnel portal section was constructed by the Rhino, AutoCAD, and FLAC 3D software, and the whole construction process of the tunnel portal was simulated. Under the conditions of loose and broken surrounding rocks, the surrounding rock deformation, surface settlement, and slope stability at the portal of the shallow buried tunnel with a small clear distance during the construction of the center diaphragm (CD) method and circular reserved core soil method were studied. The following conclusions are drawn. During the simulated excavation of the tunnel, the maximum surface settlement is 10.74 mm, which meets the requirement of the specification. When the left tunnel is excavated, the surrounding rock deformation of the right arch shoulder should be carefully considered. The maximum deformation value can reach 14.314 mm. After excavation, the deformation rate of the right tunnel is large, and initial support should be installed in time. Since the stratum rock at the portal of the tunnel is strongly weathered, the uplift value of the arch bottom is large and gradually decreases along the axial direction. The tunnel arch bottom and arch foot are plastic areas prone to tensile damage. Therefore, it is imperative to strengthen the inverted arch support of the tunnel in the strongly weathered rock stratum. The excavation sequence of the tunnel portal section adopts the method of excavating the left tunnel first and then excavating the right tunnel, which is more conducive to ensuring the slope stability.

1. Introduction

With the rugged terrain and complex geological conditions in the mountainous regions of western and southern China, highway construction inevitably passes through many unfavorable geological areas. In tunnel construction, low-clearance tunnels offering the advantages of easy line extension, less land occupation, compact layout, and easy connection between bridges and tunnels are common in most highway tunnels [1]. However, the portal sections of many low-clearance tunnels are usually located in the strongly weathered layers of shallow buried depth, joint development, and broken loose surrounding rocks. Moreover, the tunnel portal is located on the mountain slope. The terrain eccentric pressure caused by the shallow burial depth and surface inclination leads to the surrounding rock pressure and supporting structure stress asymmetry. This easily leads to support failure, surface collapse, landslides, and other disasters [2].
Considering the high construction risk of shallow-buried low-clearance tunnel portals in the loose and broken surrounding rocks, the risk assessment of tunnel portal construction based on theoretical methods has been widely adopted by researchers and tunnel engineers. For example, Deng et al. [3] proposed a risk assessment method by combining back propagation (BP) neural network and fuzzy theory, which considers the fuzziness and subjectivity of highway tunnel portal construction. Wang et al. [4] studied the factors affecting mountain tunnels’ seismic damage and proposed an assessment methodology for quantifying the seismic risk of tunnels, including earthquake factors, tunnel structure information, and geological conditions. Zhang et al. [5] used the attribute mathematics theory to establish an attribute recognition model for the slope stability risk evaluation of the tunnel portal. These methods have risk prediction abilities, but the evaluation results have a certain subjectivity and randomness.
In order to address the issues of tunnel construction safety, researchers have also focused on the monitoring of surrounding rock stress and deformation. For example, based on the similarity theory, Lei et al. [6] built a test system for simulating tunnel excavation under asymmetric loading conditions and analyzed the failure mechanism and load characteristics of the surrounding rock of a low-clearance shallow tunnel. Likewise, Sun et al. [7] studied the spatial–temporal evolution mechanism of the deformation and pressure in the surrounding rocks based on the statistical analysis of the deformation and stress in the surrounding rock of the small-spacing tunnels. Hu et al. [8] discussed the deformation characteristics and appearance of cracks in the tunnel’s secondary lining after installing temporary supports. The spatial mechanical characteristics of the portal section and the cracking mechanism of the asymmetric load roadway with an inclined weak structural plane were analyzed. Qiu et al. [9] studied the surrounding rock deformation mechanism by analyzing the field-monitoring data of a shallow tunnel. Although field-monitoring technology is an essential means to effectively reflect the deformation of surrounding rocks, it is expensive and cannot carry out construction feed-forward analysis. In contrast, the numerical simulation method can validate the rationality of design parameters and construction methods and significantly reduce the time and cost of the research. Therefore, it is considered the best method for pre-construction analysis. For example, Yang et al. [10] analyzed the influence of asymmetric load, rainfall, and poor management as the three main triggering factors of failure events through field observation and monitoring and three-dimensional numerical simulation, and discussed the primary support failure mechanism. Wang et al. [11] examined the relationship between the stability of the portal slope and the stability of the whole tunnel and assessed the mechanical and deformation features of the tunnel support structure and surrounding rock. Xiao et al. [12] used three-dimensional numerical simulation to simulate six typical construction stages, analyzed the influence of the tunnel support structure, terrain, and geological conditions on the mechanical properties of pipe roofs, and revealed the change law of the stress and bending moment distribution on pipe roofs during excavation. Song [13] investigated the effect of tunnel excavation on the deformation and mechanical properties of laminated slopes by analyzing the cumulative displacement, stress, and strain of the slopes. Kaya [14] studied the damage mechanisms of slopes on road tunnel routes by means of the kinematic, limit equilibrium, and numerical stability analysis methods. Li [15,16] investigated the mechanical properties of cable bolts under axial and shear loads through experimental and analytical models to improve the safety of tunnel construction through the ground support of cable-bolt reinforcement.
The studies discussed earlier have successfully achieved useful results in the theoretical analysis of tunnel construction safety, on-site monitoring, and numerical calculation. However, many numerical simulations still have limitations, such as an insufficient basis for obtaining the model parameters and inaccurate modeling of the portal. In this paper, the Guanyin mountain tunnel project is used as a case study. An accurate surface model was established through the topographic contour and digital elevation data. The constitutive parameters of the model were determined based on lithologic tests. A three-dimensional tunnel model was built through FLAC 3D to predict the feasibility of the construction scheme. When the tunnel was excavated by the center diaphragm (CD) method and the reserved core soil method, the displacement, the plastic zone, the surface settlement, and the slope stability of the eccentric pressure section of the tunnel portal were studied. The research method can be used to optimize tunnel portal construction and provide an analytical method for similar engineering construction.

2. Project Overview

The Guanyin Mountain Tunnel is located in Ningming County, Chongzuo City, Guangxi. It is an important project of the Shuikou–Chongzuo–Aidian Highway (Chongzuo–Aidian Port Section). The Guanyin Mountain Tunnel was designed as a two-lane separation with a low clearance distance in the northeast–southwest direction, and the design speed was 100 km/h. The starting and ending stake numbers of the left and right tunnel are ZK29+272-ZK34+062 and YK29+256-YK34+076, with the overall length of 4790 m and 4820 m, respectively. The inner contour of the tunnel was designed with a single center circular section with a 5.8 m radius and 9.0 m height. The tunnel width and the clear height are 10.75 m and 5 m, respectively. The portal axis of the tunnel intersects with the contour line at a small angle. The tunnel portal is located on the half slope, 15–20 m higher than the foot of the slope. The natural slope is 25°–35°, and the ground elevation is about 193 m. The tunnel strike is 188°, the rock stratum strike is 80°–88°, and the dip angle is 14°–20°. The left line is located in the mountain depression, and the terrain at the portal is thick on the right and thin on the left, forming eccentric pressure, which can easily cause a collapse and instability during excavation. The longitudinal section of the Guanyin Mountain tunnel portal is shown in Figure 1.

3. Numerical Modeling

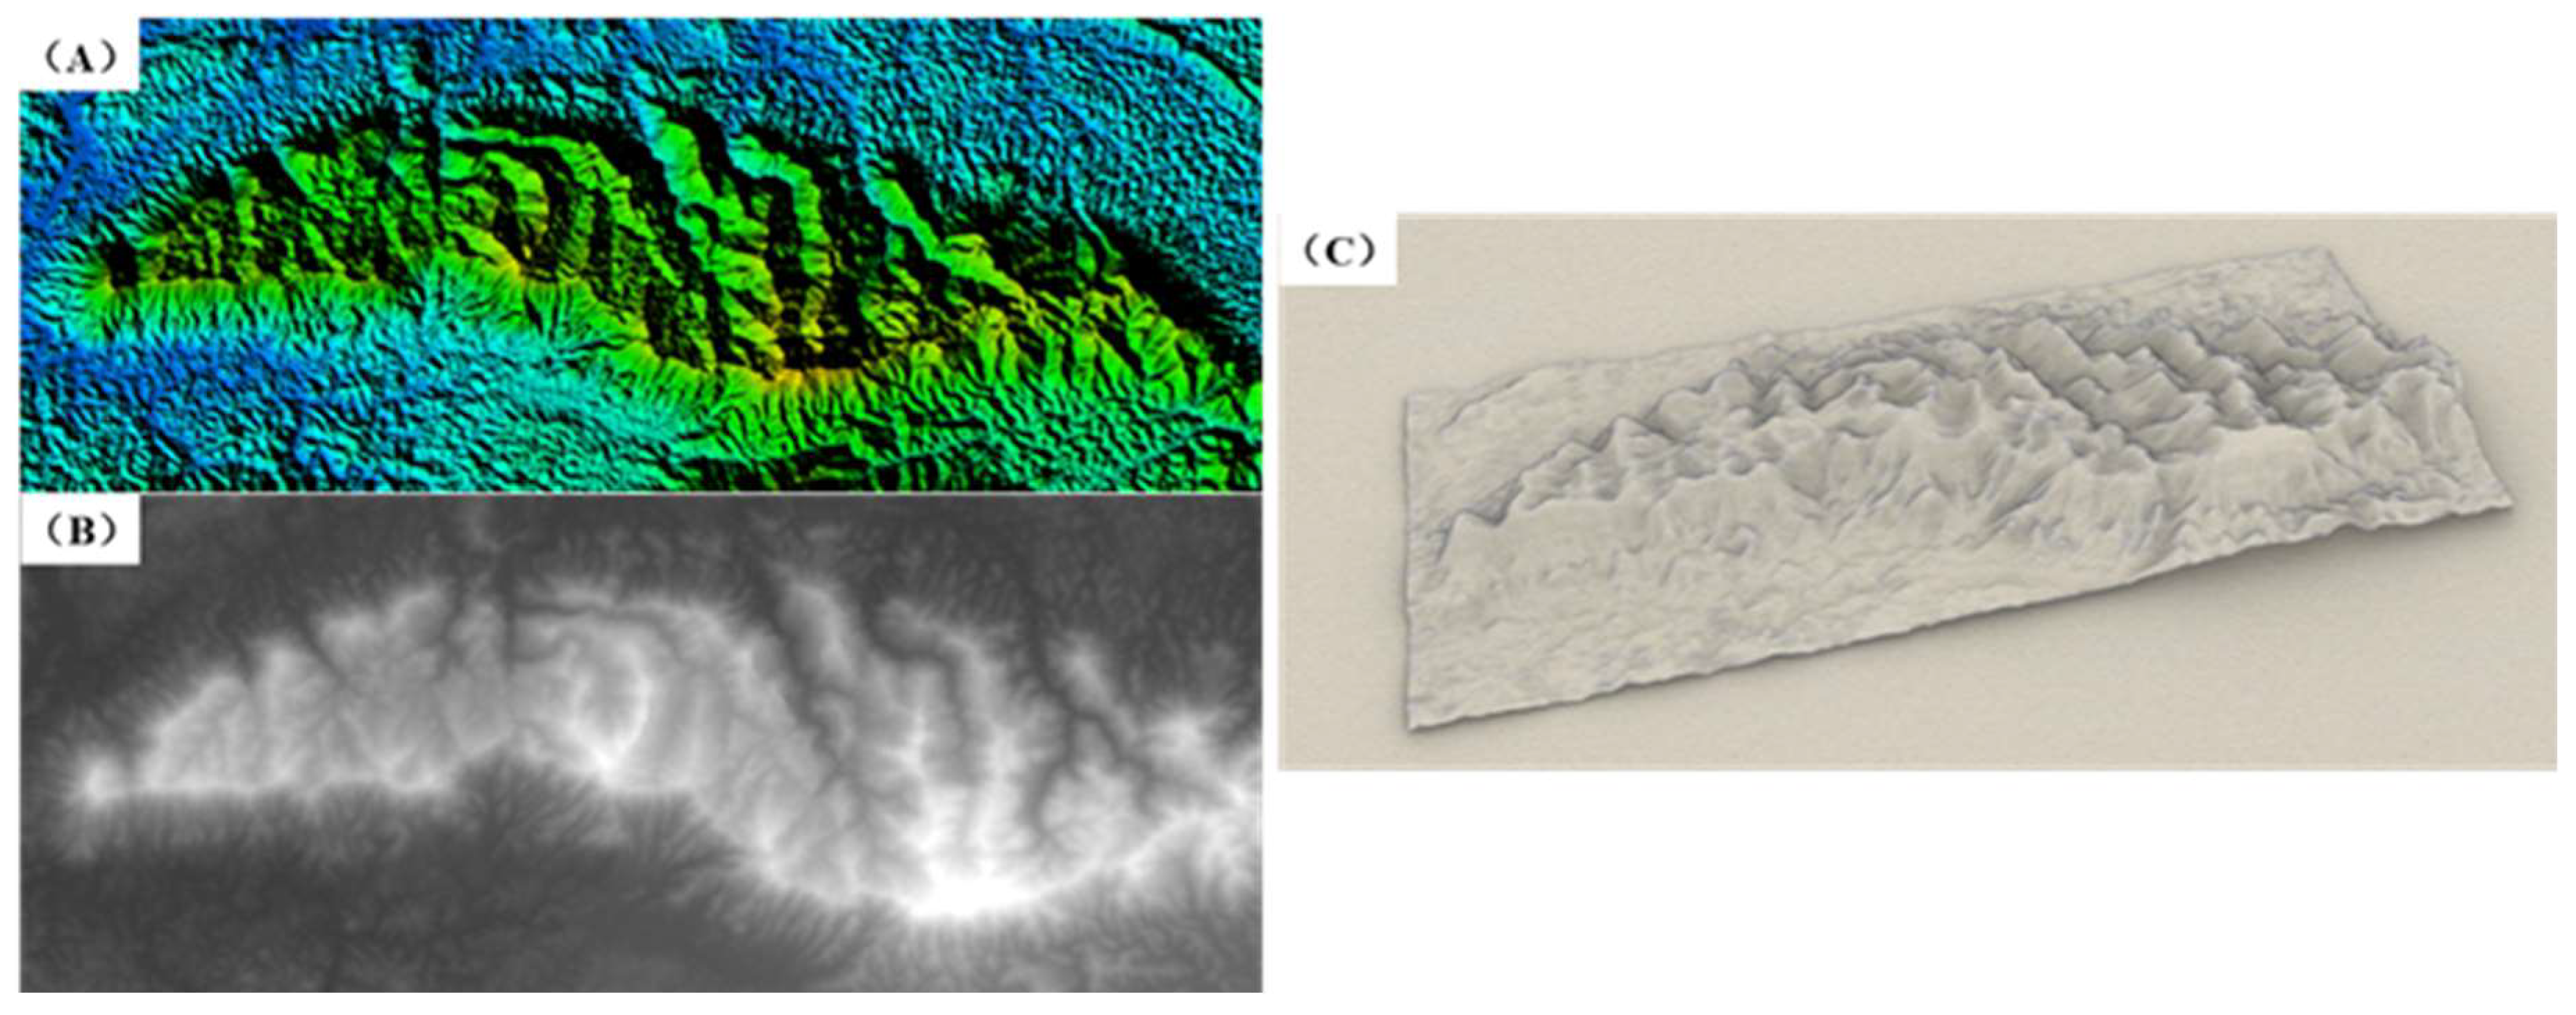
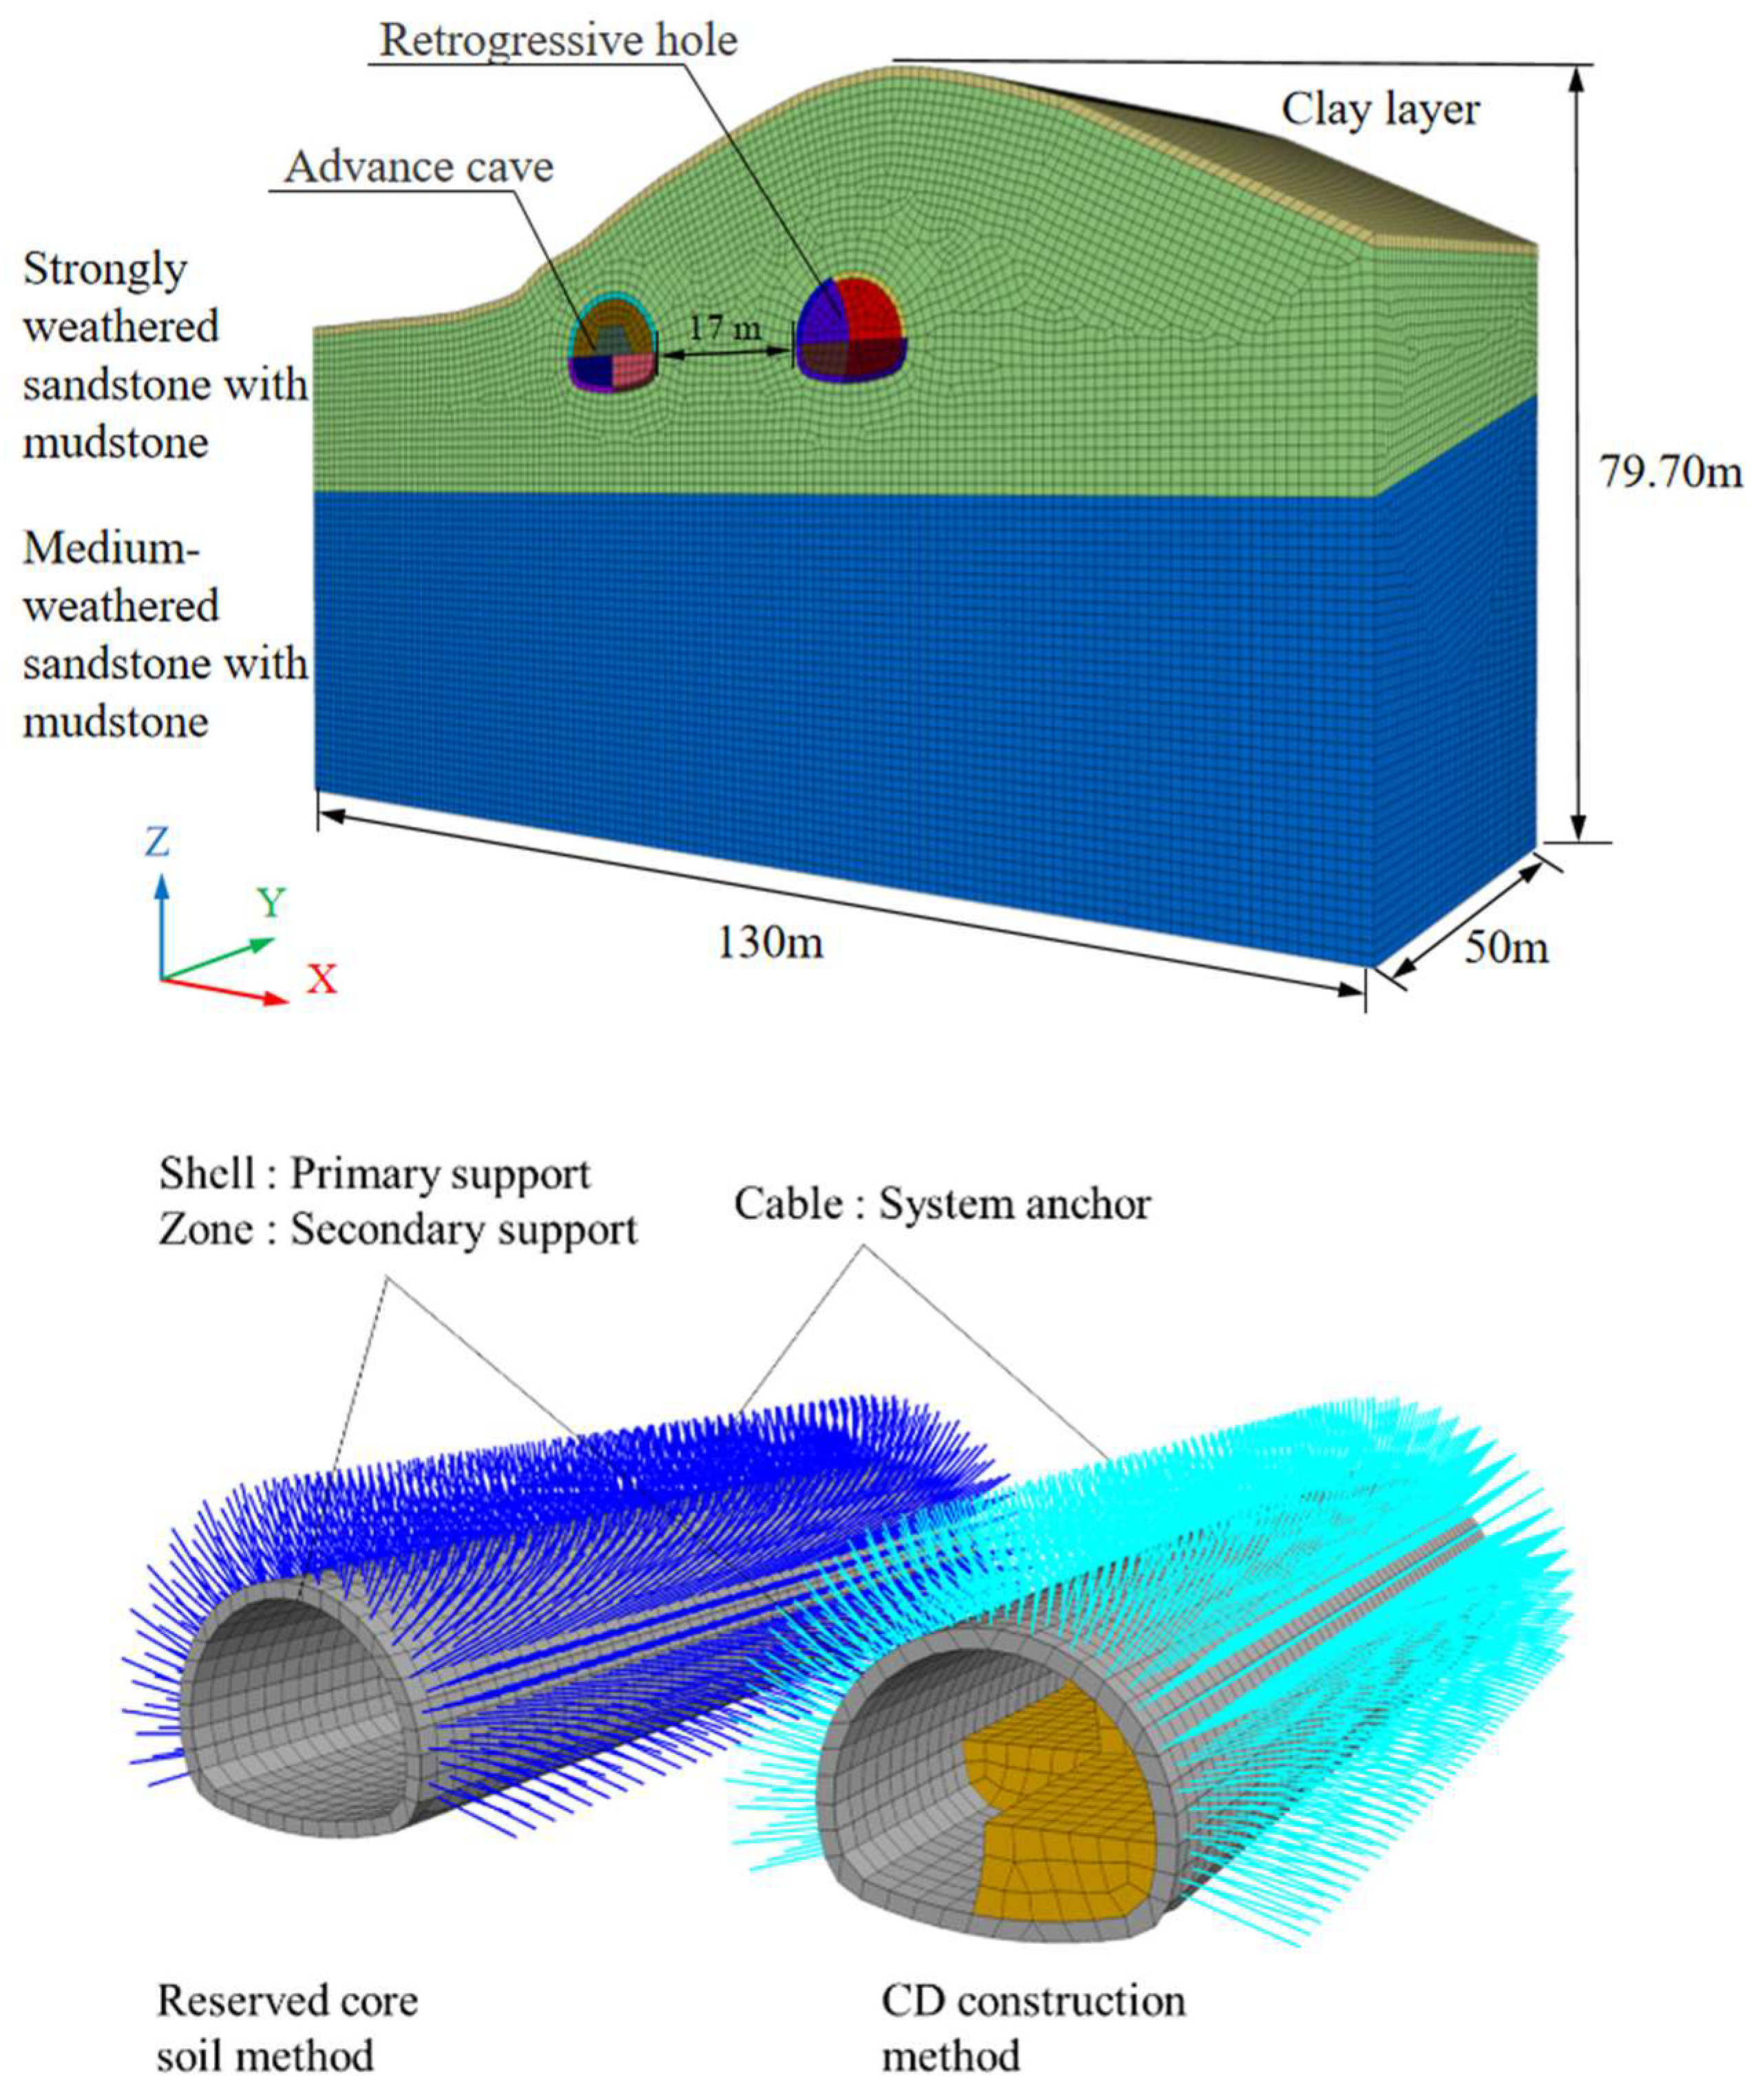
3.1. Model Construction

This study adopted the Rhino–Griddle joint modeling method, in order to realistically reflect the complexity and irregularity of the terrain, consider the ground stress in the bias state, and reduce the modeling error. The three-dimensional tunnel model was developed through the tunnel topographic contour, longitudinal cross-section, digital elevation model (DEM), and profile of the portal section. In this study, the satellite image has a pixel size of 35,420 × 36,421 and a spatial resolution of 2.3818 m/pixel; the DEM was derived from the PALSAR sensor of ALOS with a resolution of 12.5 m, a pixel size of 4428 × 4553, and a spatial resolution of 4.77731 m/pixel. The co-ordinates of both are the WGS-84 co-ordinate system (World Geodetic System 1984 Co-ordinate System). First, the grayscale image was obtained by DEM. The grayscale image is a common form of elevation representation, which uses a linear function to transform the original elevation range into the grayscale color range, dividing the white and black into a number of levels according to the logarithmic relationship between them. The 8-bit grayscale image is represented from 0 to 255; the larger the elevation, the closer to white, and the smaller the elevation, the closer to black. The grayscale image can be used to quickly and completely generate the topography of the tunnel area in line with the realistic terrain. The effects are shown in Figure 2. Subsequently, the area of the tunnel portal section was determined by the latitude and longitude co-ordinates and construction design drawings; the area was divided, and the topographic information such as the geological longitudinal section, portal section profile, and topographic contours were used to adjust the model surface. Then, the zone units were divided according to the rock layers and construction methods, and the complete three-dimensional model was established after stretching and exported to FLAC 3D through the interface software. This model was consistent with the actual topography and realized the refined modeling of the entrance section of the Guanyin Mountain Tunnel. The modeling process is shown in Figure 3.
In this study, the area 50 m in the axial direction of the portal section of the Guanyin Mountain Tunnel was simulated and analyzed, and the starting and ending piles of this area are K29+275 to K29+325, respectively. The maximum edge length of the model mesh is 1 m, with the hexahedral elements as the main elements and tetrahedral elements in part, with a total of 465,928 elements. The model width is seven times the hole diameter, and the overlying soil is up to the surface. The lengths of the horizontal (X-axis), vertical (Z-axis), and axis (Y-axis) directions of the tunnel model are 130 m, 55.39–79.70 m, and 50 m, respectively. The inverted arch of the tunnel is 45.80 m from the bottom of the model, and the surface slope along the tunnel orientation is 5.7°. The design burial depth of the left line tunnel is 7.71–12.71 m, and that of the right line tunnel is 18.07–23.07 m. The clearance between the left and right tunnels is 17 m. The tunnel model is shown in Figure 4.

3.2. Initial Conditions

After the tunnel model was established, the bottom boundary of the model was completely fixed, normal displacement constraints were imposed on all four sides, and the top was a free boundary. In order to ensure that the numerical simulation results conform to the actual working conditions, according to the characteristics of the shallow depth of the tunnel, only the self-weight of the rock mass was considered in the calculations to determine the initial ground stress, and other external forces on the rock mass were ignored. Affected by the topographic relief of the tunnel, the initial in situ stress distribution was in a slightly biased state.

3.3. Model Parameters

Based on the geology investigation and drilling information, the surrounding rock at the tunnel portal is mainly composed of a clay layer with a thickness of about 1.0 m, strongly weathered sandstone with mudstone with a thickness of 25–30 m, and medium-weathered sandstone with mudstone. The rock mass at the portal section of the tunnel is relatively broken, showing a fragmented mosaic structure and poor stability, and is a grade V surrounding rock.
The Mohr–coulomb elastic–plastic criterion was widely used in numerical computational studies of small clearances tunnels, but the damage problem of the surrounding rock was less considered. The generalized Hoek–Brown criterion better reflects the nonlinear characteristics of the rock mass than the former, and takes into account the weakening effect of plastic damage on the strength and stiffness of the rock mass, while the model can be used for the safety factor calculation in FLAC 3D. For the weak and broken rock mass structure, the geological strength index (GSI) surrounding the rock-rating system can better reflect the characteristics of the jointed rock mass [17,18]. Therefore, according to the surrounding rock grade, weathering degree, and rock properties, the rock mass was simulated by the Hoek–Brown elastic–plastic model suitable for the brittle fracture of rock, given by Equation (1) [19,20]:
σ 1 = σ 3 + σ c i ( m b σ 3 σ c i + s ) a
where σ 1 and σ 3 are the maximum and minimum principal stresses; σ c i is the uniaxial compressive strength; and m b , s, and a are rock mass material parameters, given Equations (2)–(4) [19,20]:
m b = exp ( G S I 100 28 14 D ) m i
s = exp ( G S I 100 9 3 D )
a = 1 2 + 1 6 [ exp ( G S I 15 ) exp ( 20 3 ) ]
where GSI is the geological strength index, indicating the geological conditions of the site; D is the excavation disturbance coefficient; and mi is a rock constant, which comprehensively reflects the friction and rupture characteristics as well as compressive and tensile strengths of rock.
The values of GSI, mi, and D were selected based on a combination of existing studies [21,22,23,24], in situ geological conditions, and indoor uniaxial tests. Based on the geological borehole exposures of YK29+261, the strongly weathered rock masses are broken along with the medium-weathered rock masses in clastic form, and for the method of quantifying the GSI system proposed by M. Cai et al. [21], the GSI is taken as 25 and 40, respectively. The uniaxial compressive strengths of the strongly weathered and moderately weathered sandstone with mudstone were obtained from indoor tests as 8.5 MPa and 26.1 MPa, respectively. Combined with the lithologic, fracture characteristics and with reference to literature [22,23], the mi values for the strongly weathered and moderately weathered sandstone with mudstone were taken as 5 and 10, respectively. D depends on the disturbance of the rock mass by blast damage and stress relaxation; this tunnel area is mechanically excavated, with controlled pre-cracking or smooth blasting, as the value of 0.5 is taken [24]. The results are given in Table 1.
The elastic modulus of the weakly jointed surrounding rock is determined on the basis of the method proposed by Hoek [25], given as Equation (5):
E = 100 ( 1 D / 2 1 + exp [ ( 75 + 25 D G S I ) / 11 ] )
Combined with the engineering geological survey report, Code for Design of Highway Tunnels (JTG 3370.1-2018) [26], and indoor geotechnical tests, the soil constitutive of the model was Mohr–Coulomb. The parameters of the tunnel model rock formations are listed in Table 1.

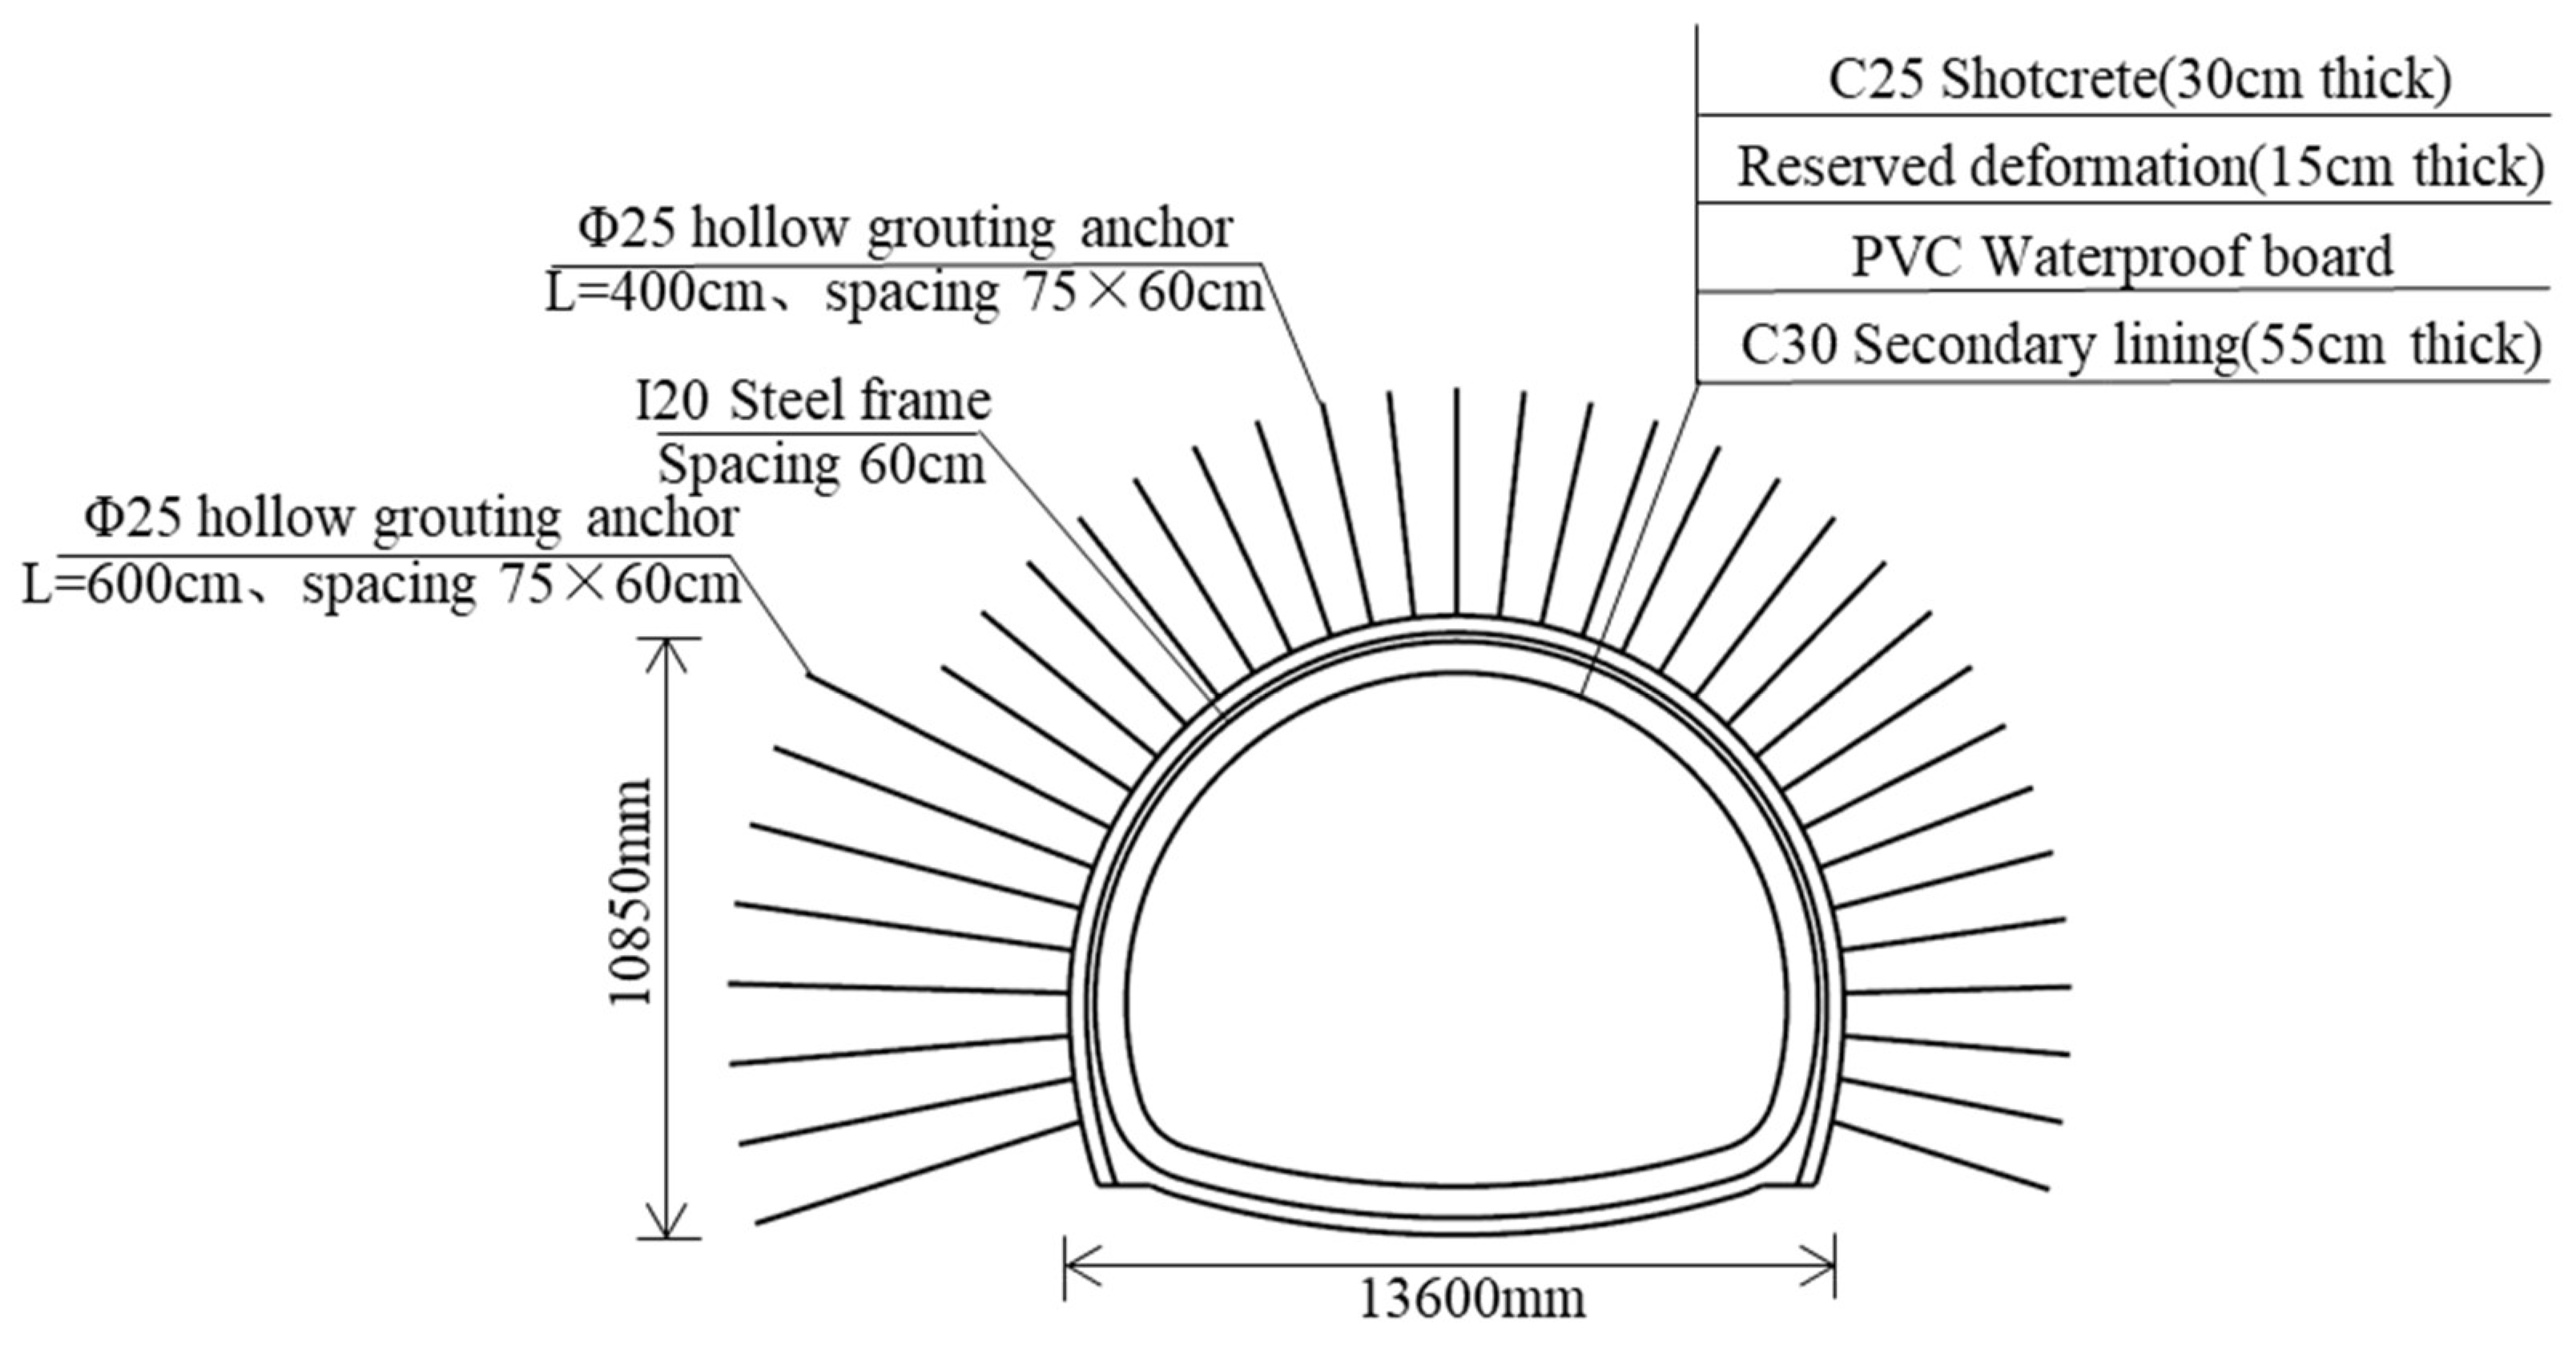
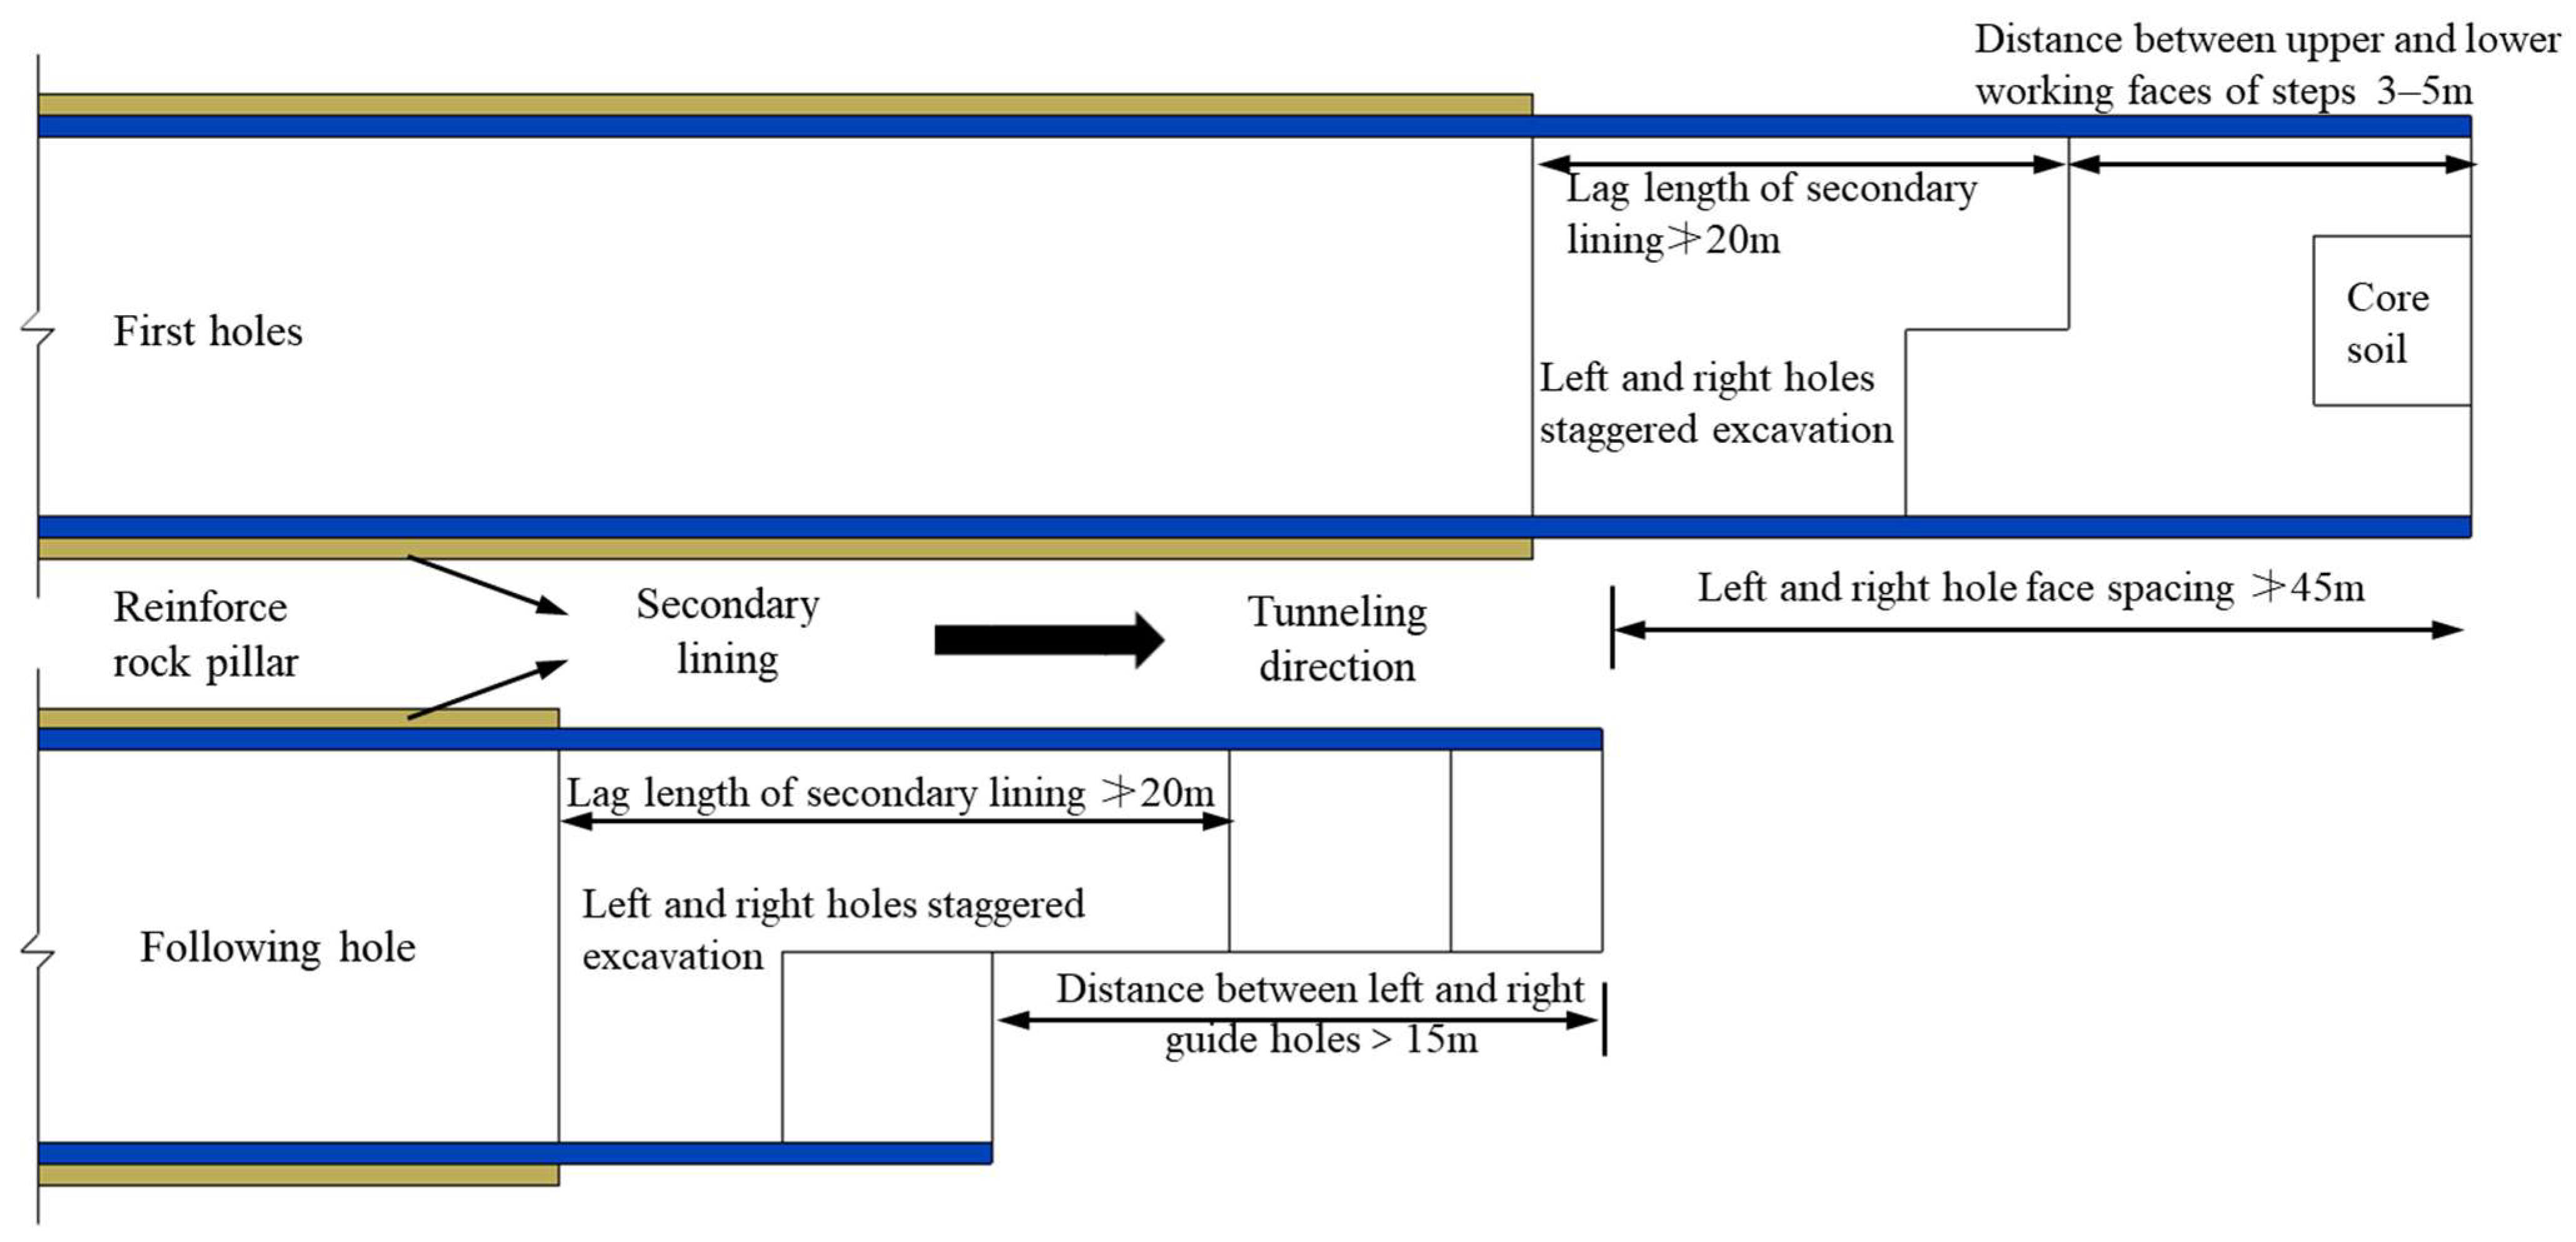
3.4. Support Conditions

The support structure in the shallow-buried eccentric pressure section is a composite lining structure consisting of a system anchor rod, shotcrete, grid steel frame as the initial support, and secondary lining concrete. D25 hollow grouting anchors (L = 4 m/6 m (ring) and 75 × 60 (longitudinal)) are installed in the tunnel arch and side walls. The φ8 steel mesh (20 × 20 cm spacing), C25 shotcrete (30 cm thick), and 20a I-steel support (60 cm spacing) are also used. The secondary lining is a 55 cm-thick C35 reinforced concrete. The supporting structure design is shown in Figure 5.
The stratigraphy of the portal section of the Guanyin Mountain Tunnel is V-grade surrounding rock. The left tunnel adopted the circular reserved core soil method, and the right tunnel adopted the CD method. The stagger distance between the left and right tunnel is less than 45 m. The secondary lining inverted arch and the inverted arch backfill layer must follow the excavation face. The secondary lining should be constructed in time after the initial support falls to the bottom. The distance from the secondary lining to the excavation surface should not exceed 20 m. The tunnel construction sequence is shown in Figure 6.
According to the structural design, the initial support was simulated by the built-in shell structure unit. The structural and mechanical parameters were equivalent by the equivalent principle of compressive stiffness [27]. The secondary lining structure was simulated by the zone element and isotropic elastic constitutive model, with a thickness of 0.55 m. The parameters were selected according to the concrete material properties. The equivalent elastic modulus of initial support is based on Equation (6):
E e q = E c A c + E s A s A c + A s
where E c and E s are the elastic modulus of the shotcrete and the steel arch, respectively; and A c and A s are the equivalent unit cross-sectional areas of shotcrete and the steel arch, respectively.
The density equivalent relation for the initial support is based on Equation (7):
ρ e q = ρ c V c + ρ s V s V c + V s = ρ c A c + ρ s A s A c + A s
where ρ c and V c are the density and the equivalent unit volume of the shotcrete, respectively; and ρ s and V s are the density and the equivalent unit volume of the steel arch, respectively. The parameters of initial support and secondary lining are given in Table 2.
The anchor structure were simulated by the cable elements; the action of the anchor structure with the surrounding rock is defined by geometric parameters, material parameters, and cement slurry characteristics, which are mainly taken from the Shuikou–Chongzuo–Aidian Highway (Chongzuo to Aidian Crossing Section) Two-Stage Construction Drawing Design. The anchor rod calculation parameters are based on a 25 mm-diameter and 5.5 mm-thickness hollow grouting; the length of the anchor rod for the arch and side wall are 4 and 6 m, respectively. The anchor rod elastic modulus is 200 GPa, density is 7850 Kg/m3, and tensile strength 0.2 MN; the installation hole diameter of the anchor rod Dc is 42 mm and thickness of slurry ring t = 8.5 mm, so the cross-sectional area of the anchor rod is 490.9 mm2, and perimeter of the cement slurry outer ring is 0.139 m. M20 cement mortar is selected; its shear modulus is 9.5 GPa, friction angle is 25°, shear strength peak τpeak = 0.86 MPa, and the unit length mortar stiffness and Mortar bonding force were calculated by Equations (8) and (9) [28]:
k g = 2 π G [ 10 ln ( 1 + 2 t D c ) ]
c g = π ( D c + 2 t ) τ p e a k
where Dc, t, and G are the anchor rod installation aperture, the slurry ring thickness, and the shear strength of the grouting body, respectively. The parameters of the bolt are listed in Table 3.

4. Analysis, Results, and Discussion

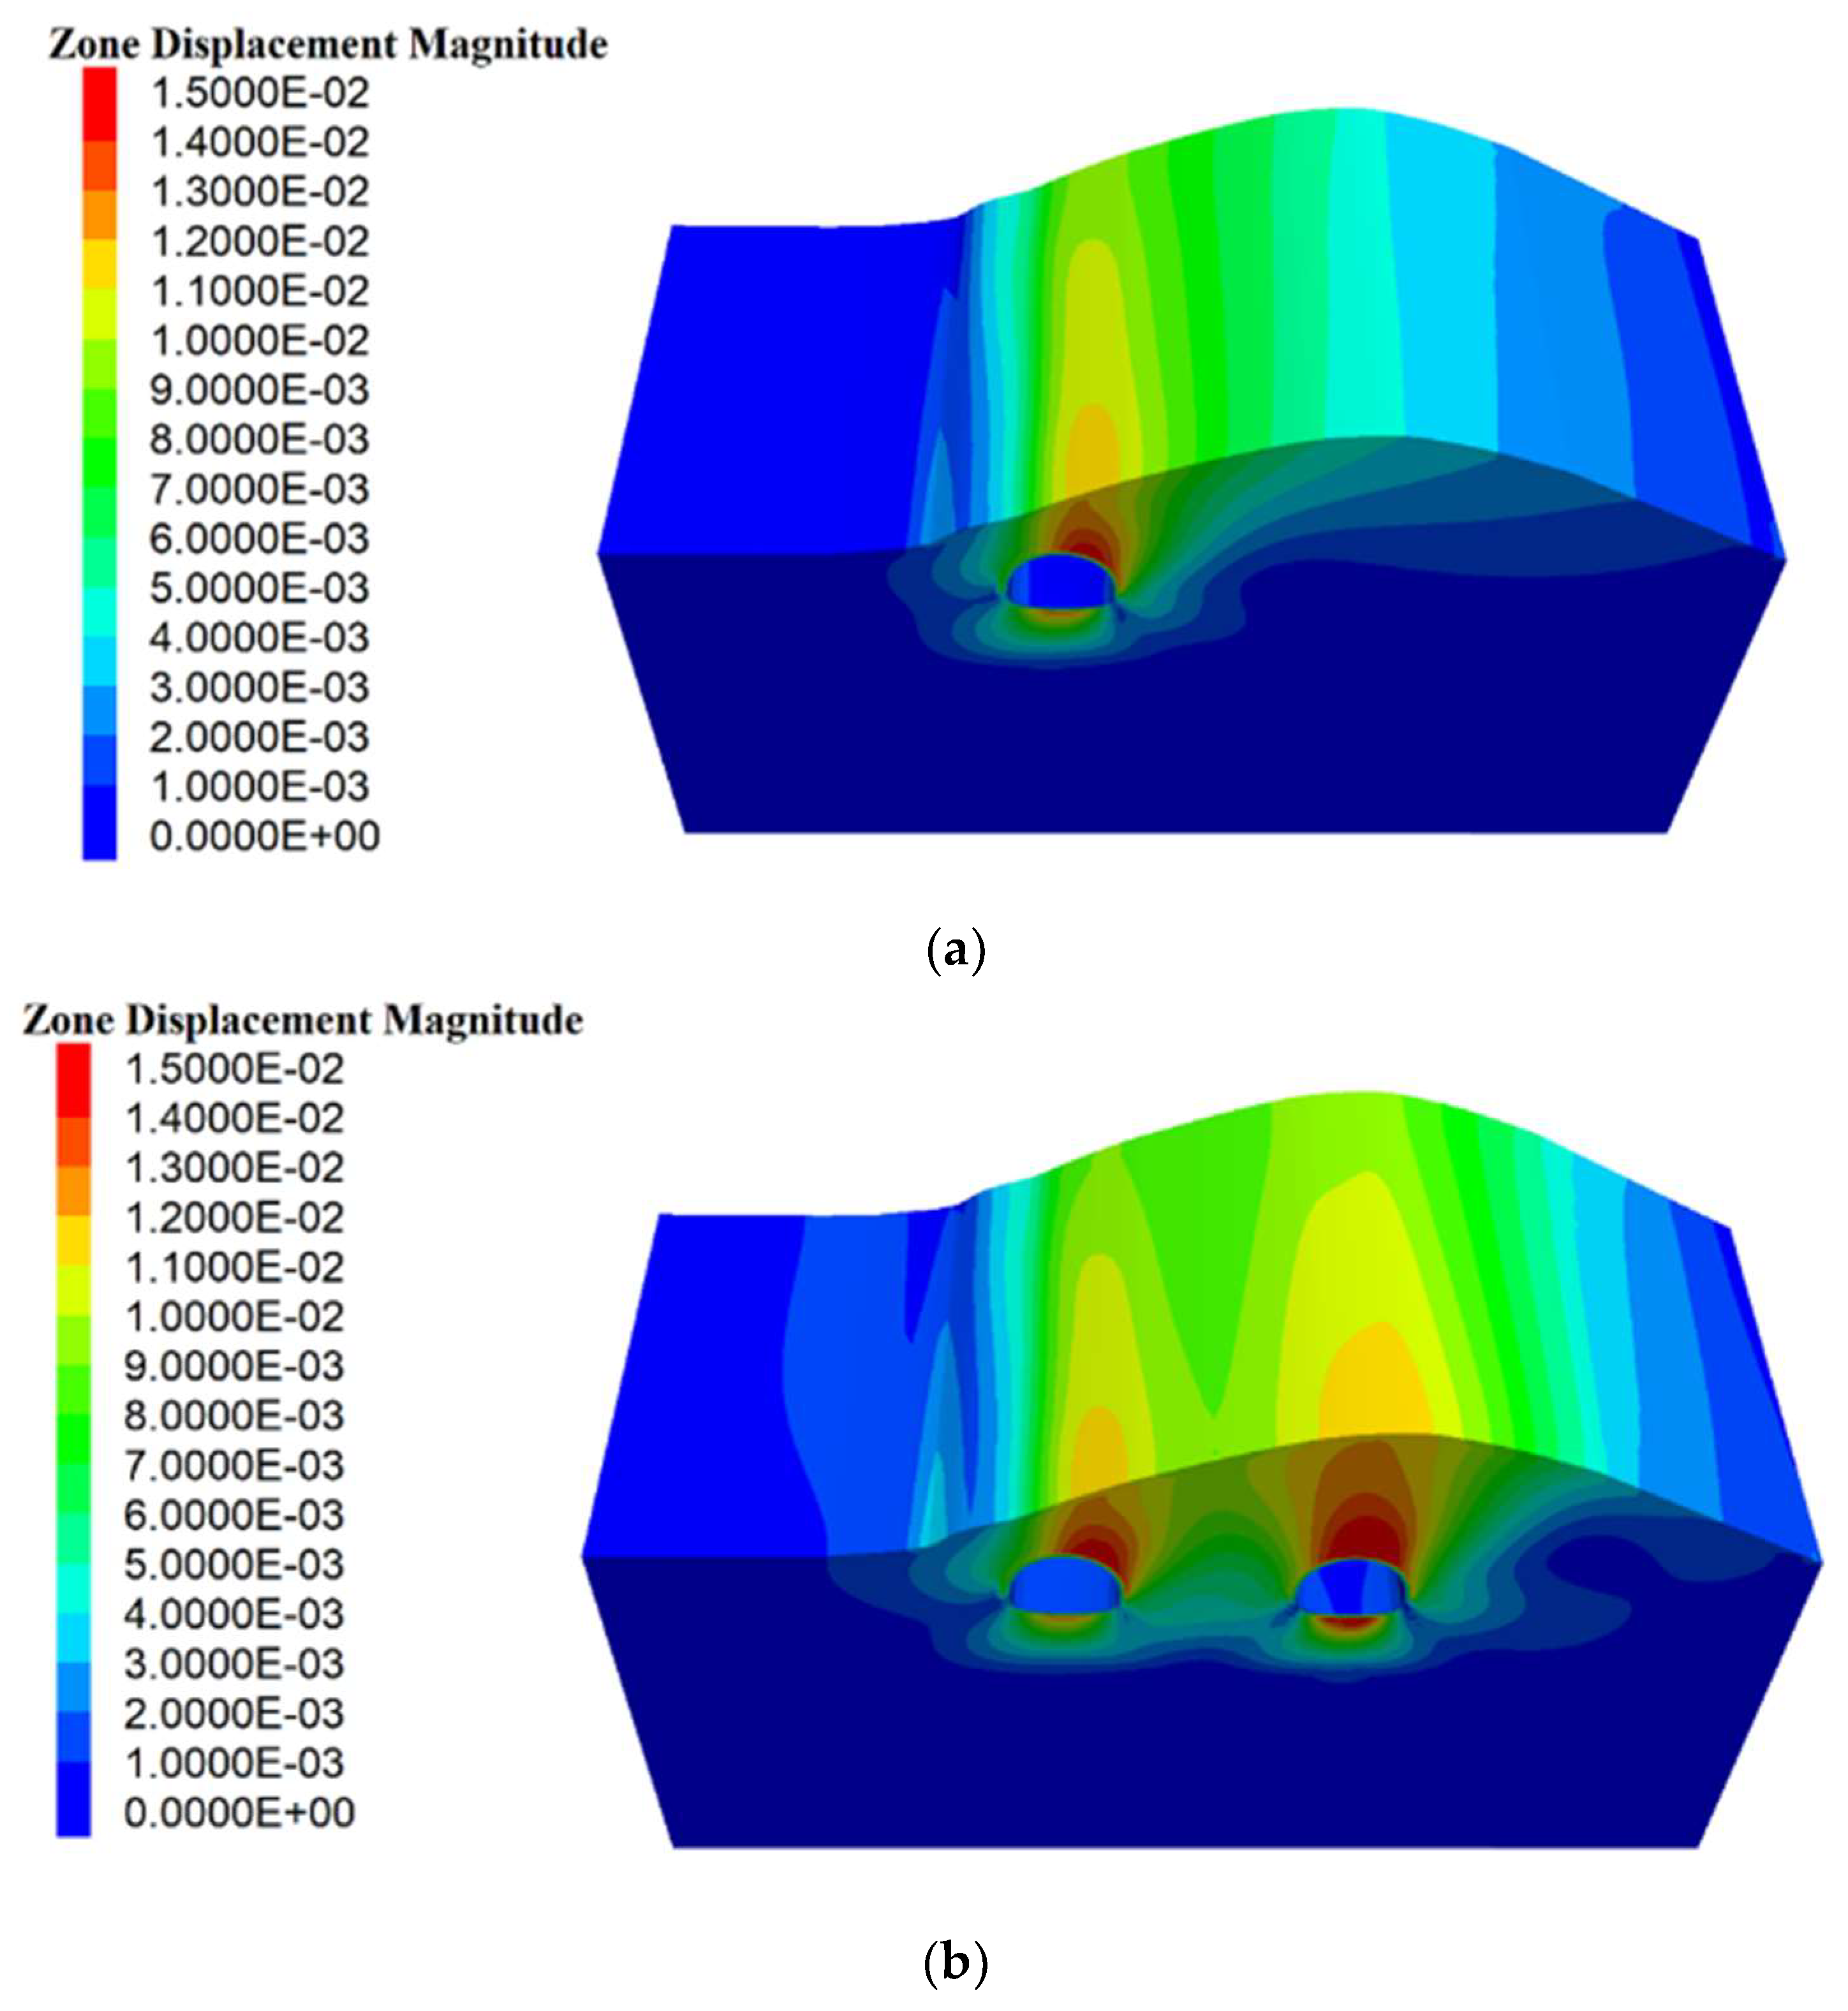
4.1. Displacement Analysis

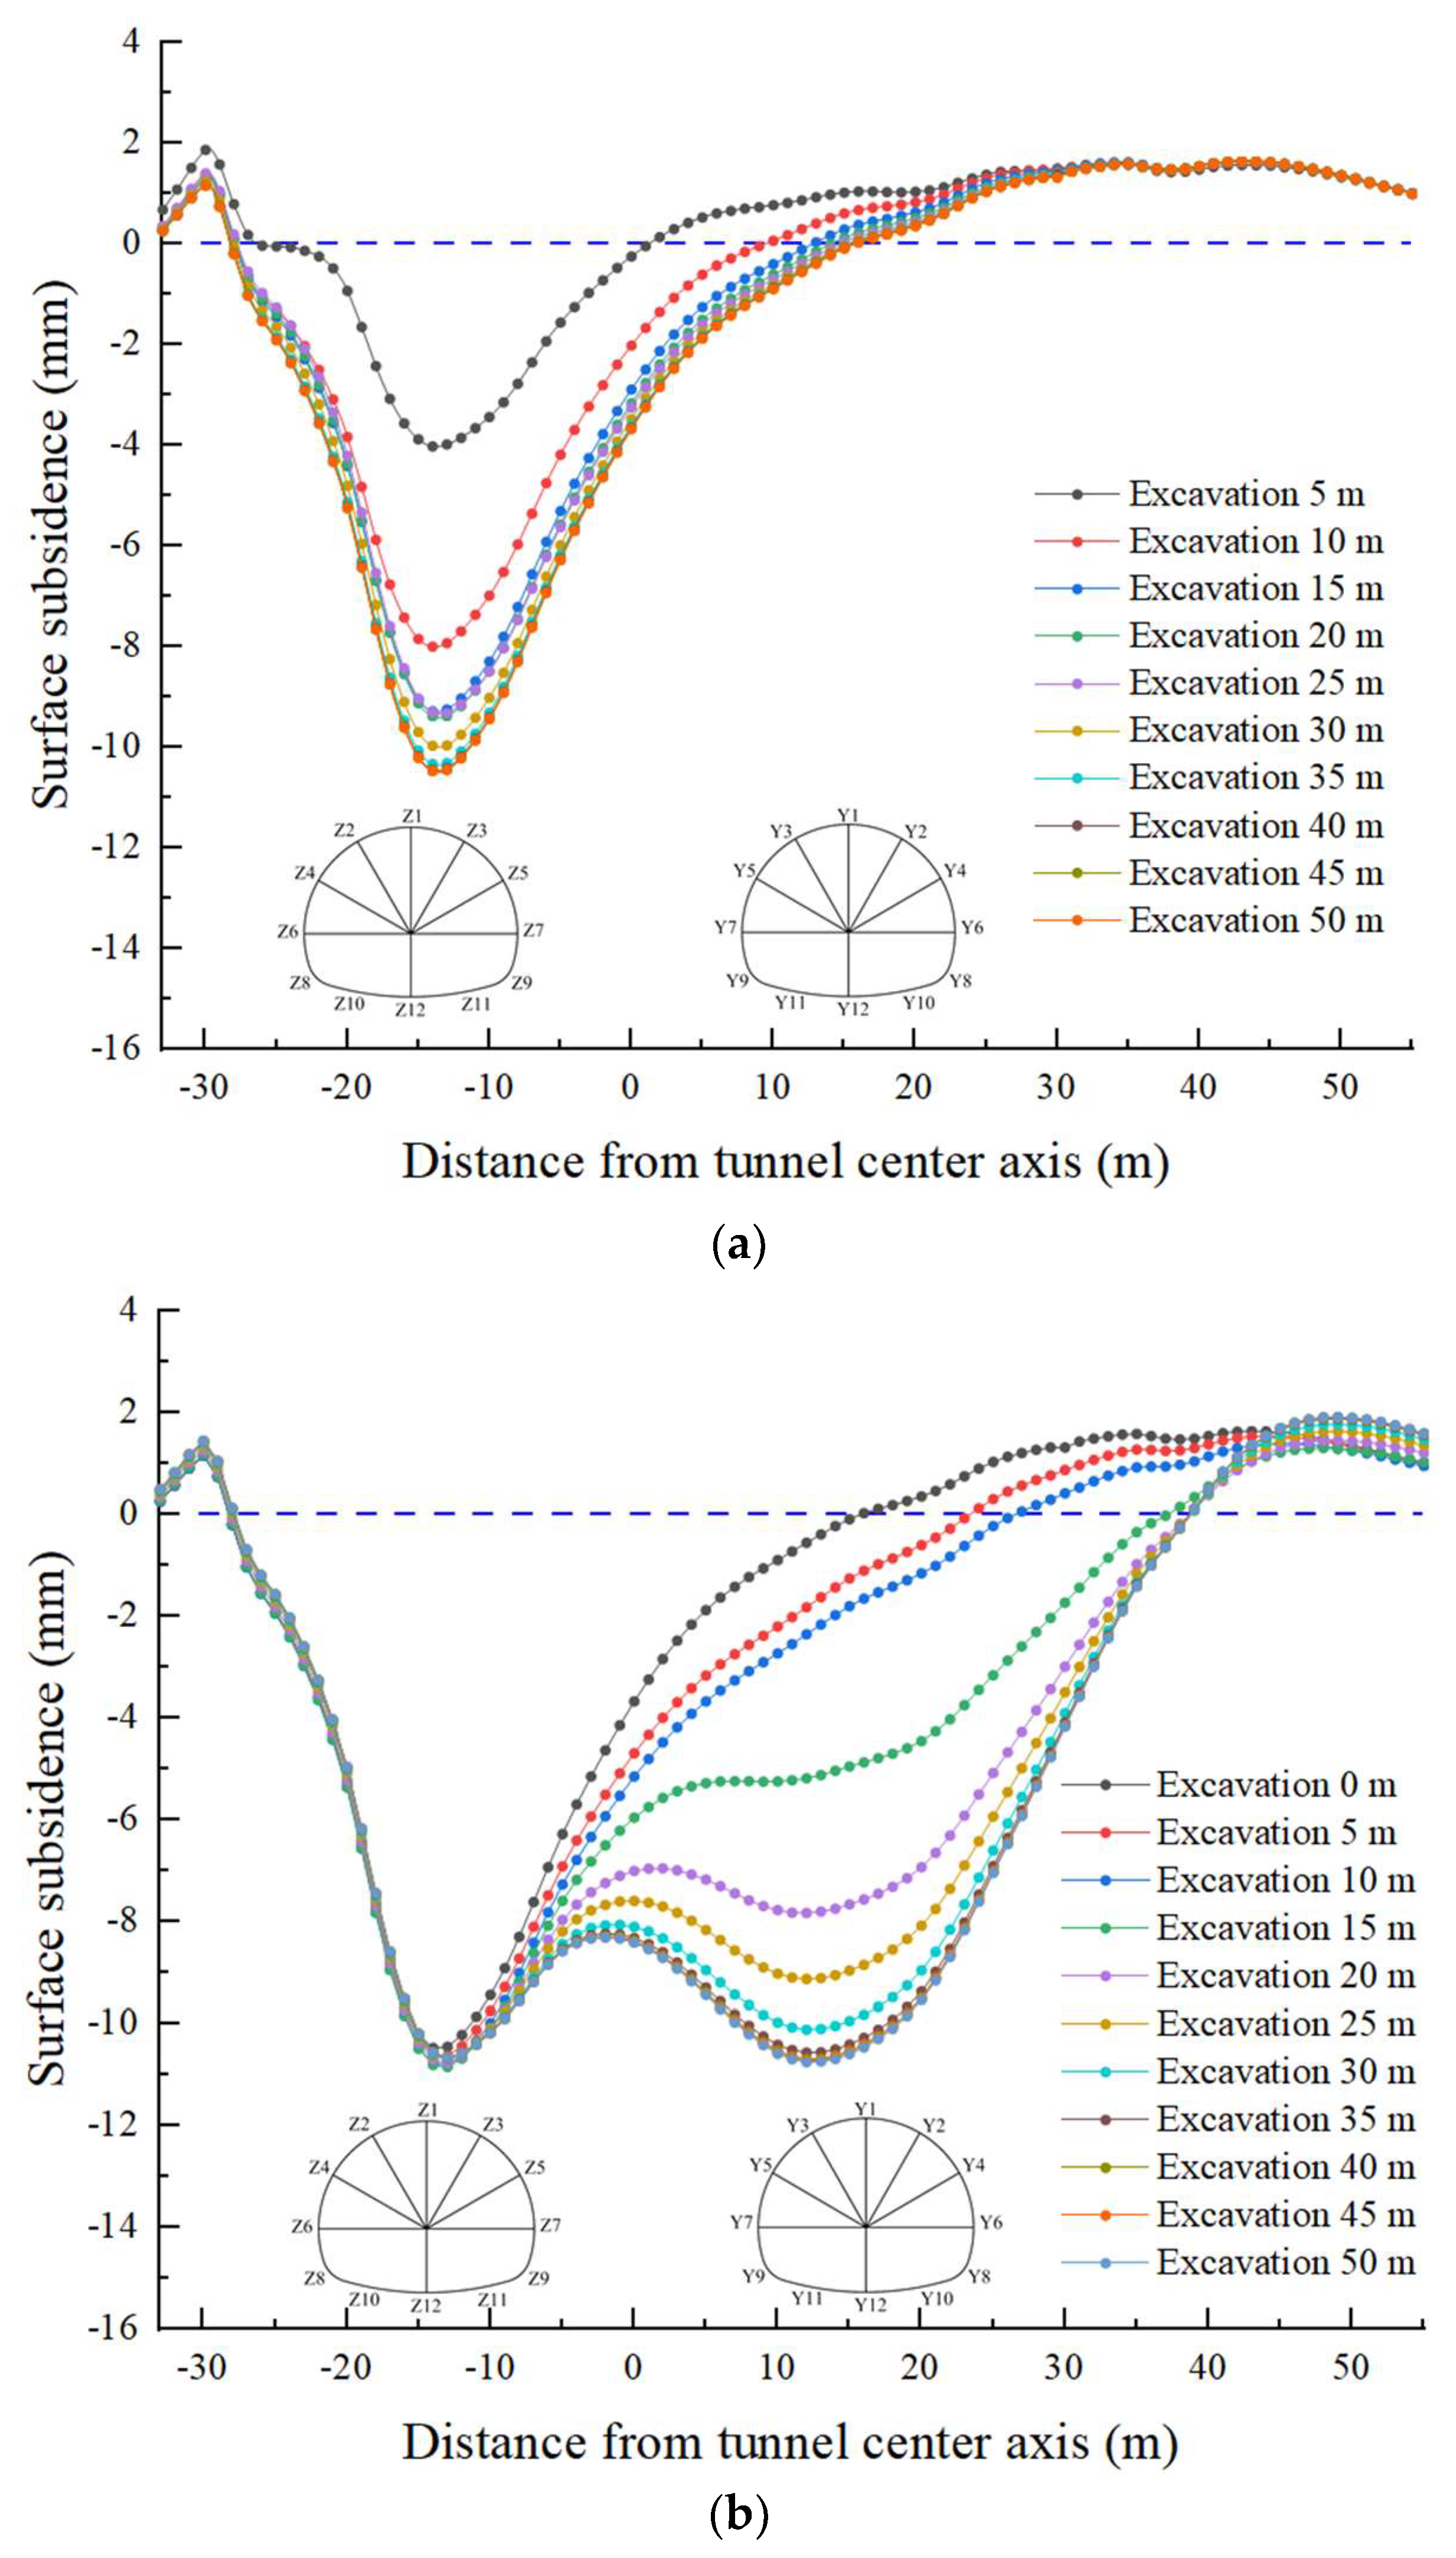
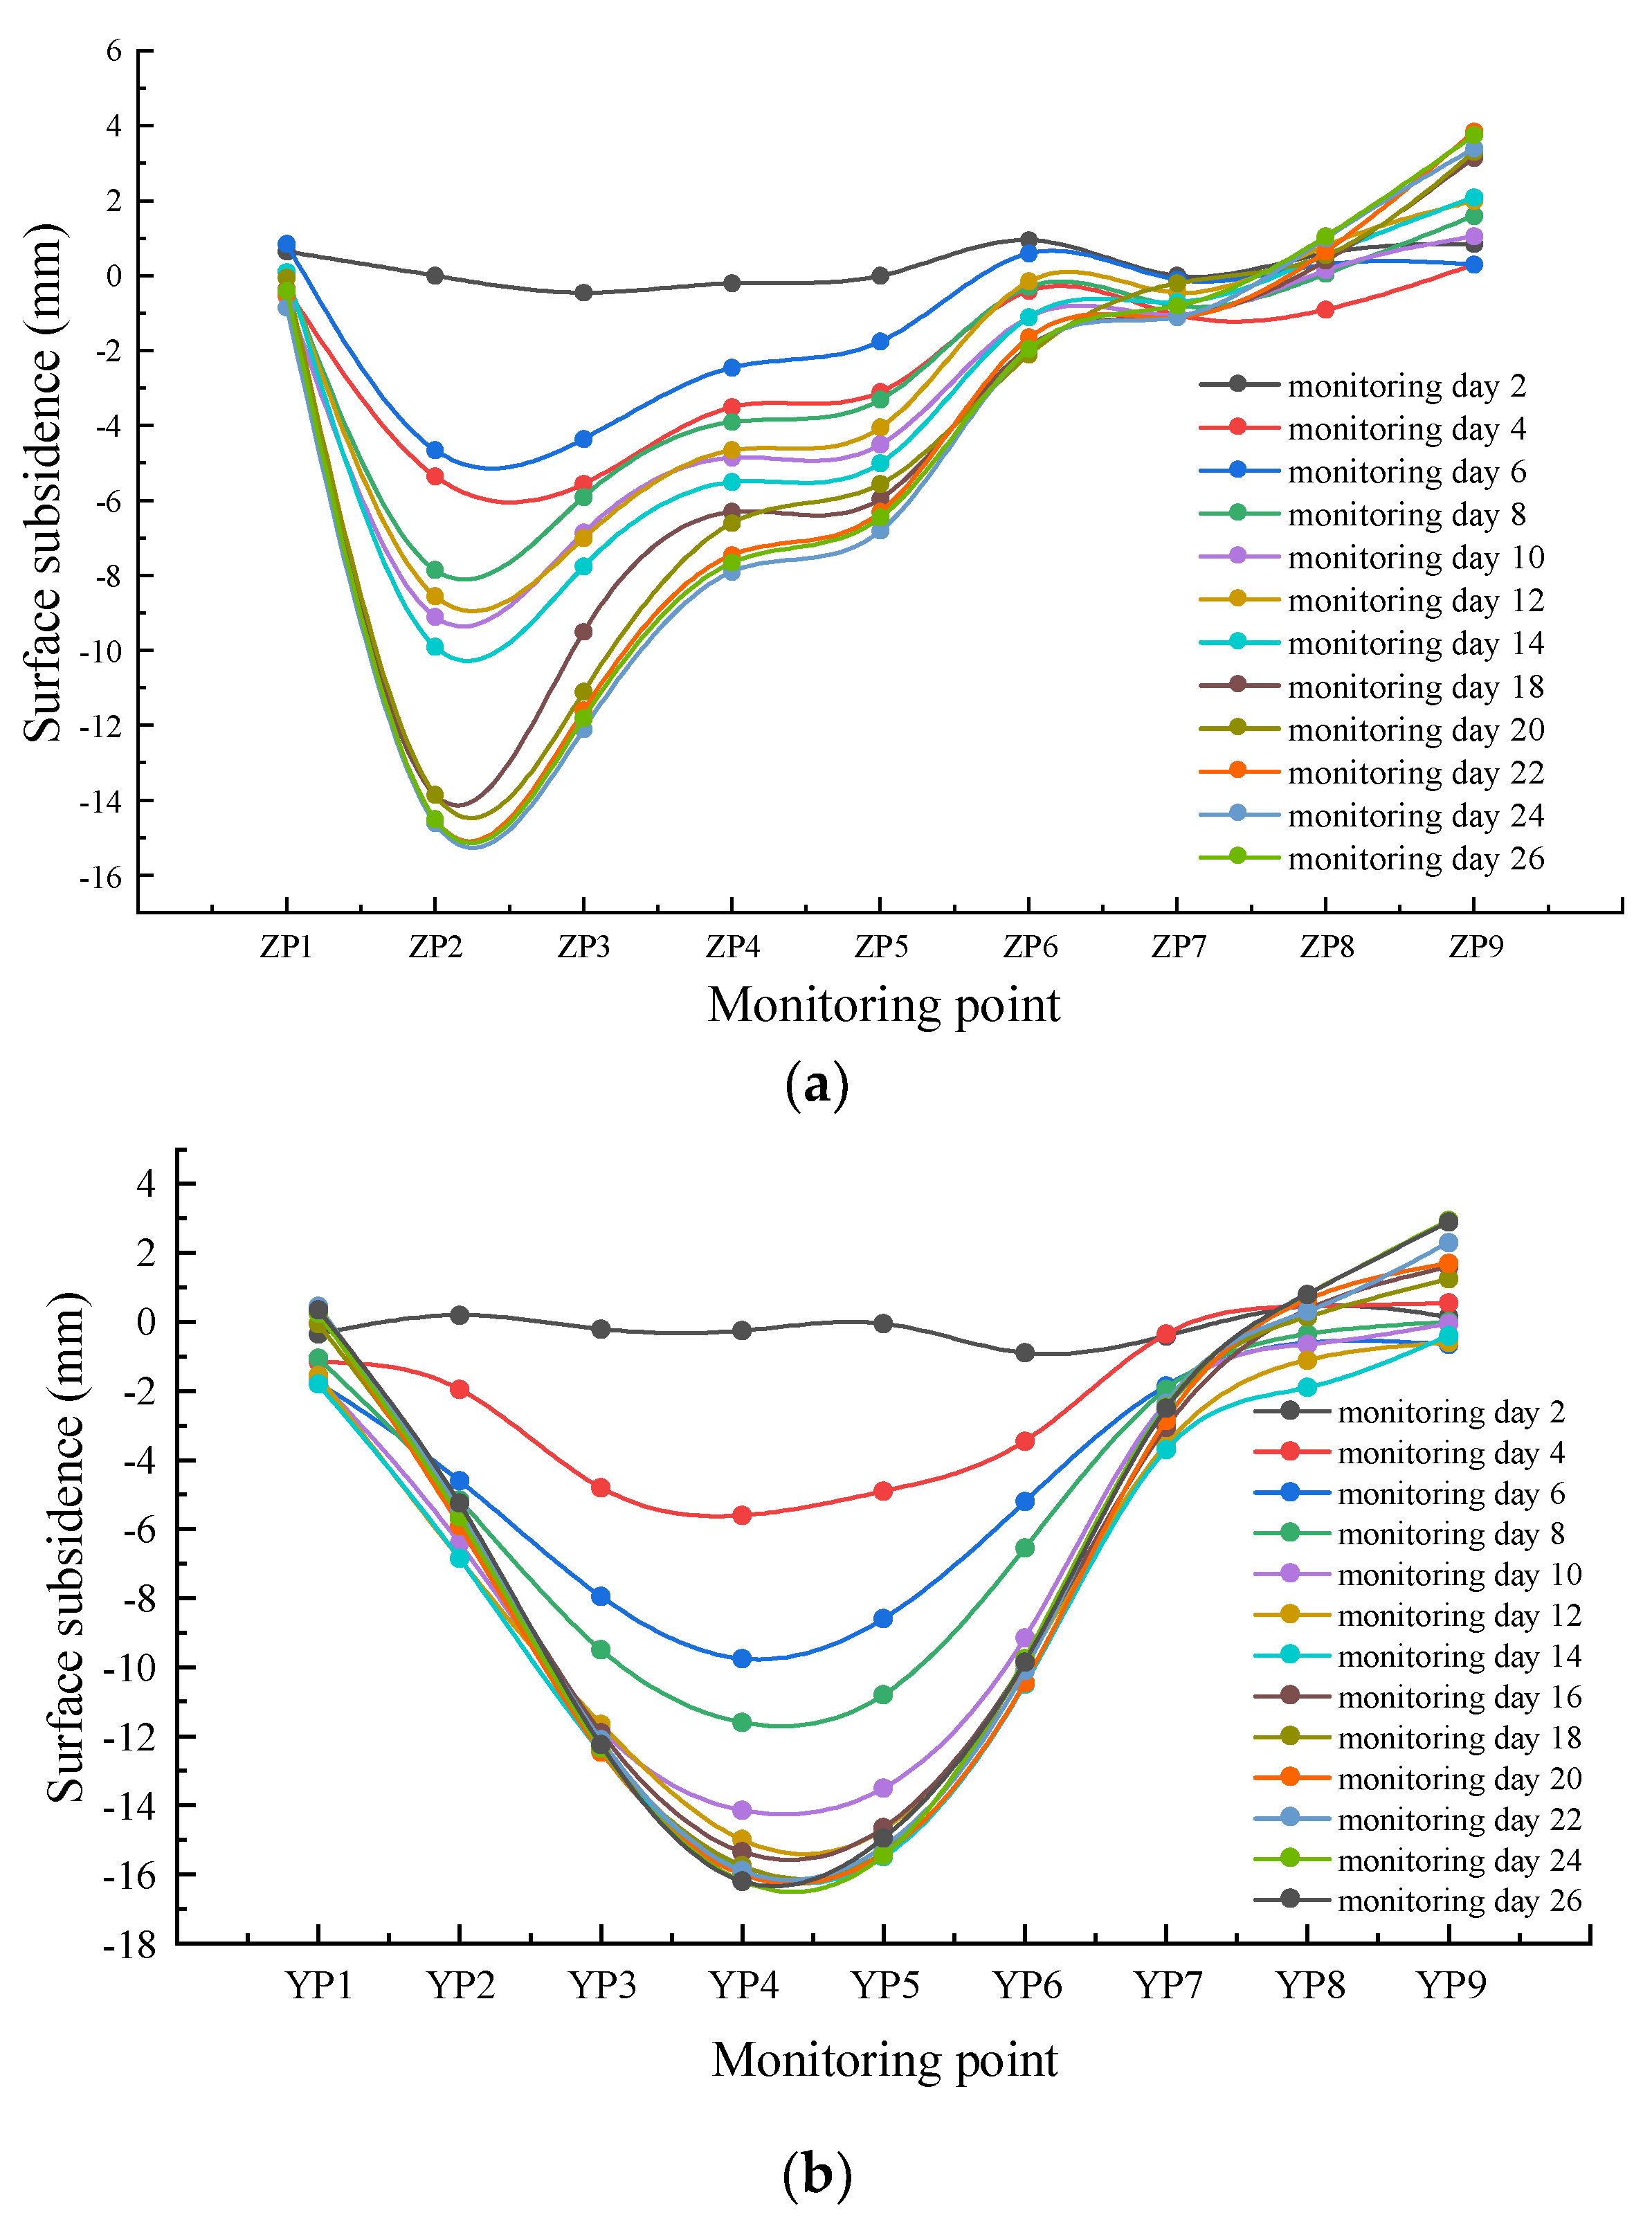
4.1.1. Surface Settlement

According to the construction plan, the left tunnel adopted the ring reserved core soil method, whereas the right tunnel adopted the CD method. In order to simplify the running program and improve the calculation efficiency, the excavation footage was set to 2.5 m. After the left tunnel was excavated for 50 m, the right tunnel was excavated. In order to analyze the surface settlement in the calculation process of the model excavation and support, the monitoring points were arranged at the surface of y = 1, and each monitoring point was horizontally separated by 1 m. A total of 90 monitoring points were set up, extracting the surface settlement data after every 5 m excavation. At the same time, in this section, at y = 1, 12 monitoring points were set in the inner profile of the tunnel, which were located at the arch crown, arch shoulder, arch foot, and arch bottom of the inner contour of the tunnel. The surface subsidence curves and the distribution of the monitoring points in the inner contour are shown in Figure 7.
As shown in Figure 7, during the early excavation, the surface settlement curve above the left portal of the tunnel showed different degrees of a V-type distribution, and the maximum settlement value appeared on the right side of the arch crown of the left tunnel. The settlement value gradually increased with the excavation, whereas the maximum settlement position remain unchanged. The maximum displacement settlement difference during the left tunnel excavation occurred in the first 5 m and 10 m. The maximum cumulative settlement values were 4.012 mm and 7.993 mm, respectively, and gradually stabilized with the decrease in the surface settlement. After the left tunnel was excavated for 50 m, the largest ground subsidence was 10.467 mm, and the influence range of settlement was 43 m. At the beginning of the excavation, a slight uplift in the ground to the left of the left tunnel and towards the right of the center of the right tunnel was observed. When the right tunnel was excavated, the left side of the maximum settlement displacement point of the surface did not change significantly, and the right side started settling. Due to the supporting effect of the middle rock, the settlement above it was minuscule, and the surface settlement curve began to change from a V-type distribution to a W-type distribution. As the right tunnel was excavated by the CD method, the settlement value was small when the left part of the tunnel was excavated. A large settlement displacement occurred when the right part was excavated. The maximum settlement difference was about 4.5 mm, which then gradually decreased. Finally, the maximum settlement value above the right tunnel was 10.740 mm, and the influence range of surface settlement was expanded from 43 m to 100 m. The ground surface deformation did not exceed 30 mm as given in the Code for Design of Highway Tunnels (JTG 3370.1-2018) [26], indicating that the settlement control standard could be reached if the construction was carried out according to the CD method.

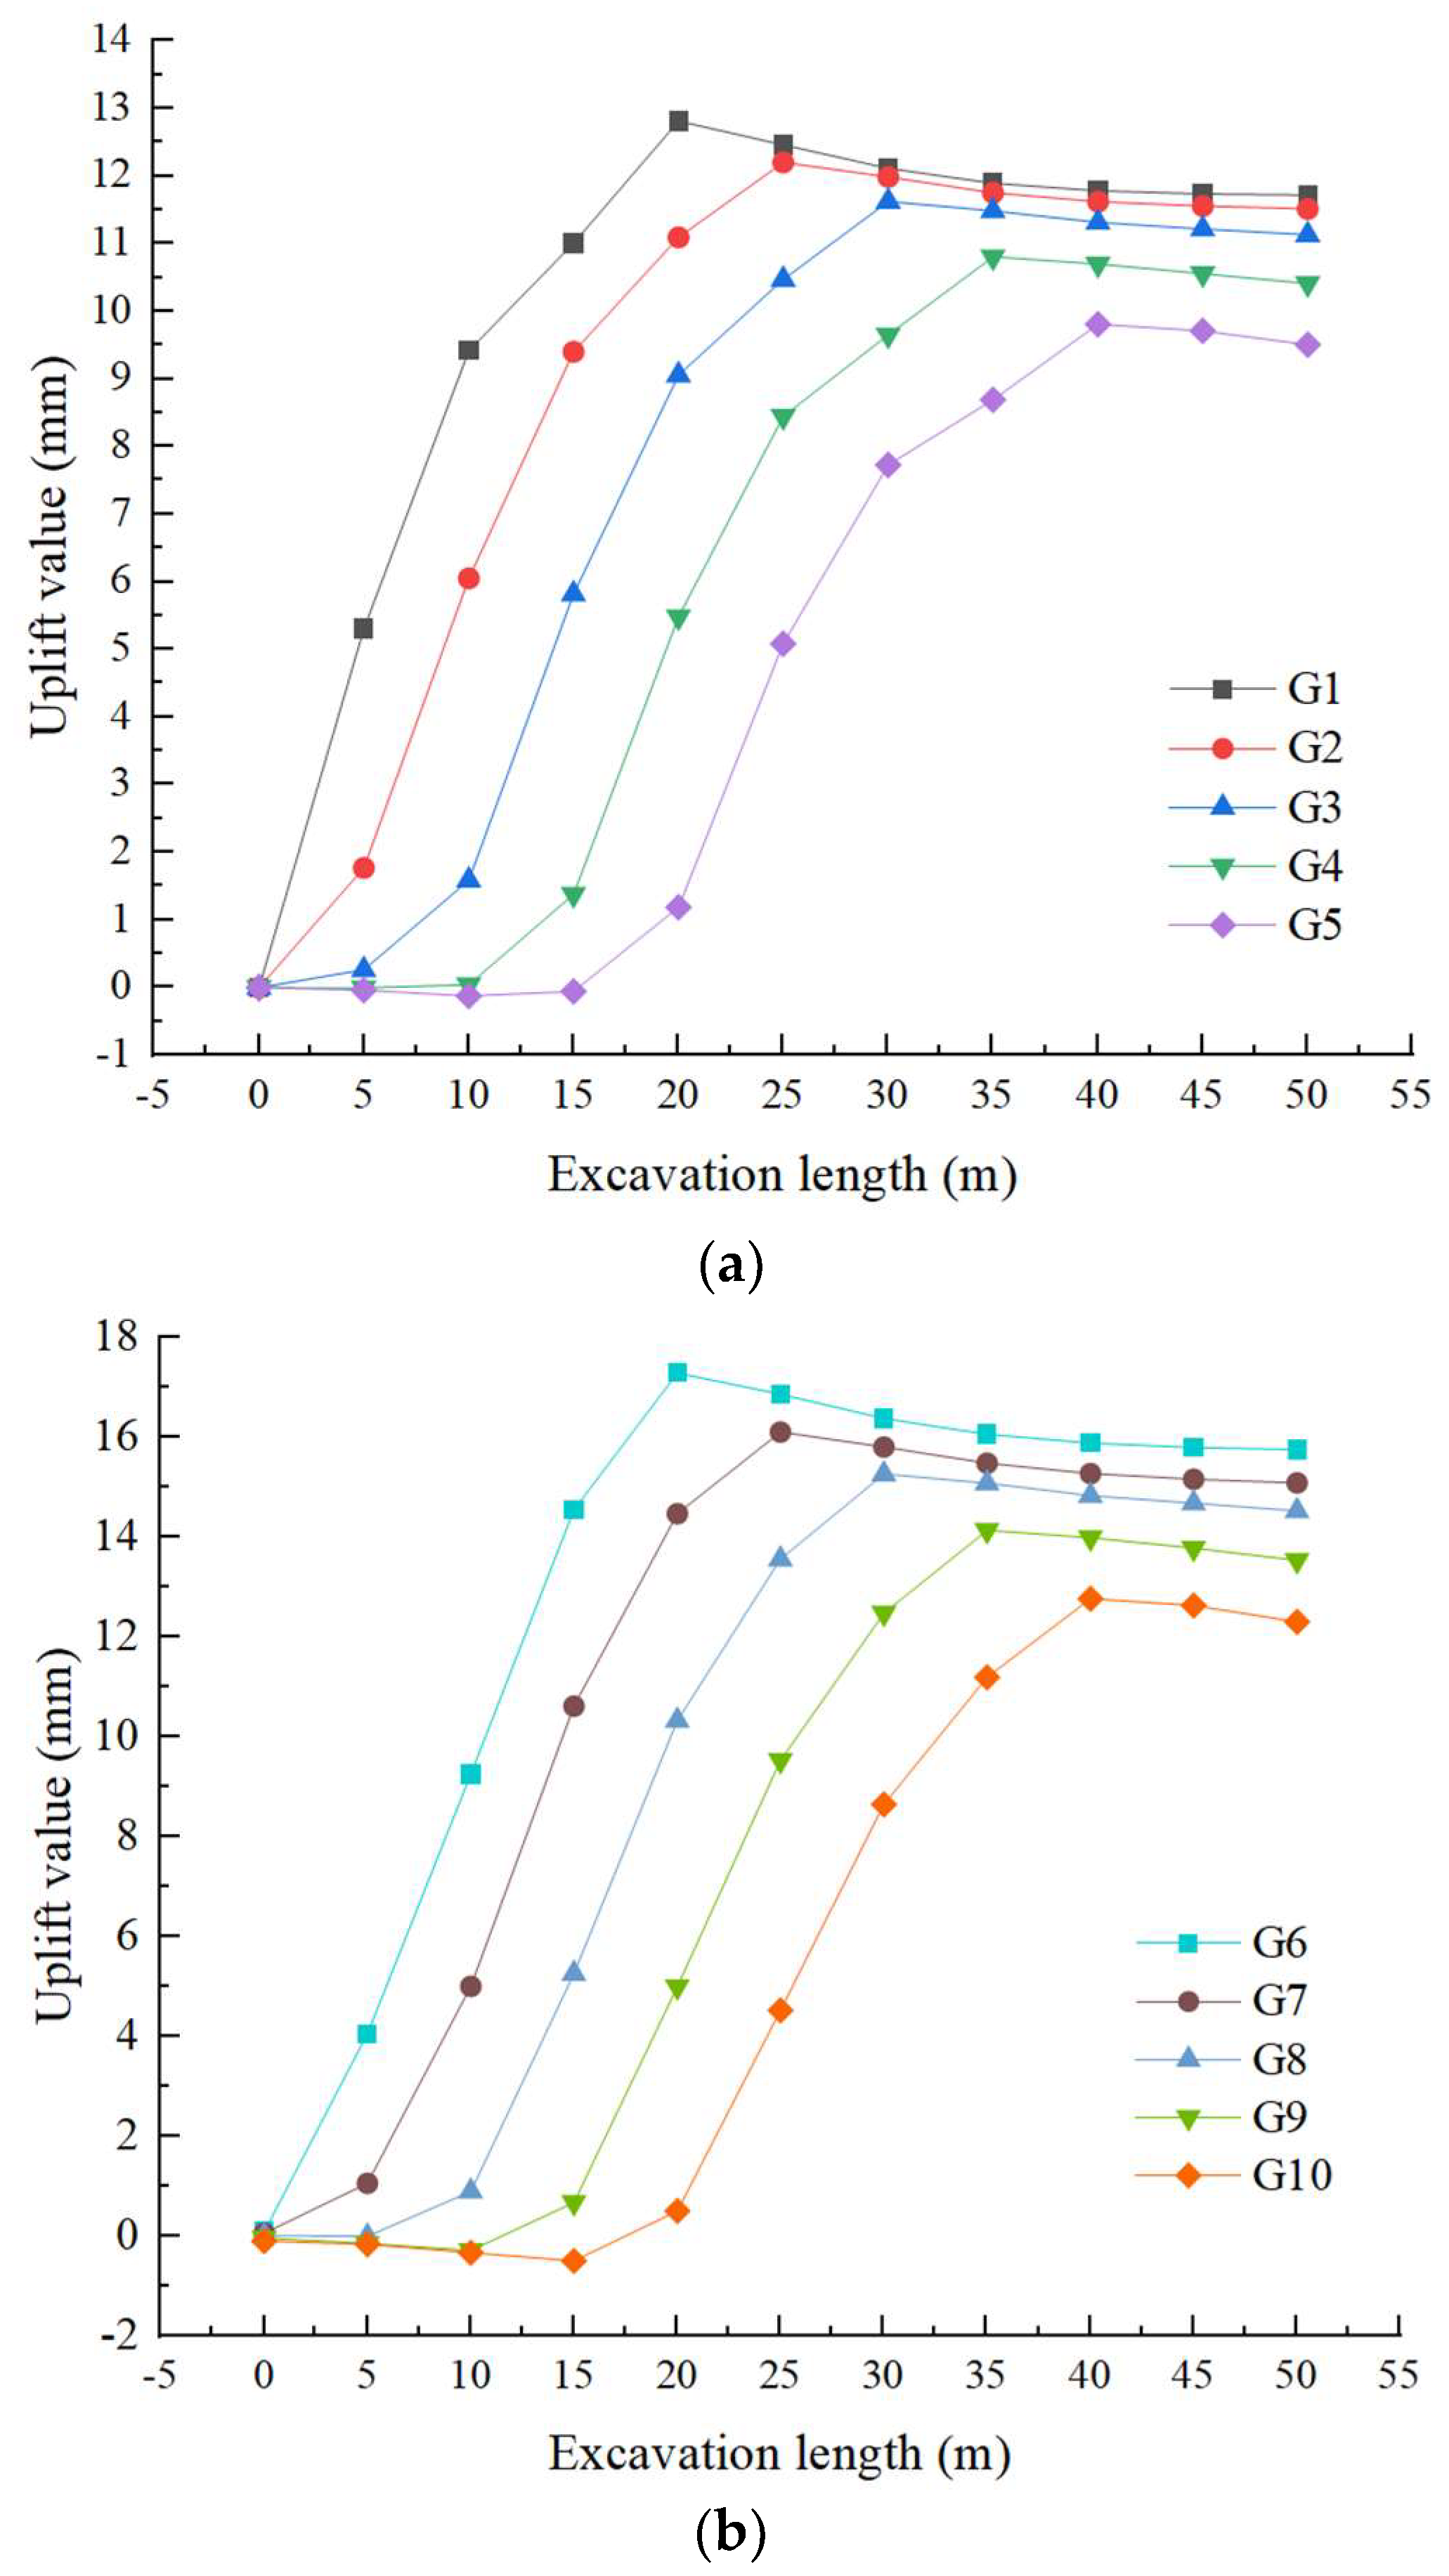
4.1.2. Tunnel-Surrounding Rock Deformation

The surrounding rock displacement can directly reflect the main parts and changing trends of tunnel failure deformation. Thus, it is an important index for determining the stability of the surrounding rock and supporting structure. The displacement contour and the vertical displacement curve of each monitoring point after tunnel excavation are shown in Figure 8 and Figure 9, respectively.
As shown in Figure 8 and Figure 9, at the end of the left tunnel excavation, the tunnel exhibited asymmetry in the surrounding rock deformation. The maximum subsidence value was 14.314 mm on the right arch shoulder due to the right thickness and left thinness of the overlying terrain. The tunnel was affected by eccentric pressure. Therefore, in the construction process, the surrounding rock stress and lining deformation of the right arch shoulder should be monitored emphatically; the surrounding rock of the arch bottom uplifted, and the maximum uplift value was 12.539 mm at the center of the inverted arch. Due to the timely initial support of the excavation position, the deformation of the tunnel top in the early stage was small, and the maximum settlement value was limited to 5.238 mm. With the gradual excavation, the cumulative deformation value gradually increased. However, the deformation trend was reduced until the excavation face was advanced to 25 m, and the deformation of the top surrounding rock tended to be stable. At the early stage of excavation, the arch bottom was not excavated and the inverted arch could not be applied. Thus, the deformation increment of the arch bottom was larger than that of the arch top, and the maximum bulge value was 6.415 mm until the deformation of the arch bottom stabilized after the excavation surface advanced to 30 m.
At the end of the right tunnel excavation, the surrounding rock deformation was symmetrically distributed, indicating that it was not affected by the eccentric pressure, and the excavation of the right tunnel had little effect on the deformation of the surrounding rock of the left tunnel. As the overlying rock layer of the right tunnel was thick, the settlement and uplift values were greater than those of the left tunnel. The maximum settlement value was found as 17.952 mm, and the maximum uplift value was 16.748 mm, appearing in the arch crown and the center of the inverted arch, respectively. As shown in Figure 9b, the short-term displacement of the surrounding rock changed significantly after each step of rock and soil excavation. Most of the surrounding rock deformation reached stability when the excavation reached 20 m. After the tunnel excavation was completed, vertical displacement contours were intercepted vertically at the center of each tunnel along the tunnel axis direction. Five monitoring points were arranged along the axial direction at the arch bottom of each tunnel, and the change curve of vertical displacement of each monitoring point was obtained, as shown in Figure 10 and Figure 11.
As shown in Figure 10 and Figure 11, from the stratigraphic distribution, due to the tunnel passing through a rock stratum with a different weakening degree, although the deformation at the top of the surrounding rock is the same, the uplift area at the bottom of the surrounding rock is not unevenly distributed along the axis, and the uplift value gradually decreases. From the changes of the curves, it can be seen that the uplift value of the arch bottom had a similar trend and tended to stabilize after the excavation surface advanced 20–25 m. The uplift value of the tunnel front-end was larger than the tunnel back-end. Due to the greater burial depth of the right tunnel, the uplift value of the right tunnel was larger than that of the left tunnel. After the secondary lining was applied, the uplift values at all monitoring points decreased slightly. Therefore, it is necessary to consider that the inverted arch design of the tunnel in the strongly weathered rock area and the right tunnel is strengthened, and the initial support is applied in time after excavation.

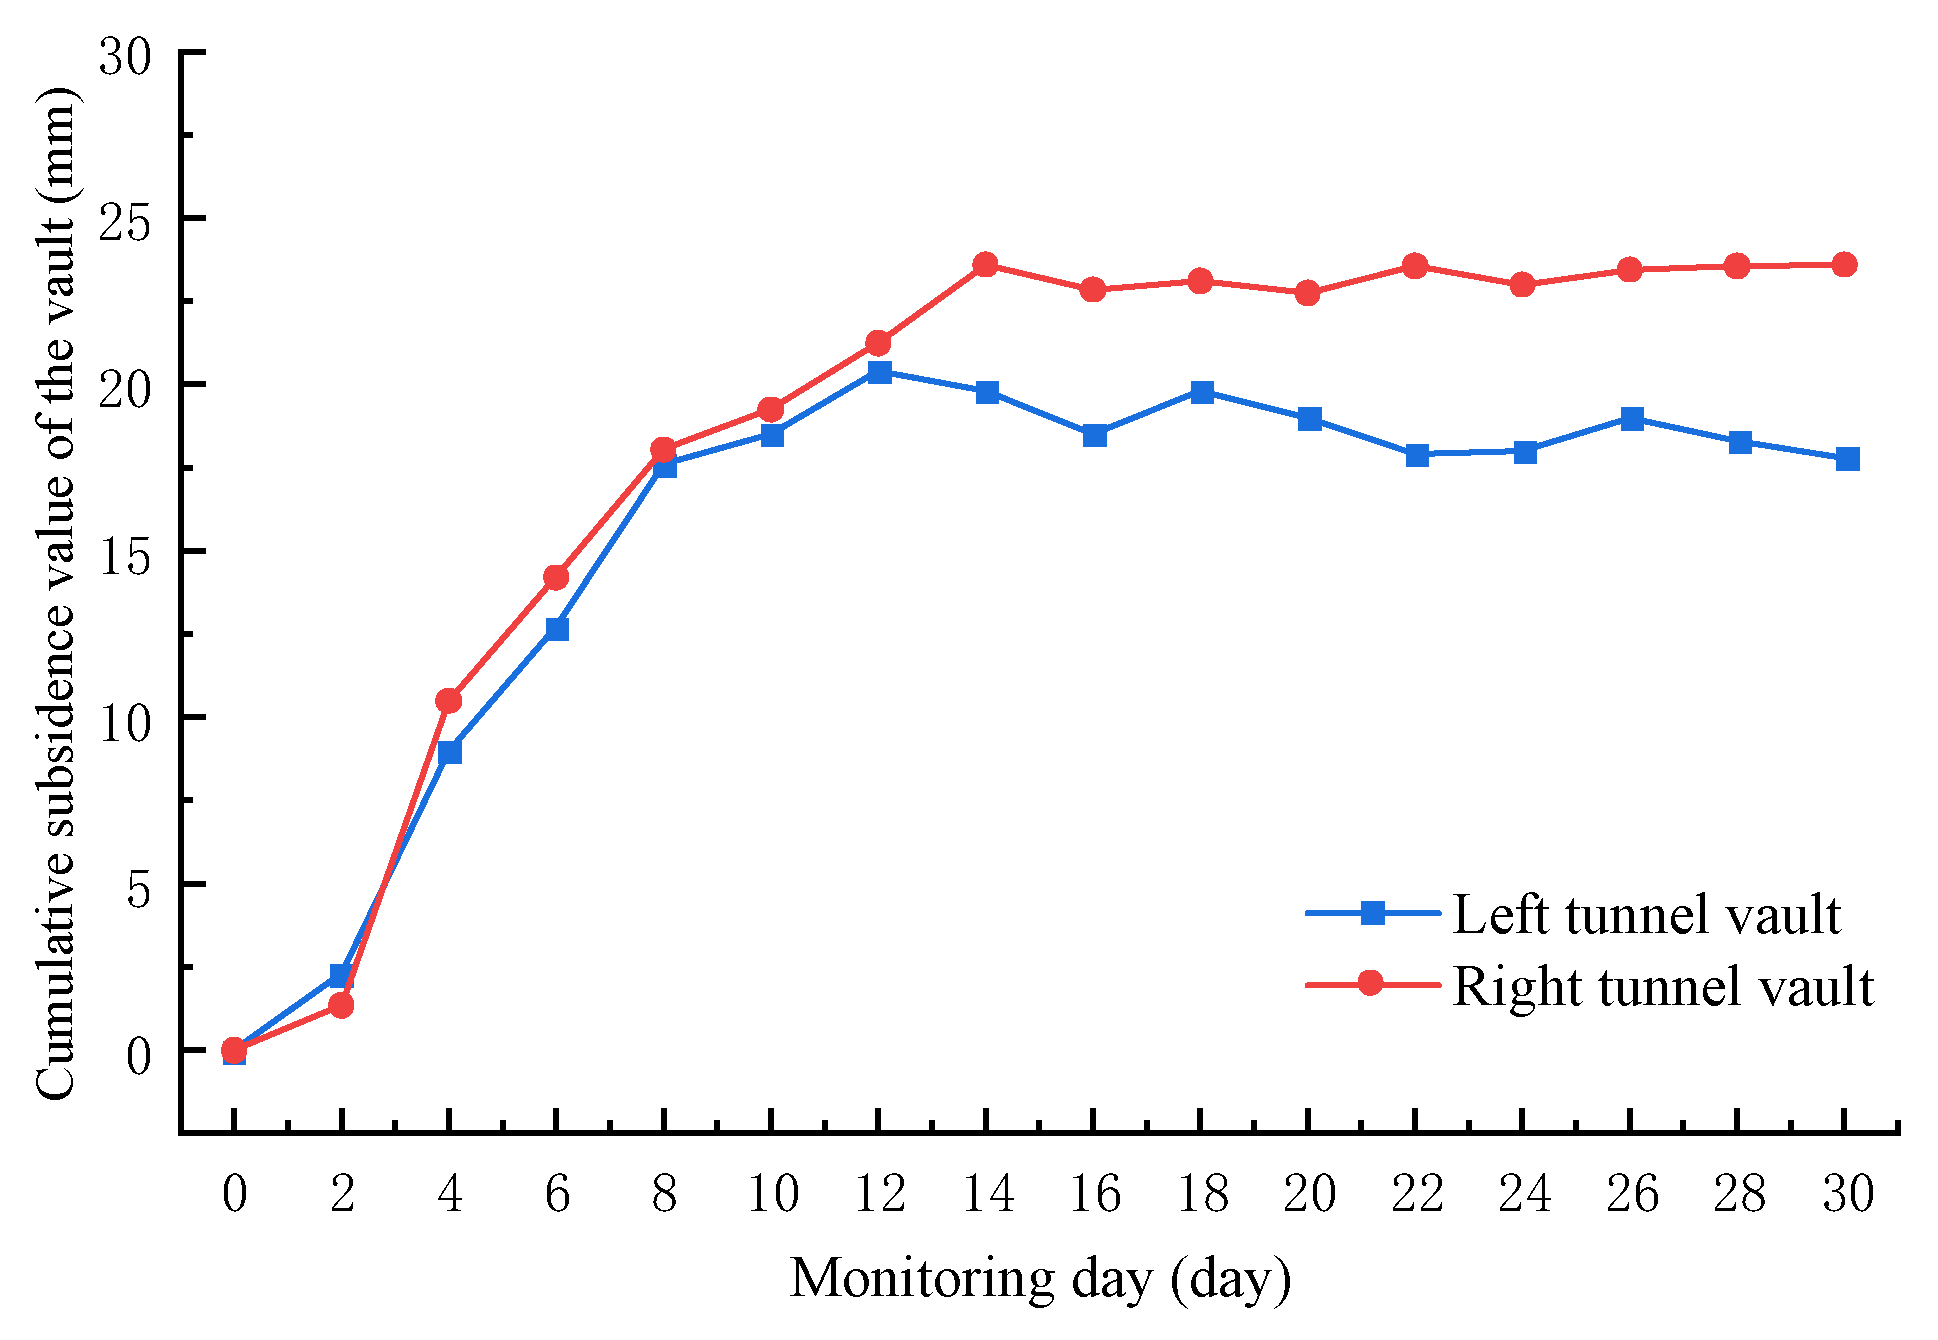
4.1.3. Model Validation

In order to validate the accuracy of the model calculation results, monitoring data were obtained for the portal section of the Guanyin Mountain Tunnel, namely, the cumulative subsidence curves for the vault of the tunnel YK29+268 and ZK29+283 and the surface subsidence curves for the portal section, as shown in Figure 12 and Figure 13, respectively. The surface monitoring points were arranged horizontally at 4 m intervals, with monitoring points ZP1 to ZP3 located above the left tunnel and YP4 to YP7 above the right tunnel.
It can be seen from Figure 13 and Figure 14 that the actual monitoring data of the tunnel and the deformation curve of the numerical model have similar regularity. The maximum subsidence value of the left tunnel vault was 18–20 mm and the maximum ground subsidence value was 14.6 mm, and the measured data were about 4 mm larger than the simulated value; the maximum subsidence value of the right tunnel arch is 22–24 mm and the maximum subsidence value of the ground surface is 16.2 mm, and the measured data are about 2–3 mm larger than the simulated value. This is due to factors such as rheological properties and water-rich conditions not being considered; the measured values were slightly larger than the simulated values and the deformation had a small fluctuating nature. As shown in Figure 13, the maximum subsidence difference in the ground surface occurs in the early stage of excavation and the maximum subsidence point is on the right side directly above the left tunnel and on the left side directly above the right tunnel, which is the same as the results of the model. In conclusion, it shows that the model conforms to the actual project and the calculation results are accurate.

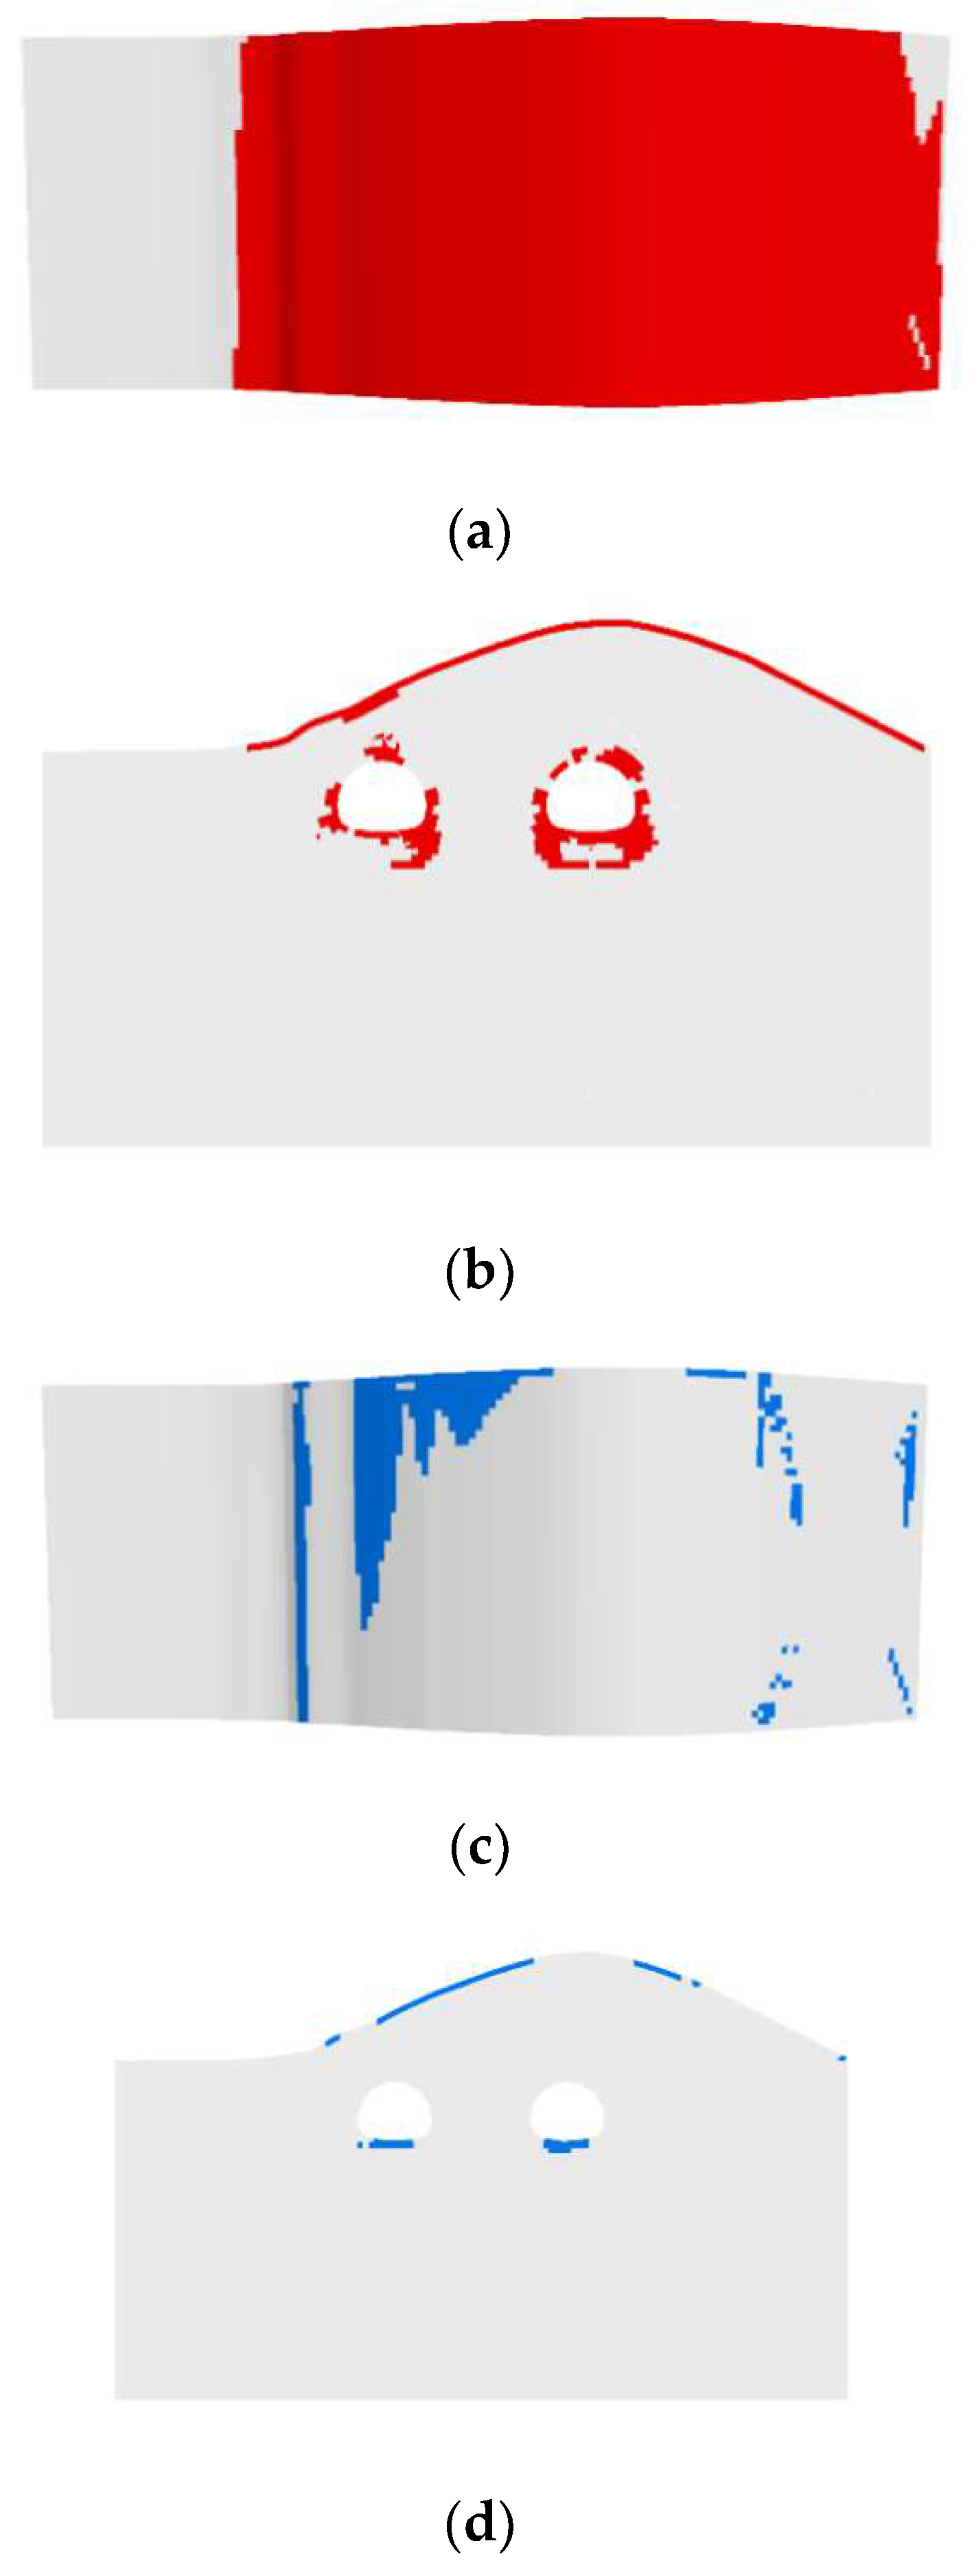
4.2. Plastic Failure Analysis

During tunnel excavation and support, the stress path of the surrounding rock is influenced by the combination of its mechanical properties and support means. By studying the distribution features of the surrounding rock’s plastic zone, the interaction between the surrounding rock and support and the stress features of the tunnel can be intuitively presented, which can reflect the weak links in the construction process and provide a reference for the tunnel support. For revealing the surrounding rock disaster mechanism of the shallow-buried bias tunnel, the plastic zone distribution of the surrounding rock in the middle of the model (Y = 25 m) was selected for analysis after the model excavation, as shown in Figure 14.
As shown in Figure 14, there were two types of failure in the surrounding rock, i.e., shear and tension failure (mainly, it is shear failure). The distribution of the plastic zone in the surrounding rock of the left tunnel was asymmetric. The damage was mainly concentrated in the larger range of the arch crown and the right arch foot, and the deepest part was about 6 m away from the tunnel outline line. The distribution of the plastic zone in the surrounding rock of the right tunnel was symmetrical. The damage was mainly concentrated in the right arch shoulder and bottom, and the deepest part was about 6 m away from the tunnel outline line. The tension-type failure occurred mainly in the shallow part of the surrounding rocks at the bottom of the arch of the double tunnel, and the affected area was small. During the construction, the arch foot and bottom positions should be focused.

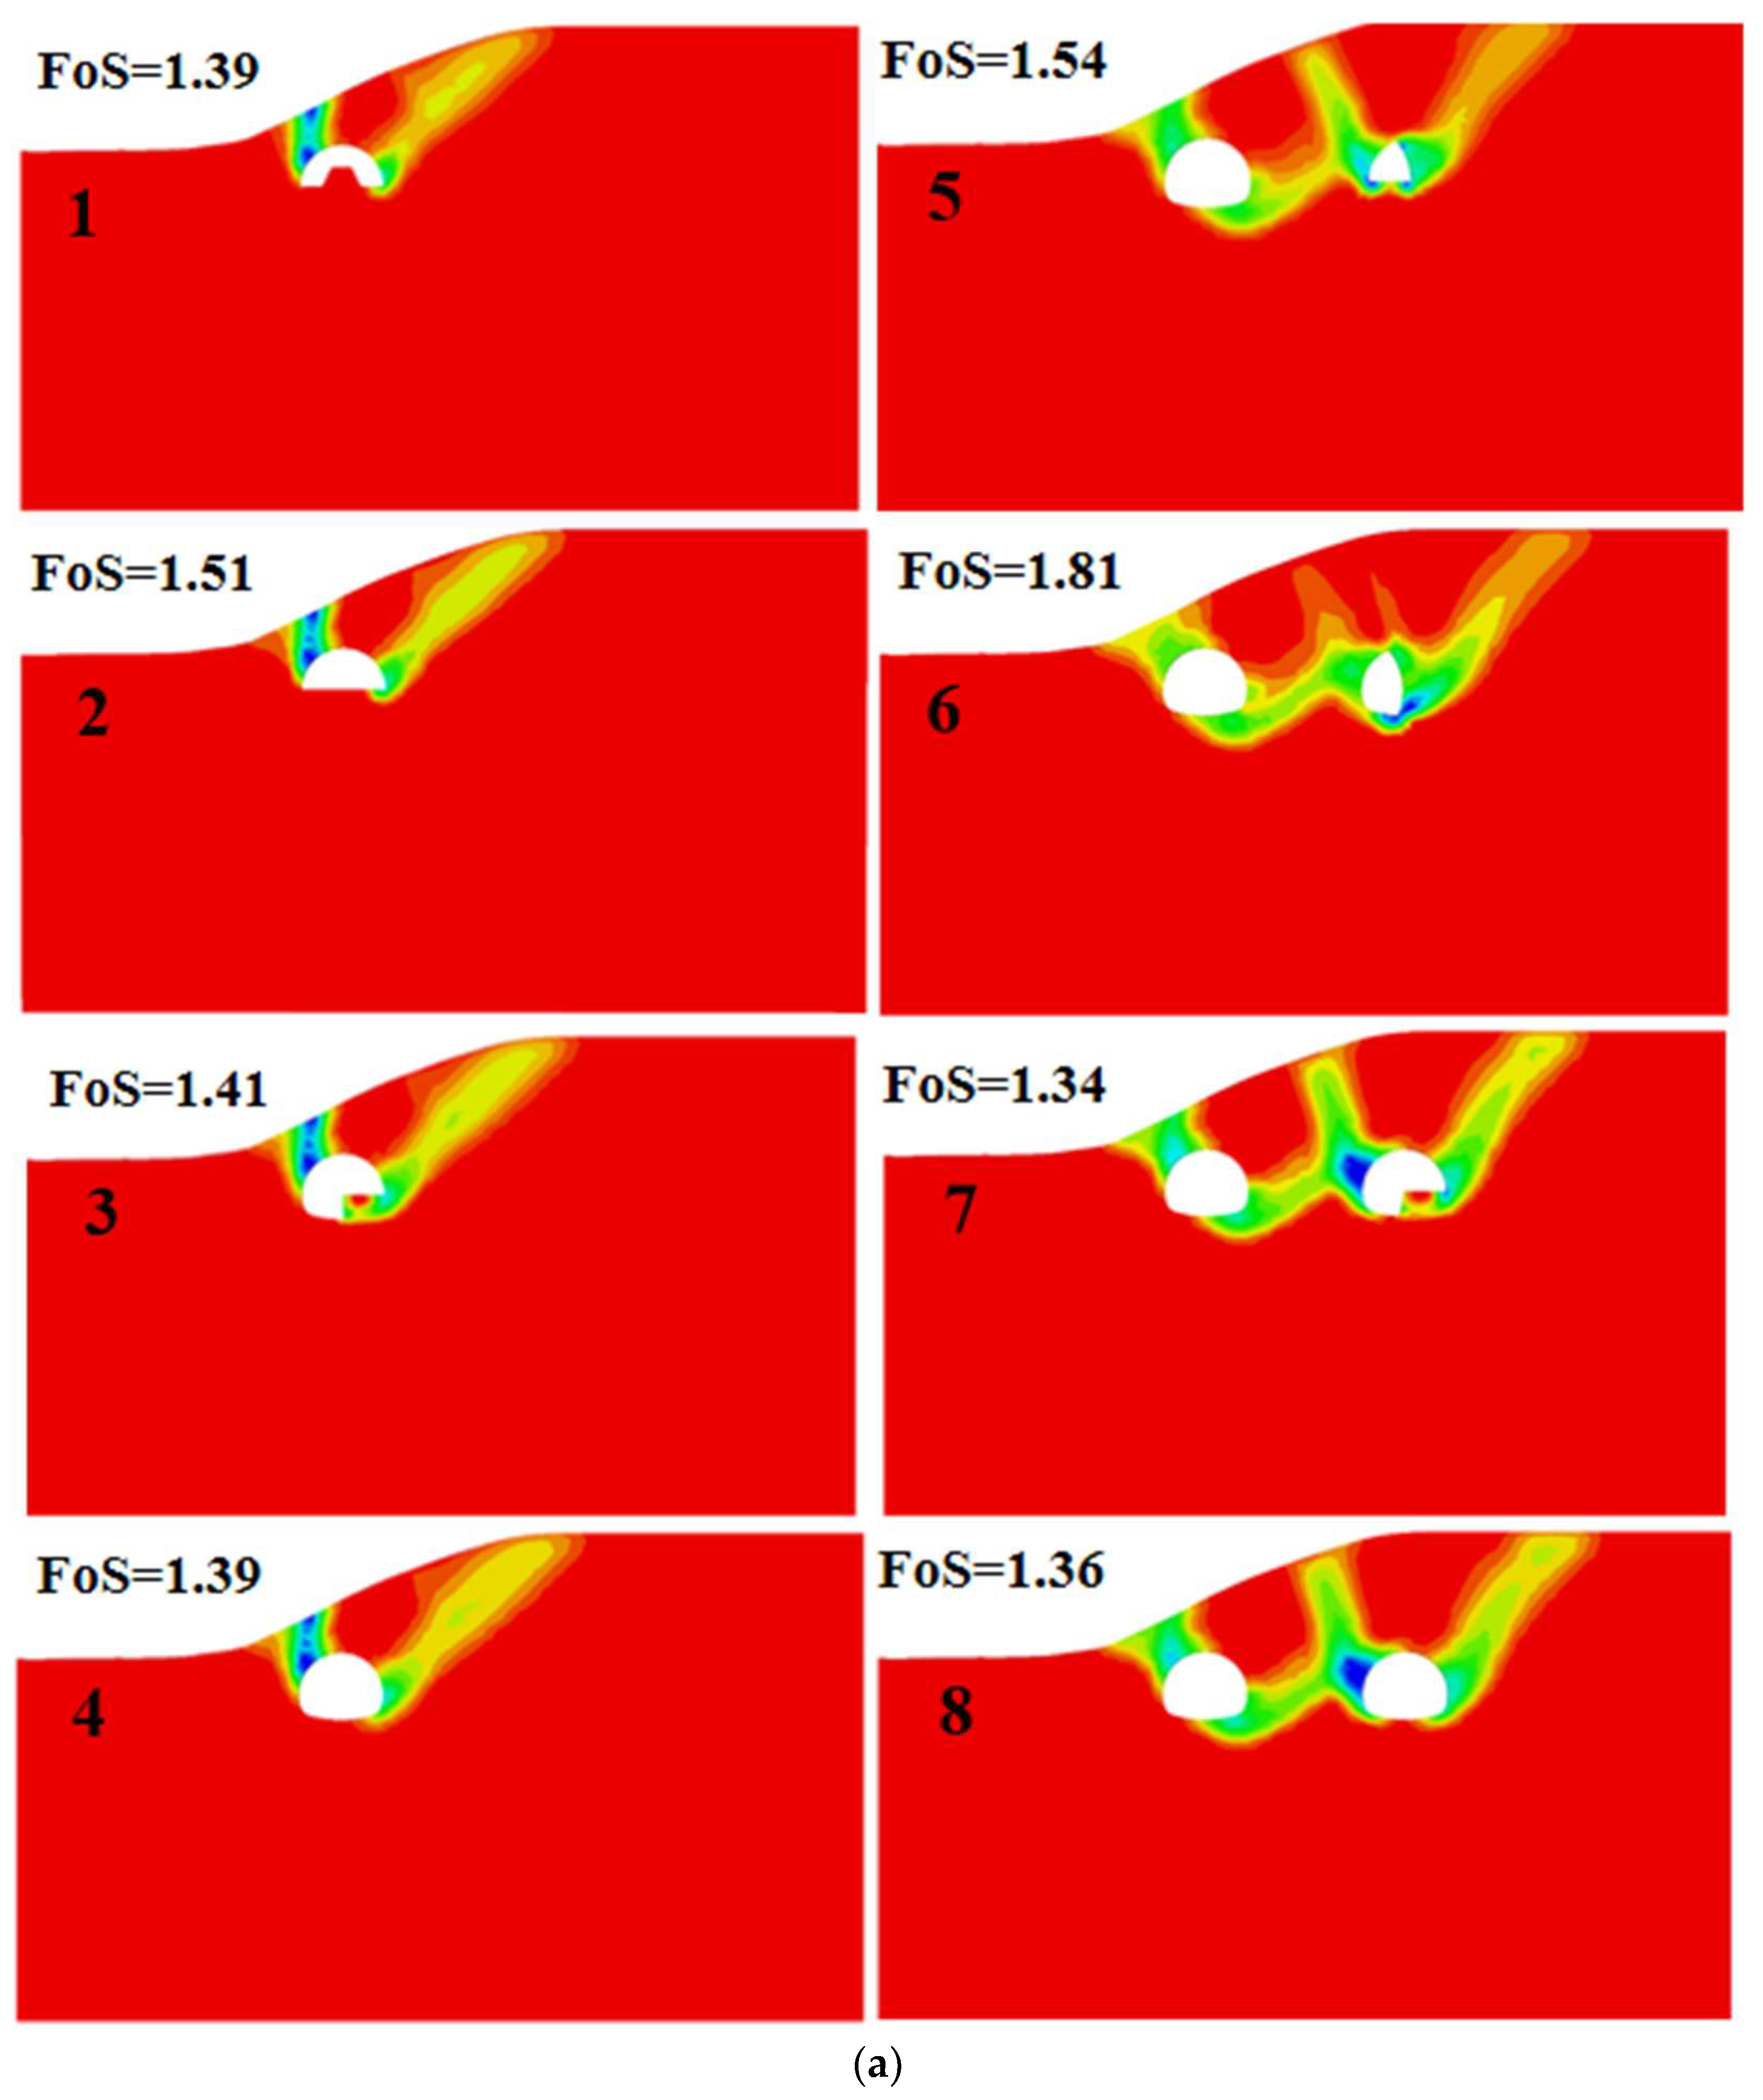
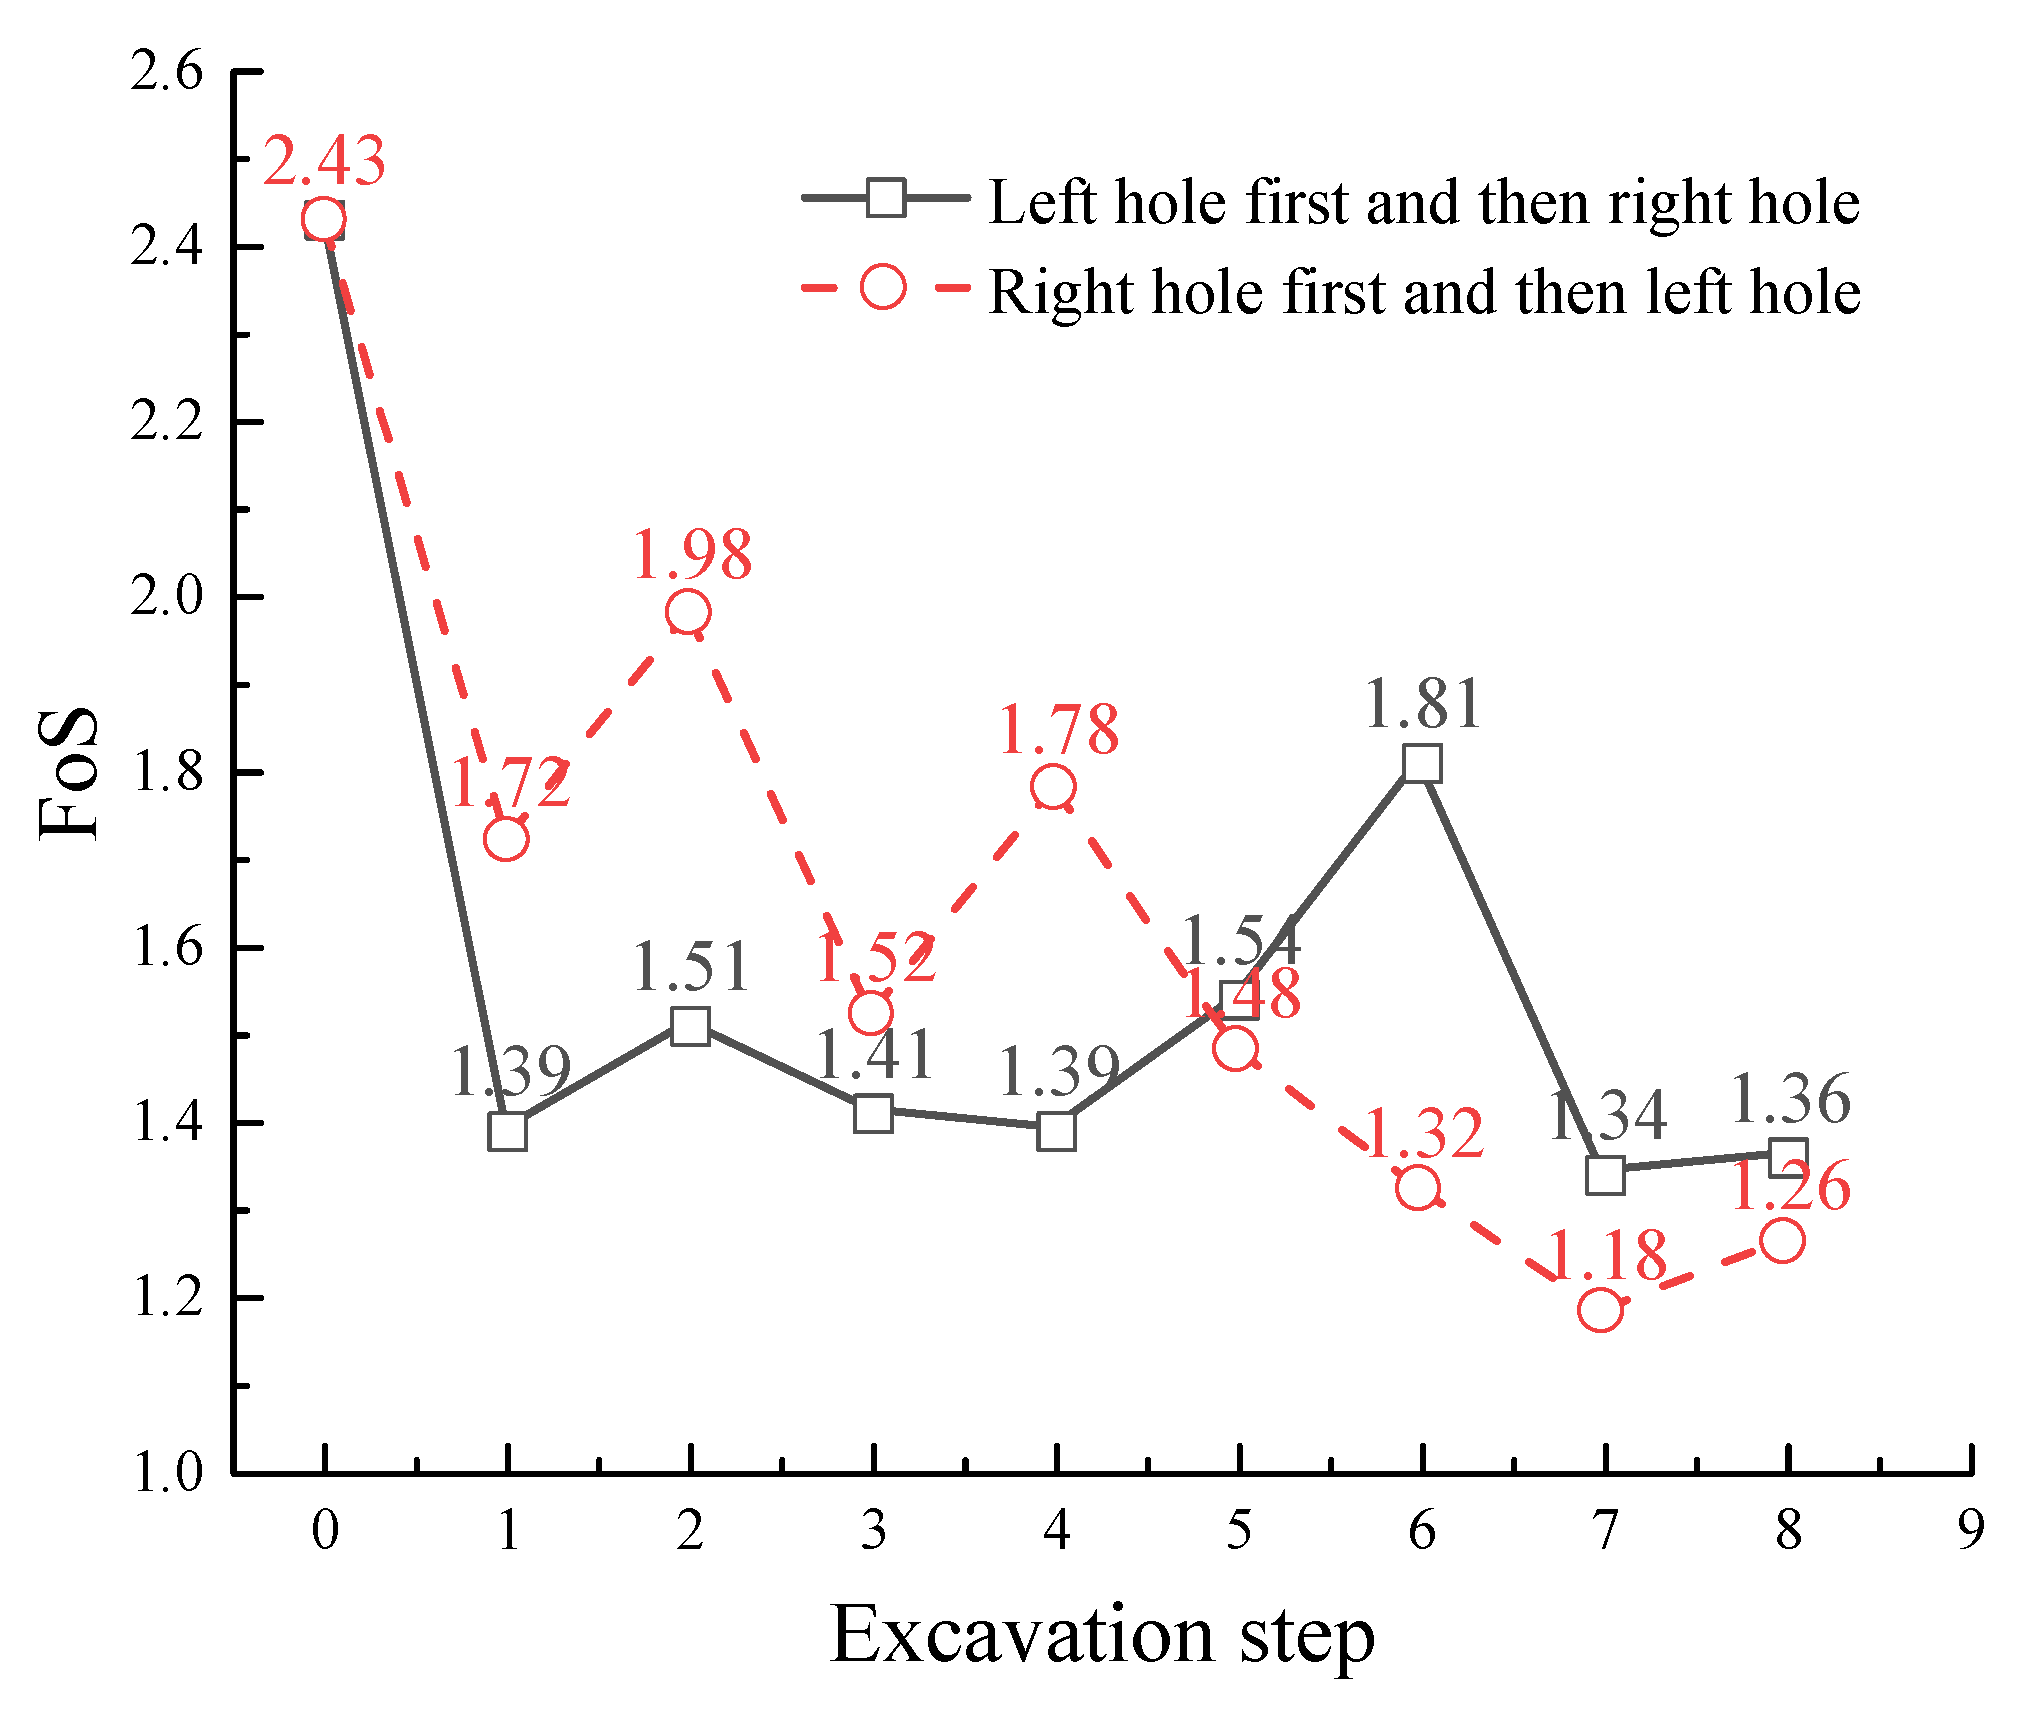
5. Stability Analysis of Tunnel Slope

The slope above the portal section of the tunnel has a small longitudinal slope and a large transverse slope. According to the plane strain hypothesis, the area within 1 m along the axis direction of the model was selected to simulate and analyze the slope stability during tunnel excavation. To maintain model consistency, the model constitutive and its parameters remain the same. The finite-difference strength-reduction method embedded in FLAC 3D was used to compute the safety coefficient and analyze the slope results. The expression of the slope safety factor is defined as Equations (10) and (11) [29]:
c trial = c F trial
φ trial = arctan ( tan φ F trial )
where c and φ are the cohesion and angle of internal friction of the material, respectively; Ftrial is the reduction factor; and ctrial and φtrial are the cohesion and angle of internal friction of the material after strength reduction, respectively.
Since the model has two slopes in the lateral direction, the calculation will be retrieved simultaneously, which increases the calculation time. The tunnel is in a shallow-buried bias section, and the tunnel excavation has more influence on the left side of the rock–soil mass, so we only consider the influence of the tunnel excavation on the left side of the slope. In order to accurately calculate the affected slope surface, the right half of the original model was set as the horizontal plane. The safety coefficient was calculated for each construction step in the tunnel excavation process, and the safety of each construction step was evaluated with reference to the safety coefficient of the slope when the tunnel was not excavated, and the relationship between the safety coefficient and the construction process and maximum shear strain increment contour were obtained, as shown in Figure 15 and Figure 16.
As shown in Figure 15 and Figure 16, The initial safety factor for the unexcavated phase of the tunnel was the highest, at 2.43. The overall safety factor of the slope decreases as the tunnel progresses, while the initial support improves the stability of the slope to some extent. When the left tunnel was excavated first, the potential slip area was primarily situated between the left side of the excavation area and the area closest to the surface and on the right side of the tunnel. Then, when the right tunnel was excavated, the slip area of the left tunnel was moved down to the arch foot and connected with the right tunnel to form a larger slip area. When the right tunnel was excavated first, the influence was small because the tunnel was farther away from the slope. Figure 16 shows that only the right tunnel was excavated with a higher safety factor than when only the left tunnel was excavated. The rock excavation of the upper half under the CD method caused a large disturbance to the surrounding rock, which directly led to a large float of the slope safety factor, while the excavation of the lower half caused a relatively small disturbance to the surrounding rock, which was due to the initial support and temporary support forming a closed structure, which improved the stability of the slope; thus, advanced support should be applied before the excavation of the upper part of the tunnel, and the initial support should be applied in time after the excavation. However, due to the influence of the right tunnel excavation, the factor of safety of the slope decreased rapidly when the left tunnel was excavated, and the stability of the slope was slightly improved until the left tunnel supporting structure formed a closed structure. It can be seen that the initial support applied in time after the tunnel excavation can improve the safety of the construction environment. In the whole simulation process, the minimum safety factor was 1.18, so it was recommended to excavate the left tunnel first and then the right tunnel during construction.

6. Conclusions

In this study, the Guanyin Mountain Tunnel of the Chong-Ai expressway was taken as a case study. Based on the FLAC 3D numerical analysis software, the whole construction process of the tunnel portal was simulated, and the viability of the plan was verified from the surface settlement, surrounding rock deformation, and slope stability. The analysis results and construction suggestions of this research can be generalized as follows:
(1) By monitoring the model surface, it can be observed that the ground subsidence mainly occurred after excavating the upper part of the left tunnel and the right part of the right tunnel. The main subsidence area was located on the right side above the left tunnel and above the center of the right tunnel. The settlement values were 10.467 mm and 10.740 mm, respectively, with a settlement range of 100 m. The surface deformation does not exceed the standard limit, so it meets the safety standards.
(2) By monitoring the surrounding rocks of the tunnel model, due to eccentric pressure, the deformation of the surrounding rock in the left tunnel showed an asymmetric distribution, the maximum deformation was located at the arch shoulder, and the settlement value was 14.314 mm. Therefore, the support of the right arch shoulder of the left tunnel needs to be strengthened. The deformation of the surrounding rock of the right tunnel was symmetrically distributed, and the maximum drop value of the arch crown was 17.952 mm. After the excavation face advances to 30 m, the deformation around the tunnel can all stabilize. It should be noted that, in the part of the tunnel in the area of strongly weathered rock, the uplift value of the arch bottom is larger. The tunnel arch bottom and arch foot easily appear to have a large area of the shear-damage plastic zone, and this area should be reinforced.
(3) The excavation sequence of the tunnel in the shallow-buried eccentric-pressure section was suggested to adopt the method of excavating the left tunnel first and then the right tunnel. If the right tunnel was excavated first, the slope stability would continue to decline and be in a critical safety state when the left tunnel was excavated due to the disturbance of the rock mass on the right. If the left tunnel is excavated first, the support measures can be changed in time according to the change of the slope, and in the process of excavating the right tunnel, it was safe for the slope because it was not affected by the eccentric pressure. The initial support is applied in time after the tunnel excavation so that the support forms a closed structure, which can improve the safety of the construction environment
(4) The rock mass and environment are complex, and it is difficult to simulate exactly the same geological conditions as reality through numerical software. This study did not consider the influence of rock-joint and fracture development and water-richness on the surrounding rock deformation; subsequent studies can set the Joints unit in 3DEC or the interface unit in FLAC 3D to simulate the existence of rock joints and fractures, and also perform the calculation of fluid–solid coupling.

Author Contributions

Conceptualization, Z.H. (Zhen Huang); Data curation, Z.H. (Zhaojian Hu); Formal analysis, H.Z.; Investigation, C.L. and H.Z.; Methodology, Z.H. (Zhaojian Hu) and Z.H. (Zhen Huang); Project administration, X.L. and Z.H. (Zhen Huang); Resources, C.L.; Software, Z.H. (Zhaojian Hu); Supervision, H.Z., X.L. and Z.H. (Zhen Huang); Validation, X.L.; Visualization, Z.H. (Zhaojian Hu); Writing—original draft, Z.H. (Zhaojian Hu); Writing—review & editing, C.L. and Z.H. (Zhen Huang). All authors have read and agreed to the published version of the manuscript.

Funding

This research received no external funding.

Institutional Review Board Statement

Not applicable.

Informed Consent Statement

Not applicable.

Data Availability Statement

The experimental data used to support the findings of this study are available from the corresponding author upon request.

Conflicts of Interest

The authors declare that they have no known competing financial interests or personal relationships that could have appeared to influence the work reported in this paper.

References

  1. Konietzky, H.; Kamp, L.T.; Hammer, H.; Niedermeyer, S. Numerical modelling of in situ stress conditions as an aid in route selection for rail tunnels in complex geological formations in South Germany. Comput. Geotech. 2001, 28, 495–516. [Google Scholar] [CrossRef]
  2. Del Greco, O.; Oggeri, C. Reinforcement design and control of rock slopes above tunnel portals in northern Italy. Int. J. Rock Mech. Min. Sci. 2004, 41, 515. [Google Scholar] [CrossRef]
  3. Deng, X.; Xu, T.; Wang, R. Risk evaluation model of highway tunnel portal construction based on BP fuzzy neural network. Comput. Intell. Neurosci. 2018, 2018, 8547313. [Google Scholar] [CrossRef] [PubMed]
  4. Wang, Z.Z.; Zhang, Z. Seismic damage classification and risk assessment of mountain tunnels with a validation for the 2008 Wenchuan earthquake. Soil Dyn. Earthq. Eng. 2013, 45, 45–55. [Google Scholar] [CrossRef]
  5. Zhang, Q.; Wang, J.; Zhang, H. Attribute recognition model and its application of risk assessment for slope stability at tunnel portal. J. Vibroengineering 2017, 19, 2726–2738. [Google Scholar] [CrossRef]
  6. Lei, M.; Lin, D.; Yang, W.; Shi, C.-H.; Peng, L.-M.; Huang, J. Model test to investigate failure mechanism and loading characteristics of shallow-bias tunnels with small clear distance. J. Cent. South Univ. 2016, 23, 3312–3321. [Google Scholar] [CrossRef]
  7. Sun, Z.Y.; Zhang, D.L.; Fang, Q.; Su, W. Distribution of Surrounding Rock Pressure of Shallow Highway Tunnels with Small Spacing. China J. Highw. Transp. 2018, 31, 84. [Google Scholar]
  8. Hu, Z.; Shen, J.; Wang, Y.; Guo, T.; Liu, Z.; Gao, X. Cracking characteristics and mechanism of entrance section in asymmetrically-load tunnel with bedded rock mass: A case study of a highway tunnel in southwest China. Eng. Fail. Anal. 2021, 122, 105221. [Google Scholar] [CrossRef]
  9. Qiu, H.; Chen, X.; Wu, Q.; Wang, R.-C.; Zhao, W.-Y.; Qian, K.-J. Deformation mechanism and collapse treatment of the rock surrounding a shallow tunnel based on on-site monitoring. J. Mt. Sci. 2020, 17, 2897–2914. [Google Scholar] [CrossRef]
  10. Yang, C.; Hu, Z.; Huang, D.; Guo, F. Failure mechanism of primary support for a shallow and asymmetrically loaded tunnel portal and treatment measures. J. Perform. Constr. Facil. 2020, 34, 04019105. [Google Scholar] [CrossRef]
  11. Wang, F.; Li, J.; Ding, L.; Wang, Y.; Song, Z. Construction stability analysis of large section highway tunnel portal section based on numerical analysis. In IOP Conference Series: Earth and Environmental Science; IOP Publishing: Bristol, UK, 2021; Volume 643, p. 012176. [Google Scholar]
  12. Xiao, J.Z.; Dai, F.C.; Wei, Y.Q.; Xing, Y.C.; Cai, H.; Xu, C. Analysis of mechanical behavior in a pipe roof during excavation of a shallow bias tunnel in loose deposits. Environ. Earth Sci. 2016, 75, 293. [Google Scholar] [CrossRef]
  13. Song, D.; Liu, X.; Chen, Z.; Cai, J. Influence of tunnel excavation on the stability of a bedded rock slope: A case study on the mountainous area in southern Anhui, China. KSCE J. Civ. Eng. 2021, 25, 114–123. [Google Scholar] [CrossRef]
  14. Kaya, A.; Akgün, A.; Karaman, K.; Bulut, F. Understanding the mechanism of slope failure on a nearby highway tunnel route by different slope stability analysis methods: A case from NE Turkey. Bull. Eng. Geol. Environ. 2016, 75, 945–958. [Google Scholar] [CrossRef]
  15. Li, D.; Ma, S.; Lane, M.; Chang, P.; Crompton, B.; Hagen, S.A. Laboratory investigations into the failure mechanisms of new yielding and inflatable rockbolts under axial and shearing loading conditions. Rock Mech. Rock Eng. 2022, 56, 565–587. [Google Scholar] [CrossRef]
  16. Li, D.; Li, Y.; Zhu, W. Analytical modelling of load–displacement performance of cable bolts incorporating cracking propagation. Rock Mech. Rock Eng. 2020, 53, 3471–3483. [Google Scholar] [CrossRef]
  17. Yang, X.L.; Huang, F. Collapse mechanism of shallow tunnel based on nonlinear Hoek–Brown failure criterion. Tunn. Undergr. Space Technol. 2011, 26, 686–691. [Google Scholar] [CrossRef]
  18. Senent, S.; Mollon, G.; Jimenez, R. Tunnel face stability in heavily fractured rock masses that follow the Hoek–Brown failure criterion. Int. J. Rock Mech. Min. Sci. 2013, 60, 440–451. [Google Scholar] [CrossRef]
  19. Hoek, E. Strength of rock and rock masses. ISRM News J. 1994, 2, 4–16. [Google Scholar]
  20. Hoek, E.; Kaiser, P.; Bawden, W. Support of Underground Excavations in Hard Rock; CRC Press: Rotterdam, The Netherlands, 2000. [Google Scholar]
  21. Cai, M.; Kaiser, P.K.; Uno, H.; Tasaka, Y.; Minami, M. Estimation of rock mass deformation modulus and strength of jointed hard rock masses using the GSI system. Int. J. Rock Mech. Min. Sci. 2004, 41, 3–19. [Google Scholar] [CrossRef]
  22. Bertuzzi, R.; Douglas, K.; Mostyn, G. Improving the GSI Hoek-Brown criterion relationships. Int. J. Rock Mech. Min. Sci. 2016, 89, 185–199. [Google Scholar] [CrossRef]
  23. Cai, M. Practical estimates of tensile strength and Hoek–Brown strength parameter mi of brittle rocks. Rock Mech. Rock Eng. 2010, 43, 167–184. [Google Scholar] [CrossRef]
  24. Hoek, E.; Brown, E.T. The Hoek–Brown failure criterion and GSI–2018 edition. J. Rock Mech. Geotech. Eng. 2019, 11, 445–463. [Google Scholar] [CrossRef]
  25. Hoek, E.; Diederichs, M.S. Empirical Estimation of Rock Mass Modulus. Int. J. Rock Mech. Min. Sci. 2006, 43, 203–215. [Google Scholar] [CrossRef]
  26. Ministry of Transport of the People’s Republic of China. JTG 3370.1-2018; Highway Tunnel Design Code; China Communications Press: Beijing, China, 2019.
  27. Zhou, P.; Shen, Y.; Zhao, J.; Zhang, X.; Gao, B.; Zhu, S. Study on the Disaster Mechanism of Steep Melanite Tunnel Based on Improvement Model. J. Rock Mech. Eng. 2019, 38, 1870–1883. [Google Scholar]
  28. St John, C.M.; Van Dillen, D.E. Rockbolts: A new numerical representation and its application in tunnel design. In Proceedings of the 24th US Symposium on Rock Mechanics (USRMS), College Station, TX, USA, 12–16 June 1983; OnePetro: Richardson, TX, USA, 1983. [Google Scholar]
  29. Illeditsch, M.; Preh, A.; Sausgruber, J.T. Challenges Assessing Rock Slope Stability Using the Strength Reduction Method with the Hoek–Brown Criterion on the Example of Vals (Tyrol/Austria). Geosciences 2022, 12, 255. [Google Scholar] [CrossRef]
Figure 1. Geological longitudinal section of the Guanyin Mountain tunnel entrance section.
Applsci 13 05024 g001
Figure 2. (A) DEM data; (B) grayscale image; and (C) Rhino surface model.
Applsci 13 05024 g002
Figure 3. Rhino–Griddle joint modeling process.
Applsci 13 05024 g003
Figure 4. Three-dimensional model of tunnel.
Applsci 13 05024 g004
Figure 5. Tunnel section and lining structure design.
Applsci 13 05024 g005
Figure 6. Construction sequence of grade V surrounding rock section of tunnel.
Applsci 13 05024 g006
Figure 7. Surface settlement curve: (a) surface settlement of the left tunnel excavation; and (b) surface settlement of the right tunnel excavation.
Applsci 13 05024 g007
Figure 8. Contours of the tunnel displacement: (a) excavation of the left tunnel; and (b) excavation of the right tunnel.
Applsci 13 05024 g008
Figure 9. Vertical displacement curve of the inner contour monitoring point: (a) the left tunnel; and (b) the right tunnel.
Applsci 13 05024 g009
Figure 10. Contour of vertical displacement of tunnel section: (a) the left tunnel; and (b) the right tunnel.
Applsci 13 05024 g010
Figure 11. Change curve of monitoring point of tunnel section: (a) the left tunnel; and (b) the right tunnel.
Applsci 13 05024 g011
Figure 12. Cumulative subsidence temporal curve of the vault at the tunnel portal section.
Applsci 13 05024 g012
Figure 13. Surface subsidence temporal curve at tunnel portal section: (a) the left tunnel; and (b) the right tunnel.
Applsci 13 05024 g013
Figure 14. Distribution of different plastic zones: (a) distribution of shear plastic zone on the slope surface; (b) distribution of shear plastic zone of the surrounding rock; (c) distribution of tension plastic zone on the slope surface; and (d) distribution of tension plastic zone of the surrounding rock.
Applsci 13 05024 g014
Figure 15. Maximum shear strain increment: (a) excavation of the left tunnel first and then the right tunnel; and (b) excavation of the right tunnel first and then the left tunnel.
Applsci 13 05024 g015aApplsci 13 05024 g015b
Figure 16. FoS data of slope models.
Applsci 13 05024 g016
Table 1. Basic parameters of tunnel rock formations.
Material PropertiesClayStrongly Weathered RockModerately Weathered Rock
Unit weight, γ (kN/m3)18.023.525.6
Young’s modulus/E (MPa)16255986
Poisson’s ratio/v0.400.350.30
Cohesion/c (kPa)2550200
Internal friction angle/(°)163550
Hoek–Brown parameter/a/0.53130.5114
Hoek–Brown parameter/mb/0.2870.574
Hoek–Brown parameter/s/4.54 × 10−53.35 × 10−4
Saturated uniaxial compressive strength/(MPa)/8.526.1
Table 2. Basic parameters of tunnel structure material after equivalence.
Support ItemsEquivalent Density ρeq/(kg/m3)Equivalent Elastic Modulus Eeq/(GPa)Thickness/m Poisson’s Ratio/v
Initial support235028.00.300.25
Secondary lining250032.50.350.20
Table 3. Parameters of the anchor rod.
Cable PropertiesValue
Anchor rod section area/mm2490.9
Anchor rod elastic modulus/GPa200
Anchor density/(kg·m−3)7850
Anchor rod tensile strength/MN0.2
Mortar shear modulus/GPa9.5
Unit-length mortar stiffness kg/GPa17.556
Mortar bonding force cg/(kg·m−1)159.40
Slot outer circumference/m0.139
Cement slurry friction angle/(°)25
Disclaimer/Publisher’s Note: The statements, opinions and data contained in all publications are solely those of the individual author(s) and contributor(s) and not of MDPI and/or the editor(s). MDPI and/or the editor(s) disclaim responsibility for any injury to people or property resulting from any ideas, methods, instructions or products referred to in the content.

