Article

Studying the Favorable Zone for Pressure-Relief Gas Extraction by Combining Numerical Investigation and On-Site Application

1
CCTEG Shenyang Research Institute, Fushun 113122, China
2
State Key Laboratory of Coal Mine Safety Technology, Fushun 113122, China
3
China Coal Research Institute, Beijing 100013, China
*
Author to whom correspondence should be addressed.
Appl. Sci. 2023, 13(8), 5045; https://doi.org/10.3390/app13085045
Submission received: 14 March 2023 / Revised: 5 April 2023 / Accepted: 12 April 2023 / Published: 18 April 2023
(This article belongs to the Section Applied Industrial Technologies)

Abstract

:
Gas extraction in the pressure-relief area using the depressurization effect of seam mining is an effective way to solve coal-mine gas problems. In this paper, we performed numerical modelling of the 204 working face via FLAC 3D, by which the stress variation of the rock mass and associated permeability evolution during the working face advancement were investigated. Furthermore, the favorable gas extraction zone for pressure relief was proposed based on the gas extraction performance of the on-site boreholes. The results show that: (1) gas extraction varies with the evolution of the three zones of the overlying rock and the associated permeability variation, which becomes stable when the height of the three zones remains unchanged; (2) the favorable zone for gas extraction of the 204 working face ranges from 13 m to 19 m of Dv, in which the gas extraction of on-site boreholes are located, presents better performance than other areas; (3) the gas extraction volume of the optimized gas extraction scheme rises to 77.46 m3/min with a 77.26% gas extraction rate, eliminating gas overrun in the working face and upper corner and increasing the advancement speed to 6.4 m/d. The on-site verification confirms the numerical simulation scope, more accurately determining the favorable zone for gas extraction. This may provide a reliable approach for improving the pressure-relief gas extraction performance and reducing the associated engineering costs.

1. Introduction

Coal resource remains one of the primary sources of energy supporting economic development for a long time in the future [1,2,3,4]. Coal gas, as an associated resource of coal, may cause devastating dangers, which become more severe as the mining depth increases [3,5,6]. Studying the stress distribution of the coal-rock mass and the associated gas migration evolution is important for proposing efficient gas extraction measures and ensuring the safe production of gas-bearing coal mines [1,7,8].
Coal mining unbalances the stress state of the coal-bearing strata, inducing coal-rock mass damage and breakage [9,10]. During this process, fractures in the coal-rock mass initiate, propagate, and nucleate, forming complex fracture networks. This dramatically increases the permeability of coal-rock mass, providing favorable channels for coal gas migration and accumulation [1]. Numerous researchers have extensively studied the fracture distribution in the overlying rock and induced gas migration through theoretical analysis [11,12,13], numerical simulation [9,14], and field studies [15,16]. The overlying roof of the coal seam gradually forms three distinctive zones in the vertical direction with the advancement of the working face (Figure 1), namely, the caved zone, the fractured zone, and the continuous zone [10,14]. The permeability of rock mass in the fractured zone is considered the most appropriate for gas extraction due to numerous horizontal and vertical fractures and poor connectivity with the mining goaf [10,17]. Then, the three-zone model is continuously improved to the four-zone model [12] and the five-zone model [10] based on the deformation and failure of the overlying rock mass [10], aiming to determine the most favorable gas extraction area. Yu et al. [18] investigated coal gas extraction of a working face after pressure relief through protective layer mining, promoting the theory of pressure-relief gas extraction. Qian and Xu [9,13,19] revealed the fracture evolution of the overlying rock mass through numerous in situ observations and established the O-shape theory of gas extraction under pressure relief. They proposed that numerous induced fractures in the O-shape area significantly enhance the permeability of the rock mass, which is beneficial for gas extraction. Subsequent studies further promoted these theories by investigating the correlation between gas migration and fracture distribution in the pressure-relief area, optimizing the drilling planning for the pressure-relief gas extraction to ensure acceptable performance. Tu et al. [20] and Li [21] found that fractures in the overlying rock mass develop continuously, rapidly increasing rock mass permeability as the vertical fractures connect with the separated fractures. Xu et al. [19] investigated gas migration in the overlying rock mass and divided it into hard desorption zone, pressure-relief desorption zone, and gas conduction fractured zone. They suggested that the gas extraction boreholes should be drilled in the pressure-relief desorption zone to achieve a considerable extracting effect. Qu et al. [22] presented that rock mass relieves pressure thoroughly when its expansion rate reaches 3‰, which can be used as a critical index for pressure-relief gas extraction. Yuan et al. [23,24,25] determined the best amount and negative pressure of pressure-relief gas extraction by investigating gas migration and the associated gas concentration evolution in the goaf. Previous researchers have made a tremendous progress in investigating the stress and fracture evolution of the overlying rock mass. However, limited efforts have been reported on the mutual effects of fracture distribution, rock permeability, and gas extraction performance. The effect of stress and fracture evolution on the favorable zone for pressure-relief gas extraction has not been thoroughly explored.
Here, we perform numerical simulations using FLAC 3D to investigate the stress and permeability evolution of the overlying rock mass. We then conduct an in situ gas extraction experiment on the basis of simulation results and investigate gas extraction performance to identify the favorable zone for the pressure-relief gas extraction.

2. Materials and Methods

2.1. Fundamental Assumptions

The following assumptions are proposed to facilitate numerical calculation: (1) the rock mass is a continuous medium that can be described using continuous medium mechanics models; (2) it is isotropic with the same physical properties in all directions and linearly elastic with the linear relationship between stress and strain; (3) the rock deformation is small, and the rock failure occurs when the stress reaches its strength limit, following the Mohr–Coulomb criterion.

2.2. Governing Equations

In the elastic and isotropic model of FLAC, strain increments generate stress increments according to the linear and reversible law of Hooke:
Δ σ i j = 2 G Δ ε i j + α 2 Δ ε k k δ i j
where σ i j is the stress, ε i j is the strain, δ i j is the Kroenecker delta symbol, and α 2 is a material constant related to K and G, as
α 2 = K 2 3 G
where K is the bulk modulus, K = E / 3 ( 1 2 v ) , G is the shear modulus, G = E / 2 ( 1 + v ) , E is Young’s modulus, and ν is Poisson’s ratio. New stress values are then obtained from the relation:
σ i j N = σ i j + Δ σ i j
The permeability of the coal-rock mass presents extreme heterogeneity changed by numerous factors, among which the surrounding stress and gas pressure induced by the overlying strata dominate the permeability variation [7,26].
In Terzaghi’s theory, effective stress is dominated by the surrounding stress and the gas pressure, which can be expressed as follows:
σ = σ p
where σ is the effective stress, σ is the ground stress, and p is the gas pressure.
The permeability k decreases rapidly with increased ground stress under the unchanged gas pressure in a true triaxial permeameter, during which the permeability can be expressed by the exponential equation as follows:
k = k 0 e β σ
where k 0 is the permeability of the coal sample under the ideal condition without ground stress, and β is the experimental coefficient. Thus, reducing the surrounding stress on the coal seam is considered a reliable way to enhance the coal seam permeability.
The permeability of the coal seam presents a difference in the vertical layer orientation and the parallel layer orientation as follows:
{ k v = k v 0 e β v σ k p = k p 0 e β p σ
where k v and k p are the permeability parallel and vertical to the coal bedding, k v 0 and k p 0 are the permeability under the ideal condition without ground stress, β v and β p are the experimental coefficients obtained by mechanical experiments. The coal seam permeability of Equation (5) transforms into:
k = k v · k p
The coal seam permeability, when combining Equations (6) and (7), is expressed as follows:
k = k v 0 e β v σ · k p 0 e β p σ
We conducted the permeability experiment of the specimen made by the target coal seam in the laboratory (Figure 2) to investigate the permeability in the vertical and parallel directions to the coal layer orientation. We obtained the permeability calculation equation suitable for the target coal seam as follows:
{ k v = 0.9435 e 0.118 σ k p = 3.4208 e 0.162 σ k = 0.9435 e 0.118 σ · 3.4208 e 0.162 σ

2.3. Model Description

FLAC 3D is a widely used commercial software in rock mechanics research because of its acceptable accuracy and recognition results [27,28,29,30]. In this paper, we build a numerical model of the overlying rock mass to investigate the stress variation. The model geometry is 300 m × 300 m × 143 m (Figure 3) with a total of 53,800 computational units, containing 21 coal-rock seams with 15 top layers, 5 bottom layers, and one coal layer. The mechanical parameters of these coal-rock masses are detailed in Table 1. The upper boundary is free, and other boundaries are roll supports. During the simulation, only the influence of the weight of rocks on stress, deformation, and permeability is investigated. We start full-face excavation from 80 m on the left side at an excavation velocity of 20 m and stop excavation at 80 m on the right side. We monitor the maximum unbalanced force to check whether the model reaches equilibrium.

3. Results

3.1. Stress Variation of Coal-Rock Mass during the Mining Process

Figure 4 presents the temporal and spatial variations of the vertical and horizontal stress on the coal-rock mass with the advanced distances of the working face (Da). As seen in Figure 4a and Figure 5a, the vertical and horizontal stress above and below the goaf decreases as the working face advances to 20 m (Da = 20 m), resulting in a pressure-relief area around the mined area. The pressure-relief area enlarges gradually as the working face advances, during which the vertical and horizontal stress further decreases (Figure 4b–d and Figure 5b–d). When the working face advances to 80 m, the relief area with the same vertical stress increases (Figure 4e,f), whereas that of the same horizontal stress only extends along the horizontal direction with the advanced working face but not in the vertical direction (Figure 5e,f). This indicates that the stress arch above the working face first expands in the vertical and horizontal directions, then only enlarges in the horizontal direction with the unchanged arch height.

3.2. Permeability Variation of Coal-Rock Mass during the Mining Process

We investigated the permeability variation of the coal-rock mass during the mining process in Figure 6. The permeability enhancement appears above the goaf and varies with the pressure-relief area induced by the advanced working face. Similar to the stress variation, the permeability enhancement is limited to a small area above the excavated coal-rock mass with a maximum permeability of 140 mD. In contrast, the permeability of other areas remains unchanged as the working face is advanced to 20 m (Figure 6a). It enlarges along the vertical and horizontal directions with the extending working face (Figure 6b–d), gradually covering the area above the goaf when the working face advances from 20 m to 100 m (Figure 6e). We noted that the length of the permeability enhancement area still increases along the horizontal direction, while the height of the area remains unchanged with an unobvious variation when the working face advances from 100 m to 140 m (Figure 6f). The differential expansion in direction is consistent with the pressure-relief area, which verifies the reliability of the stimulated pressure-relief zone. It means that the height variation in the pressure-relief area remains unchanged as the advancement of the working face exceeds 100 m, and the gas extraction through the borehole located in the pressure-relief area becomes stable. Thus, some deviation in the gas extraction and the favorable extraction area may appear if the on-site inspection boreholes are drilled before the working face advances to 100 m.
The permeability of the oil and gas reservoir is divided into five different grades, namely, ultra-low (<10 mD), low (10–100 mD), medium (100–500 mD), high (500–2000 mD), and ultra-high permeability (>2000 mD) in China. Higher permeability of the coal-rock mass leads to better gas extraction performance. Thus, we zone the overlying rock mass based on its permeability for placing the on-site borehole in the high and ultra-high permeability to bring acceptable gas extraction efficiency. Figure 6 presents the variation of the permeability zone during the working face advancement from 20 m to 140 m. The initial permeability of the area above the goaf is ultra-low, with a permeability of less than 10 mD, which is not conducive to gas extraction. It increases with the advancement of the working face, presenting obvious zoning characteristics by different permeability. A low-permeability area appears above the goaf when the working face advances to 20 m (Figure 6a). It gradually transforms into a medium-permeability area, and another low-permeability area exists above it with the advanced working face increasing to 40 m (Figure 6b). Then, these areas convert to the high-permeability area and medium-permeability area with the enhanced permeability of rock mass, respectively, when the working face advances to 60 m and 80 m (Figure 6c,d). Further advancement of the working face leads to additional increase in the rock permeability. The permeability of the adjacent area above the goaf exceeds 2000 mD, becoming the ultra-high permeability area as the working face advances to 100 m, which is favorable for gas extraction (Figure 6e,f). Meanwhile, the rock mass above the goaf forms three areas in the vertical direction, namely, the medium, high, and ultra-high permeability regions (Figure 6e). The height of these regions becomes unchanged, while the length increases as the working face advances to 140 m (Figure 6f), which verifies the results of Ren et al. [31] indicating that the horizontal permeability is more sensitive to stress variation than the vertical one.
In summary, the stress of the overlying rock mass varies as the working face advances, resulting in the variation of permeability and its zonation in the vertical direction. This zoning range evolves with the advancement of the working face, which tends to be unchanged after the advancement of 100 m, followed by a stable gas extraction performance and an optimal extracted gas amount. It benefits the on-site drilling arrangement and extraction effect inspection.

4. Field Application

4.1. Overview of Application Coal Mine

The application coal mine, the Tingnan coal mine, is located in the middle of the Binchang mining area of Shaanxi Province in China. Its geological reserve is 398.83 Mt with an approved production capacity of 3 Mt/a. The gas content in the Tingnan coal mine is 6.77~6.84 m3/t, and the recoverable gas amount is 1415.09 Mm3, which is abundant for gas extraction and utilization.

4.2. Determination of Drilling Parameters

We drilled four groups of test boreholes in the grouting roadway of the 204 working face with different inclination angles from 15° to 28° (Figure 7 and Figure 8). Thus, the borehole ends were in the different permeability layers with varying vertical distances from the coal seam roof to the borehole ends (Dv). There are six boreholes in every group of gas extraction boreholes with a diameter of 153 mm and a drilling spacing of 1.50 m. The deviation angles of each drill hole are 90°, 94°, 98°, 105°, 112°, and 119°, respectively. Each borehole is sealed by the polyurethane sealing method with a 6 m sealed length. Table 2 details the drilling parameters of the test boreholes.

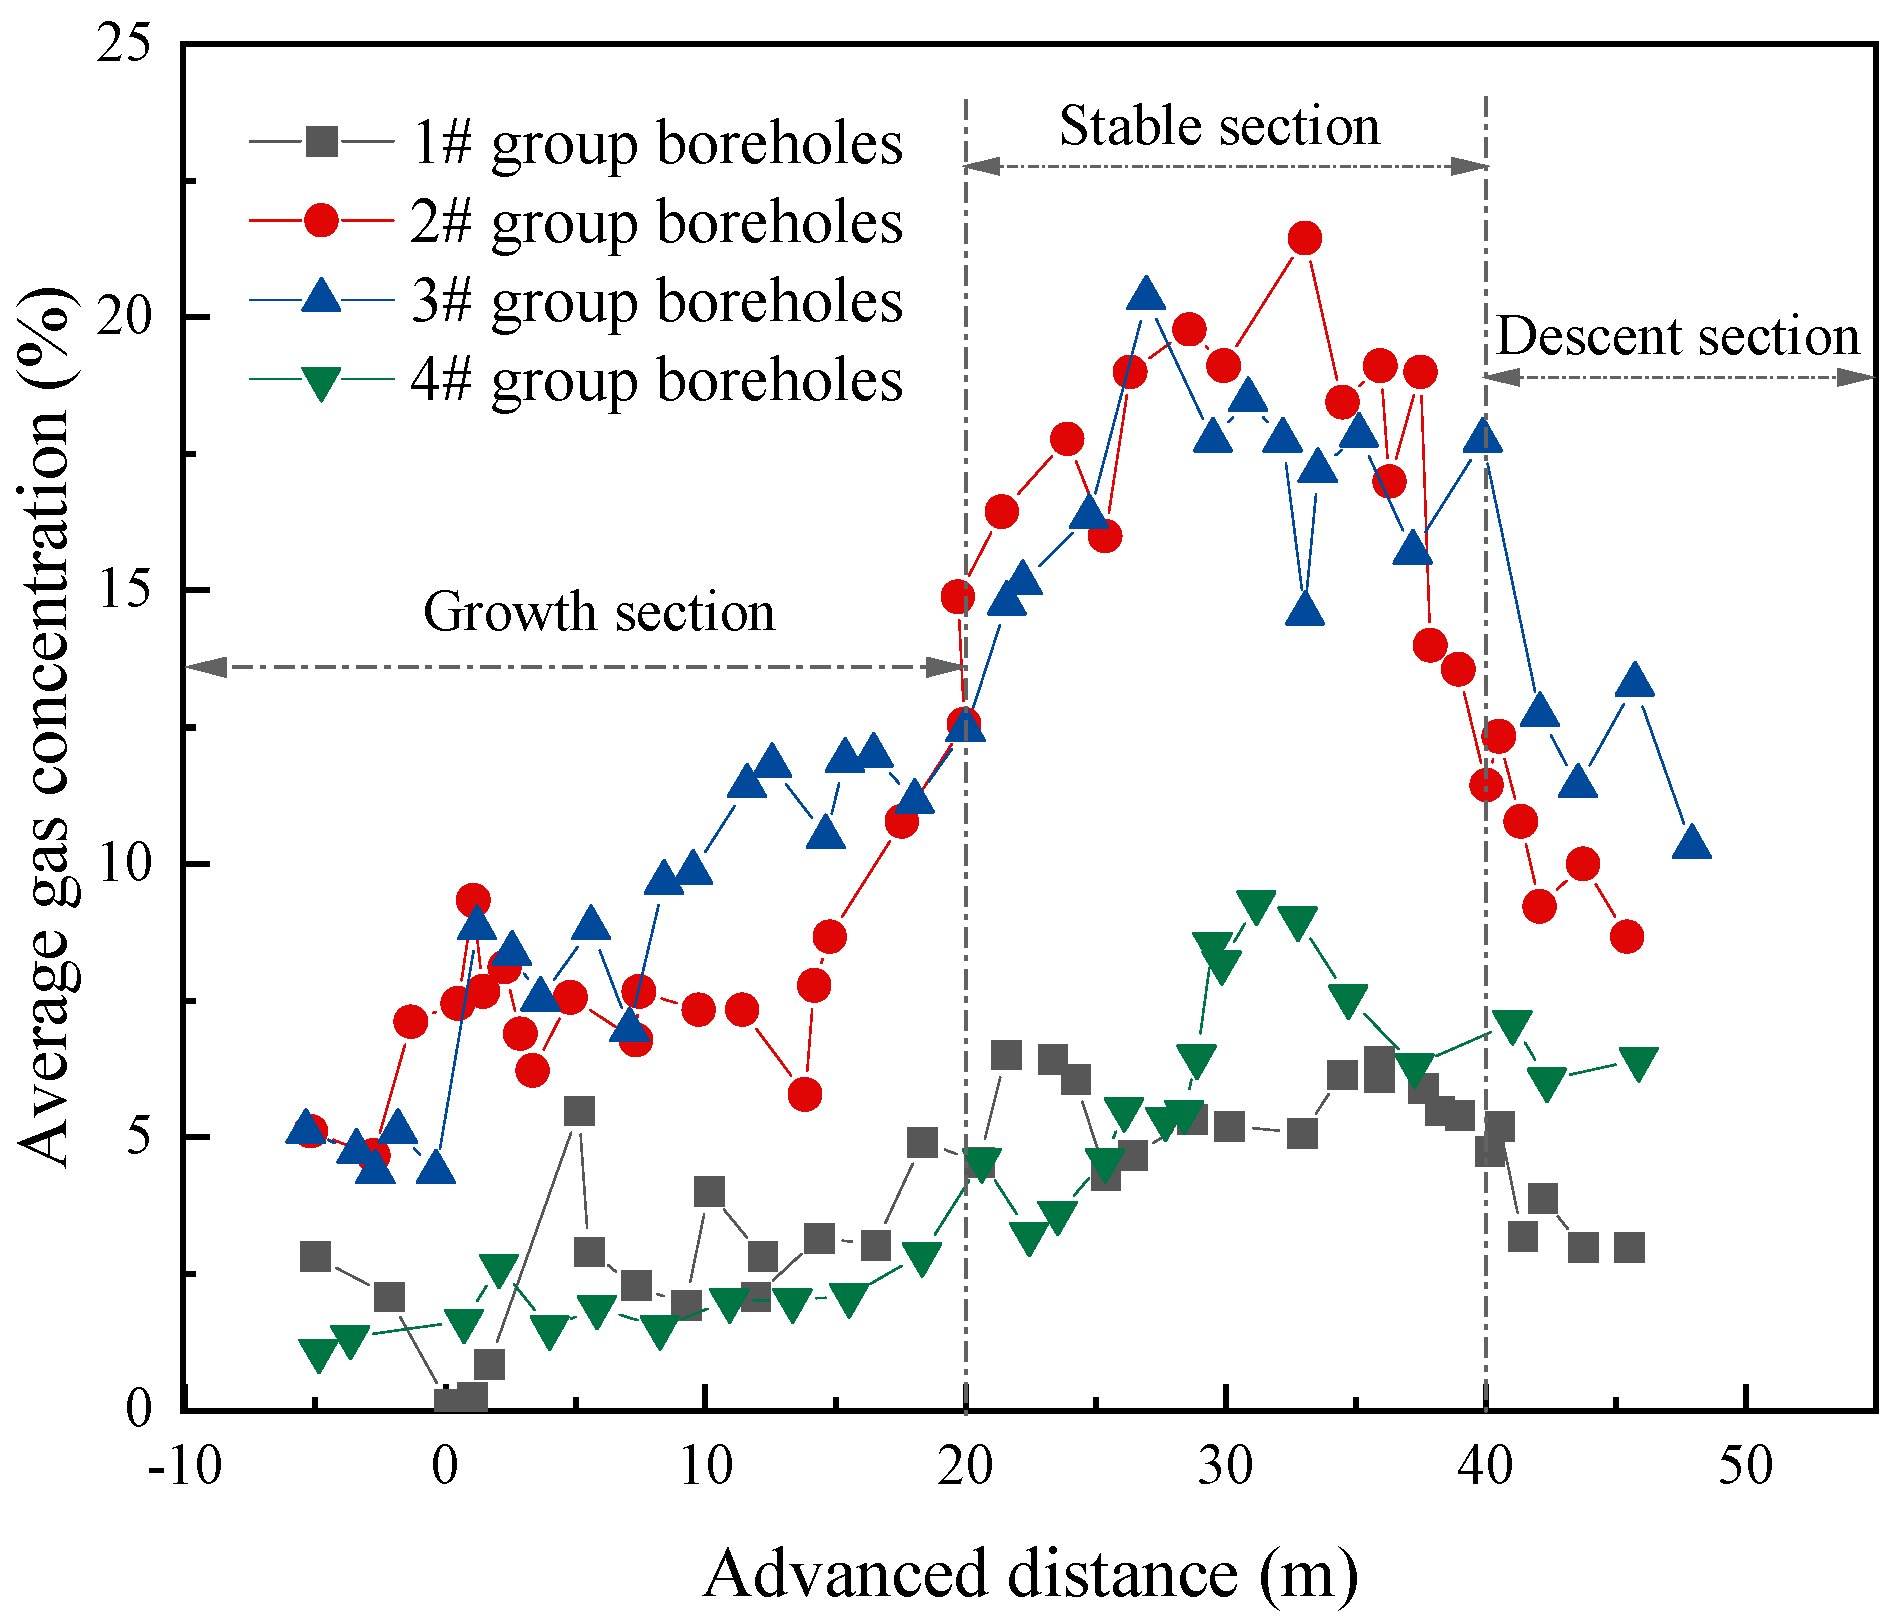
4.3. Investigation of the Favorable Gas Concentration

We investigated the gas concentration variation in each group of boreholes along the horizontal distance between the borehole end and the advanced working face (Dh) as it increased from −5 m to 45 m (Figure 9). The average gas concentration of each group of boreholes is minimum when Dh is −5 m, ranging from 1% to 5%. It gradually grows as Dh increases, separately reaching the peak at different Dh, then rapidly declining until the borehole collapses.
Gas concentration in the 1# group of boreholes with a maximum vertical distance of 8.5 m is the lowest, presenting an average gas concentration of 4.01% during mining. Although the borehole end is located in the ultra-high permeability area, a large quantity of air is extracted into the borehole under negative pressure due to its connection with the goaf. Meanwhile, the borehole in the caved zone collapses with the advancement of the working face, substantially weakening its gas extraction performance. Gas concentration in the caved zone decreases to an unacceptable level.
Average gas concentration gradually grows to 11.61% as Dv rises to 13 m, presenting pronounced zoning with the Dv variation, namely, the growth, stable, and descent sections. Gas concentration increases from 4.67% to 12.56% in the growth section, with Dv ranging from −5 m to 25 m. It stabilizes at an acceptable concentration, fluctuating between 13.55% and 21.44% in the stable section, and decreases to 8.6% in the descent section. The 2# group of boreholes is located in the high-permeability area of the fractured zone, connected with the caved zone by numerous vertical fractures. These fractures offer channels for gas migration for an acceptable gas concentration.
A further increase in Dv leads to a higher gas concentration; however, the growth rate decreases significantly, showing that gas concentration rises from 11.61% to 15.80% as Dv increases from 13 m to 19 m. The 3# group of boreholes are located in the separate area of the fractured zone, where the bedding tension fractures induced by separated layers provide numerous gas flow channels. Free gas constantly migrates to the separate area through these fractures and accumulates at the boundary between the upper fractured zone and the continuous zone. Thus, gas concentration in the 3# group of boreholes is more significant than that of the 2# group of boreholes, although they are all in the high-permeability zone. Meanwhile, the gas concentration distribution in this group of boreholes also shows similar zoning characteristics to those of the 2# group. With the advancement of the working face, the three zones of the overlying rock mass gradually evolve, followed by an increased rock permeability. It enhances the gas migration to this area, increasing gas concentration in the boreholes as the working face advances from −5 m to 40 m. Due to continuous supply, high gas concentrations last for the advanced distance from 20 m to 40 m. Then, the gas supply weakens as the working face advances over 40 m, and the gas concentration declines gradually.
Gas concentration in the 4# group of boreholes sharply decreases to 4.57% when Dv grows to 21.5 m, consistent with that of the 1# group of boreholes. These boreholes are set in the continuous zone with the medium permeability, where it is difficult for gas to migrate due to few fractures.
To sum up, gas concentration in the 2# and 3# groups of boreholes is more significant than that in the 1# and 4# groups of boreholes. Thus, the favorable gas extraction zone ranges from 13 m to 19 m of Dv, where an acceptable extraction efficiency may be achieved. Moreover, gas concentration in every group of boreholes indicates pronounced zoning with the advancement of the working face. It rises to its peak when Dv exceeds 20 m, equal to the distance of the periodic roof pressure. This verifies that the permeability change lags behind the coal and rock mass failure.
Notably, the favorable gas extraction zone identified through the on-site experiments is considerably smaller than that determined through the numerical simulation. This indicates that when guided by numerical simulation results, on-site experiments can provide a more precise determination of the favorable gas extraction zone with minimal engineering. Therefore, combining numerical simulation with on-site experiments can achieve the most accurate favorable extraction area at the lowest cost, thereby improving engineering efficiency and economic benefits.

4.4. Application of the Favorable Gas Extraction Height

We drilled a reasonable number of extraction boreholes in the favorable zone at the 204 working face, where the gushed gas and extracted gas are investigated while advancing this working face. Figure 10 presents the gushed and extracted gas variation as the working face advances from 0 m to 600 m.
The gas quantity first grows, then tends towards stability as the working face advances, forming two different areas: the growth and stable stages.
The growth stage ranges from 0 m to 150 m of Dv, where the dominated area of the three zones gradually evolves, and the number of valid extraction boreholes constantly increases. Then, the height of the three zones remains unchanged, and the number of valid extraction boreholes no longer increases when the working face exceeds 150 m, during which the gas quantity tends to be stable with an acceptable fluctuation.
The gushed gas quantity presents an unobvious variation which increases from 5.70 m3/min to 8.50 m3/min in the growth stage and fluctuates around 9.0 m3/min in the stable stage. On the contrary, the extracted gas quantity varies more significantly, leading to a significant increase from 13.90 m3/min to 22.60 m3/min in the growth stage and a noticeable fluctuation around 23.0 m3/min in the stable stage. The extraction rate, dominated by the gushed and extracted gas quantity, varies dramatically between 68.75% and 75.44%. It meets the essential requirement of gas extraction for safe mining and provides a stable source for gas utilization.

5. Conclusions

In this paper, a numerical study of the stress variation of the rock mass and the associated permeability evolution is conducted using FLAC 3D. We drilled extraction boreholes and compared their gas extraction performance, based on which the favorable gas extraction zone was investigated. The main conclusions are drawn as follows:
(1) Gas extraction varies with the evolution of the three zones’ height and the associated permeability variation of the rock mass. The on-site boreholes for accurately investigating the favorable gas extraction height should be drilled when the height of the three zones remains unchanged.
(2) The favorable gas extraction zone in the Tingnan coal mine is determined by combining the numerical simulation with the on-site boreholes verification in the range from 13 m to 20 m of Dv.
(3) The optimized gas extraction boreholes based on the favorable gas extraction zone show improved gas extraction performance with the increase in gas extraction rate to 77.26% in the 204 working face. This approach may be suitable for other coal mines as a reasonable scheme for improving the pressure-relief gas extraction.

Author Contributions

Data curation, W.W.; investigation, H.Z.; validation, W.W.; writing—original draft, H.Z.; writing—review and editing, H.Z. All authors have read and agreed to the published version of the manuscript.

Funding

This research was funded by the Natural Science Foundation of Liaoning Province, grant number 2022-MS-463.

Conflicts of Interest

The authors declare no conflict of interest.

References

  1. Moore, T.A. Coalbed methane: A review. Int. J. Coal Geol. 2012, 101, 36–81. [Google Scholar] [CrossRef]
  2. Zhou, F.; Xia, T.; Wang, X.; Zhang, Y.; Sun, Y.; Liu, J. Recent developments in coal mine methane extraction and utilization in China: A review. J. Nat. Gas Sci. Eng. 2016, 31, 437–458. [Google Scholar] [CrossRef]
  3. Qin, L.; Wang, P.; Li, S.; Lin, H.; Wang, R.; Wang, P.; Ma, C. Gas adsorption capacity changes in coals of different ranks after liquid nitrogen freezing. Fuel 2021, 292, 120404. [Google Scholar] [CrossRef]
  4. Qian, M. On sustainable coal mining in China. J. China Coal Soc. 2010, 35, 529–534. [Google Scholar]
  5. Xue, Y.; Liu, J.; Ranjith, P.G.; Liang, X.; Wang, S. Investigation of the influence of gas fracturing on fracturing characteristics of coal mass and gas extraction efficiency based on a multi-physical field model. J. Petrol. Sci. Eng. 2021, 206, 109018. [Google Scholar] [CrossRef]
  6. Wei, G.; Kang, F.; Qin, B.; Jia, T.; Yan, J.; Feng, Z. A novel method for evaluating proneness of gas outburst based on gas-geological complexity. Nat. Hazards 2020, 104, 1841–1858. [Google Scholar] [CrossRef]
  7. Zhou, X.; Ha, Q.; Zhang, Y.; Zhu, K. Analysis of deformation localization and the complete stress-strain relation for brittle rock subjected to dynamic compressive loads. Int. J. Rock Mech. Min. 2004, 41, 311–319. [Google Scholar] [CrossRef]
  8. Fan, C.; Wen, H.; Li, S.; Bai, G.; Zhou, L. Coal Seam Gas Extraction by Integrated Drillings and Punchings from the Floor Roadway considering Hydraulic-Mechanical Coupling Effect. Geofluids 2022, 2022, 1–10. [Google Scholar] [CrossRef]
  9. Xu, J.; Qian, M.; Jin, H. Study and application of bed separation distribution and development in the process of strata movement. Chin. J. Geotech. Eng. 2004, 26, 632–636. [Google Scholar]
  10. Cheng, G.; Ma, T.; Tang, C.; Liu, H.; Wang, S. A zoning model for coal mining—Induced strata movement based on microseismic monitoring. Int. J. Rock Mech. Min. 2017, 94, 123–138. [Google Scholar] [CrossRef]
  11. Palchik, V. Influence of physical characteristics of weak rock mass on height of caved zone over abandoned subsurface coal mines. Environ. Geol. 2002, 42, 92–101. [Google Scholar] [CrossRef]
  12. Gao, Y. The ‘four zones’ model and associated inverse analysis of dynamic displacement. J. China Coal Soc. 1996, 1, 51–56. [Google Scholar]
  13. Qian, M.; Xu, J. Study and application of the o-shaped circle theory for relieved methane drainage. J. China Coal Soc. 1998, 5, 20–23. [Google Scholar]
  14. Ju, J.; Xu, J. Surface stepped subsidence related to top-coal caving longwall mining of extremely thick coal seam under shallow cover. Int. J. Rock Mech. Min. 2015, 78, 27–35. [Google Scholar] [CrossRef]
  15. Díaz Aguado, M.B.; González Nicieza, C. Control and prevention of gas outbursts in coal mines, Riosa-Olloniego coalfield, Spain. Int. J. Coal Geol. 2007, 69, 253–266. [Google Scholar] [CrossRef]
  16. Zou, Q.; Lin, B. Fluid–Solid Coupling Characteristics of Gas-Bearing Coal Subjected to Hydraulic Slotting: An Experimental Investigation. Energ. Fuel. 2018, 32, 1047–1060. [Google Scholar] [CrossRef]
  17. Gao, M.; Xie, J.; Guo, J.; Lu, Y.; He, Z.; Li, C. Fractal evolution and connectivity characteristics of mining-induced crack networks in coal masses at different depths. Geomech. Geophys. Geo-Energy Geo-Resour. 2021, 7, 9. [Google Scholar] [CrossRef]
  18. Yu, Q.; Cheng, Y.; Jiang, C.; Zhou, S. Principle and practice of co-mining of coal and pressure relief gas in high west thick coal seam. J. China Univ. Min. Technol. 2004, 2, 3–7. [Google Scholar]
  19. Xu, J.; Qian, M.; Jin, H. Study on “coal and coal-bed methane simultaneous extraction” technique on the basis of strata movement. J. China Coal Soc. 2004, 29, 129–132. [Google Scholar]
  20. Tu, M. Study on the fractured-zone height of the mining rock mass in Panxie mining area. J. China Coal Soc. 2004, 641–645. [Google Scholar]
  21. Li, H.; Ogawa, Y. Pore structure of sheared coals and related coalbed methane. Environ. Geol. 2001, 40, 1455–1461. [Google Scholar] [CrossRef]
  22. Qu, Q.; Xu, J.L.; Qian, M.G. Study on influences of keys strata movement on gas emissions of adjacent layers. Chin. J. Rock Mech. Eng. 2007, 7, 1478–1484. [Google Scholar]
  23. Yuan, L. Technique of coal mining and gas extraction without coal pillar in multi-seam with low permeability. J. Coal Sci. Eng. 2009, 15, 120–128. [Google Scholar] [CrossRef]
  24. Yuan, L. Theory of pressure-relieved gas extraction and technique system of integrated coal production and gas extraction. J. China Coal Soc. 2009, 34, 1–8. [Google Scholar]
  25. Yuan, L. Strategic thinking of simultaneous exploitation of coal and gas in deep mining. J. China Coal Soc. 2016, 41, 1–6. [Google Scholar]
  26. Cai, W.; Dou, L.; Si, G.; Cao, A.; Gong, S.; Wang, G.; Yuan, S. A new seismic-based strain energy methodology for coal burst forecasting in underground coal mines. Int. J. Rock Mech. Min. 2019, 123, 104086. [Google Scholar] [CrossRef]
  27. Zhang, Y.; Kang, Z.; Hou, C. Research on Numerical Analysis of Landslide Cataclysm Mechanism and Reinforcement Treatment Scheme in ShengLi Open-Pit Coal Mine. In Information Computing and Applications, International Conference on Information Computing and Applications, Tangshan, China, 15–18 October 2010; Zhu, R.B., Zhang, Y.C., Liu, B.X., Liu, C.F., Eds.; Association for Computing Machiner: New York, NY, USA, 2010; Volume 6377, p. 565. [Google Scholar]
  28. Wei, M.; Wang, C.; Cui, G.; Tan, Y.; Zhang, S. Influences of damage and shear dilation on permeability evolution of fractured coal. Rock Soil Mech. 2016, 37, 574–582. [Google Scholar]
  29. Zhao, Z.; Lei, Y. Mechanism Analysis of Uncovering Coal in Crosscut and Gas Outburst Based on Flac(3D). J. Coastal Res. 2020, 333–338. [Google Scholar] [CrossRef]
  30. Zhu, H.; Wang, H.; Wei, H.; Zhao, H. Study on the influence of mining conditions on the occurrence law of CO in coal seams with low metamorphic grade. Energy Source Part A 2021, 43, 2267–2280. [Google Scholar] [CrossRef]
  31. Ren, T.X.; Edwards, J.S. Goaf gas modeling techniques to maximize methane capture from surface gob wells. Mine Vent. 2002, 2, 279–286. [Google Scholar]
Figure 1. The three-zone model.
Applsci 13 05045 g001
Figure 2. The coal seam permeability test device in the laboratory: (a) is the seepage device and (b) is other accessories of the equipment.
Applsci 13 05045 g002
Figure 3. The numerical model in FLAC 3D.
Applsci 13 05045 g003
Figure 4. Vertical stress evolution as the working face advances from 20 to 140 m.
Applsci 13 05045 g004
Figure 5. Horizontal stress evolution as the working face advances from 20 m to 140 m.
Applsci 13 05045 g005
Figure 6. Permeability of the rock mass during the advancement of the working face (the permeability of the black line area is medium, that of the red line is high, and that of the deep red line is ultra-high.).
Applsci 13 05045 g006
Figure 7. The schematic map of the mine and research area (the area circled in brown lines is the test drilling area).
Applsci 13 05045 g007
Figure 8. The enlarged scope of A–A’ test drilling area in Figure 7.
Applsci 13 05045 g008
Figure 9. Gas concentration variation in boreholes with the advancement of the working face.
Applsci 13 05045 g009
Figure 10. Relationship between working face production and gas drainage.
Applsci 13 05045 g010
Table 1. The mechanic parameters of coal-rock mass.
LithologyThickness/mCohesion/MPaInternal Friction Angle/°Poisson’s RatioElastic Modulus/GPa
Mudstone 128280.248
Fine sandstone815300.2723
Sandstone712320.2518
Fine sandstone1115300.2723
Carbonaceous mudstone84.5250.266
Fine sandstone715300.2723
Sandstone712320.2518
limestone620360.2620
Fine sandstone715300.2723
Sandstone512320.2518
Mudstone 88280.248
Sandstone512320.2518
Fine sandstone815300.2723
Sandstone912320.2518
Mudstone28280.248
Coal61.9310.252.5
Mudstone78280.248
Fine sandstone215300.2723
Mudstone18280.248
Fine sandstone815300.2723
Sandstone912320.2518
Table 2. Drilling parameters of test boreholes.
Borehole GroupsDv/mDrilled Angle/°Sealed Length/m Borehole Diameter/mm
1#8.5156.0153
2#13.0206.0153
3#19.0266.0153
4#21.5286.0153
Disclaimer/Publisher’s Note: The statements, opinions and data contained in all publications are solely those of the individual author(s) and contributor(s) and not of MDPI and/or the editor(s). MDPI and/or the editor(s) disclaim responsibility for any injury to people or property resulting from any ideas, methods, instructions or products referred to in the content.

