
Hydraulic Performance of Wave-Type Flow at a Sill-Controlled Stilling Basin

Abstract
:1. Introduction
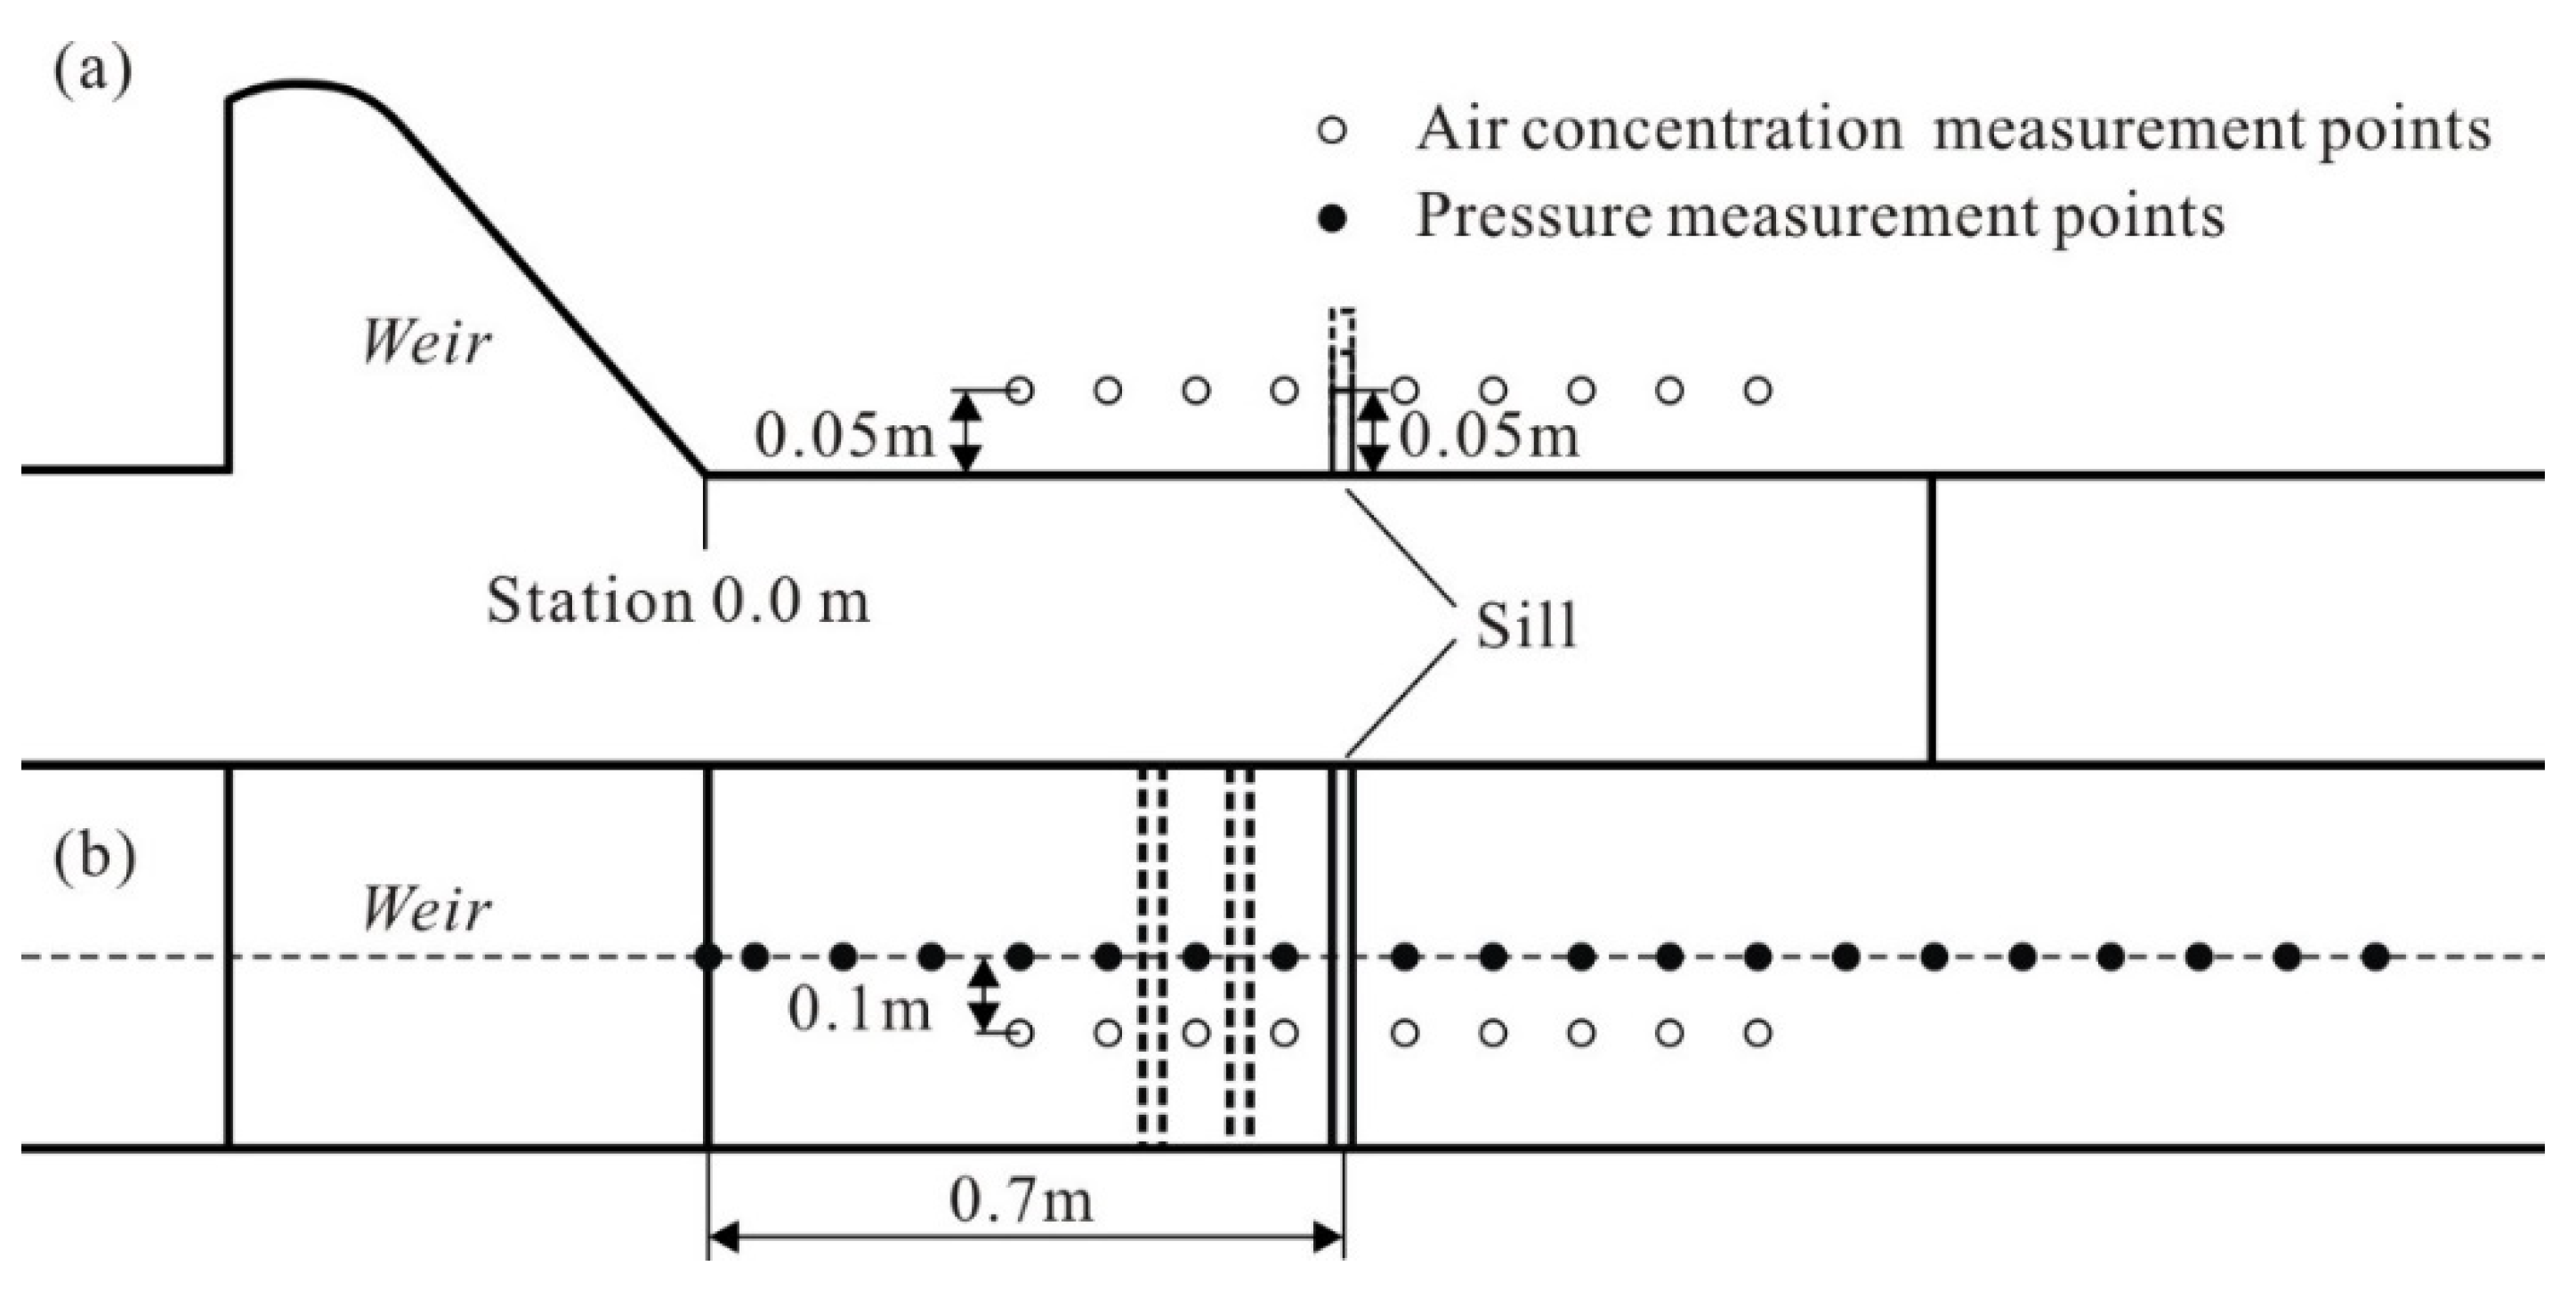
2. Experimental Setup and Methodology
3. Results and Discussion
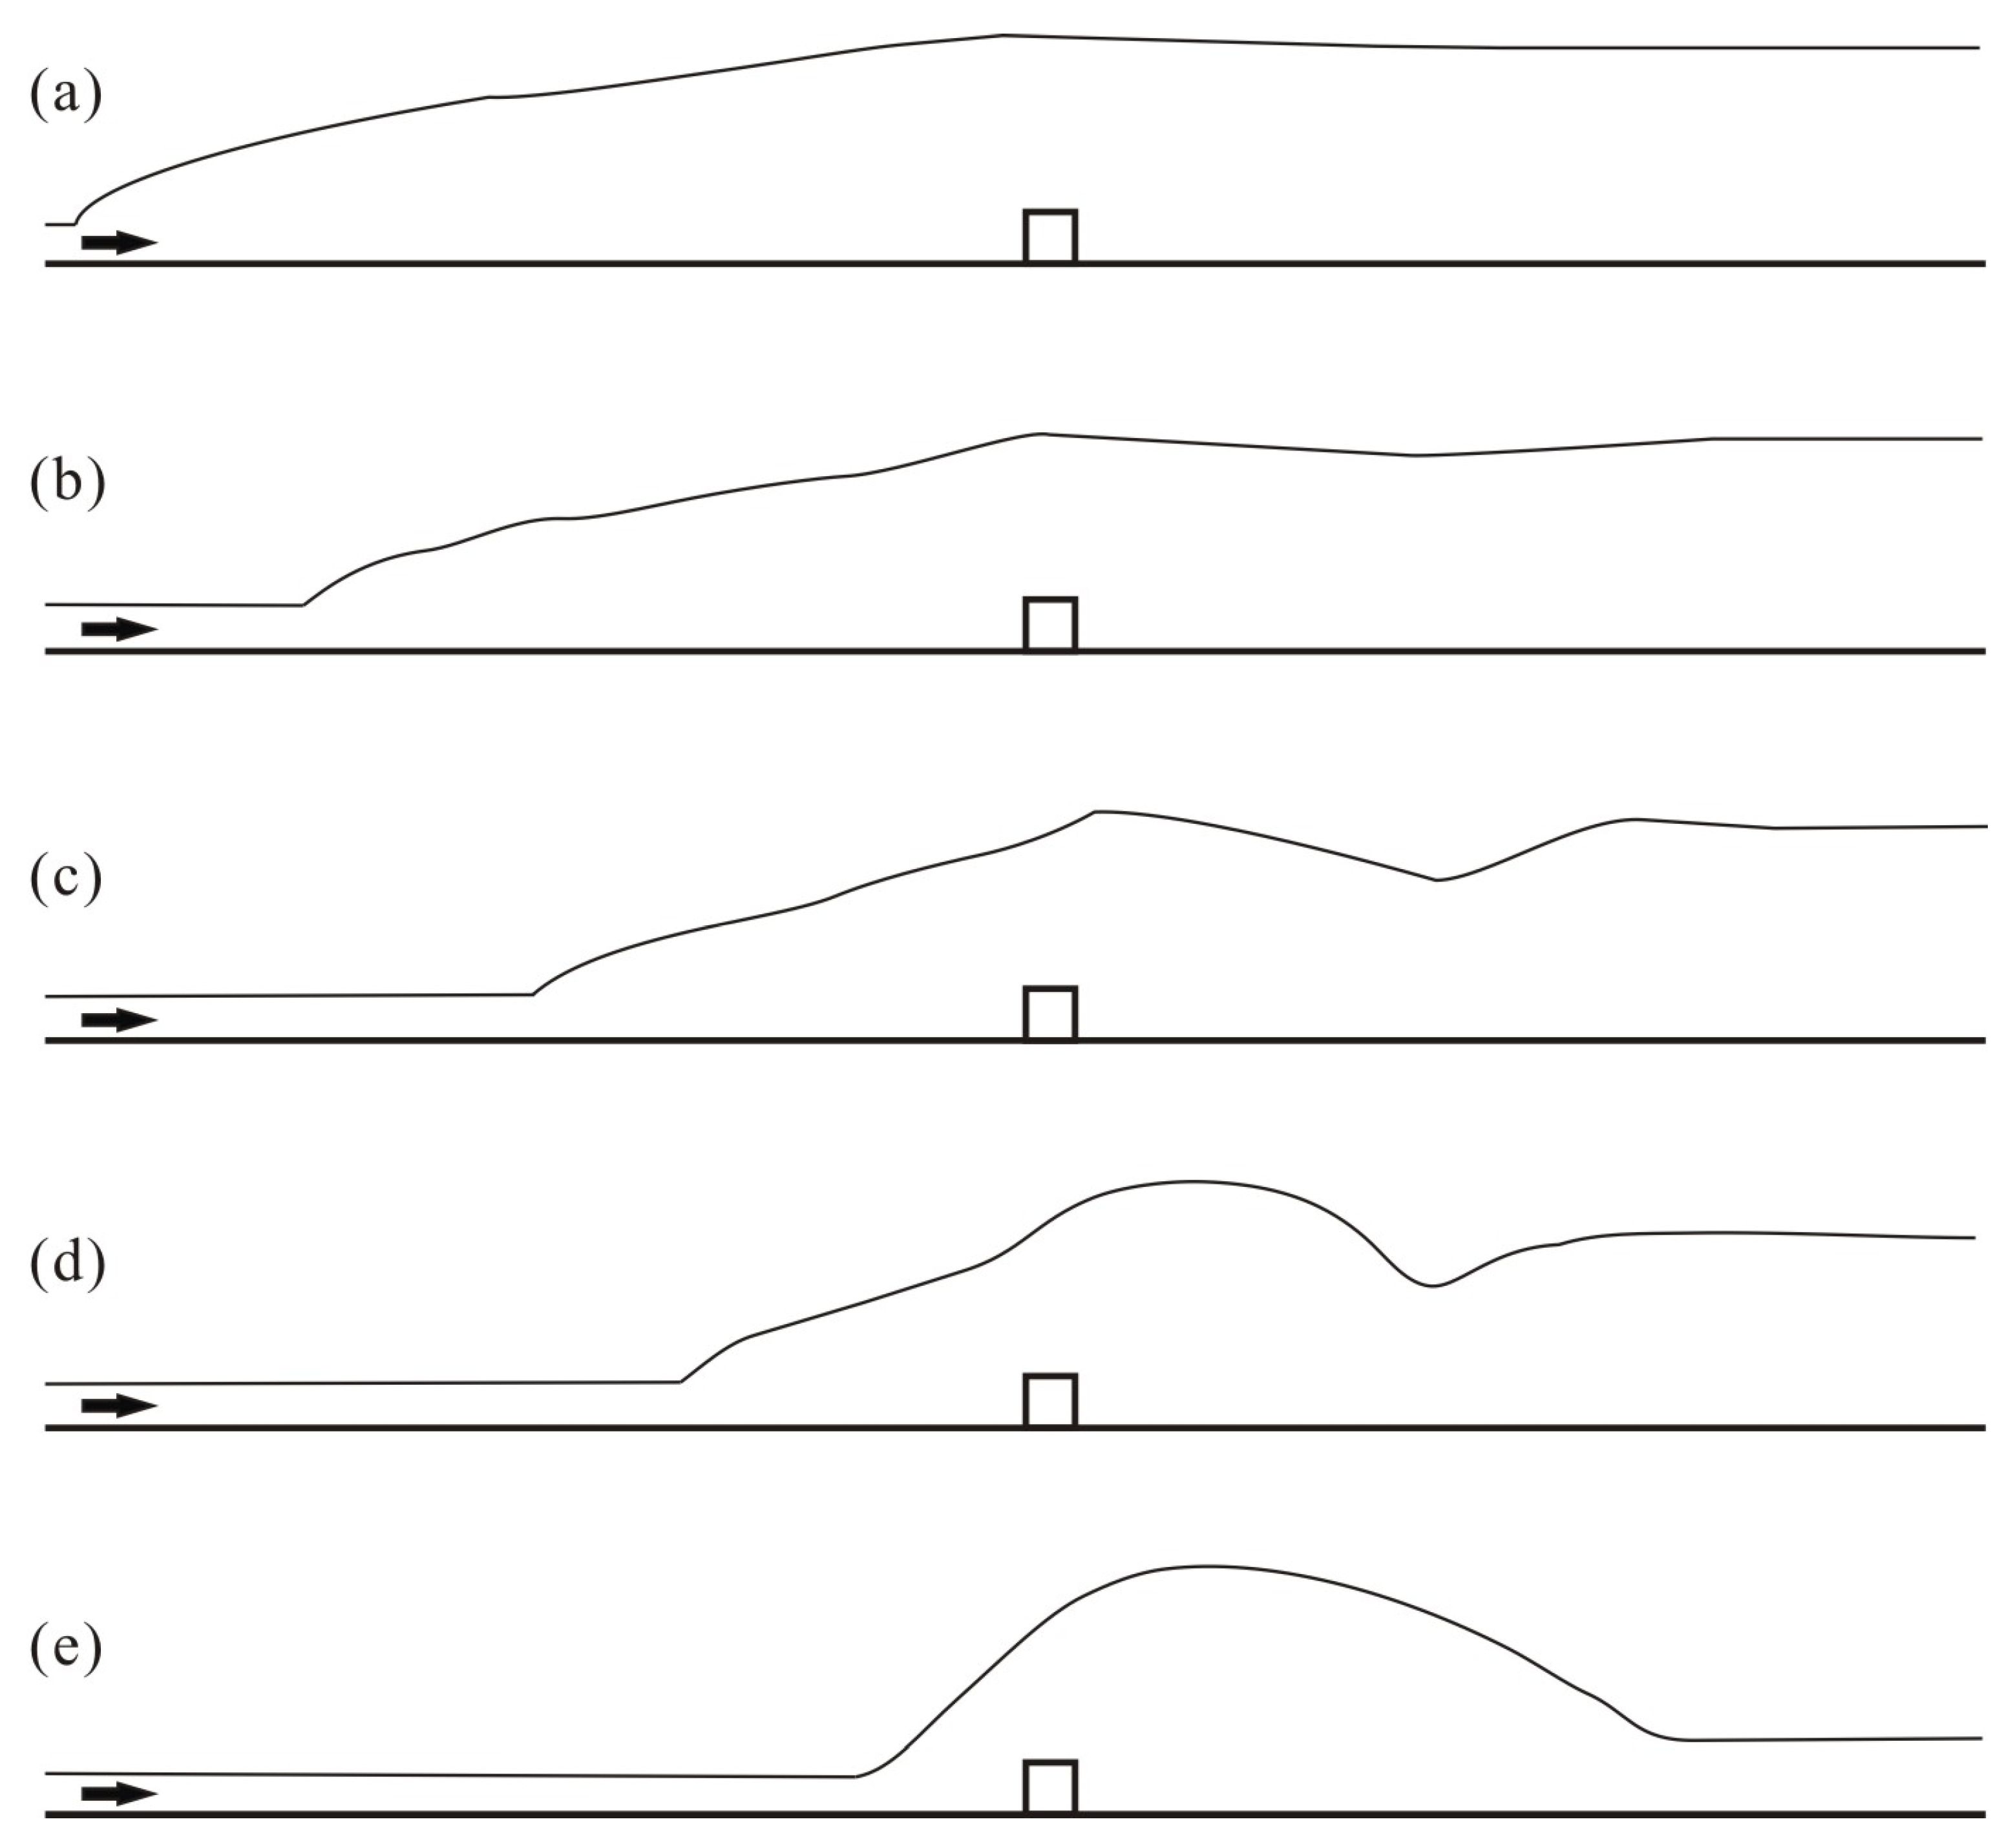
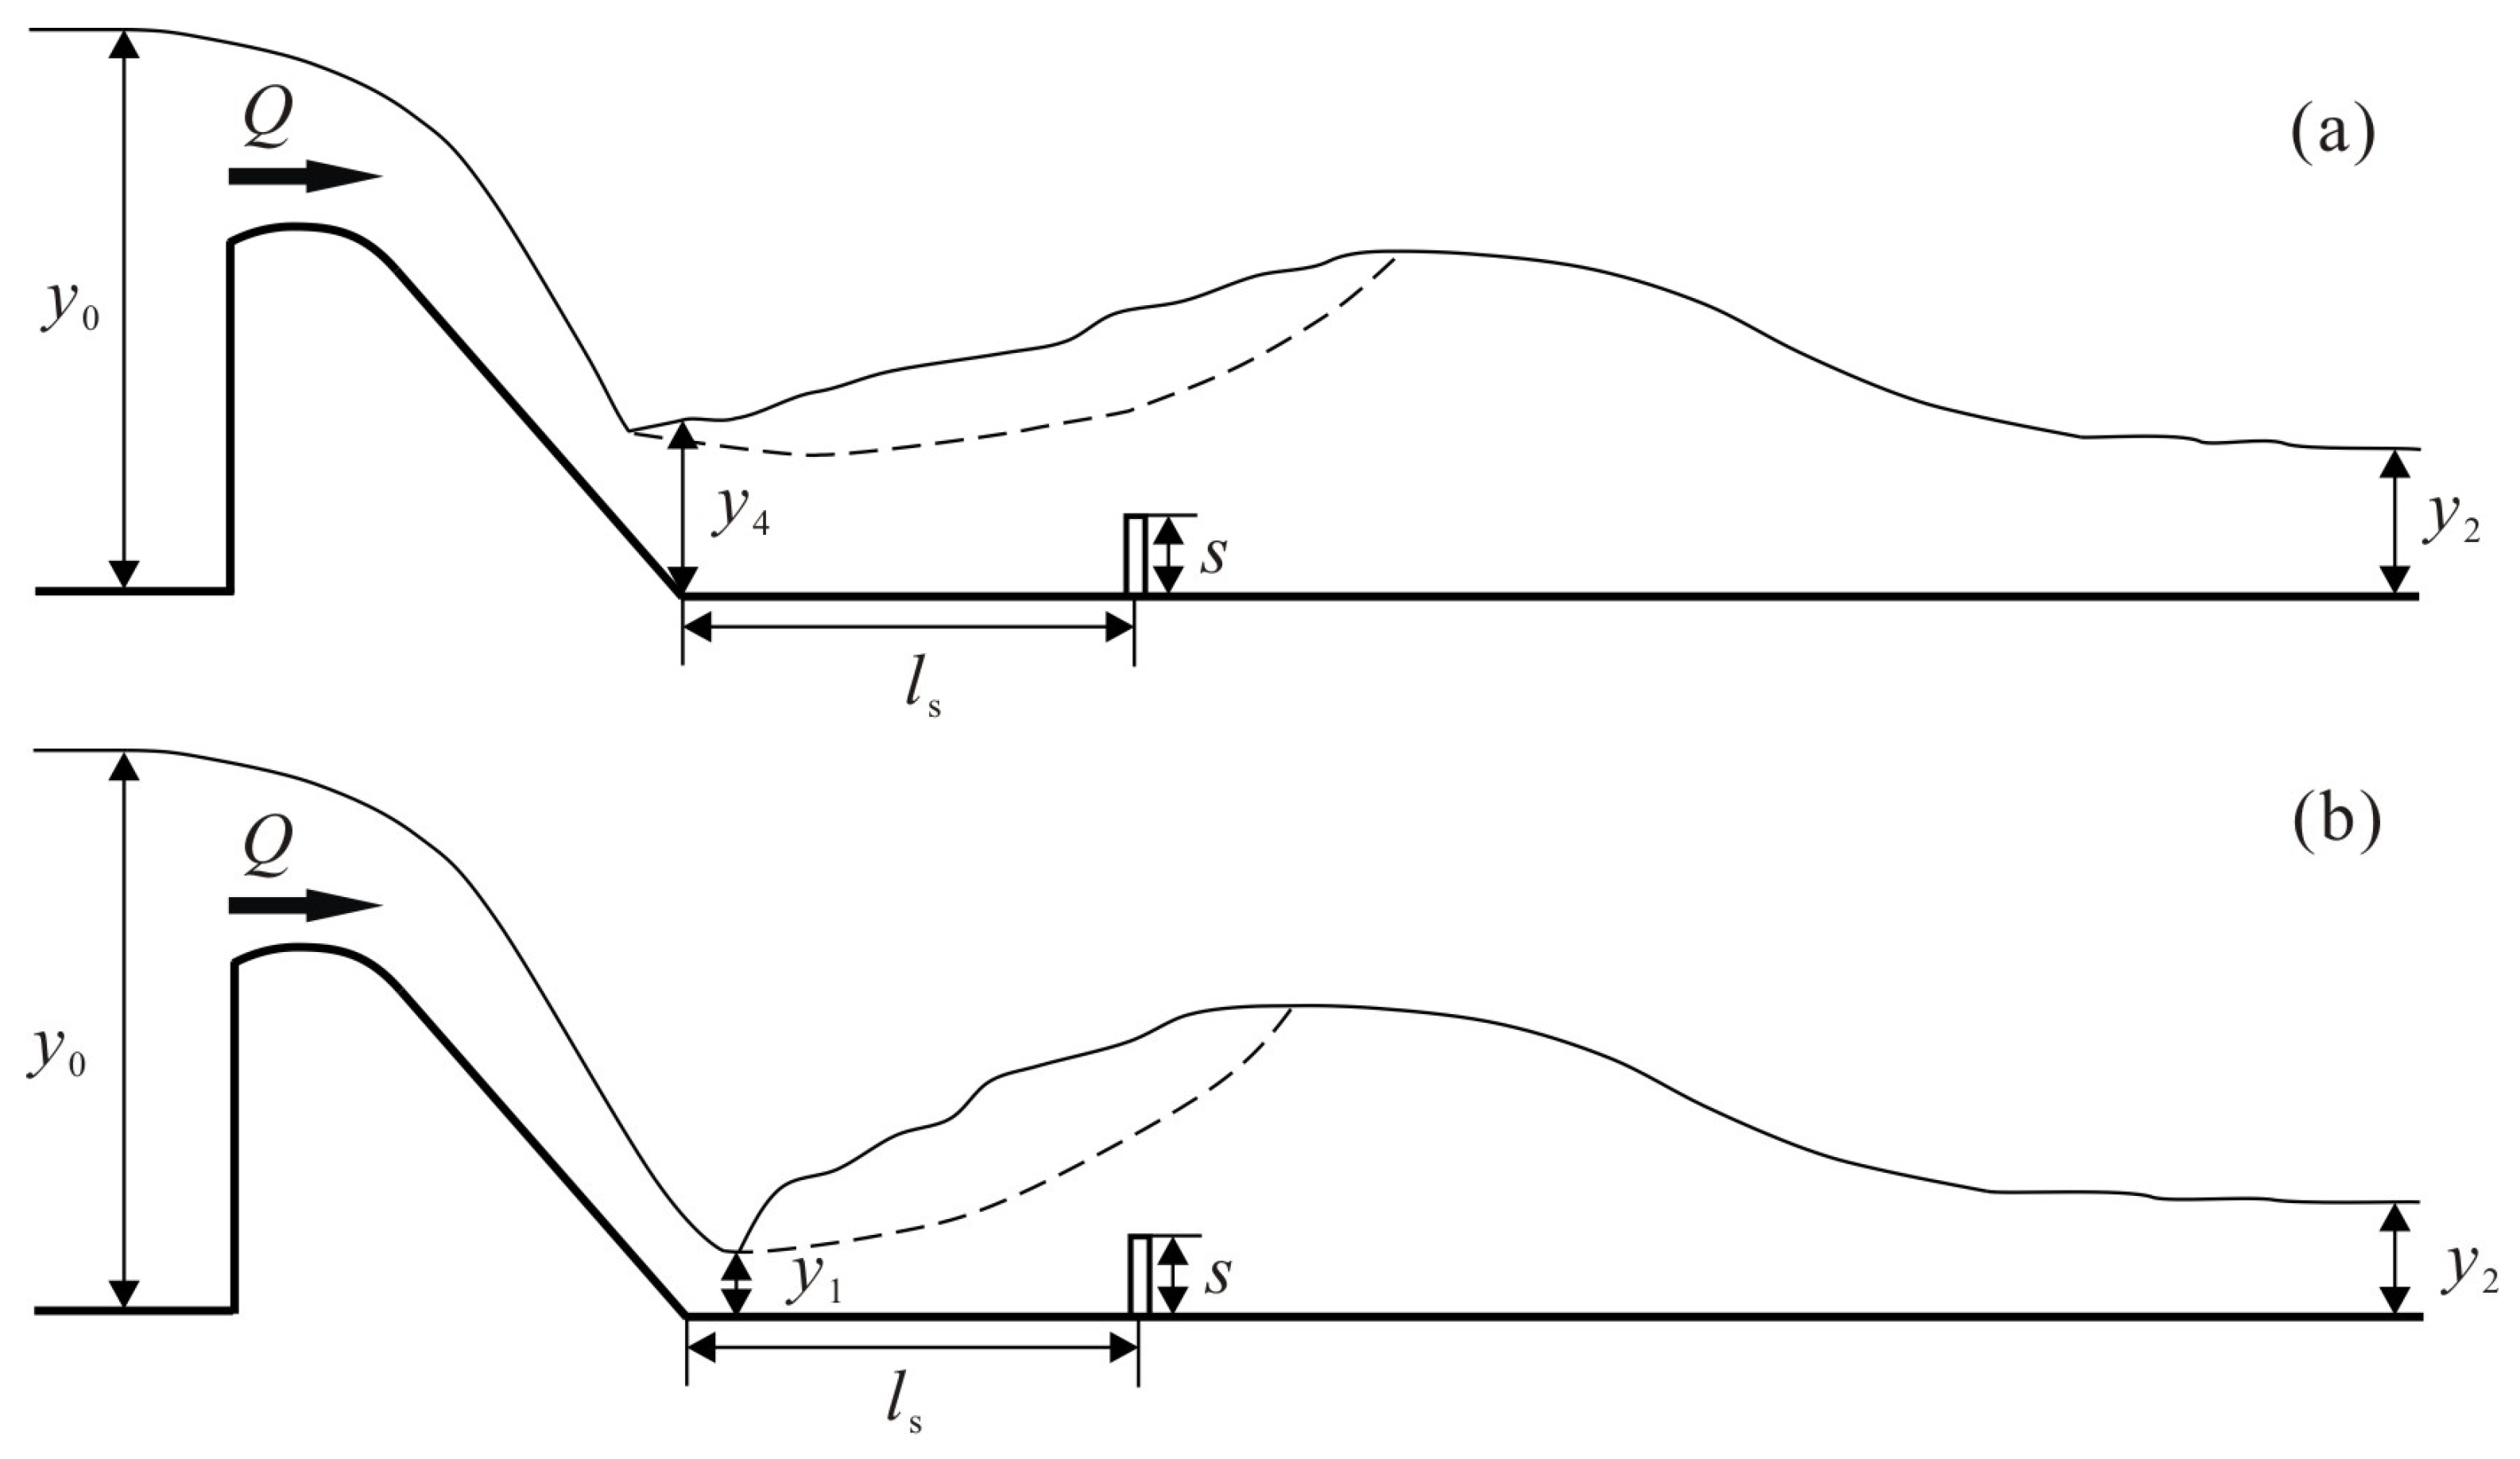
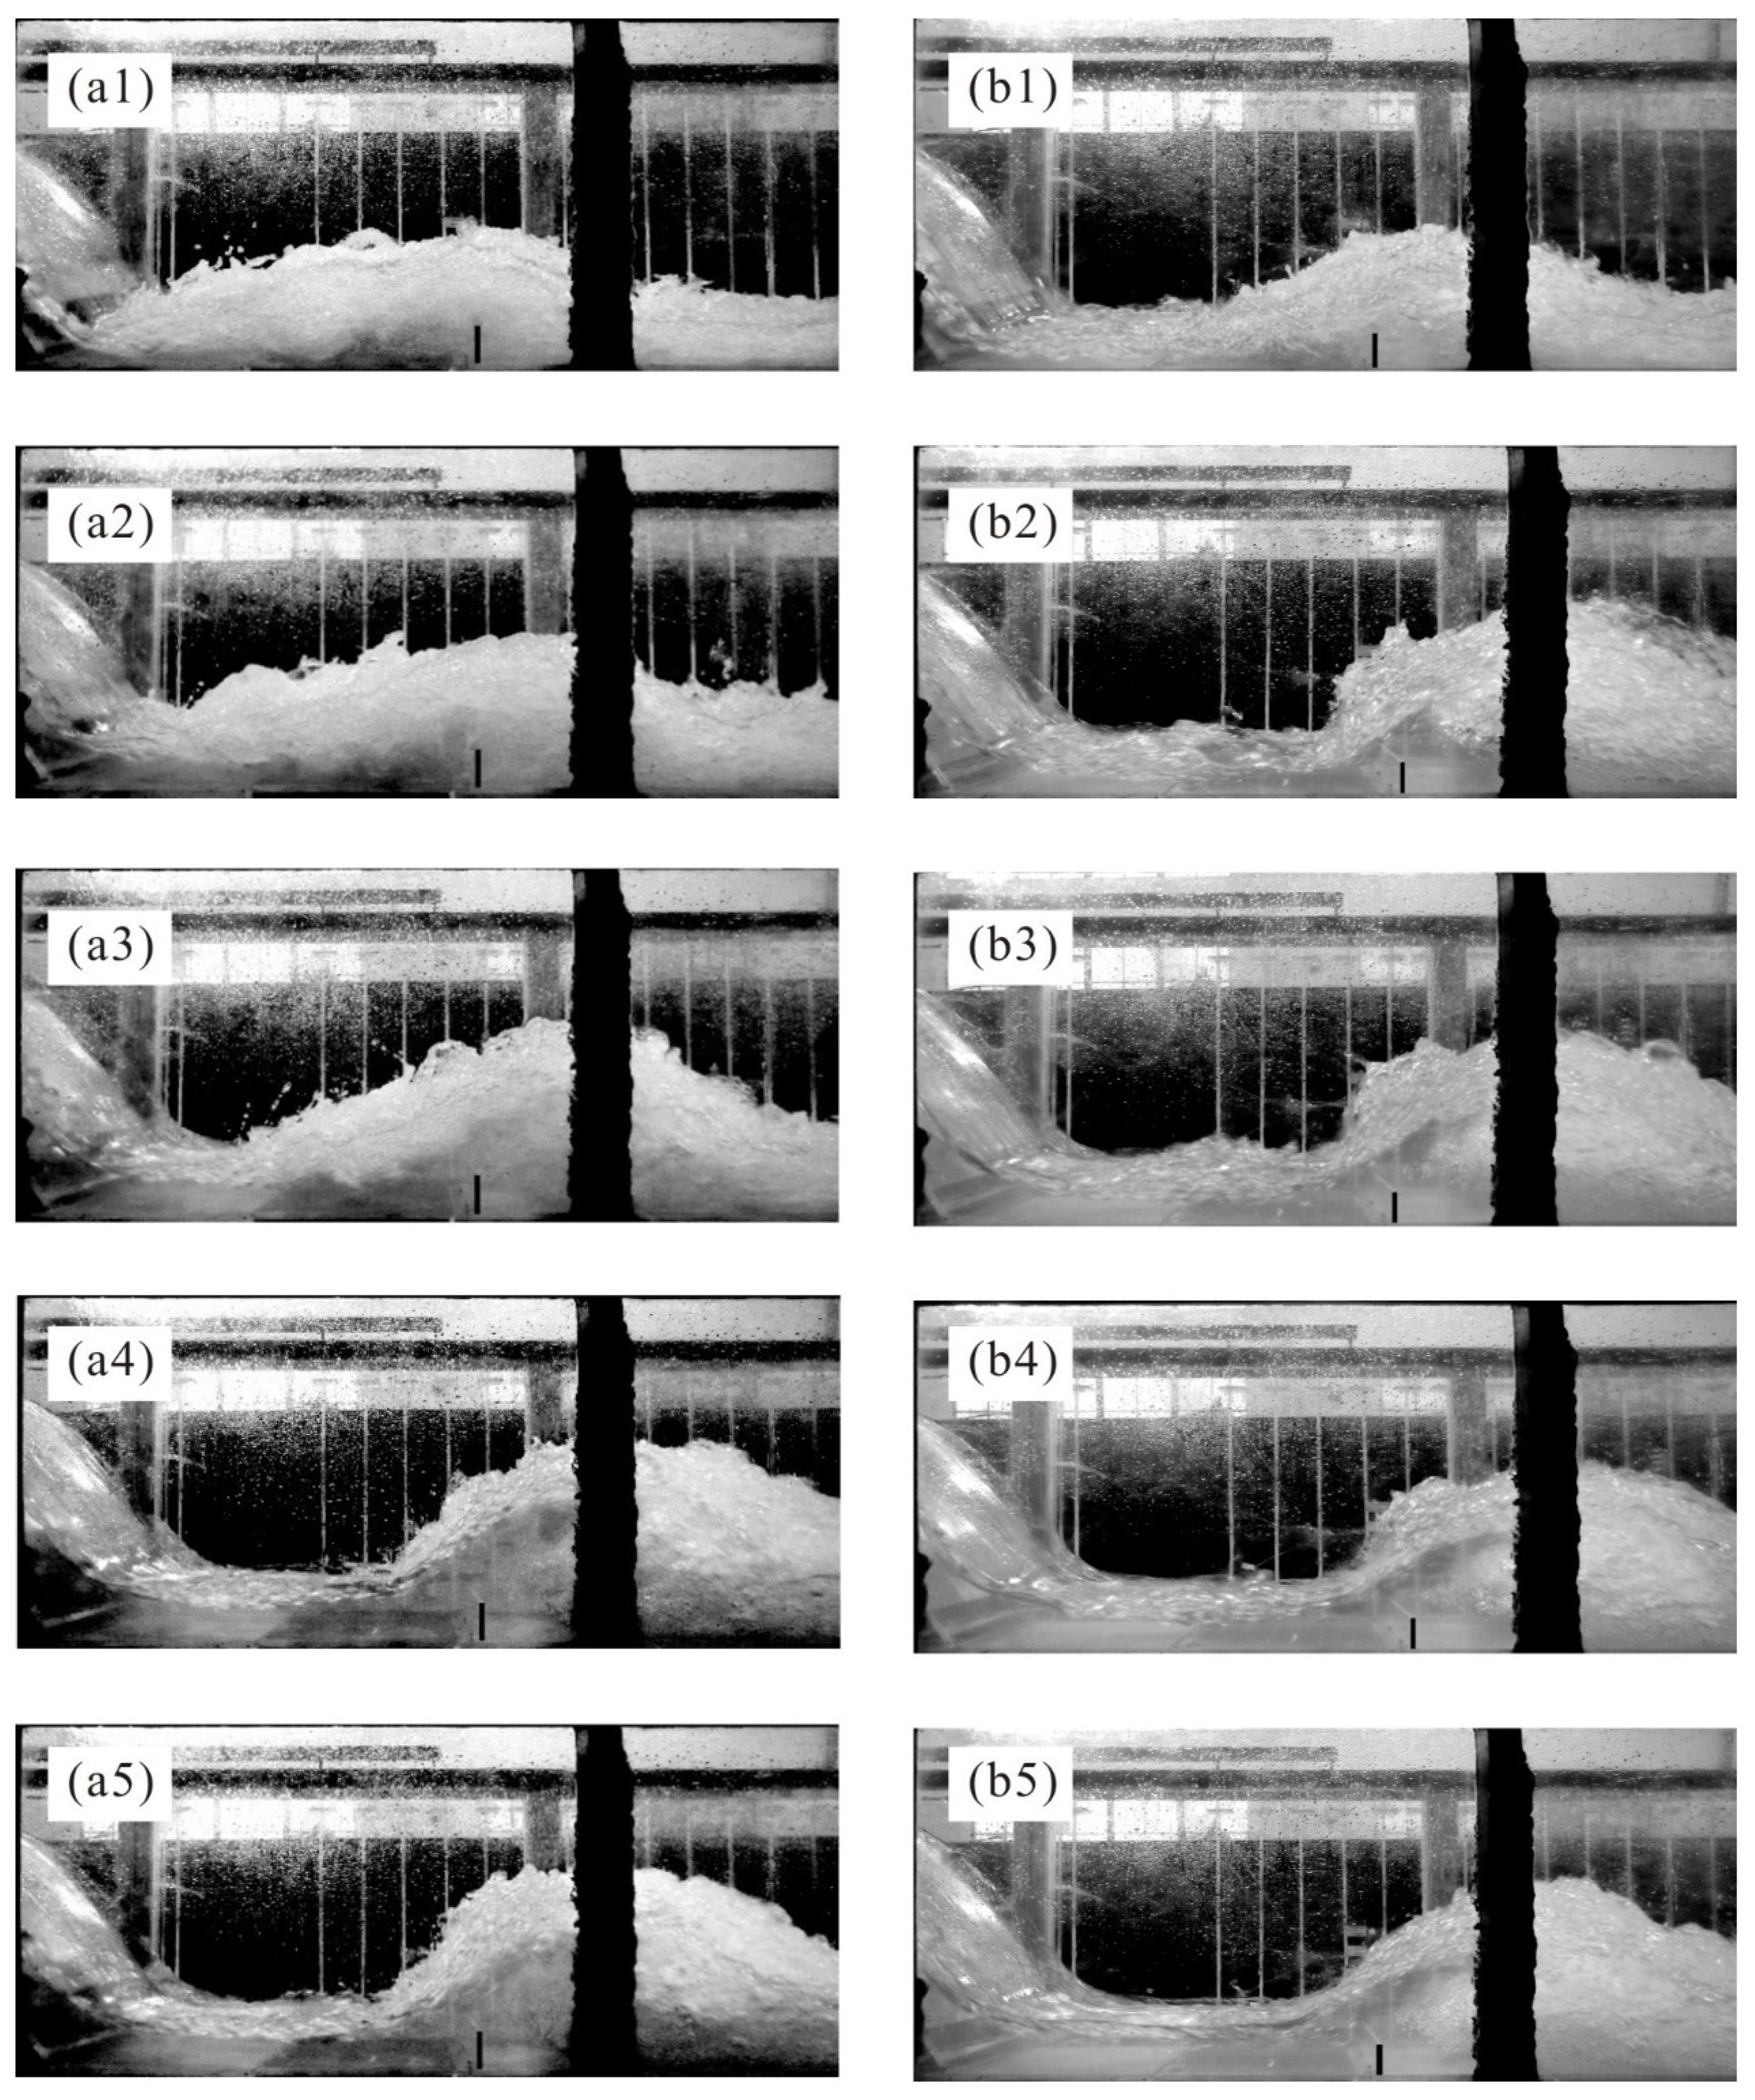
3.1. Flow Pattern
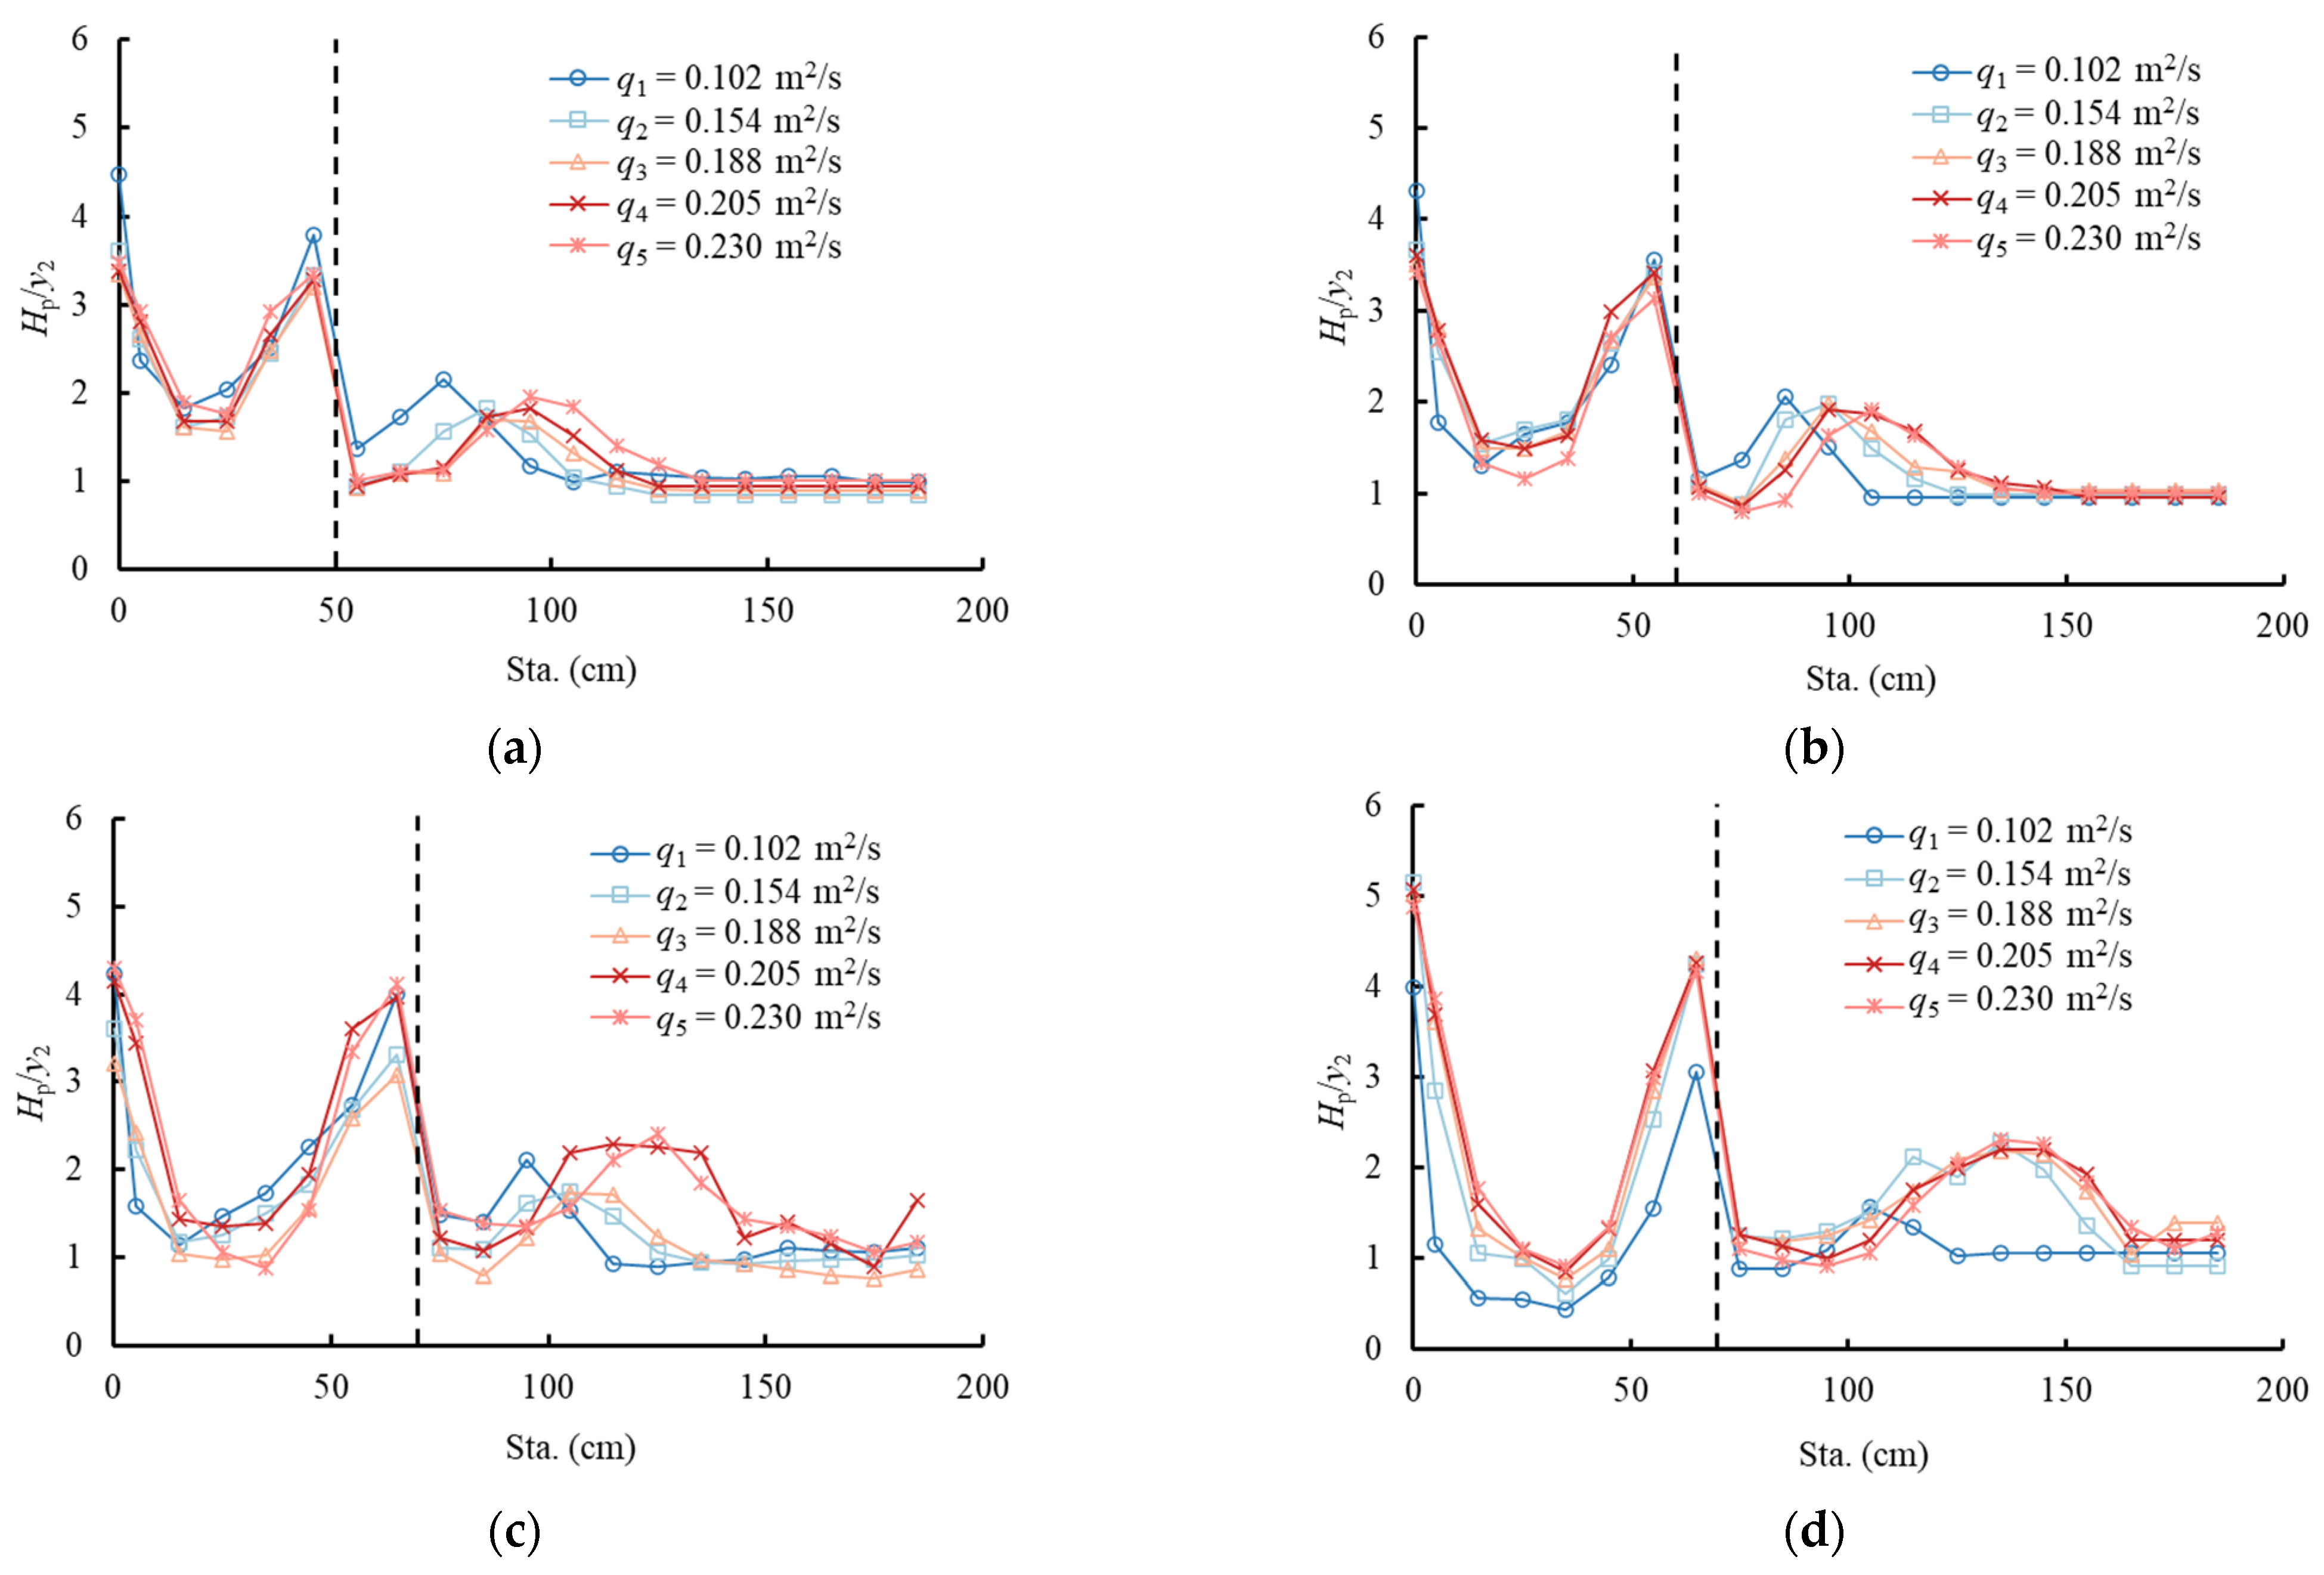
3.2. Pressure Head
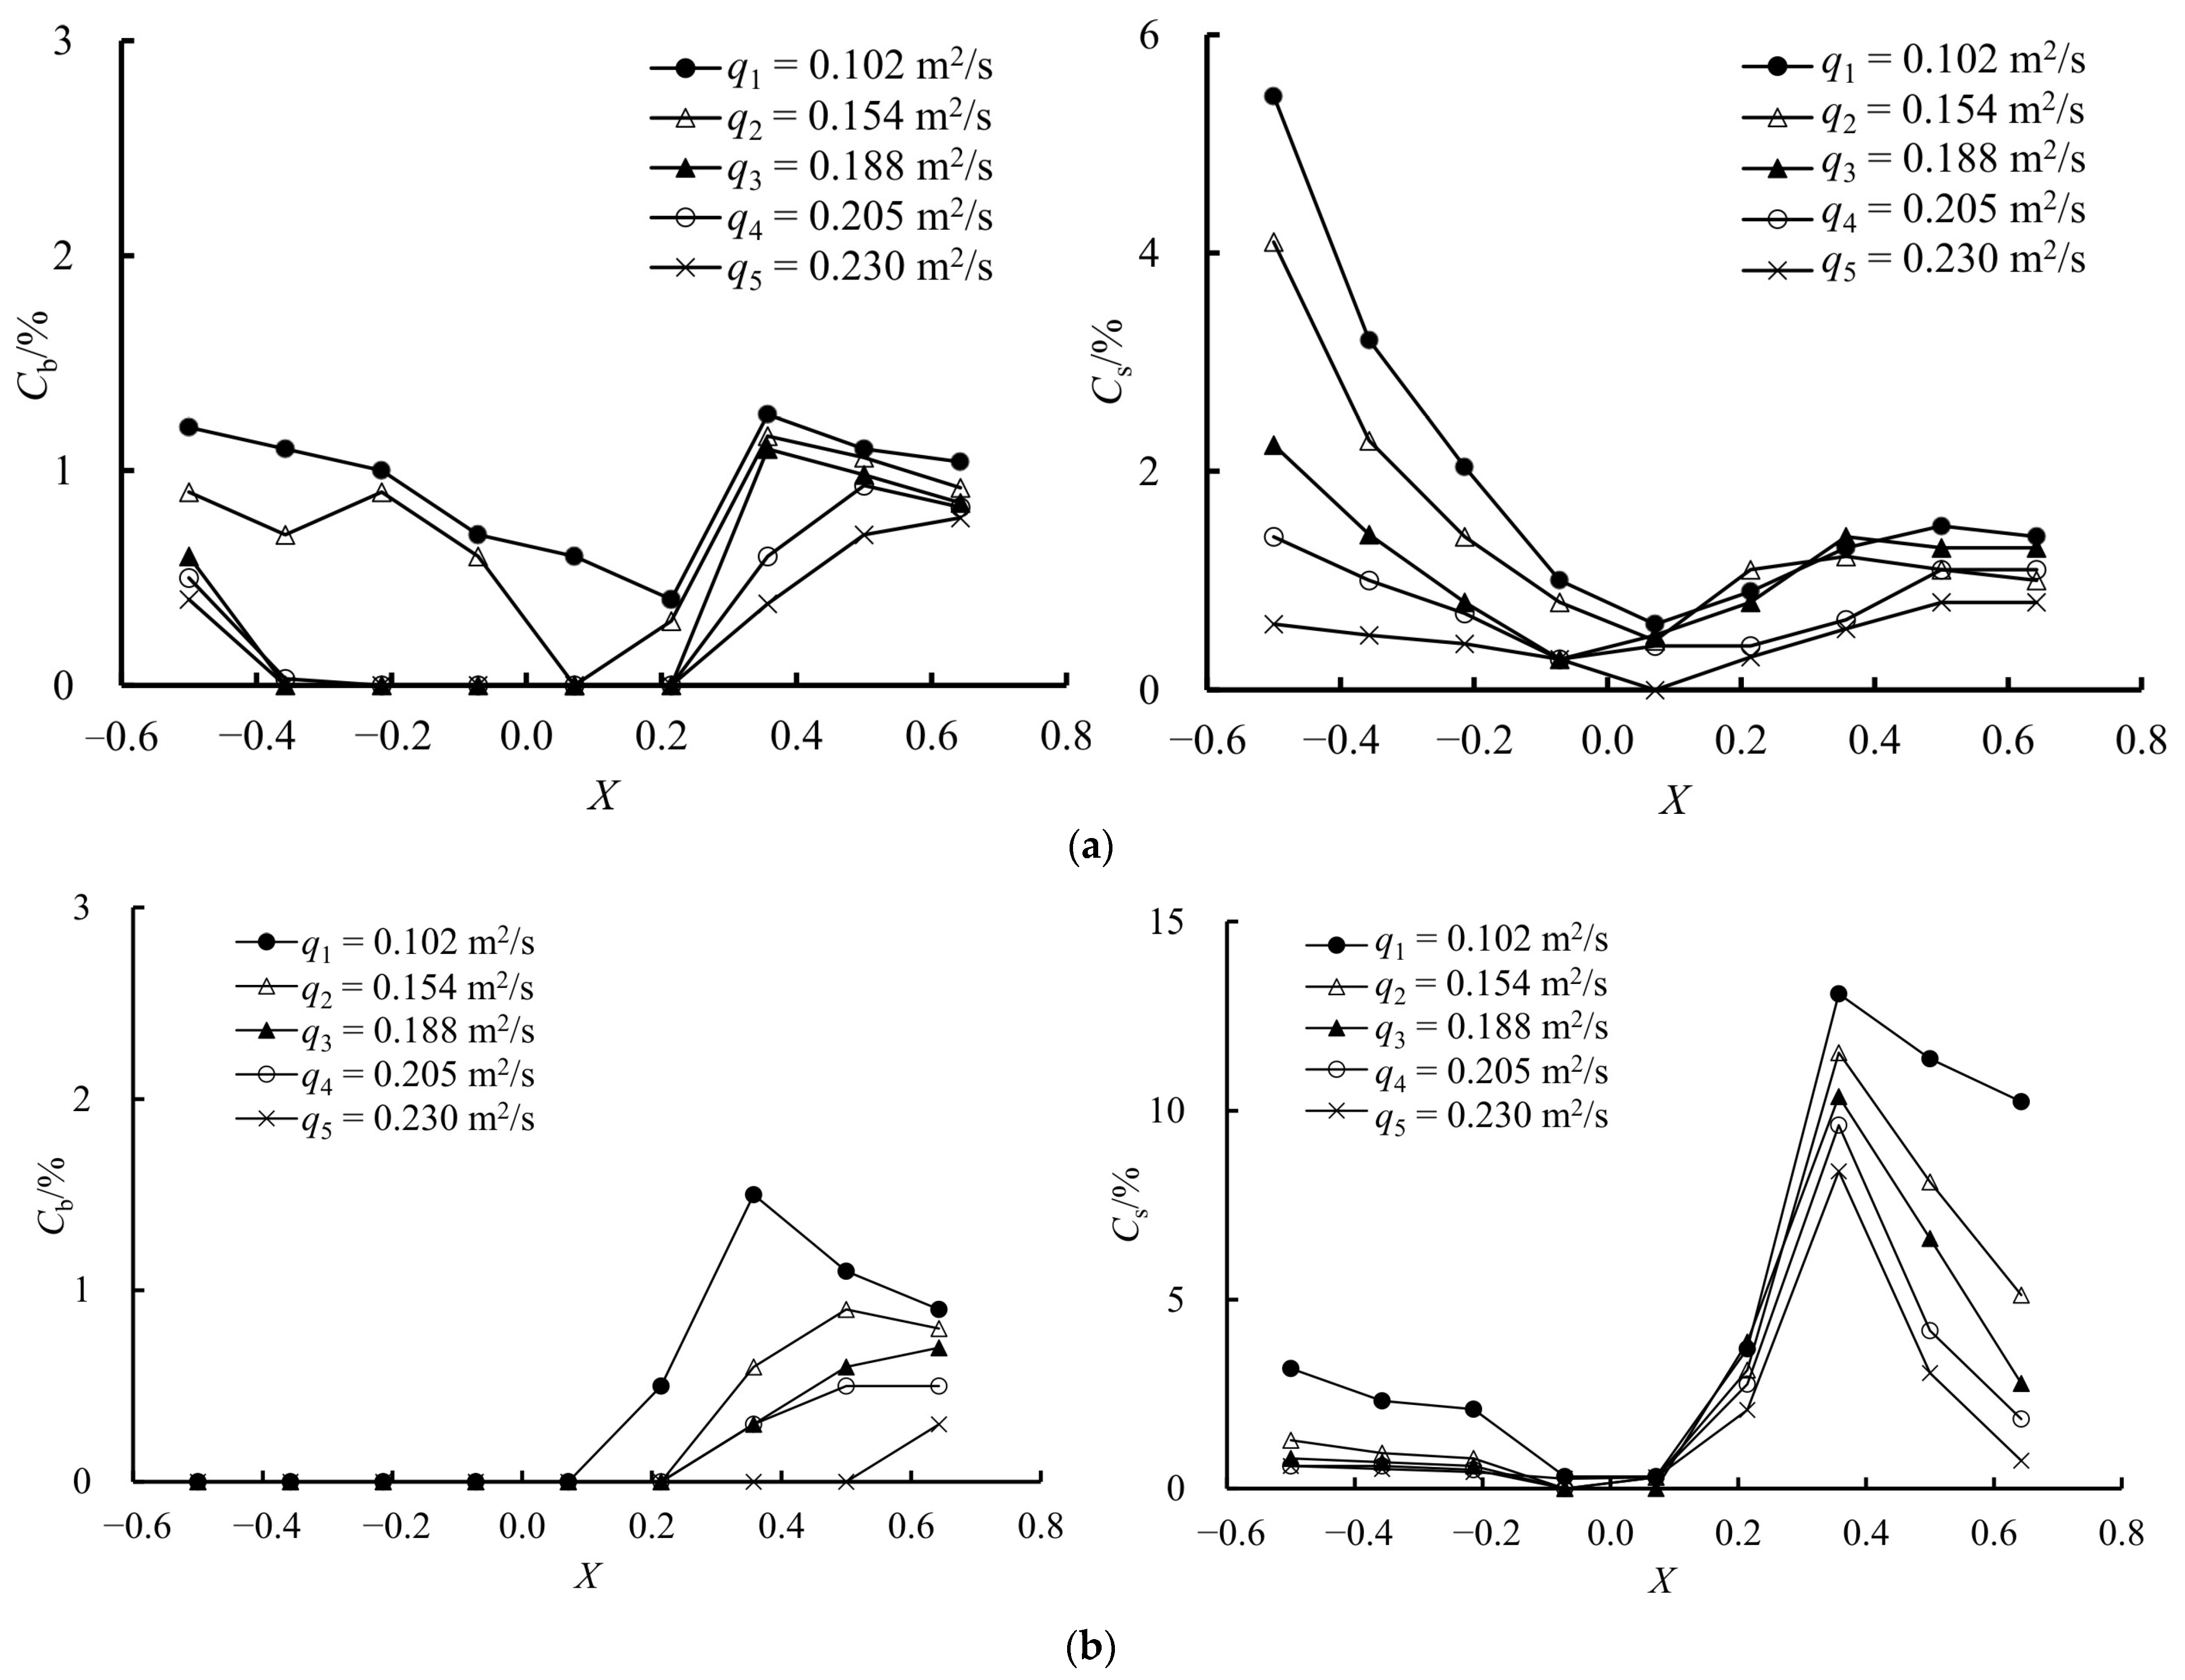
3.3. Air Entrainment
4. Conclusions
- (1)
- When a sill is located near the upstream weir flow (i.e., the weir toe in this study), the jump types of the wave flow can be classified as submerged and non-submerged. The submerged wave type flow corresponding to a higher relative sill height was relevant for obtaining a better aeration effect.
- (2)
- The ambient pressure head of the wave-type flow (i.e., the bottom pressure of the stilling basin) is strongly influenced by the flow pattern. Pressure fluctuations were more significant in the vicinity of the sill, and these are caused by the movement of the turbulent region of the jump, especially for the change in wave-type flow from a submerged jump to a non-submerged jump. The streamwise mean bottom pressure profile revealed the existence of three distinct flow zones: (1) deflection zone, (2) jump zone, and (3) wave impact zone. There were two peak pressure points along the stilling basin, and these values can be distinguished by the upstream Froude number and the position and height of the sill.
- (3)
- The air concentrations on the bottom and the sidewall were also affected by the flow pattern. For a given sill-controlled stilling basin, the air concentrations on the bottom and the sidewall decreased with increasing unit discharges. The flow zone within the vicinity of the sill had slight air entrainment and significant pressure fluctuations, which may be prone to cavitation. Thus, this region near the sill should be focused upon in order to provide protection.
Author Contributions
Funding
Institutional Review Board Statement
Informed Consent Statement
Data Availability Statement
Conflicts of Interest
Notations
| P | weir height (m) |
| ls | length of the stilling basin from the weir toe (m) |
| s | sill height (m) |
| hs | positive step height (m) |
| Q | inflow discharge (m3/s) |
| qw | inflow unit discharge (m2/s) |
| y0 | upstream flow depth (m) |
| y1, y2 | supercritical flow depth upstream and downstream of the sill (m) |
| y4 | flow depth at the terminal section of the weir (m) |
| v1, v2 | supercritical flow velocity upstream and downstream of the sill (m/s) |
| Hp | pressure head (m) |
| Cb, Cs | air concentrations on the bottom and the sidewall |
| F1 | upstream Froude number |
| F2 | downstream Froude number |
References
- Carvalho, R.F.; Lemos, C.M.; Ramos, C.M. Numerical computation of the flow in hydraulic jump stilling basins. J. Hydraul. Eng. 2008, 46, 739–752. [Google Scholar] [CrossRef]
- Manoochehr, F.M.; Sadegh, H.; Babak, L.A.; Peyman, A. Reduction of stilling basin length with tall end sill. J. Hydrodyn. 2011, 23, 498–502. [Google Scholar] [CrossRef]
- Tajabadi, F.; Jabbari, E.; Sarkardeh, H. Effect of the end sill angle on the hydrodynamic parameters of a stilling basin. Eur. Phys. J. Plus. 2018, 133, 10. [Google Scholar] [CrossRef]
- Zhou, Y.; Wu, J.H.; Qian, S.T.; Ding, C.M.; Pan, G.Y. Discussion of “Types I, II, III, and IV Stilling Basin Performance for Stepped Chutes Applied to Embankment Dams” by Sherry L. Hunt and Kem C. Kadavy. J. Hydraul. Eng. 2023, 149, 07022008. [Google Scholar] [CrossRef]
- Hager, W.H.; Li, D. Sill-controlled energy dissipator. J. Hydraul. Res. 1992, 30, 165–181. [Google Scholar] [CrossRef]
- Kang, J.G.; Yeo, H.K.; Lee, K.C.; Choi, N.J. Experimental study on flow characteristic and wave type flow at downstream of stepped weir. J. Korea Water Resour. Assoc. 2010, 43, 41–49. [Google Scholar] [CrossRef]
- Ohtsu, I.; Yasuda, Y.; Hashiba, H. Incipient jump conditions for flows over a vertical sill. J. Hydraul. Eng. 1996, 122, 465–469. [Google Scholar] [CrossRef]
- Eldesoky, I.M.; Abdelsalam, S.I.; Abumandour, R.M.; Kamel, M.H.; Vafai, K. Interaction between compressibility and particulate suspension on peristaltically driven flow in planar channel. Appl. Math. Mech. 2017, 38, 137–154. [Google Scholar] [CrossRef]
- Mossa, M.; Petrillo, A.; Chanson, H. Tailwater level effects on flow conditions at an abrupt drop. J. Hydraul. Res. 2003, 41, 39–51. [Google Scholar] [CrossRef]
- Ferreri, G.B.; Nasello, C. Hydraulic jumps at drop and abrupt enlargement in rectangular channel. J. Hydraul. Res. 2002, 40, 491–505. [Google Scholar] [CrossRef]
- Kawagoshi, N.; Hager, W. Wave type flow at abrupt drops: I. Flow geometry. J. Hydraul. Res. 1990, 28, 235–252. [Google Scholar] [CrossRef]
- Eroğlu, N.; Tokyay, N. Statistical approach to geometric properties of wave-type flow occurring at an abrupt drop. J. Fac. Eng. Archit. Gazi Univ. 2012, 27, 911–919. [Google Scholar]
- Eroğlu, N.; Taştan, K. Local Energy Losses for Wave-Type Flows at Abrupt Bottom Changes. J. Irrig. Drain. Eng. 2020, 146, 04020029. [Google Scholar] [CrossRef]
- Huang, G.; Diao, M.; Jiang, L.; Wang, C.A.; Jia, W. Experimental Study on Wave Characteristics of Stilling Basin with a Negative Step. Entropy 2022, 24, 445. [Google Scholar] [CrossRef]
- Zhou, Y.; Wu, J.H.; Qian, S.T.; Ma, F.; Hu, J.Y. Discussion of “Local Energy Losses for Wave-Type Flows at Abrupt Bottom Changes” by Nihat Eroglu and Kerem Tastan. J. Irrig. Drain. Eng. 2021, 147, 07021007. [Google Scholar] [CrossRef]
- Padulano, R.; Fecarotta, O.; Del Giudice, G.; Carravetta, A. Hydraulic design of a USBR Type II stilling basin. J. Irrig. Drain. Eng. 2017, 143, 04017001. [Google Scholar] [CrossRef]
- Zhou, Y.; Wu, J.H.; Ma, F.; Qian, S.T. Experimental investigation of the hydraulic performance of a hydraulic-jump-stepped spillway. KSCE J. Civ. Eng. 2021, 25, 3758–3765. [Google Scholar] [CrossRef]
- Hager, W.H.; Bremen, R. Classical hydraulic jump: Sequent depths. J. Hydraul. Res. 1989, 27, 565–585. [Google Scholar] [CrossRef]
- Hager, W.H.; Bretz, N.V. Hydraulic jumps at positive and negative steps. J. Hydraul. Res. 1986, 24, 237–253. [Google Scholar] [CrossRef]
- Hunt, S.L.; Kadavy, K.C. Types I, II, III, and IV stilling basin performance for stepped chutes applied to embankment dams. J. Hydraul. Eng. 2021, 147, 06021004. [Google Scholar] [CrossRef]
- Stojnic, I.; Pfister, M.; Matos, J.; Schleiss, A.J. Effect of 30-degree sloping smooth and stepped chute approach flow on the performance of a classical stilling basin. J. Hydraul. Eng. 2021, 147, 04020097. [Google Scholar] [CrossRef]
- Hager, W.H.; Sinniger, R. Flow characteristics of the hydraulic jump in a stilling basin with an abrupt bottom rise. J. Hydraul. Res. 1985, 23, 101–113. [Google Scholar] [CrossRef]
- Sobani, A. Pressure fluctuations on the slabs of stilling basins under hydraulic jump. In Proceedings of the 11th International Conference on Hydroinformatics, New York, NY, USA, 17–21 August 2014. [Google Scholar]
- Peterka, A.J. The effect of entrained air on cavitation pitting. In Proceedings of the Proceedings: Minnesota International Hydraulic Convention, Minneapolis, MN, USA, 1–4 September 1953; pp. 507–518. [Google Scholar]


| Cases | ls (m) | s (m) | F1 | F2 | Jump Type |
|---|---|---|---|---|---|
| M12-1 | 0.5 | 0.065 | 5.12 | 1.93 | SWTF |
| M12-2 | 0.5 | 0.065 | 4.21 | 1.65 | SWTF |
| M12-3 | 0.5 | 0.065 | 3.86 | 1.62 | SWTF |
| M12-4 | 0.5 | 0.065 | 3.77 | 1.72 | SWTF |
| M12-5 | 0.5 | 0.065 | 3.70 | 1.91 | SWTF |
| M22-1 | 0.6 | 0.065 | 5.18 | 1.66 | SWTF |
| M22-2 | 0.6 | 0.065 | 4.29 | 1.79 | SWTF |
| M22-3 | 0.6 | 0.065 | 4.13 | 1.87 | SWTF |
| M22-4 | 0.6 | 0.065 | 3.82 | 1.95 | SWTF |
| M22-5 | 0.6 | 0.065 | 3.74 | 1.77 | NSWTF |
| M32-1 | 0.7 | 0.065 | 5.31 | 1.97 | SWTF |
| M32-2 | 0.7 | 0.065 | 4.30 | 1.82 | SWTF |
| M32-3 | 0.7 | 0.065 | 4.08 | 1.76 | NSWTF |
| M32-4 | 0.7 | 0.065 | 3.93 | 2.79 | NSWTF |
| M32-5 | 0.7 | 0.065 | 3.74 | 2.96 | NSWTF |
| M31-1 | 0.7 | 0.050 | 5.26 | 1.44 | NSWTF |
| M31-2 | 0.7 | 0.050 | 4.43 | 2.89 | NSWTF |
| M31-3 | 0.7 | 0.050 | 4.08 | 3.10 | NSWTF |
| M31-4 | 0.7 | 0.050 | 3.93 | 3.19 | NSWTF |
| M31-5 | 0.7 | 0.050 | 3.74 | 3.13 | NSWTF |
| M33-1 | 0.7 | 0.080 | 4.96 | 2.07 | SWTF |
| M33-2 | 0.7 | 0.080 | 4.13 | 1.94 | SWTF |
| M33-3 | 0.7 | 0.080 | 3.77 | 1.95 | SWTF |
| M33-4 | 0.7 | 0.080 | 3.62 | 2.10 | SWTF |
| M33-5 | 0.7 | 0.080 | 3.47 | 1.99 | SWTF |
| Station (m) | |||||||||
|---|---|---|---|---|---|---|---|---|---|
| Case | 0.35 | 0.45 | 0.55 | 0.65 | 0.75 | 0.85 | 0.95 | 1.05 | 1.15 |
| M12-1 | 0.3/3.0 | 0/0.6 | 0/0 | 1.0/1.8 | 0.6/1.9 | 0.8/2.7 | 0.6/2.1 | 1.0/2.0 | 1.5/2.1 |
| M12-2 | 0/1.5 | 0/0.3 | 0/0 | 0.7/1.0 | 0.5/3.4 | 1.1/1.1 | 0.7/1.5 | 1.0/1.8 | 1.8/2.2 |
| M12-3 | 0/0.4 | 0/0 | 0/0 | 0/0.8 | 0.5/3.0 | 0.6/1.0 | 1.0/1.0 | 1.1/1.5 | 1.6/2.0 |
| M12-4 | 0/0.3 | 0/0 | 0/0 | 0.3/0.8 | 0.6/1.1 | 0.8/1.0 | 1.3/1.4 | 1.4/1.6 | 1.5/1.8 |
| M12-5 | 0/0 | 0/0 | 0/0 | 0/0.3 | 0.4/0.8 | 0.5/1.6 | 0.7/1.3 | 0.9/1.2 | 1.0/1.4 |
| M22-1 | 0.6/4.4 | 0/2.5 | 0.4/1.0 | 0.4/0.6 | 1.0/1.1 | 0.9/0.9 | 1.1/2.1 | 0.7/8.1 | 0.7/1.0 |
| M22-2 | 0.5/3.6 | 0/1.5 | 0.3/1.2 | 0/0.3 | 0.6/0.6 | 0.8/1.2 | 1.3/1.3 | 0.7/1.0 | 0.7/0.7 |
| M22-3 | 0.4/1.5 | 0.3/1.7 | 0.3/1.0 | 0/0 | 0.4/0.4 | 0.9/1.2 | 1.0/1.0 | 0.7/1.1 | 0.7/0.7 |
| M22-4 | 0/1.2 | 0/0.9 | 0/0 | 0/0 | 0/0.6 | 0.9/1.1 | 0.8/0.8 | 0.6/0.7 | 0.3/0.4 |
| M22-5 | 0/1.9 | 0/0.4 | 0/0 | 0/0 | 0/0 | 0/1.2 | 0.8/1.6 | 0.7/1.2 | 0.5/0.5 |
| M32-1 | 1.2/5.4 | 1.1/3.2 | 1.0/2.0 | 0.7/1.0 | 0.6/0.6 | 0.4/0.9 | 1.3/1.3 | 1.1/1.5 | 1.0/1.4 |
| M32-2 | 0.9/4.1 | 0.7/2.3 | 0.9/1.4 | 0.6/0.8 | 0/0.5 | 0.3/1.1 | 1.2/1.2 | 1.1/1.1 | 0.9/1.0 |
| M32-3 | 0.6/2.2 | 0/1.4 | 0/0.8 | 0/0.3 | 0/0.5 | 0/0.8 | 1.1/1.4 | 1.0/1.3 | 0.9/1.3 |
| M32-4 | 0.5/1.4 | 0/1.0 | 0/0.7 | 0/0.3 | 0/0.4 | 0/0.4 | 0.6/0.6 | 0.9/1.1 | 0.8/1.1 |
| M32-5 | 0.4/0.6 | 0/0.5 | 0/0.4 | 0/0.3 | 0/0 | 0/0.3 | 0.4/0.6 | 0.7/0.8 | 0.8/0.8 |
| M31-1 | 0/3.2 | 0/2.3 | 0/2.1 | 0/0.3 | 0/0.3 | 0.5/3.7 | 1.5/13.1 | 1.1/11.4 | 0.9/10.2 |
| M31-2 | 0/1.3 | 0/0.9 | 0/0.8 | 0/0 | 0/0.3 | 0/3.1 | 0.6/11.5 | 0.9/8.1 | 0.8/5.1 |
| M31-3 | 0/0.8 | 0/0.7 | 0/0.6 | 0/0 | 0/0 | 0/3.9 | 0.3/10.4 | 0.6/6.6 | 0.7/2.8 |
| M31-4 | 0/0.6 | 0/0.6 | 0/0.5 | 0/0 | 0/0.3 | 0/2.8 | 0.3/9.6 | 0.5/4.2 | 0.5/1.8 |
| M31-5 | 0/0.6 | 0/0.5 | 0/0.4 | 0/0.3 | 0/0.3 | 0/2.1 | 0/8.4 | 0/3.1 | 0.3/0.7 |
| M33-1 | 0.8/2.9 | 0.8/2.2 | 0.7/1.9 | 0.3/0.6 | 0.6/0.7 | 1.2/2.1 | 1.6/2.2 | 1.7/1.9 | 1.3/1.6 |
| M33-2 | 0.7/2.4 | 0.8/1.9 | 0.6/1.7 | 0/0 | 0.5/0.6 | 1.0/1.9 | 1.6/2 | 1.6/1.7 | 1.2/1.4 |
| M33-3 | 0.6/1.9 | 0.6/1.6 | 0.5/1.4 | 0/0.3 | 0.4/0.5 | 0.8/1.6 | 1.4/1.7 | 1.4/1.5 | 1.1/1.2 |
| M33-4 | 0.6/1.3 | 0.6/1.2 | 0.5/1.3 | 0/0.3 | 0.3/0.5 | 0.7/1.3 | 1.2/1.5 | 1.3/1.4 | 1.0/1.2 |
| M33-5 | 0.6/1.2 | 0.6/1.0 | 0.5/1.1 | 0/0 | 0.3/0.4 | 0.7/1.2 | 1.2/1.3 | 1.2/1.2 | 1.0/1.1 |
Disclaimer/Publisher’s Note: The statements, opinions and data contained in all publications are solely those of the individual author(s) and contributor(s) and not of MDPI and/or the editor(s). MDPI and/or the editor(s) disclaim responsibility for any injury to people or property resulting from any ideas, methods, instructions or products referred to in the content. |
© 2023 by the authors. Licensee MDPI, Basel, Switzerland. This article is an open access article distributed under the terms and conditions of the Creative Commons Attribution (CC BY) license (https://creativecommons.org/licenses/by/4.0/).
Share and Cite
Zhou, Y.; Wu, J.; Zhao, H.; Hu, J.; Bai, F. Hydraulic Performance of Wave-Type Flow at a Sill-Controlled Stilling Basin. Appl. Sci. 2023, 13, 5053. https://doi.org/10.3390/app13085053
Zhou Y, Wu J, Zhao H, Hu J, Bai F. Hydraulic Performance of Wave-Type Flow at a Sill-Controlled Stilling Basin. Applied Sciences. 2023; 13(8):5053. https://doi.org/10.3390/app13085053
Chicago/Turabian StyleZhou, Yu, Jianhua Wu, Hai Zhao, Jianyong Hu, and Fuqing Bai. 2023. "Hydraulic Performance of Wave-Type Flow at a Sill-Controlled Stilling Basin" Applied Sciences 13, no. 8: 5053. https://doi.org/10.3390/app13085053