Article

A Fuzzy Model for Reasoning and Predicting Student’s Academic Performance

1
Department of Computer Science, College of Computer Engineering and Science, Prince Sattam University, Al-Kharj 16278, Saudi Arabia
2
Department of Business Administration, Applied College, Prince Sattam University, Al-Kharj 16278, Saudi Arabia
*
Author to whom correspondence should be addressed.
Appl. Sci. 2023, 13(8), 5140; https://doi.org/10.3390/app13085140
Submission received: 14 March 2023 / Revised: 14 April 2023 / Accepted: 17 April 2023 / Published: 20 April 2023
(This article belongs to the Topic Artificial Intelligence and Fuzzy Systems)

Abstract

:
Evaluating students’ academic performance is crucial for assessing the quality of education and educational strategies. However, it can be challenging to predict and evaluate academic performance under uncertain and imprecise conditions. To address this issue, many research works have employed fuzzy concepts to analyze, predict, and make decisions about students’ academic performance. This paper investigates the use of fuzzy concepts in research related to evaluating, analyzing, predicting, or making decisions about student academic performance. The paper proposes a fuzzy model, called FPM (Fuzzy Propositional Model), for reasoning and predicting students’ academic performance. FPM aims to address the limitations of previous studies by incorporating propositional logic with fuzzy sets concept, which allows for the representation of uncertainty and imprecision in the data. FPM integrates and transforms if-then rules into weighted fuzzy production rules to predict and evaluate academic performance. This paper tests and evaluates the FPM in two scenarios. In the first scenario, the model predicts and examines the impact of absenteeism on academic performance where there is no clear relation between the two parts of the dataset. In the second scenario, the model predicts the final exam results using the lab exam results, where the data are more related. The FPM provides good results in both scenarios, demonstrating its effectiveness in predicting and evaluating students’ academic performance. A comparison study of the FPM’s results with a linear regression model and previous work showed that the FPM performs better in predicting academic performance and provides more insights into the underlying factors affecting it. Therefore, the FPM could be useful in educational institutions to predict and evaluate students’ academic performance, identify underlying factors affecting it, and improve educational strategies.

1. Introduction

Students’ academic performance plays an essential role in evaluating and assessing the quality of education. The increasing demands for quality assurance requirements in education have resulted in increasing interest in evaluating and assessing the students’ performance. Accordingly, the attention towards the students’ academic performance increased from the researchers and application developers. Various fuzzy approaches have been employed to address the uncertainty issues in the students’ academic performance.
This paper proposes a model (FPM) that reasons and predicts the students’ academic performance using fuzzy sets and propositional logic.
Fuzzy set is a generalization of the classical set (or the normal mathematical set) which allows the membership function to take values in the interval [0,1] instead of just the membership [1].
Since Fuzzy sets were introduced by Lotfi A. Zadeh in 1965 [1], several theoretical developments have been proposed, such as Pythagorean fuzzy sets [2], intuitionistic fuzzy sets [3], fuzzy logic [4], fuzzy linguistic [5], and fuzzy rough sets [6]. In addition, fuzzy sets concepts were provided considerable additions and contributions in many fields, such as Neuro Fuzzy [7], Fuzzy image processing [8], and Mamdani fuzzy [9].
Propositional logic [10] is a logic representation of knowledge in which the statements are made by propositions. A proposition is a declarative statement which is either true or false, and it allows relationships between the statements to be discovered by logical and mathematical rules.
The research on the academic performance field is rapidly increasing. Recently, there are many research works which are concerned with using fuzzy concepts in students’ academic performance, whether by providing prediction results, classifying, making decisions, or evaluating and analyzing the students’ academic performance, as it is explained in Table 1.
The following is an overview of these research works.
In [11], a neuro-fuzzy model was designed to predict the students’ academic performance. The authors designed a fuzzy inference system based on neural networks to assess the students’ academic performance. Their experiment was performed with a real dataset obtained from students’ achievements in the engineering economy course. They used Quiz (Q), Major (M), Midterm (MD), Final (F), Performance Appraisals (P), and Survey (S) as input parameters for their model and the Students’ Academic Performance as output. They expressed these parameters by fuzzy linguistic values such as unsatisfactory (A1), average (A2), good (A3), very well (A4), and excellent (A5). Their neural network structure works on computing these parameters as a gradient vector, which provides a measure of how their model was modeled with the input/output data for a given set of parameters. They showed how several optimization routines can be applied in adjusting the parameters to reduce the error measure (they used sum of the squared error).
In [12], a neuro-fuzzy approach was proposed for classifying the students’ academic performance. The authors classified students into different groups using a neuro-fuzzy approach. They used a fuzzy classification rule 𝑅𝑖: if 𝑥𝑠1 is 𝐴𝑖1 and ⋯ 𝑥𝑠𝑗 is 𝐴𝑖𝑗 ⋯ and 𝑥𝑠𝑛 is 𝐴𝑖𝑛, then class is 𝐶𝑘, where 𝑥𝑠𝑗 represents the 𝑗th feature or input variable of the 𝑠th sample; 𝐴𝑖𝑗 denotes the fuzzy set of the 𝑗th feature in the 𝑖th rule; and 𝐶𝑘 represents the 𝑘th label of class. They parted the feature space into multiple fuzzy subspaces by fuzzy if-then rules; they represented these fuzzy rules with a network structure. Their neural network classifier contains a multilayer feed-forward network consisting of input, fuzzy membership, fuzzification, defuzzification, normalization, and output. Their classifier has multiple inputs and multiple outputs; they depicted their neural network classifier with two features {𝑥1, 𝑥2} and three classes {𝐶1, 𝐶2, 𝐶3}, and every input in their model was defined with three linguistic variables.
In [13], a Forgotten (fuzzy) Effects model was proposed for analyzing the learning impact on academic performance. The paper determined the factors that affect the academic performance and then showed how these factors can be applied for graduating subjects in the engineering field using a problem-based model. They identified the factors that motivate the exposure of higher education centers, using a model based on the principles of Forgotten (fuzzy) Effects. They gathered qualitative information derived from a group of experts; the factors that they identified were lack of information, poor curricular planning, and the teacher’s attitude. They applied a problem-based-learning model using these factors, and the engineering field included the graduating subjects’ examination (taken from 2017 to 2020); their studies showed 15% improvement in academic performance.
In [14], a Decision Tree and Fuzzy Genetic Algorithm was applied to predict the Students’ Academic Performance. The paper provided a prediction model that protected the students’ performance for each subject, the protected model based on two classification algorithm (decision tree and fuzzy genetic algorithm). They applied their model to predict the Bachelor and Master degree students in Computer Science and Electronics and Communication streams. They used the internal marks, sessional marks, and admission scores as parameters for their model; then, they combined the internal marks with attendance marks and obtained the average marks from two sessional exams and assignment marks. They used the admission score to assign degrees to students based on their weighted score obtained from 10th and 12th examination marks and entrance marks. They used the same parameters in both models (decision tree and the genetics algorithm).
In [15], a fuzzy expert system for academic performance evaluation was proposed. The proposed system is based on fuzzy logic techniques. The system provides a monitoring for the students’ progress with the ability to make decisions about next step training. The fuzzy expert system was developed in five stages: in the first stage, the authors collected the value from student exam marks; then, in the next stage, they converted this value to fuzzy value using triangular membership function. In the third stage, they defined the fuzzy rule. In stage four, they determined an output membership function value for each active rule, and, finally, in stage five, they calculated the final output using Centre of Area (COA).
In [16], fuzzy models are used to predict the academic performance of distance education students. In this paper, the authors implemented three fuzzy models (classical fuzzy model, expert fuzzy model, and gene-fuzzy model) to predict the distance education students’ year-end academic performance. They used the data of 218 students who enrolled in Basic Computer Sciences in 2012.
In [17], the authors provided a fuzzy expert system to examine the learning strategies for online learning systems. They used two computer applications: MATLAB for fuzzy analysis and the Moodle platform for online learning environment. They considered the learners’ self-directed learning readiness as the moderating variable. They used aptitude treatment interaction for the learning model and statistical analysis for examining the effect of this strategy and the students’ self-directed learning readiness. They concluded that students who are taught with online learning strategies based on fuzzy expert systems have better learning outcomes than students who are given traditional online learning strategies.
In [18], a neuro fuzzy model was developed to classify and predict students’ academic performance. The authors applied their model on real data from an undergraduate program in the Electrical Engineering and Information Technology department at an Indonesian university.
In [19], a fuzzy neural network model is used to predict the students’ academic performance. In this paper, the authors considered in their model most of the students’ academic profiles, including age, gender, education, past performance, etc., and they designed their model using MATLAB and JAVA.
In [20], a data-driven fuzzy rule approach was proposed for evaluating student academic performance. The authors performed Criterion-Referenced Evaluation (CRE) and Norm-Referenced Evaluation (NRE). They used training data from students’ performance in two courses in the form of numerical crisp scores, then used a fuzzy approach for utilizing these data in the form of fuzzy values; then, they applied CRE and NRE to see how a fuzzy rule-based approach can be used for aggregation of students’ academic performance.
In [21], the authors used the concept of Pythagorean fuzzy sets in academic performance. They provided a decision-making approach for career placements based on academic performance using max–min–max composition. They used their approach in solving the multi-criteria decision-making problems.
In [22], the authors developed an intelligent tutoring system using Bayesian networks and fuzzy logic to support students in learning environments and enhance their academic performance. Their system was based on the classical architecture of intelligent tutoring systems, and they used a fuzzy logic system to determine the students’ performance in a particular topic, taking two factors into account: the pretest grade and the topic test grad. They used three fuzzy sets for each input variable to describe the students’ grade as poor, good, or excellent and two fuzzy sets to describe the output (low and high). They used 9 fuzzy rules configured with two input variables (Pretest-Grade and TopicTest-Grade) and one output variable (Performance).
In [23], the authors presented an integration framework that integrated fuzzy clustering and regression to predict the students’ final grade. They composed four distinct subsystems, each of which implements partition, regression, offset value generation, and estimation. These activities were integrated together to form the overall student score-predicting mechanism. They used four datasets, each containing hundreds of instances collected from two Portuguese schools (GP and MS) about their students in Math and Portuguese language study. In the complete dataset with more than 30 attributes, they split each dataset into subsets for 10-fold cross validation, and they reported their results based on an average of 10 times of the 10-fold cross validation.
In [24], a fuzzy learning model was proposed to predict student academic performance. The model in this paper was built based on methods that merge the fuzzy concept with the concept automated machine learning. The authors used the data of 866 students who attended, 456 of which were male and 410 females; they collected their data from the three compulsory courses in the spring semester of two successive academic years, 2017–2018 and 2018–2019, at the Aristotle University of Thessaloniki. Then, they employed fuzzy-based classifiers to student performance (pass/fail) in higher education courses. The authors examined six fuzzy classifiers, FMARR, MFPC using OWA and AIWA aggregation operators (MFPC OWA/ AIWA), Local and Global Genetic FPCs (FPC GA/LGA), PTs, PTTDs, and the hybrid FPC using OWA operator (FPC OWA).
In [25], a decision-making fuzzy VIKOR approach was used to rank academic performance. The authors used the fuzzy set concepts in their approach; they ranked the academic performance in linguistic variables (excellence, honors, average, pass, and fail), and then they transformed these linguistic variables into fuzzy numbers.
In [26], a neuro-fuzzy model based on the Cuckoo Search algorithm was used for predicting the students’ academic performance. The authors proposed a hierarchical Adaptive Neuro-Fuzzy Inference System model. They used the hierarchical structure of ANFIS in solving the curse-of-dimensionality problem, and they used CS algorithm to optimize the clustering parameters; then, they formed the rule base.
In [27], the authors developed a fuzzy logic application to evaluate the students’ academic performance. In this paper, the authors used Mamdani fuzzy inference methods. They used three exams’ results as input variables of the fuzzy logic-based expert system. Each input variable had five triangular membership functions, and the triangular membership function was specified by three parameters (a, b, c). The authors applied the system to a group of students and compared the results to traditional methods of performance evaluation. The authors used MATLAB for implementing their fuzzy system and tested it using 20 students’ marks obtained from Exam1, Exam2, and the practical Exam.
In [28], a fuzzy classification system was proposed to evaluate the students’ academic performance. The system used in this paper is based on qualitative link analysis methodology instead of using a rule-based method. The authors took a fuzzy classification problem as link analysis. They provided a fuzzy classification framework that integrated network representation scheme and link-based analysis. They represented the variable terms and classes as graph nodes, while their observation associations are encoded as corresponding edges. Then, the likelihood that a new data instance belonging to a specific class is determined via the notion of link-based similarity measure. To measure the similarity, the authors used link analysis based on examining relation patterns amongst objects in a given link network, which can be specified as an undirected graph.
In [29], a genetic fuzzy model is proposed to evaluate distance education students’ academic performance. The authors proposed a mathematical model that uses a combination of genetic algorithms and fuzzy logic to evaluate the academic performance of distance education students. The authors first predicted the pass of the grade using a classical fuzzy model. Then, they improved the model using a genetic fuzzy approach. They developed their model using a dataset of distance education students from the Moodle record for a MATLAB course at a Turkish university.
In [30], the authors proposed a fuzzy logic system that seeks to facilitate educational institutions in their understanding of the existing relationships among the different academic degrees and, in turn, to carry out corrective tasks where the impact of academic performance is higher and then predicted student marks. They processed several algorithms, aiming to optimize their process and their results after analyzing the relevant data and choosing the optimization algorithms. Then, they implemented a Takagi–Sugeno-type fuzzy inference system (logic-based system) which consisted of multiple inputs and four outputs.
In [31], a neuro-fuzzy model was used to predict the students’ academic performance. The authors examined the factors influencing student academic achievement. They used the variations in courses’ grades among students using the course’s category, the student’s course attendance rate, gender, high-school grade, school type, grade point average (GPA), and course delivery mode as input predictors.
In [32], a fuzzy logic approach was used to predict the students’ outcomes in regard to the instructor’s persona. The objective of this paper was to realize in which way fuzzy logic can be applied to predict the outcome of students’ performance with three parameters—trust, perception, and usefulness of the instructor—while seeking help in academics. In this paper, the authors used the Mamdani fuzzy method. They did their study on a survey data of 1250 students from various colleges. They handled partial truth range varying from absolutely true to absolutely false and used Mamdani-type fuzzy logic for predicting students’ outcomes.
In [33], a neuro-fuzzy model was proposed to predict the students’ perceptions of problem solving skills. In this paper, the authors used the neuro fuzzy approach (ANFIS) in modeling students’ perceptions. Then, they used correlation and regression to examine the relationship between students’ skills and CPS characteristics.
In [34], a fuzzy preference programming approach was introduced to a university department evaluation. In this paper, the authors proposed a fuzzy preference programming approach for data envelopment analysis. The authors applied their approach in one of the higher education institutions in the Philippines.
In [35], the authors provided a system for monitoring the students’ activity and performance. They used a fuzzy Linguistic Summarization (LS) technique to extract linguistically interpretable rules from students’ data describing prominent relationships between activity/engagement characteristics and achieving performance. They applied their system in analyzing the effectiveness of using a Group Performance Model (GPM) to deploy Activity Led Learning (ALL) in a Master’s-level module.
In [36], the authors proposed a conceptual framework to examine testing as a communication process between assessment systems and the testing of English language learners (ELLs). They used probabilistic approaches based on generalizability theory for examining testing as a communication process between assessment systems and ELLs examination.
In [37], the authors investigated different types of distance and similarity measures for nested probabilistic-numerical linguistic term sets. They proposed a family of distance and similarity measures between two NPNLTSs with their properties and then established a variety of weighted distance and similarity measures between two collections of NPNLTSs. They applied their approach to evaluating medical treatment. Generally nested probabilistic linguistic term sets have received attention form researchers, especially in the area of dealing with multidimensional and uncertain characteristics; for example, in [38], the authors proposed the interactive multi-attribute decision-making model. They constructed their model by combining Dempster–Shafer theory (DST) with the concept of probabilistic linguistic term set. The authors used evidential Best–Worst method and maximum entropy principle to capture the weight and interaction of attributes, and they applied a Choquet integral for aggregating the different ELTSs. The authors implemented their model to select the supplier for medical devices. In [39], the authors provided a method to make a decision in the fields of multidimensional, complex, and uncertain characteristics. They applied a VIKOR method to extend the concept of nested probabilistic-numerical linguistic term sets incorporating the investment decision. They provided their solution based on the process of the VIKOR method with the NPLTS, using six steps including alternatives and the attribute vectors for determining, calculation, and sorting. In [40], a nested probabilistic-numerical linguistic term set (NPNLTS) was introduced, in which the quantitative and qualitative information were considered to enhance the fuzzy linguistic approach in handling multi-attribute group decision making. They tested this approach by providing an application for strategy initiatives of the HBIS Group on Supply-side Structural Reform.
Although most of the above research works have used part of propositional logic in their work, there are still some research works concerned with providing ideas, concepts, or theoretical background in the area of propositional logic and its implication with fuzzy concepts. For example, in [41], three kinds of linguistic truth-valued fuzzy negation were proposed. The paper introduced linguistic truth-valued fuzzy negation operators and proposed the operation method based on linguistic truth-value logic systems. In [42], the authors presented an alternative approach for describing fuzzy propositional logic. They generalized the propositional logic in two directions: propositions as fuzzy and logical variables as many-valued. In [43], the authors proposed a new reasoning based on intuitionistic fuzzy propositional logic. They developed two classification methods of intuitionistic fuzzy propositional logic (truth table and figure of equivalence). In [44], the authors explored the propositional part of strict finitistic logic.
In this paper, we proposed a novel fuzzy model for reasoning and predicting the academic performance of students. Our model aims to address the limitations of previous studies by incorporating propositional logic with a fuzzy sets concept, which allows for the representation of uncertainty and imprecision in the data. The main contribution of our paper is the development of a new fuzzy model that improves upon the existing approaches in terms of accuracy and interpretability. In addition, our model provides interpretability by generating linguistic rules that can be easily understood by domain experts. The proposed fuzzy model can be applied to a wide range of educational datasets and can be used to identify students who are at risk of academic failure, thereby enabling interventions to improve their academic performance. Overall, our paper presents a significant contribution to the field of educational data and provides a promising direction for future research in this area and other areas.
The rest of this paper’s structure goes as follows: Section 2 presents the proposed model (FPM). Section 3 presents the experiment. Section 4 presents the result and discussion. The final part of the paper reports the conclusions.
Table 1. The related work.
AreaMethods or Techniques and the Study’s Reference
PredictionNeuro-fuzzy [11,18,19,26,31,33]
Fuzzy decision tree [14]
Genetic fuzzy [13,16]
Fuzzy logical model [16,30]
Fuzzy expert system [16]
Fuzzy clustering + regression (integrated) [23]
Fuzzy learning (fuzzy based on ML concepts) [24]
Mamdani fuzzy [32]
ClassificationNeuro-fuzzy [12,18]
Qualitative link analysis [28]
Decision-makingFuzzy expert system [15,17]
Pythagorean fuzzy [21]
Bayesian networks and fuzzy logic [22]
Fuzzy VIKOR [25]
Analysis and EvaluationForgotten (fuzzy) [13]
Fuzzy expert system [15,17]
Data-driven fuzzy rule [20]
Bayesian networks and fuzzy logic [22]
Mamdani fuzzy [27]
Qualitative link analysis [28]
Genetic fuzzy [29]
Fuzzy preference [34]
Nested Probabilistic Linguistic Term Sets [35,36,37]

2. The Model (FPM)

The suggested Fuzzy Propositional Model (FPM) is based on the concepts of propositional logic and fuzzy sets, and it developed according to a framework containing four stages, as it is explained in Figure 1.

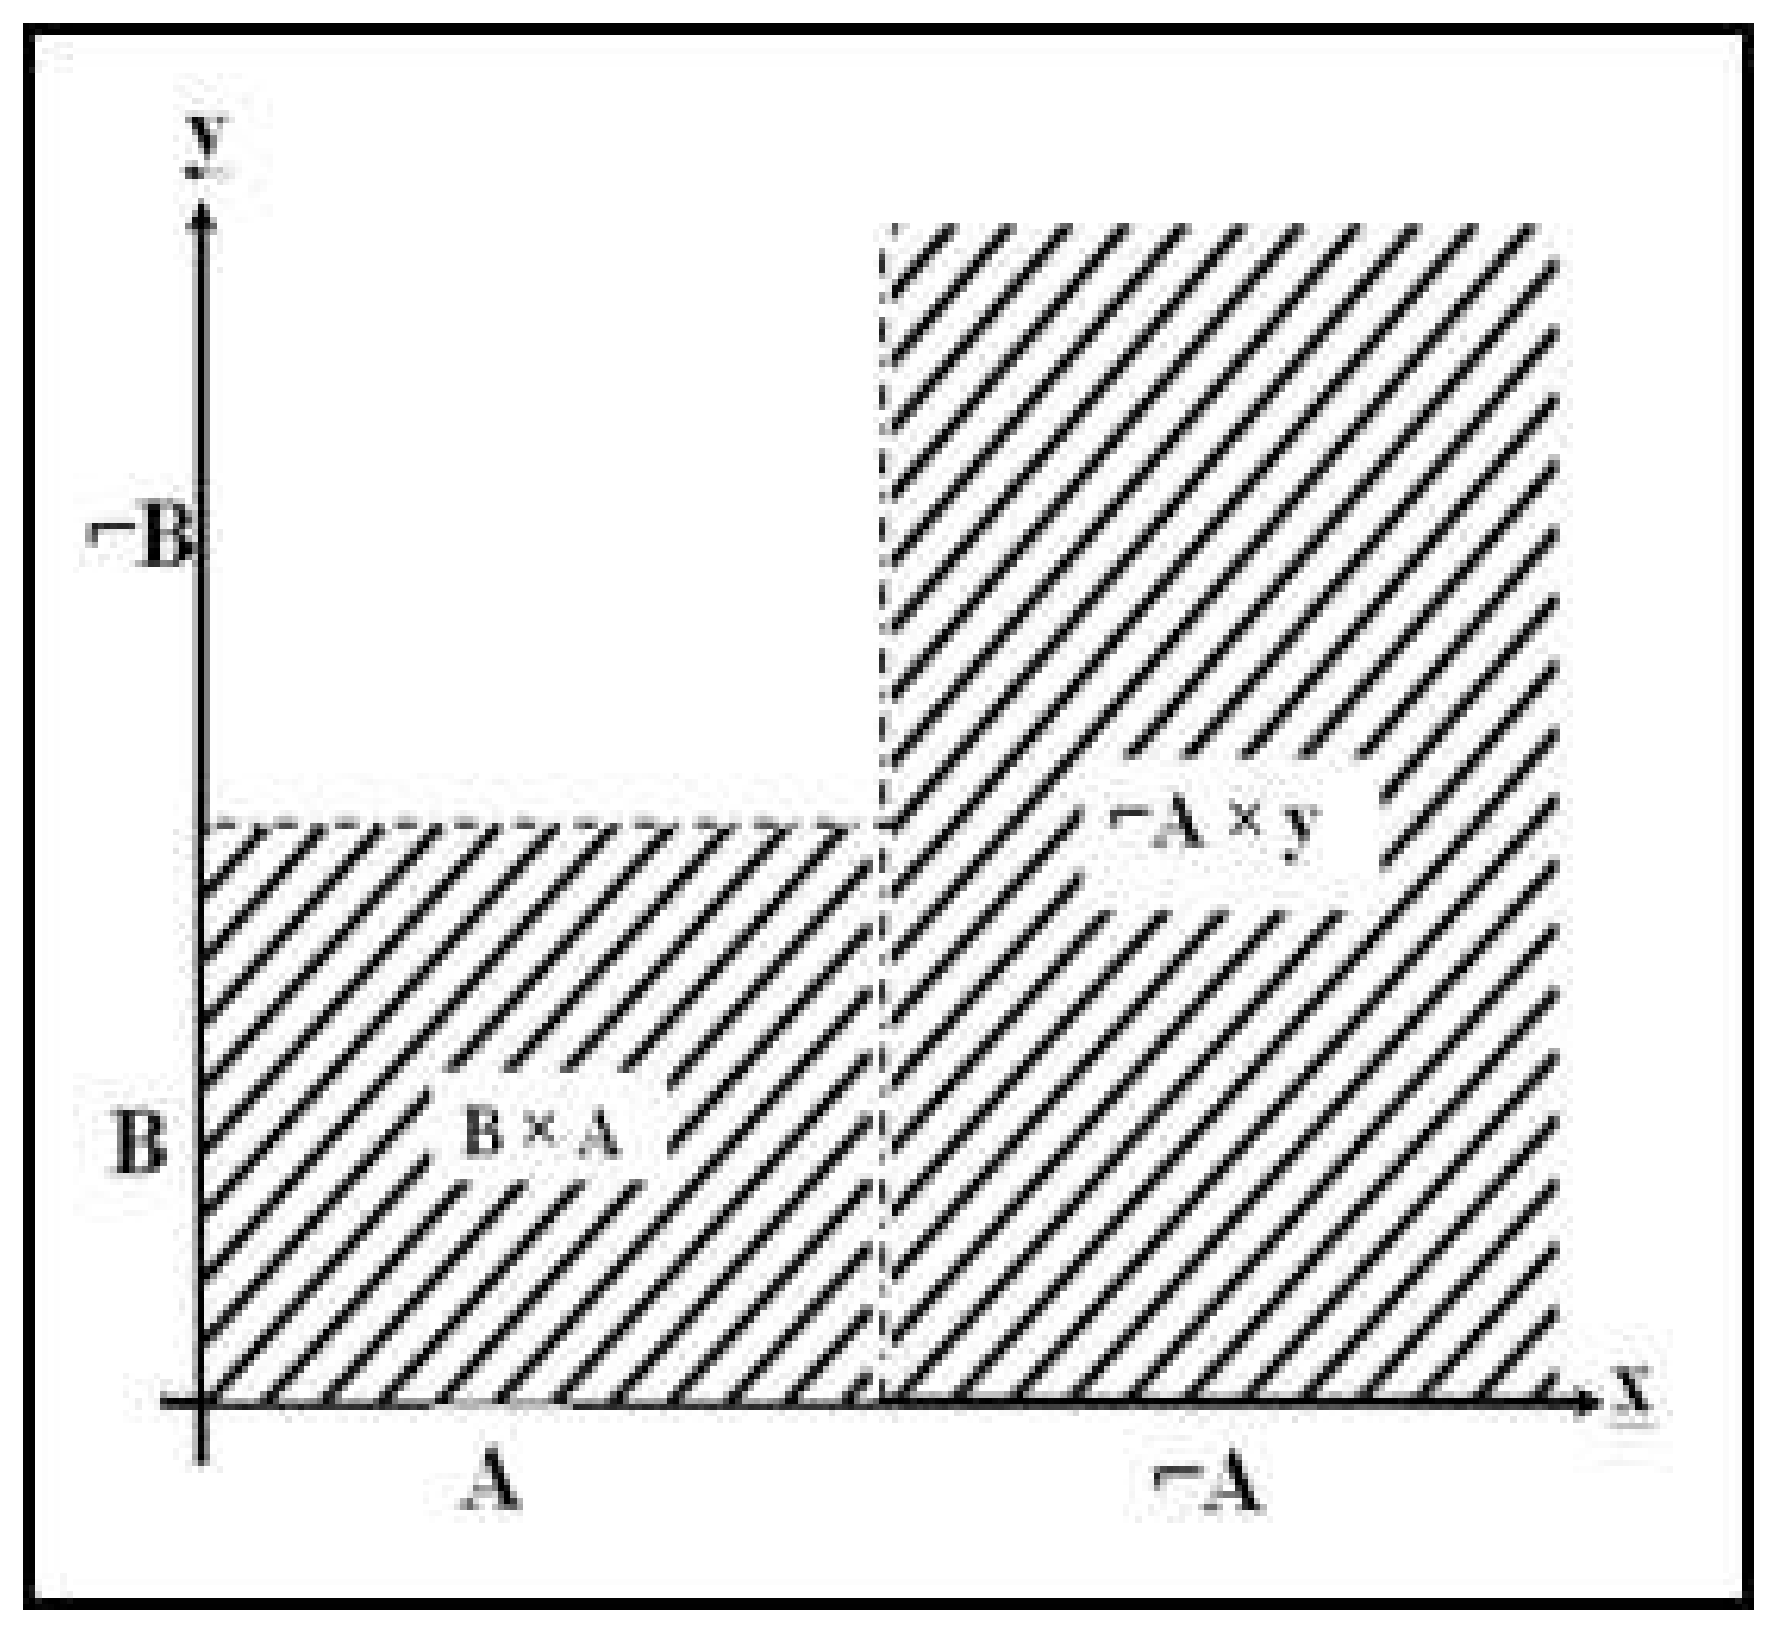
2.1. Determine the Propositional Rule

The FPM is based on the “if then rule” (implies rule):
if A then B or A⇒ B
if A (to some degree x) then B (to some degree y)
The rule in Equations (1) and (2) logically is equal to = (AB) ∪ ¬A. That is because, depending on what A and B logically mean [9,36],
1.
if A is true then B will be true
2.
if A is not true then B may be true or not true, i.e., the “if A then B” rule accepts all cases of B (True or False).
Therefore, the rule if A then B can be formulated as follows:
A⇒ B ≡ (A ∧ B) ∪ ¬A
The above equation (Equation (3)) can be represented graphically as shown in Figure 2, where the shaded parts represent the true area of our formulated logical equation (Equation (3)). The graph shows that the intersection of B × A ≡ (AB) is true, and the entire area of ¬A is also true, which means that the intersection between ¬A and all Y (¬A or (B or ¬B)). Therefore, we will conclude that the rule “if A then B” can be as shown in Equation (4):
A⇒ B ≡ (A ∧ B) ∪ (¬A ∧ Y)
The result of Equation (4) represents the production rule of the FPM.

2.2. Building the Fuzzy Sets (FS)

The fuzzy set is built using the following algorithm (Figure 3):
As it is shown in the algorithm in Figure 3, generating the fuzzy set is performed by transforming the normal set to a fuzzy set by dividing each item by the value of biggest item. For example, the fuzzy set of this normal set {69, 130.3, 46.5, 17.7, 16.1, 8.1} can be generated as follows:
i.
The largest value i Gi isi G2 i = 130.3
ii.
The fuzzy set will be generated by dividing each element by 130.3 (G2) as follows:
  • Fuzzy set = {{69/130.3, 130.3/130.3, 46.5/130.3, 17.7/130.3, 16.1/130.3, 8.1/130.3}
  • Fuzzy set = {0.53, 1.00, 0.36, 0.14, 0.12, 0.06}
We can see that the final fuzzy set, in this example, provides the membership degree of each element instead of only the membership. This is one of the benefits of using the fuzzy set.

2.3. Constructing the Product Rule (Fuzzy Set Transformer Matrix (FTM))

In this stage, we used the results of stage 2 above (the fuzzy sets) to construct the production rule ‘if then’ (Equation (2)) using the following algorithm (Figure 4):
As it represented in the algorithm in Figure 4, the constructing of the production rule is based on four operations, as follows:
1.
Determine the component of the rule (A, B, and the relation between them). This rule is determined according to the problem or the system (for example, If the student attends the class to some degree x, then he will be marked in the course to some degree y)
2.
Determine the fuzzy set that represents A in our production rule (for example, the attendance rate).
3.
Determine the fuzzy set that represents B in our production rule (for example, the final mark).
4.
Finally, the fuzzy set transformer (the production rule) will be obtained by applying the rule in Equation (4). None that the all the elements of Y are true, i.e., equal to 1 (Figure 2).

2.4. Make Use of the Production Rule (Implementing the FPM)

Finally, the result of stage 3 above (production rule) can be employed for developing new results. This can be performed by entering an input vector (fuzzy set) into the production rule—fuzzy rule transformer FTM. Then, the output will be the prediction result of using this model (FPM), as it is explained in the algorithm in Figure 5 and in the flowchart in Figure 6.

3. The Experiment

In this paper, we will conduct a real experiment at one of Saudi Arabia’s universities. In this experiment, we will use our FPM to predict the student performance based on students’ absenteeism, i.e., we want to examine the effect of absenteeism on student performance. We will be focusing on absenteeism because it is more difficult in our case of study to find a clear relation between student performance and absenteeism considering the following:
1.
Most of Saudi universities, including our case of study, have a regulation to eliminate students according to absenteeism. The regulation in our case study is to deprive any student from completing the course if he is absent more than or equal to 25% of the time, which means that only the students with attendance rate greater than 75% are allowed to complete the course. Accordingly, it will be more difficult to examine the effect of absenteeism on students’ performance especially since most of the data have a low rate of absenteeism.
2.
Another issue that makes the effect of absenteeism unclear is the availability of alternative online lectures or multimedia resources.

3.1. The Data Sets

In this paper, we will use a real data set from one of Saudi Arabia’s computer colleges. The data that will be used in this experiment reflect the performance of the students in one of the programming language courses (Table 2). The data represent students’ attendance rate and their final exam results in their programming language course during the fall semester of the academic year 2018–2020. The data are from two different sections, and each section has 20 students. One of the sections will be used as the training set (Section 1 in Table 2), and the other section will be used as the test set (Section 2 in Table 2).
To develop and test our proposed FPM in a more accurate way, we used the final exam marks only instead of using the total marks because, in our case of study, the total results (100%) are included with the other course marks such as quizzes, assignments, and lab work, which will be marked more biased to absentees than the final exam. In the discussion, Section 4, we will show how that is different.

3.1.1. The Fuzziness of the Student Performance Data (the Uncertainty)

The relationship between students’ results and absenteeism is difficult to be manipulated or measured by mathematical methods. For example, if we put this relation in the ‘if then’ rule (if the student attends the class, then he will pass the exam), we can see that this rule does not reflect the relationship between the degree of the attendance and the degree of passing the exam. Thus, the suitable rule in this case can be (if student attends the class to some degree, then he will pass the exam to some degree) which can be abbreviated as
If A (to some degree x), then B (to some degree y)
The rule now looks more equivalent to representing the relationship between the class attendance and exam results. However, if we apply this relation using deterministic or stochastic methods, we cannot obtain the correct output because of the following:
1.
The relation is uncertain, as there is no standard output for specific input where different students can obtain varieties of exam results even if they have the same attendance rate, and the opposite is also correct.
2.
It is difficult to represent the sets in this rule using the normal set because we need to represent the degree of elements’ belongingness (membership degree), not only the elements’ belongingness (membership).
Accordingly, the suitable way to deal with such a relation is using fuzzy logical concepts, as we proposed in Section 2.1. The fuzzy model of this relation based on our proposed FPM will be as follows:
  • Let A be the fuzzy set of degrees of the students’ attendance
  • Let B be the fuzzy set of students’ results in the final exam
  • Then, the relation will be: (A × B) ∪ (¬A × Y) (as explained in Section 2.1).

3.2. Building the Fuzzy Sets

1.
Building the attendance fuzzy set (A):
For part A of our rule, we will use attendance data. The fuzzy set of the attendance data can be the same as the normal set, because its values reflect the degree of membership where the largest values G19 and G20 = 1
A = {0.76, 0.76, 0.78, 0.82, 0.85, 0.87, 0.87, 0.87, 0.87, 0.89, 0.91, 0.92, 0.92, 0.96, 0.96, 0.96, 0.98, 0.98, 1, 1}
Not A (¬A) will = {0.24, 0.24, 0.22, 0.18, 0.15, 0.13, 0.13, 0.13, 0.13, 0.11, 0.09, 0.08, 0.08, 0.04, 0.04, 0.04, 0.02, 0.02, 0, 0}
2.
Building the final exam fuzzy set (B):
-
As shown in Table 2, the largest value of the final exam is G20 = 39
-
Then, the exam fuzzy set B = {15/39, 26/39, 11/39, 17/39, 26/39, 21/39, 36/39, 28/39, 28/39, 26/39, 29/39, 37/39, 35/39, 20/39, 29/39, 39/39, 21/39, 32/39, 36/39, 39/39},
i.e.,
B = {0.38, 0.67, 0.28, 0.44, 0.67, 0.54, 0.92, 0.72, 0.72, 0.67, 0.74, 0.95, 0.90, 0.51, 0.74, 1.00, 0.54, 0.82, 0.92, 1.00}
3.
Y = {1,1,1,1,1,1,1,1,1,1,1,1,1,1,1,1,1,1,1,1}.

3.3. The Fuzzy Set Transformer (the Production Rule)

The fuzzy set transformer (production rule) will be constructed by manipulating the above fuzzy sets (A and B) using our suggested logical if then rule (Equation (4)) (A × B) ∪ (¬A × Y) as follows:
0.76 0.76 0.78 0.82 0.85 0.87 0.87 . . 1   × 0.38 ,   0.67 ,   0.28 ,   0.44 ,   0.67 ,     1       0.24 0.24 0.22 0.18 0.15 0.13 0.13 . . 0 × 1 , 1 , 1 , 1 , 1 , 1 , 1 , 1 , 1
The matrix in Figure 7 represents the output of this operation (by performing the above formula). Based on propositional logical concepts, the operation that used to obtain this output is logical operation, where we used AND operation instead of mathematical multiplication operation, and OR operation instead of union or additional operation (see the algorithm in Figure 4). This matrix represents the fuzzy set transformer of our experiment, and it will be used as a production rule for predicting any future results or testing any scenario regarding student performance in such courses.

3.4. Testing the Model (FPM)

To test the FPM, we used Section 2 data as a test dataset (see Table 2) and then applied the algorithm that was mentioned in Section 2.4 (Figure 5) to predict the final exam result and compare it with the actual exam result, applying the mean squared error for evaluating our result (Table 3). Thus, according to our FPM, we preprocessed the test data to obtain the fuzzy sets as follows:
1.
Attendance rate Atest = {0.76, 0.8, 0.82, 0.84, 0.84, 0.84, 0.87, 0.91, 0.91, 0.91, 0.91, 0.91, 0.91, 0.91, 0.93, 0.93, 0.93, 0.93, 0.96}
2.
Then, by dividing each element by the 0.96 (the largest value G20), the fuzzy set of the attendance rate will be {0.79, 0.79, 0.83, 0.85, 0.88, 0.88, 0.88, 0.91, 0.95, 0.95, 0.95, 0.95, 0.95, 0.95, 0.97, 0.97, 0.97, 0.97, 0.97, 1}
3.
Final exam result = {12, 10, 15, 30, 20, 14, 32, 19, 11, 13, 14, 13, 22, 25, 19, 16, 19, 26, 16, 13}
4.
Then, by dividing each element by 32 (the largest value G7), the fuzzy set of the final exam will be {0.38, 0.31, 0.47, 0.94, 0.63, 0.44, 1, 0.59, 0.34, 0.41,0.44, 0.41, 0.69, 0.78, 0.59, 0.50, 0.59, 0.81, 0.50, 0.41}
Table 3 shows that FPM predicted the final exam with 0.062 MSR, which indicates that FPM is working well with such data. The next section provides more result discussions and comparison studies.

4. Result and Discussions

In this section, we will provide two ways for evaluating our FPM.

4.1. Compare FPM with an Equivalent Model

The suggested FPM works on a dataset with two sets of values and predicts a new value based on the relation between these pair of values, which makes it more equivalent to linear regression algorithm. As we mentioned in Section 2, the behavior of such systems is fuzzy rather than stochastic or deterministic; accordingly, in this section, we will compare FPM with a linear regression algorithm to prove this assumption. The following steps provide the comparison study for our FPM model with linear regression model:
1.
First, the final exam data are transferred to rate (100%) to fit the attendance rate.
2.
Second, building the linear regression model using formula in Equations (5) and (6). Table 4 presents this linear regression model:
y = b 0 + b 1   x
b 1 = 1 n x x y y 1 n x x 2
3.
Third, the regression model is tested using the same test data as shown in Table 5
4.
Finally, Table 5 shows that the linear regression model predicted the final exam with 0.076 MSR, which is greater than our suggested FPM model (0.062242). This indicates that our suggested FPM model gives better results than the learner regression model. In addition, the prediction of the single values in our suggested FPM model showed better results than linear regression (Figure 8 and Figure 9).

4.2. Applying FPM on Other Students’ Academic Performance Dataset

The data set that is used in our experiment has a low correlation factor between the absence rate and final exam. The correlation in training sets (between the two sets of the training sets) was 0.617811 and in the test sets was 0.040988, which means that FPM can work even if there is not a clear relation between the data features. This indicates that the fuzziness behavior (uncertainty) is fitting the system, as we mentioned in Section 3.1.1. Despite that, FPM is suitable for uncertainty behaviors, although it is also suitable for other behaviors. To prove that, let us examine FPM using data with the following characteristics:
1.
The data set is the same data set that we used in our experiment, but here, we will use the lab exam instead of absence rate as shown in Table 6.
2.
The correlation between the lab exam data and final exam data in the training data set is 0.942231 and on the test data set is 0.979643.
3.
Because the data represents the relation between the lab exam and the final exam, the logic rule will be the following:
  • if the student obtain marks in the lab exam to some degree x, then he will obtain marks in the final exam to some degree y.
For building FPM. we will follow the same steps that we mentioned in Section 2 with the same process that we have followed in our experiment in Section 3. The final FPM model and its results are presented in Figure 10 and Table 7.
Table 7 shows that FPM provided a better result when the relation between the data features is clearer (strong), which indicates that FPM works in a consistent manner.

4.3. Model Evalution

As it was mentioned in the above subsections, FPM worked well on both types of datasets and performed better in predicting academic performance than linear regression. Hence, it provided a better evaluation MSR factor and showed more details about how the predicted values are convergent to the original values, as shown in Figure 8 and Figure 9.
An overall evaluation to our suggested model (FPM) performance is presented in Table 8. As it is shown in Table 8, the performance evaluation of the model shows that the FPM performed well in predicting the students’ performance in regards to absence rate data (absenteeism), where it performed 0.115 in Mean Bias Error (MBE), −1.648 in Nash-Sutcliffe efficiency (NSE), and 0.249 in Root Mean Square Error (RMSE). Our suggested model (FPM) also showed good performance when it was tested in predicting the final exam marks using the lab exam. Hence, it performed 0.211 in Mean Bias Error (MBE), −2.24 in Nash-Sutcliffe efficiency (NSE), and 0.275 in Root Mean Square Error (RMSE).
To validate the effectiveness of our proposed model (FPM), we conducted a comparative study with a linear regression model (as we mentioned in Section 4.1). The comparison results showed that our proposed model provides better results than linear regression (as we explained above). However, to provide more evaluation of our suggested model (FPM), we presented in the Table 8 the results of [30], in which the authors worked on predicting the students’ marks. Their system consisted of multiple inputs and four outputs; their inputs are the student scores in 4 periods, their grades, and the number of fails besides the subject ID; their outputs are the predicted term values for periods 1 to 4 of the 11th grade. We also presented in Table 8 the results of [31], in which the authors used the variations in course grades among students based on course category, student course attendance rate, gender, high-school grade, school type, grade point average (GPA), and course delivery mode as input predictors. Their prediction results have been evaluated using RMSE, and they provided 8 values for RMSE based on input variables removed (their RMSE values are between 9.235 to 11.315). In conclusion, we can say that our comparative study demonstrated that our proposed model (FPM) outperforms the traditional linear regression model and the existing related works in terms of MSR, MBE, NSE, and RMSE. The results suggested that our model can provide more accurate predictions of student performance and can be a valuable tool for educators and administrators.

5. Conclusions

This paper contributes in four aspects:
1.
In the first aspect, this paper provided an investigative study that mostly covers the most recent research works on providing approaches, models, application, and/or evaluating studies for one or more of students’ academic performance issues. The investigative study reviewed 32 studies and concluded that these works provided 15 prediction models or approaches, 9 evaluation or analyses studies or models, 4 decision-making systems, and 3 classification models or approaches. Most of the fuzzy methods and techniques have been implemented over the investigated research works, with neuro fuzzy representing the most used method, where it has been used in nine works.
2.
In the second aspect, this paper proposed a novel fuzzy model for dealing with students’ academic performance behaviors. The proposed model integrated the concept of fuzzy sets with the concept of propositional logic. Although the proposed model uses propositional logic concepts, it differs from the fuzzy logic approach that has been used in pervious works such as [15,16,17,22,30,32], as it relies mainly on the fuzzy set concepts, where all data are presented in fuzzy sets, and all the operations are performed based on fuzzy set operations. The role of propositional logic in the approach is transforming the problem into an if-then rule and representing this rule propositionally to obtain FPM’s formula (Equation (4)). This way of incorporating the propositional logic with the fuzzy sets concept allows the model to provide a better representation of uncertainty and imprecision in the data with the capability of our model in providing interpretability by generating linguistic rules that can be easily understood by domain experts.
3.
In the third aspect, FPM was designed and built efficiently with low overhead for massively parallel computations.
4.
Finally, in the fourth aspect, the experiment and FPM evaluation were presented using a real data set. In this aspect, this paper achieved three aims: the first achieved aim is in applying FPM on absenteeism, which can be categorized as one of the critical issues in students’ academic performance, because there is no clear impact of it to students’ academic performance, especially in our case of study where the university has strong regulation against student absenteeism. The second achieved aim is in applying the linear regression model on students’ academic performance and comparing the results with FPM results. Finally, for the last achieved aim, this paper proves that the proposed model can work well even if there is no clear uncertainty behavior on the data, i.e., although FPM is a fuzzy model, it can also work on certain data.
As a final conclusion, FPM may provide advantages for all those concerned with students’ academic performance, such as the students, the teachers, and decision makers, where the model results can be useful for students in forecasting their performances based on what they got, can help teachers in evaluating their assessments methods or teaching methodology, and can help decision makers in making a decision based on examining new scenarios or the factors that may affect the students’ performance.

Author Contributions

Conceptualization, M.O.H. and B.A.; methodology M.O.H.; software, B.A.; validation, M.O.H., B.A. and K.S.; formal analysis, K.S.; investigation, K.S.; resources, K.S.; data curation, B.A.; writing—original draft preparation, B.A.; writing—review and editing, K.S.; visualization, K.S.; supervision, M.O.H.; project administration, M.O.H.; funding acquisition, M.O.H. All authors have read and agreed to the published version of the manuscript.

Funding

This research was funded by the Deputyship for Research & Innovation, Prince Sattam university, grant number (IF2/PSAU/2022/01/21649).

Institutional Review Board Statement

Not applicable.

Informed Consent Statement

Not applicable.

Data Availability Statement

Not applicable.

Acknowledgments

The authors extend their appreciation to the Deputyship for Research & Innovation, Ministry of Education in Saudi Arabia for funding this research work through the project number (IF2/PSAU/2022/01/21649).

Conflicts of Interest

The authors declare no conflict of interest.

References

  1. Zadeh, L.A. Fuzzy sets. Inf. Control 1965, 8, 338–353. [Google Scholar] [CrossRef]
  2. Peng, X.; Selvachandran, G. Pythagorean fuzzy set: State of the art and future directions. Artif. Intell. Rev. 2019, 52, 1873–1927. [Google Scholar] [CrossRef]
  3. Atanassov, K.T. On Intuitionistic Fuzzy Sets Theory; Springer: Berlin/Heidelberg, Germany, 2012; p. 283. [Google Scholar]
  4. Zadeh, L.A. Fuzzy logic. Computer 1988, 21, 83–93. [Google Scholar] [CrossRef]
  5. Bonissone, P.P. A Fuzzy Sets Based Linguistic Approach: Theory and Applications. In Proceedings of the IEEE 12th Conference on Winter Simulation, Orlando, FL, USA, 3–5 December 1980; pp. 99–111. [Google Scholar]
  6. Cornelis, C.; De Cock, M.; Radzikowska, A.M. Fuzzy rough sets: From theory into practice. In Handbook of Granular Computing; John Wiley & Sons: New York, NY, USA, 2008; pp. 533–552. [Google Scholar]
  7. Czogała, E.; Łęski, J. Fuzzy and Neuro-Fuzzy Intelligent Systems; Springer Science & Business Media: Berlin, Germany, 2000; Volume 47. [Google Scholar]
  8. Tizhoosh, H.R. Fuzzy image processing: Potentials and state of the art. IIZUKA 1998, 98, 16–20. [Google Scholar]
  9. Mamdani, E.H.; Assilian, S. An Experiment in Linguistic Synthesis with a Fuzzy Logic Controller. Int. J. Man Mach. Stud. 1975, 7, 1–13. [Google Scholar] [CrossRef]
  10. Brouwer, L.E.J.; Knuth, D.E. Propositional Logic. In Discrete Structures; Department of Computer Science and Engineering University at Buffalo: Getzville, NY, USA, 2023; pp. 7–33. [Google Scholar]
  11. Taylan, O.; Karagözoğlu, B. An adaptive neuro-fuzzy model for prediction of student’s academic performance. Comput. Ind. Eng. 2009, 57, 732–741. [Google Scholar] [CrossRef]
  12. Do, Q.H.; Chen, J.-F. A Neuro-Fuzzy Approach in the Classification of Students’ Academic Performance. Comput. Intell. Neurosci. 2013, 2013, 179097. [Google Scholar] [CrossRef]
  13. Ramírez-Coronel, A.A.; Montánchez-Torres, M.L.; Castro-Ochoa, F.L.; Torracchi-Carrasco, E.; Martínez-Suárez, P.C.; Cabrera-Mejía, J.B. Analysis of problem-based learning impact on academic performance according to the forgotten (Fuzzy) effects theory. Arch. Venez. Farmacol. Y Ter. 2020, 39, 651–661. [Google Scholar]
  14. Hamsa, H.; Indiradevi, S.; Kizhakkethottam, J.J. Student academic performance prediction model using decision tree and fuzzy genetic algorithm. Procedia Technol. 2016, 25, 326–332. [Google Scholar] [CrossRef]
  15. Yadav, R.S.; Soni, A.K.; Pal, S. A study of academic performance evaluation using Fuzzy Logic techniques. In Proceedings of the 2014 International Conference on Computing for Sustainable Global Development (INDIACom), New Delhi, India, 5–7 March 2014; pp. 48–53. [Google Scholar]
  16. Osman, Y.; Bal, A.; Gulsecen, S. Improved fuzzy modelling to predict the academic performance of distance education students. Int. Rev. Res. Open Distrib. Learn. 2013, 14, 144–165. [Google Scholar]
  17. Lasfeto, D.B.; Ulfa, S. Modeling of Online Learning Strategies Based on Fuzzy Expert Systems and Self-Directed Learning Readiness: The Effect on Learning Outcomes. J. Educ. Comput. Res. 2023, 60, 2081–2104. [Google Scholar] [CrossRef]
  18. Hidayah, A.E.P.; Ratwastuti, N. Student classification for academic performance prediction using neuro fuzzy in a conventional classroom. In Proceedings of the 2013 International Conference on Information Technology and Electrical Engineering (ICITEE), Yogyakarta, Indonesia, 7–8 October 2013; pp. 221–225. [Google Scholar]
  19. Nidhi, A.; Jatinder, K.R.S. A fuzzy probabilistic neural network for student’s academic performance prediction. Int. J. Innov. Res. Sci. Eng. Technol. 2013, 2, 4425–4432. [Google Scholar]
  20. Rasmani, K.A.; Shen, Q. Data-driven fuzzy rule generation and its application for student academic performance evaluation. Appl. Intell. 2006, 25, 305–319. [Google Scholar] [CrossRef]
  21. Ejegwa, P.A. Pythagorean fuzzy set and its application in career placements based on academic performance using max–min–max composition. Complex Intell. Syst. 2019, 5, 165–175. [Google Scholar] [CrossRef]
  22. Eryılmaz, M.; Adabashi, A. Development of an intelligent tutoring system using bayesian networks and fuzzy logic for a higher student academic performance. Appl. Sci. 2020, 10, 6638. [Google Scholar] [CrossRef]
  23. Li, Z.; Shang, C.; Shen, Q. Fuzzy-clustering embedded regression for predicting student academic performance. In Proceedings of the 2016 IEEE International Conference on Fuzzy Systems (FUZZ-IEEE), Vancouver, BC, Canada, 24–29 July 2016; IEEE: Piscataway, NJ, USA, 2016. [Google Scholar]
  24. Tsiakmaki, M.; Kostopoulos, G.; Kotsiantis, S.; Ragos, O. Fuzzy-based active learning for predicting student academic performance using autoML: A step-wise approach. J. Comput. High. Educ. 2021, 33, 635–667. [Google Scholar] [CrossRef]
  25. Musani, S.; Jemain, A.A. Ranking schools’ academic performance using a fuzzy VIKOR. In Journal of Physics: Conference Series; IOP Publishing: Bristol, UK, 2015; Volume 622. [Google Scholar]
  26. Chen, J.-F.; Do, Q.H. A cooperative cuckoo search–hierarchical adaptive neuro-fuzzy inference system approach for predicting student academic performance. J. Intell. Fuzzy Syst. 2014, 27, 2551–2561. [Google Scholar] [CrossRef]
  27. Petrudi, S.H.J.; Pirouz, M.; Pirouz, B. Application of fuzzy logic for performance evaluation of academic students. In Proceedings of the 2013 13th Iranian Conference on Fuzzy Systems (IFSC), Qazvin, Iran, 27–29 August 2013; IEEE: Piscataway, NJ, USA, 2013. [Google Scholar]
  28. Boongoen, T.; Shen, Q.; Price, C. Fuzzy qualitative link analysis for academic performance evaluation. Int. J. Uncertain. Fuzziness Knowl. Based Syst. 2011, 19, 559–585. [Google Scholar] [CrossRef]
  29. Yıldız, O.; Bal, A.; Gylseçen, S.; Kentli, F.D. A genetic-fuzzy based mathematical model to evaluate the distance education students’ academic performance. Procedia Soc. Behav. Sci. 2012, 55, 409–418. [Google Scholar] [CrossRef]
  30. Rojas, J.A.; Espitia, H.E.; Bejarano, L.A. Design and Optimization of a Fuzzy Logic System for Academic Performance Prediction. Symmetry 2021, 13, 133. [Google Scholar] [CrossRef]
  31. Naaj, M.A.; Mehdi, R.; Mohamed, E.A.; Nachouki, M. Analysis of the Factors Affecting Student Performance Using a Neuro-Fuzzy Approach. Educ. Sci. 2023, 13, 313. [Google Scholar] [CrossRef]
  32. Kavitha, R.K.; Jayakanthan, N.; Harishma, S. Predicting Students’ Outcomes with Respect to Trust, Perception, and Usefulness of Their Instructors in Academic Help Seeking Using Fuzzy Logic Approach. In Proceedings of the Advancements in Smart Computing and Information Security: First International Conference, ASCIS 2022, Rajkot, India, 24–26 November 2022; Revised Selected Papers, Part I; Springer Nature: Cham, Switzerland, 2023. [Google Scholar]
  33. Sevda, G.Y.; Körpeoğlu, S.G. Prediction of students’ perceptions of problem solving skills with a neuro-fuzzy model and hierarchical regression method: A quantitative study. Educ. Inf. Technol. 2023, 1–39. [Google Scholar]
  34. Mirasol-Cavero, D.B.; Ocampo, L. Fuzzy preference programming formulation in data envelopment analysis for university department evaluation. J. Model. Manag. 2023, 18, 212–238. [Google Scholar] [CrossRef]
  35. Doctor, F.; Iqbal, R. An intelligent framework for monitoring student performance using fuzzy rule-based Linguistic Summarisation. In Proceedings of the 2012 IEEE International Conference on Fuzzy Systems, Brisbane, QLD, Australia, 10–15 June 2012; pp. 1–8. [Google Scholar]
  36. Solano-Flores, G. Who is given tests in what language by whom, when, and where? The need for probabilistic views of language in the testing of English language learners. Educ. Res. 2008, 37, 189–199. [Google Scholar] [CrossRef]
  37. Wang, X.; Xu, Z.; Gou, X.; Xu, M. Distance and similarity measures for nested probabilistic-numerical linguistic term sets applied to evaluation of medical treatment. Int. J. Fuzzy Syst. 2019, 21, 1306–1329. [Google Scholar] [CrossRef]
  38. Fei, L.; Feng, Y. Modeling interactive multiattribute decision-making via probabilistic linguistic term set extended by Dempster–Shafer theory. Int. J. Fuzzy Syst. 2021, 23, 599–613. [Google Scholar] [CrossRef]
  39. Wang, X.; Xu, Z.; Wen, Q.; Li, H. A multidimensional decision with nested probabilistic linguistic term sets and its application in corporate investment. Econ. Res. Ekon. Istraživanja 2021, 34, 3382–3400. [Google Scholar] [CrossRef]
  40. Wang, X.; Xu, Z.; Gou, X. Nested probabilistic-numerical linguistic term sets in two-stage multi-attribute group decision making. Appl. Intell. 2019, 49, 2582–2602. [Google Scholar] [CrossRef]
  41. Liu, P.; Yang, X.; Hou, T.; Liu, Q.; Yang, D. Linguistic truth-valued fuzzy negation operator based on lattice implication algebra. Machine Learning, Multi Agent and Cyber Physical Systems. In Proceedings of the 15th International FLINS Conference (FLINS 2022), Tianjin, China, 26–28 August 2022. [Google Scholar]
  42. Savinov, A.A. Fuzzy propositional logic. Fuzzy Sets Syst. 1993, 60, 9–17. [Google Scholar] [CrossRef]
  43. Wang, X.; Xu, Z.; Gou, X. A novel plausible reasoning based on intuitionistic fuzzy propositional logic and its application in decision making. Fuzzy Optim. Decis. Mak. 2020, 19, 251–274. [Google Scholar] [CrossRef]
  44. Yamada, T. Wright’s Strict Finitistic Logic in the Classical Metatheory: The Propositional Case. J. Philos. Log. 2023, 1–20. [Google Scholar] [CrossRef]
Figure 1. The FPM framework.
Applsci 13 05140 g001
Figure 2. The graphical presentation of the logical rule.
Applsci 13 05140 g002
Figure 3. Building the fuzzy set’s algorithm.
Applsci 13 05140 g003
Figure 4. Constructing the production rule (FTM) algorithm.
Applsci 13 05140 g004
Figure 5. The prediction algorithm (make use of the model FPM).
Applsci 13 05140 g005
Figure 6. Flowchart presents how the model (FPM) predicts new results.
Applsci 13 05140 g006
Figure 7. The fuzzy set transformer matrix FTM (the production rule) for the main experiment.
Applsci 13 05140 g007
Figure 8. FPM result.
Applsci 13 05140 g008
Figure 9. Linear regression model result.
Applsci 13 05140 g009
Figure 10. The fuzzy set transformer FTM (the production rule) for the second experiment (Section 4.2).
Applsci 13 05140 g010
Table 2. The experiment data set.
No.Section 1 (Training Set)Section 1 (Test Set)
Attendance RateFinal Exam Out of 40Attendance RateFinal Exam Out of 40
10.76150.7612
20.76260.7610
30.78110.8015
40.82170.8230
50.85260.8420
60.87210.8414
70.87360.8432
80.87280.8719
90.87280.9111
100.89260.9113
110.91290.9114
120.92370.9113
130.92350.9122
140.96200.9125
150.96290.9119
160.96390.9316
170.98210.9319
180.98320.9326
191360.9316
201390.9613
Table 3. The result of testing the FPM (main experiment).
No.Tested Data Set
Actual Data (Real Data for Testing the FPM)
Expected Data Developed by the Proposed FPMEvaluation Results
(Mean Squared Error)
Attendance RateFinal Exam 100%Final Exam Fuzzy Set (Membership Degree)/32The Produced Fuzzy Set (Using Fuzzy Transformer)Expected Final Exam 100%Error Rate between Fuzzy SetsError Rate between Final Exam Mark and Expected Final Exam Mark Using this FPM
10.790.30.380.380.3040.0000.000
20.790.250.310.670.5360.1300.082
30.830.3750.470.280.2240.0360.023
40.850.750.940.440.3520.2500.158
50.880.50.630.670.5360.0020.001
60.880.350.440.540.4320.0100.007
70.880.810.920.7360.0060.004
80.910.4750.590.720.5760.0170.010
90.950.2750.340.720.5760.1440.091
100.950.3250.410.670.5360.0680.045
110.950.350.440.740.5920.0900.059
120.950.3250.410.950.760.2920.189
130.950.550.690.90.720.0440.029
140.950.6250.780.510.4080.0730.047
150.950.4750.590.740.5920.0230.014
160.970.40.50.970.7760.2210.141
170.970.4750.590.540.4320.0020.002
180.970.650.810.820.6560.0000.000
190.970.40.50.920.7360.1760.113
2010.3250.4110.80.3480.226
Mean squared error0.0965850.061985
Table 4. The linear regression model.
No.Attendance RateFinal Exam 100%Attendances − Mean (x − x ¯ )Final − Mean (y − y ¯ )(x − x ¯ ) (y − y ¯ )(x − x ¯ )2
10.760.375−0.1365−0.313750.0428270.018632
20.760.65−0.1365−0.038750.0052890.018632
30.780.275−0.1165−0.413750.0482020.013572
40.820.425−0.0765−0.263750.0201770.005852
50.850.65−0.0465−0.038750.0018020.002162
60.870.525−0.0265−0.163750.0043390.000702
70.870.9−0.02650.21125−0.00560.000702
80.870.7−0.02650.01125−0.00030.000702
90.870.7−0.02650.01125−0.00030.000702
100.890.65−0.0065−0.038750.0002520.000042
110.910.7250.01350.036250.0004890.000182
120.920.9250.02350.236250.0055520.000552
130.920.8750.02350.186250.0043770.000552
140.960.50.0635−0.18875−0.011990.004032
150.960.7250.06350.036250.0023020.004032
160.960.9750.06350.286250.0181770.004032
170.980.5250.0835−0.16375−0.013670.006972
180.980.80.08350.111250.0092890.006972
1910.90.10350.211250.0218640.010712
2010.9750.10350.286250.0296270.010712
Total0.1827130.110455
b1 = 1.65418
b0 = −0.79422
Table 5. The result of testing the linear regression model.
Attendance RateExpected Final Exam 100 %Actual Final Exam in the Tested Data 100%Mean Squared Error between Final Exam Mark and Expected Final Exam Mark Using This Model
0.760.4629540.30.026554
0.760.4629540.250.04535
0.80.5291220.3750.023753
0.820.5622050.750.035267
0.840.5952890.50.00908
0.840.5952890.350.060167
0.840.5952890.80.041907
0.870.6449140.4750.028871
0.910.7110810.2750.190167
0.910.7110810.3250.149059
0.910.7110810.350.13038
0.910.7110810.3250.149059
0.910.7110810.550.025947
0.910.7110810.6250.00741
0.910.7110810.4750.055734
0.930.7441650.40.11845
0.930.7441650.4750.07245
0.930.7441650.650.008867
0.930.7441650.40.11845
0.960.793790.3250.219764
Mean squared error (MSR)0.075834
Table 6. The data set of the second experiment (related data sets—Section 4.2).
No.Section 1 (Training Set)Section 1 (Test Set)
Lab Exam Out of 15Final Exam Out of 40Lab Exam Out of 15Final EXAM out of 40
1515512
21026410
3511515
46171330
5926920
6721514
715361532
81328819
91228511
101026513
111429514
121537513
1314351022
148201225
151429719
161539616
17721719
1814321226
191436616
201539413
Table 7. The results of testing FPM on related data sets—the second experiment (Section 4.2).
No.Test Data Set
Actual Data (Section 2 Data)
Predicted Data Developed by the Proposed FPMEvaluation Results
(Mean Squared Error)
Lab Exam Out of 15The Final Exam Out of 40Final Exam Fuzzy Set/32The Predicted Fuzzy SetThe Predicted Final ExamError Rate between Fuzzy SetsError Rate between Final Exam
14100.310.278.640.00181.8496
24130.410.278.640.018619.0096
35120.380.3310.560.00202.0736
45150.470.3310.560.019319.7136
55140.440.3310.560.011611.8336
65110.340.3310.560.00020.1936
75130.410.3310.560.00585.9536
85140.440.3310.560.011611.8336
95130.410.3310.560.00585.9536
106160.500.412.80.010010.2400
116160.500.412.80.010010.2400
127190.590.4715.040.015315.6816
137190.590.4715.040.015315.6816
148190.590.5316.960.00414.1616
159200.630.619.20.00060.6400
1610220.690.6721.440.00030.3136
1712250.780.825.60.00040.3600
1812260.810.825.60.00020.1600
1913300.940.8727.840.00464.6656
2015321.001320.00000.0000
Mean squared error (MSR)0.0068637.02792
Table 8. FPM evaluation and comparison.
ModelsMBENSERMSE
Our proposed model (FPM)—absenteeism data (First scenario)0.115−1.6480.249
Linear regression—absenteeism data (First scenario)0.211−2.240.275
Our proposed model (FPM)—lab exam data (Second scenario)−2.1740.8122.651
Linear regression—lab exam data (Second scenario)−1.8070.8832.331
The fuzzy logic system of [30] 7.4833
The neuro fuzzy model of [31] 9.287
Disclaimer/Publisher’s Note: The statements, opinions and data contained in all publications are solely those of the individual author(s) and contributor(s) and not of MDPI and/or the editor(s). MDPI and/or the editor(s) disclaim responsibility for any injury to people or property resulting from any ideas, methods, instructions or products referred to in the content.

