Article

Weld Defect Detection of a CMT Arc-Welded Aluminum Alloy Sheet Based on Arc Sound Signal Processing

1
School of Materials Science and Engineering, Dalian Jiaotong University, Dalian 116028, China
2
Liaoning Key Laboratory of Welding and Reliability of Rail Transportation Equipment, Dalian Jiaotong University, Dalian 116028, China
*
Author to whom correspondence should be addressed.
Appl. Sci. 2023, 13(8), 5152; https://doi.org/10.3390/app13085152
Submission received: 18 March 2023 / Revised: 12 April 2023 / Accepted: 18 April 2023 / Published: 20 April 2023
(This article belongs to the Section Applied Industrial Technologies)

Abstract

:
The cold metal transfer (CMT) process is widely used in thin plate welding because of its characteristics of low heat input and stable arc. In actual production, a larger weld gap, misalignment, or other problems due to assembly error lead to serious welding defects, such as burn-through and a lack of fusion. The arc sound contains a wealth of information related to the quality of the weld. This work analyzes the mechanism of CMT arc sound generation, as well as the correlation between the time–frequency spectrum of the arc sound signal and welding quality. This paper studies the extraction of the multi-channel time–frequency spectrum of an arc sound and inputs it to a custom convolutional neural network for the CMT welding defect identification of thin aluminum alloy plates. The experimental result shows that the average accuracy of the proposed model is 91.49% in the defect identification of a CMT arc-welded aluminum alloy sheet, which is higher than that of the single-channel time–frequency convolutional neural network and other traditional classification models.

1. Introduction

Aluminum alloys are widely used in rail vehicle, aerospace, and automobile manufacturing because of their high specific modulus, high specific strength, corrosion resistance, and good weldability [1,2]. For aluminum alloy sheets, due to the high thermal conductivity and low stiffness of the material, the traditional method of welding is prone to defects such as weld collapse and burn-through. CMT (cold metal transfer) is an improved short-circuit transition welding process based on MIG welding, which has a low heat input and no welding slag splash and is widely used in thin plate welding, additive manufacturing, dissimilar metal welding, weld cladding, etc. [3,4,5,6,7,8,9]. The CMT welding process can effectively reduce the probability of weld-through occurrence for thin aluminum alloy plate welding. However, in actual production, assembly errors lead to problems such as large or misaligned weld gaps, resulting in serious welding defects such as burn-through and a lack of fusion, especially for thin aluminum alloy plates. In the CMT automated welding process, the real-time monitoring of weld seam status and the automatic identification of defects can effectively improve welding productivity and are also key to controlling weld quality.
In the automated welding process, a wealth of information related to weld quality is acquired through sensing technology, including molten pool image signals [10,11,12], arc sound signals [13,14,15,16], and electrical signals [17,18]. Because the molten pool image can directly reflect the weld quality, its processing method is widely used in predicting penetration. However, the visual sensor is susceptible to arc light interference, which makes molten pool image acquisition and processing difficult, especially for aluminum alloy welding, because of its high reflectivity, which makes molten pool image acquisition and processing even more difficult. In addition, the size of vision sensors also limits their usage. The arc sound generated by welding contains rich information related to the welding process, and experienced welders can identify some abnormal weld problems using this sound [15]. Therefore, research on the relationship between the arc sound and melt-through is gradually receiving attention from a large number of scholars, and a significant amount of research has been conducted on the relationship between the arc sound and penetration states of the weld seam in the GTAW process [13,16]. However, the droplet transition form, protective gas type, and arc state of different processes are different, resulting in great differences in the arc sound generated during welding [19,20]. Liu et al. [21] researched the arc sound of CMT lap welding for low-carbon steel. Nevertheless, welding defect identification of aluminum alloy using the CMT arc sound is rarely reported, especially for thin aluminum alloy plates.
Machine learning models such as decision trees and neural networks are widely used for welding defect identification [10,22,23]. Speech recognition models such as STFT and MFCC are commonly used in the study of welding arc sound [16,21]. STFT is used in combination with neural networks for GTAW weld penetration state recognition and achieves good results [16,24]. However, STFT combined with a neural network model for CMT welding defect identification of thin aluminum alloy plates has rarely been reported.
In this work, the multi-channel time–frequency spectrum of the arc sound is extracted and input into a custom convolutional neural network to identify CMT welding defects in aluminum alloy thin plates. The remainder of the paper is organized as follows. Section 2 describes a method for defect identification using a custom convolutional network with a multi-channel time–frequency spectrum as the input. In Section 3, we present the experiment setup and attempt to design a CMT butt welding experiment, explain the mechanism of CMT arc sound signal generation, analyze the arc sound of welding defects, and compare the defect recognition accuracy of custom neural networks with a multi-channel time–frequency spectrum input. In Section 4, we analyze the time–frequency spectrum difference and compare it to that of other classification methods. Finally, Section 5 summarizes the main conclusions.

2. Materials and Methods

2.1. The Proposed Welding Defect Identification Method

The arc sound signal in the welding process is a non-stationary time series signal. Short-time Fourier transform (STFT) is an effective method for the time–frequency analysis of non-stationary signals [25]. STFT and differential operation can be used to transform 1D raw arc sound signals into a 3D multi-channel time–frequency spectrum, which contains static and dynamic characteristics of the sound. The multi-channel time–frequency spectrum of an arc sound contains a significant amount of information about weld quality, but it is difficult to extract features from the multi-channel time–frequency spectrum using traditional manual methods. Compared with traditional methods, the CNN (convolutional neural network) has adaptive feature extraction capability. Therefore, a CNN with a multi-channel time–frequency spectrum as the input was designed for CMT welding defect identification. The processing procedures of the welding defect identification method are listed below.
(1)
Arc sound signal is divided into sound segments, each with a sound length of 2742 points. The original dataset including different weld seam states is constructed.
(2)
Each sample in the original dataset is transformed using STFT to obtain the time–frequency spectrum dataset. STFT uses a Hanning window with a length of 255 and 205 overlap points.
(3)
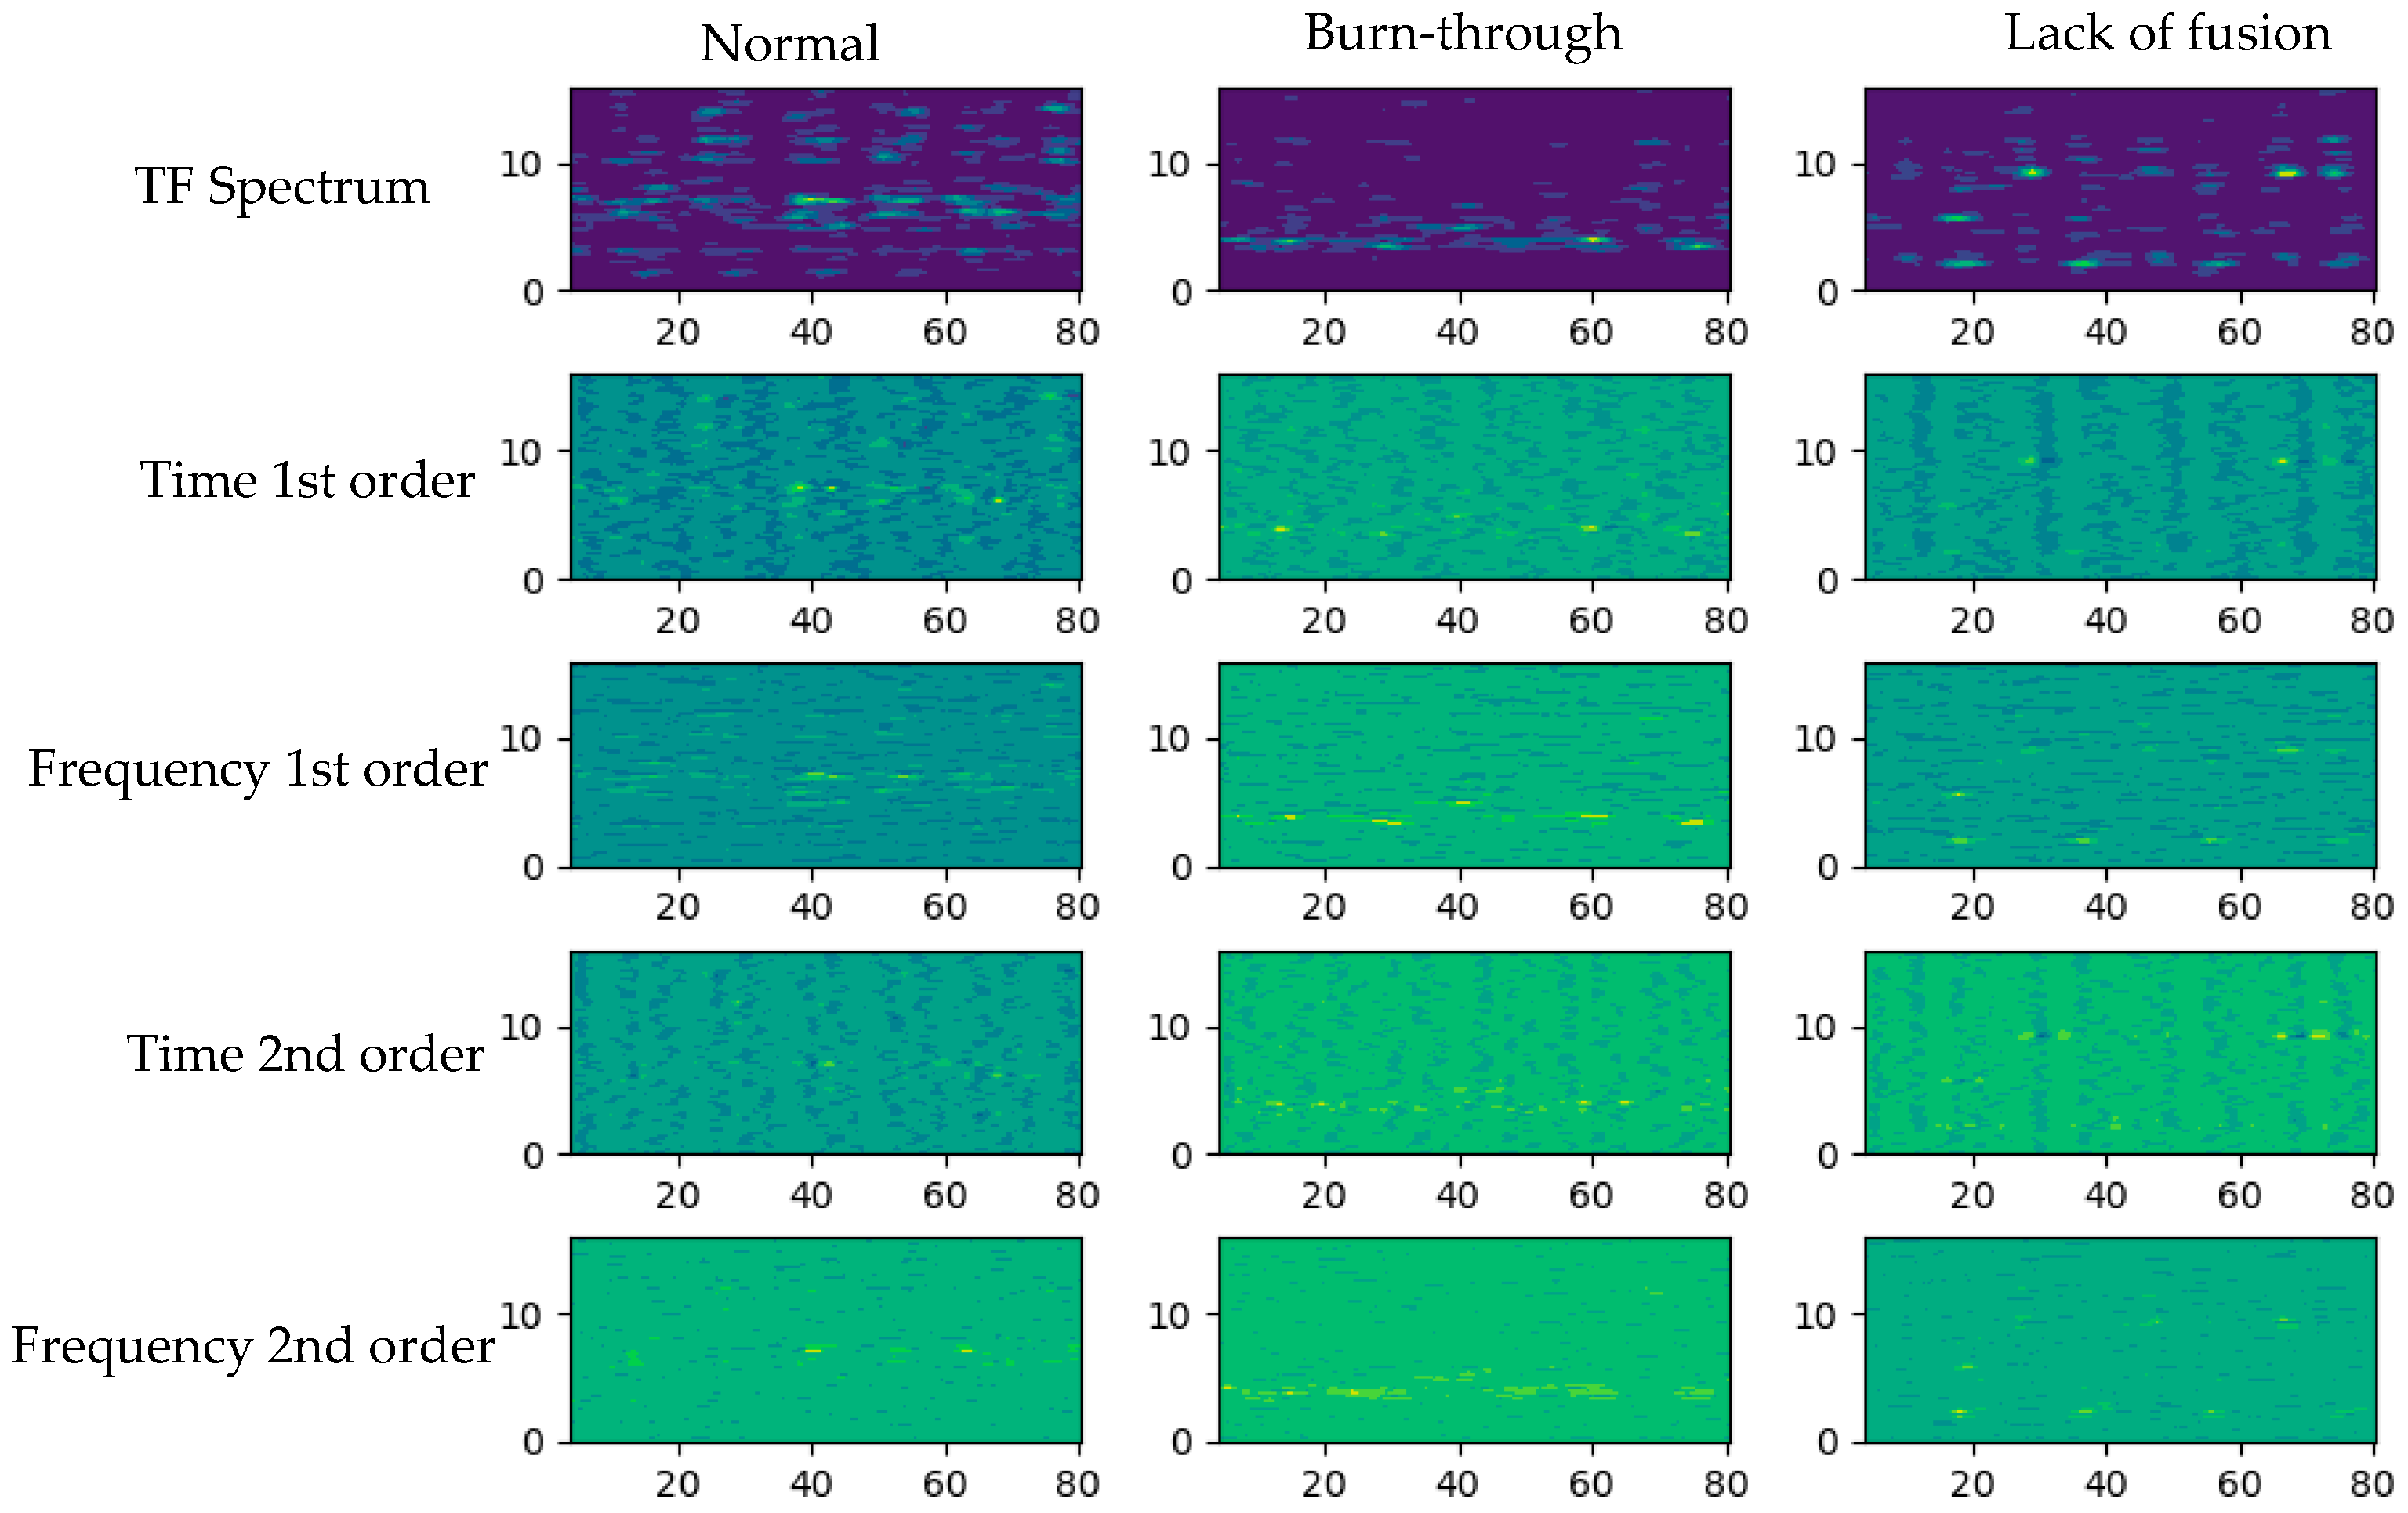
The samples in the time–frequency mapping dataset are computed using first-order difference and second-order difference operations, and the computed results are overlaid with the original time–frequency spectrum to compose a multi-channel time–frequency dataset.
(4)
The multi-channel time–frequency dataset is divided into a training set (70%) and a test set (30%). We can use the training set to input a custom convolutional neural network for multiple rounds of training, and then use the test set to test the trained model.

2.2. Multi-Channel Time–Frequency Spectrum of Arc Sound

STFT can be used to transform the arc sound into a time–frequency spectrum. Equation (1) represents the calculation of STFT.
X S T F T k , n = m L 1 x m + n × D w m e j 2 π L k m
where x(.) is the input signal, w(m) is the window function, L is the length of the window, x m + n × D w m denotes a short time frame of the input signal x(.), n is the time frame index, and k is the frequency index. Here, D denotes the hop length of window function, and the overlap length between adjacent frames is LD. Here,   X S T F T denotes the time–frequency spectrum of the input signal, x(.), and X S T F T k , n denotes the value of the k-th row and n-th column of the time–frequency spectrum.
Differential operations of the time–frequency spectrum along the time axis or frequency axis reveal the dynamic change in the sound signal with regard to time or frequency. Equations (2) and (3) define the first-order differential of the time–frequency spectrum along the time axis and frequency axis. Then, the second-order differential is obtained via the first-order differential of X f r e q 1 k , n along the time and frequency axis, as shown in Equations (4) and (5).
X t i m e 1 k , n = X S T F T k , n + 1 X S T F T k , n
X f r e q 1 k , n = X t i m e 1 k + 1 , n X t i m e 1 k , n
X t i m e 2 k , n = X f r e q 1 k , n + 1 X f r e q 1 k , n
X f r e q 2 k , n = X t i m e 2 k + 1 , n X t i m e 2 k , n
The multi-channel time–frequency spectrum is constructed by superimposing the results of the first-order differential or second-order differential. Table 1 describes how the multi-channel time–frequency map is formed.

2.3. Customized CNN Model

2.3.1. Convolutional Neural Networks

CNN is a kind of feedforward neural network. It consists of multiple layers, including the input layer, the convolutional layers, the pooling layers, the fully connected layers, and the output layer [26,27].
The convolutional layer is able to extract local features from feature maps of the previous layer by using learnable convolution kernels. The pooling layer uses downsampled input maps to reduce computation. The fully connected layer makes the final classification. The network learns the optimal filters through backpropagation and gradient descent.
Equation (6) defines the convolution operation of the convolutional layer.
x j l = f l i M j x i l 1 × w i , j l + b j l
where x j l represents the output of the j-th channel in the convolution layer (l), f l . denotes the activation function of the convolution layer, M j represents the feature map subset sampled by the sliding window in the feature map, and w i , j l and b j l , respectively, denote the convolution kernel of the convolution layer (l) and the bias of the feature map.

2.3.2. The Customized CNN Model

The customized CNN model is shown in Figure 1. The CNN model consists of three convolutional blocks and three fully connected layers. Each convolutional block includes a convolutional layer, a max pooling layer, and a batch normalization layer. The first convolutional layer uses 16 kernels (size: 3 × 3) to convolve with the n-channel time–frequency spectrum (size: 128 × 50), producing 16 feature maps (size: 128 × 50). The kernels’ stride was 1 pixel in both the horizontal and vertical directions. Similarly, the second convolutional layer produces 32 feature maps, and the third convolutional layer produces 32 feature maps. A pooling layer following each convolutional layer uses max-pooling function to reduce the dimensions of the feature maps. There is a batch normalization layer following each pooling layer. Finally, the fully connected layer is used for classification.

3. Experiment and Result

3.1. Automated Welding Data Acquisition System

Figure 2 shows the experimental setup of the welding experiment. The welding data acquisition system consists of a welding robot, a welding subsystem, and a signal acquisition subsystem. The welding subsystem consists of a Fronius TPS 600i welding power source, a wire feeder, a CMT welding torch, a welding table, and other accessories. In the welding process, the welding current and voltage are the main factors affecting the heat input, and their degree of adaptation to other parameters, such as welding speed, largely affects the quality of the weld. Due to assembly errors, the welding arc can become unstable, which in turn produces defects such as burn-through and a lack of fusion, which is reflected in the arc sound. Therefore, a multi-information acquisition subsystem was constructed for the current, voltage, and arc sound. The data acquisition subsystem consists of a signal acquisition card, sound sensor, and hall sensor. The frequency of the acquired signal is 32 kHz. The sound sensor converts the arc sound signal into an electric signal and transmits it to the signal acquisition card. The hall sensor collects the welding current and voltage signal and transmits them to the signal acquisition card. The signal acquisition card converts the arc sound signal, welding current signal, and welding voltage signal collected by the sensor into a digital signal. As described in Section 2.1, the arc sound signal is transformed into a multi-channel time–frequency map by STFT, and convolutional neural networks are used for feature extraction and defect identification.

3.2. Welding Experiment and Analysis

3.2.1. Experimental Scheme

A total of 6061 aluminum alloy sheets (size: 300 mm × 50 mm × 1 mm) were used for the welding experiment. The welding experiment used a direct-current (DC) CMT welding process. The shielding gas was 99.999% high-purity argon gas. The diameter of the ER5356 wire was 1.2 mm. Other welding parameters used in the experiment are shown in Table 2.
In order to simulate the welding assembly errors made in production, an aluminum-alloy-sheet butt joint form was designed, as shown in Figure 3. In Figure 3a, the weld gap changes from 0.5 mm to 1.3 mm along the welding direction. In Figure 3b, a weld gap of 0.5 mm remains unchanged, but the two workpieces show misalignment, with a value of misalignment of 0.5 mm. In Figure 3c, a change in the weld gap and misalignment of workpieces occur simultaneously.
Two experiments were carried out for each butt joint form in Figure 3. The arc sound, welding current, and arc voltage were collected synchronously during the welding experiments. During the welding process, the melt pool became larger due to a larger weld seam or misalignment, making it prone to burn-through or a lack of fusion. A lack of fusion and burn-through are very serious welding defects that can occur during production. Figure 4 shows the three weld states: normal, burn-through, and lack of fusion.

3.2.2. Time Domain Analysis of the Arc Sound Signal

Figure 5 presents the arc sound, welding current, and arc voltage signals that were collected simultaneously. As can be seen in the rising and falling edges of the peak current, the amplitude of the arc sound signal increases sharply, then decreases slowly and maintains a certain amplitude of vibration. Especially in the rising edge of the current, the arc sound signal performance is more violent. On the falling edge of the voltage signal trough, the amplitude of the arc sound signal increases and then decreases slowly. These effects can be explained by the CMT welding process combined with the sound generation mechanism.
Sound is a longitudinally propagating mechanical wave that is generated by the vibration of an object. The change in arc power is the source of excitation of the arc sound. The greater the instantaneous rate of change of the arc power, the greater the amplitude of the corresponding arc sound. The CMT welding process is characterized by alternate wire feed and retraction movements with the hot and cold processes being alternatively repeated [28]. A CMT cycle can be divided into three phases: peak current phase, background current phase, and short-circuiting phase [3], as shown in Figure 6. In the peak current phase, a high current pulse corresponding to a constant arc voltage ignites the welding arc and then heats the wire electrode to form a little liquid droplet on the wire tip. At the beginning of this phase, the arc power changes drastically. From the peak to the background phase, the arc power is decreased by the reducing current to inhibit the globular transfer, and the arc power changes are relatively large. In the short-circuiting phase, the arc voltage changes to zero, the arc energy is zero, and the arc is extinguished. At the same time, a reverse motion of the wire, liquid fracture, and transfer of the material into the welding pool occur. As arc short-circuiting occurs, the arc power changes less.
During the CMT welding process, the alternating changes in the arc power produce the arc sound. The reciprocating motion of the wire causes changes in arc length and shape, and the entry of the wire tip into the molten pool in the short-circuit phase causes vibrations and changes in the shape of the molten pool. All of these significantly affect the arc sound. Therefore, the arc sound signal contains richer information related to the quality of the weld.

3.2.3. Time–Frequency Analysis of the Arc Sound Signal

Figure 7 shows the time domain waveform, frequency spectrum, and time–frequency spectrum. The arc sound signal within the red rectangle in Figure 7a corresponds to one CMT cycle, where three sound pulse signals correspond to three power changes in one CMT cycle. After the sound pulses, the sound signal still maintains a certain amplitude of vibration, and this can be explained as the change in arc shape and length and melt pool vibration during the CMT cycle. In Figure 7b, it can be seen that the frequency band of the CMT arc sound is wide and contains complex frequency components. This also illustrates the complexity of the CMT welding process. As seen in Figure 7c, the time–frequency spectrum shows periodic variation in the time axis, corresponding to the period of the CMT, and the spectrum of each arc sound frame is shown on the frequency axis. The time–frequency spectrum contains both the frequency spectrum of each period’s arc sound and the changes in the frequency over time.
The arc sound signal of the GTAW welding process was analyzed in the literature [16]. The GTAW arc sound signal consists of a pulse phase and a random variable phase. The frequency amplitude of the pulse phase is more active and is mainly concentrated in the low-frequency part. In comparison with GTAW, the arc sound signal of the CMT welding process has a wider frequency domain and contains more complex frequency components.
Figure 8 shows the time–frequency spectrum of the three weld seam states. Figure 9 compares the average amplitude of the three arc sounds at different frequency bands. In Figure 8b, along the time axis in the 2~6 kHz bands, multiple peak amplitudes occur. In Figure 9, the frequency amplitude of burn-through state is larger than that of the normal and lack of fusion states in the 2~6 kHz bands. This is because the weld gap becomes larger, resulting in burn-through, a low-frequency sound, and burn-through discontinuity. The frequency amplitude of the lack-of-fusion state is lower than that of the normal and burn-through states in most frequency bands. Since the weld center is offset, the molten pool shape changes, and there is power leakage.

3.3. Defect Recognition

3.3.1. Building the Dataset

The arc sound signals for the three weld states were obtained according to the experimental scheme in Section 3.2.1. The arc sound signal collected at the head and tail of each welding experiment was clipped due to the instability of the arc at the head and tail. The cropped arc sound signal was divided into small segments. The length of each segment was calculated according to Equation (7).
L = c F s F C M T
where F s denotes the sampling frequency of the arc sound signal, F C M T denotes the frequency of the CMT arc, and c denotes the number of CMT cycles contained in a segment of the arc sound. In the experiment, F s is 32,000 Hz, F C M T is 70 Hz, and c is 6. The value of L is calculated as 2742. A segment of the arc sound signal contains more than enough information. The samples of the three different weld states were mixed sufficiently to finally obtain the original dataset containing 1810 samples.
Each sample in the original dataset is transformed to the time–frequency spectrum by STFT. The first-order differential and first-order differential of the time–frequency spectrums are computed by Equations (2)–(5). Finally, the datasets of the i-channel time–frequency spectrum (i-CTF dataset) are obtained as shown in the schemes of Table 1, including the 1-CTF dataset, 2-CTF dataset, 3-CTF dataset, 4-CTF dataset, and 5-CTF dataset. Each dataset was divided into a training set (70%) and a test set (30%). The proportion of samples with different welding states in the training and test sets was the same as that in the original dataset.

3.3.2. Comparison of Multi-Channel Time–Frequency CNN

The i-CTF dataset (i = 1, 2, 3, 4, and 5) was used to obtain the inputs of the customized CNN model, as shown in Figure 1, for training and testing the model. The training and testing model was used 10 times for each dataset. Each training and testing process had 40 epochs, and the learning rate was that shown in Equation (8).
l r = l r i n i t α e p o c h s t e p
where l r denotes the learning rate, l r i n i t is the initial learning rate, α denotes the decay coefficient of the learning rate, and the range is [0, 1]. step indicates the step of the learning rate. In this study, α is 0.9, and step is 10.
Table 3 compares the average test accuracy of the different datasets. It is apparent from this table that the average accuracy of the multi-channel dataset is higher than that of the single-channel dataset, and that the average accuracy of the four-channel dataset is highest. This result is due to the multi-channel dataset containing both static and dynamic features of the time–frequency spectrum.

4. Discussion

4.1. Analysis of Time–Frequency Spectrum Difference

Three samples of different types were randomly selected from the original dataset, and the first-order differential and second-order differential of the three samples were calculated along the time axis and frequency axis, respectively; the results are shown in Figure 10. Subfigures in the same column are the time–frequency spectrum of the arc sound and its first-order differential spectrum and second-order differential spectrum. In Figure 10, the differential spectrum shows the dynamic change in frequencies along the time and frequency axes, and the distribution of the main frequencies in the original time–frequency spectrum can be clearly seen in the differential spectrum. Therefore, the multi-channel time–frequency spectrum, which is superimposed on its differential spectrum, contains a wealth of information. This also explains the higher classification accuracy of the multi-pass time–frequency CNN compared to the single-channel network. However, the accuracy of the 5-CTF CNN decreases, which can be explained by the similarity of the differential spectrums of different weld states, which reduce the classification ability.

4.2. Comparison to Other Classification Methods

Three traditional classification methods that use manually extracted features as inputs were used for comparison with the method proposed in this paper. These traditional methods are the ID3 decision tree, support vector machine (SVM), and backpropagation neural network (BPNN). First, 22 statistical features were calculated from the original dataset of the arc sound segment, including 14 time domain statistical features, as shown in Table 4, and the average energy of 8 bands, 0~2 kHz, 2~4 kHz, 4~6 kHz, 6~8 kHz, 8~12 kHz, 12~14 kHz, and 14~16 kHz. The construction process of each vector consisting of statistical features is shown in Figure 11. Then, the statistical feature dataset of the arc sound segment was divided into a training set (70%) and a test set (30%), and the constructed SVM, BPNN, and ID3 decision tree models were trained and tested.
Ten training tests were conducted separately for each classification method. Figure 12 compares the accuracy of each test for different classification methods, where SVM-linear is an SVM model with a linear function kernel, SVM-RBF is an SVM model with a radial basis function kernel, BPNN-1 is a BPNN with one hidden layer, and BPNN-2 is a BPNN with two hidden layers. The classification accuracies of all methods fluctuate slightly. The classification accuracies of BPNN-1 and BPNN-2 are very low, at only about 45~60%. The accuracies of SVM-linear, SVM-RBF and ID3 decision tree are better than the accuracies of BPNN-1 and BPNN-2, at about 65~75%. In comparison, the classification accuracy of the 1-CTF CNN and 4-CTF CNN are dominant, high, and stable, at about 90%. The satisfying results indicate that more information in the time and frequency domain is contained in the time–frequency spectrum than in the manually extracted features, and that the features adaptively extracted by the multi-channel time–frequency CNN are more informative than the features extracted manually.

5. Conclusions

This paper researches the problem of identifying defects, mainly burn-through and a lack of fusion, in thin-aluminum-alloy-sheet CMT butt welding based on arc sound signals. The mechanism of CMT arc sound generation is analyzed, as well as its relationship with welding defects. A multi-channel time–frequency convolutional neural network based on an arc sound was constructed to identify the defects of lack of fusion and burn-through in thin aluminum alloy sheet CMT butt welding. This paper also compares the proposed identification method with methods such as SVM, BPNN and ID3, and obtained the following conclusions.
(1)
The CMT arc sound is a timing signal with a highly correlated change in CMT arc energy. The arc energy changes three times during the hot and cold processes alternating in a CMT cycle. Each time the arc energy changes, peak arc sound pulse is produced. With these pulses, the arc sound changes dramatically at the beginning of the peak current.
(2)
For aluminum alloy thin-plate CMT butt welding defect recognition, especially of the burn-through and lack of fusion defects of thin plates, the multi-channel time–frequency CNN has higher recognition accuracy than does the single-channel time–frequency CNN.
(3)
The proposed method has better feature extraction capability and higher defect recognition accuracy compared with the traditional classification methods such as SVM, BPNN and ID3 that use manually extracted features as inputs.

Author Contributions

G.Y. and X.Y. proposed the idea and were the main contributors involved in writing the manuscript; K.G. and L.Z. provided technical support for the application and training of the algorithms involved in the model; Y.S. developed a welding data acquisition software; X.Y. developed a feasible experimental protocol and reviewed the manuscript. All authors have read and agreed to the published version of the manuscript.

Funding

This study was supported by the National Natural Science Foundation of China (grant numbers 51875072 and 52005071), the Foundation for Overseas Talents Training Project in Liaoning Colleges and Universities (grant number 2018LNGXGJWPY-YB012), and the Foundation Scientific Research Project in Liaoning Provincial Education Department (grant number LJKMZ20220844).

Institutional Review Board Statement

Not applicable.

Informed Consent Statement

Not applicable.

Data Availability Statement

The data involved in this study are available upon reasonable request from the corresponding author.

Conflicts of Interest

The authors declare no conflict of interest.

References

  1. Li, Y.; Zou, W.; Lee, B.; Babkin, A.; Chang, Y. Research progress of aluminum alloy welding technology. Int. J. Adv. Manuf. Technol. 2020, 109, 1207–1218. [Google Scholar] [CrossRef]
  2. Zhou, B.; Liu, B.; Zhang, S. The advancement of 7xxx series aluminum alloys for aircraft structures: A review. Metals 2021, 11, 718. [Google Scholar] [CrossRef]
  3. Selvi, S.; Vishvaksenan, A.; Rajasekar, E. Cold metal transfer (CMT) technology—An overview. Def. Technol. 2017, 14, 28–44. [Google Scholar] [CrossRef]
  4. Feng, J.; Zhang, H.; He, P. The CMT short-circuiting metal transfer process and its use in thin aluminium sheets welding. Mater. Des. 2009, 30, 1850–1852. [Google Scholar] [CrossRef]
  5. Cao, R.; Feng, Z.; Chen, J.H. Microstructures and properties of titanium—Copper lap welded joints by cold metal transfer technology. Mater. Des. 2014, 53, 192–201. [Google Scholar] [CrossRef]
  6. Wu, W.; Xu, W.; Xue, J.; Yao, P. Effect of cooling and CMT mode process on additive manufacturing. Mater. Manuf. Process. 2022, 37, 1298–1309. [Google Scholar] [CrossRef]
  7. Ünel, E.; Taban, E. Properties and optimization of dissimilar aluminum steel CMT welds. Weld. World 2017, 61, 1–9. [Google Scholar] [CrossRef]
  8. Stanciu, E.M.; Pascu, A.; Gheorghiu, I. CMT Welding of Low Carbon Steel Thin Sheets. IOP Conf. Ser. Mater. Sci. Eng. 2017, 209, 012051. [Google Scholar] [CrossRef]
  9. Kołodziejczak, P.; Bober, M.; Chmielewski, T. Wear Resistance Comparison Research of High-Alloy Protective Coatings for Power Industry Prepared by Means of CMT Cladding. Appl. Sci. 2022, 12, 4568. [Google Scholar] [CrossRef]
  10. Chao, C.; Na, L.; Shanben, C. Welding penetration monitoring for pulsed GTAW using visual sensor based on AAM and random forests. J. Manuf. Process. 2021, 63, 152–162. [Google Scholar] [CrossRef]
  11. Liu, Y.K.; Zhang, Y.M. Control of 3D weld pool surface. Control Eng. Pract. 2013, 21, 1469–1480. [Google Scholar] [CrossRef]
  12. Wang, Z.; Chen, H.; Zhong, Q.; Lin, S.; Wu, J.; Xu, M.; Zhang, Q. Recognition of penetration state in GTAW based on vision transformer using weld pool image. Int. J. Adv. Manuf. Technol. 2022, 119, 5439–5452. [Google Scholar] [CrossRef]
  13. Lv, N.; Xu, Y.; Zhang, Z.; Wang, J.; Chen, B.; Chen, S. Audio sensing and modeling of arc dynamic characteristic during pulsed Al alloy GTAW process. Sens. Rev. 2013, 32, 375–385. [Google Scholar] [CrossRef]
  14. Lv, N.; Xu, Y.L.; Li, S.C.; Chen, S.B. Automated control of welding penetration based on audio sensing technology. J. Mater. Process. Technol. 2017, 2017, 81–98. [Google Scholar] [CrossRef]
  15. Gao, Y.; Zhao, J.; Wang, Q.; Xiao, J.; Zhang, H. Weld bead penetration identification based on human-welder subjective assessment on welding arc sound. Meas. J. Int. Meas. Confed. 2020, 154, 107475. [Google Scholar] [CrossRef]
  16. Ren, W.; Wen, G.; Xu, B.; Zhang, Z. A Novel Convolutional Neural Network Based on Time-Frequency Spectrogram of Arc Sound and Its Application on GTAW Penetration Classification. IEEE Trans. Ind. Inform. 2021, 17, 809–819. [Google Scholar] [CrossRef]
  17. Cui, Y.; Shi, Y.; Hong, X. Analysis of the frequency features of arc voltage and its application to the recognition of welding penetration in K-TIG welding. J. Manuf. Process. 2019, 46, 225–233. [Google Scholar] [CrossRef]
  18. Shiqi, Z.; Shengsun, H.; Zhijiang, W. Weld penetration sensing in pulsed gas tungsten arc welding based on arc voltage. J. Mater. Process. Technol. 2016, 229, 520–527. [Google Scholar]
  19. Wang, Q.; Gao, Y.; Huang, L.; Gong, Y.; Xiao, J. Weld bead penetration state recognition in GMAW process based on a central auditory perception model. Measurement 2019, 147, 106901. [Google Scholar] [CrossRef]
  20. Gao, Y.; Wang, Q.; Xiao, J.; Zhang, H. Penetration state identification of lap joints in gas tungsten arc welding process based on two channel arc sounds. J. Mater. Process. Technol. 2020, 285, 116762. [Google Scholar] [CrossRef]
  21. Liu, L.; Chen, H.; Chen, S. Quality analysis of CMT lap welding based on welding electronic parameters and welding sound. J. Manuf. Process. 2022, 74, 55. [Google Scholar] [CrossRef]
  22. Tran, N.-H.; Bui, V.-H.; Hoang, V.-T. Development of an Artificial Intelligence-Based System for Predicting Weld Bead Geometry. Appl. Sci. 2023, 13, 4232. [Google Scholar] [CrossRef]
  23. Cheepu, M. Machine Learning Approach for the Prediction of Defect Characteristics in Wire Arc Additive Manufacturing. Trans. Indian Inst. Met. 2023, 76, 447–455. [Google Scholar] [CrossRef]
  24. Zhao, Z.; Lv, N.; Xiao, R.; Liu, Q.; Chen, S. Recognition of penetration states based on arc sound of interest using VGG-SE network during pulsed GTAW process. J. Manuf. Process. 2023, 87, 81–96. [Google Scholar] [CrossRef]
  25. Jeon, H.; Jung, Y.; Lee, S.; Jung, Y. Area-Efficient Short-Time Fourier Transform Processor for Time–Frequency Analysis of Non-Stationary Signals. Appl. Sci. 2020, 10, 1–10. [Google Scholar] [CrossRef]
  26. Cong, S.; Zhou, Y. A review of convolutional neural network architectures and their optimizations. Artif. Intell. Rev. 2022, 56, 1905–1969. [Google Scholar] [CrossRef]
  27. Li, Z.; Liu, F.; Yang, W.; Peng, S.; Zhou, J. A Survey of Convolutional Neural Networks: Analysis, Applications, and Prospects. IEEE Trans. Neural Netw. Learn. Syst. 2022, 33, 6999–7019. [Google Scholar] [CrossRef]
  28. Pang, J.; Hu, S.; Shen, J.; Wang, P.; Liang, Y. Arc characteristics and metal transfer behavior of CMT + P welding process. J. Mater. Process. Technol. 2016, 238, 212–217. [Google Scholar] [CrossRef]
Figure 1. Multi-channel time–frequency convolutional neural network.
Applsci 13 05152 g001
Figure 2. Experimental setup.
Applsci 13 05152 g002
Figure 3. Workpiece joint forms. (a) Variable gap. (b) Misalignment. (c) Variable gap and misalignment.
Applsci 13 05152 g003
Figure 4. Weld seam states.
Applsci 13 05152 g004
Figure 5. CMT arc sound, current, and voltage.
Applsci 13 05152 g005
Figure 6. CMT cycle.
Applsci 13 05152 g006
Figure 7. Time domain waveform, frequency spectrum, and time–frequency spectrum of arc sound. (a) Arc sound. (b) Frequency spectrum of arc sound. (c) Time-frequency spectrum of arc sound.
Applsci 13 05152 g007
Figure 8. Time–frequency spectrum of different welding states. (a) Normal. (b) Burn-through. (c) Lack of fusion.
Applsci 13 05152 g008
Figure 9. Time–frequency spectrum of different welding states.
Applsci 13 05152 g009
Figure 10. Time–frequency spectrum of different welding states and the difference.
Applsci 13 05152 g010
Figure 11. Statistical feature vector construction process.
Applsci 13 05152 g011
Figure 12. Defect recognition result of seven models.
Applsci 13 05152 g012
Table 1. Multi-channel time–frequency map composition.
ChannelsComposition
1 channel X S T F T
2 channels X S T F T    1   X t i m e 1
3 channels X S T F T     X t i m e 1 X f r e q 1
4 channels X S T F T     X t i m e 1 X f r e q 1   X t i m e 2
5 channels X S T F T     X t i m e 1 X f r e q 1   X t i m e 2 X f r e q 2
1  denotes overlay of two maps.
Table 2. Welding experiment parameters.
Welding ParametersValue
Welding current53 A
Welding voltage11.1 V
Welding speed60 cm/min
Wire speed3.5 m/min
Shielding gas flow15 mL/min
Table 3. Average test accuracy of different datasets.
Dataset1-CTF 2-CTF3-CTF4-CTF5-CTF
Average accuracy (%)88.8190.6790.3991.4989.66
Standard deviation0.01040.01070.00940.01040.0128
Table 4. Time domain statistical features equations.
No.FeatureEquationNo.FeatureEquation
1Mean μ = 1 n i = 1 n x i 8Root-Mean Square x r m s = i = 1 n x i 2 n
2Mean
amplitude
x a r v = 1 n i = 1 n x i 9Skewness x s = 1 n i = 1 n x i μ σ 3
3Peak x p = max 1 i n x i 10Kurtosis x k = 1 n i = 1 n x i μ σ 4
4Peak–Peak x p p = max 1 i n x i min 1 i n x i 11Kurtosis factor x p x r m s
5Energy x e = 1 n i = 1 n x i 2 12Pulse factor x p x a r v
6Standard
deviation
σ = 1 n 1 i = 1 n x i μ 2 13Margin factor x p 1 n   i = 1 n x i 2
7Variance σ 2 14Waveform factor x r m s x a r v
Disclaimer/Publisher’s Note: The statements, opinions and data contained in all publications are solely those of the individual author(s) and contributor(s) and not of MDPI and/or the editor(s). MDPI and/or the editor(s) disclaim responsibility for any injury to people or property resulting from any ideas, methods, instructions or products referred to in the content.

