Abstract
The quality inspection of solder joints on aviation plugs is extremely important in modern manufacturing industries. However, this task is still mostly performed by skilled workers after welding operations, posing the problems of subjective judgment and low efficiency. To address these issues, an accurate and automated detection system using fine-tuned YOLOv5 models is developed in this paper. Firstly, we design an intelligent image acquisition system to obtain the high-resolution image of each solder joint automatically. Then, a two-phase approach is proposed for fast and accurate weld quality detection. In the first phase, a fine-tuned YOLOv5 model is applied to extract the region of interest (ROI), i.e., the row of solder joints to be inspected, within the whole image. With the sliding platform, the ROI is automatically moved to the center of the image to enhance its imaging clarity. Subsequently, another fine-tuned YOLOv5 model takes this adjusted ROI as input and realizes quality assessment. Finally, a concise and easy-to-use GUI has been designed and deployed in real production lines. Experimental results in the actual production line show that the proposed method can achieve a detection accuracy of more than 97.5% with a detection speed of about 0.1 s, which meets the needs of actual production
1. Introduction
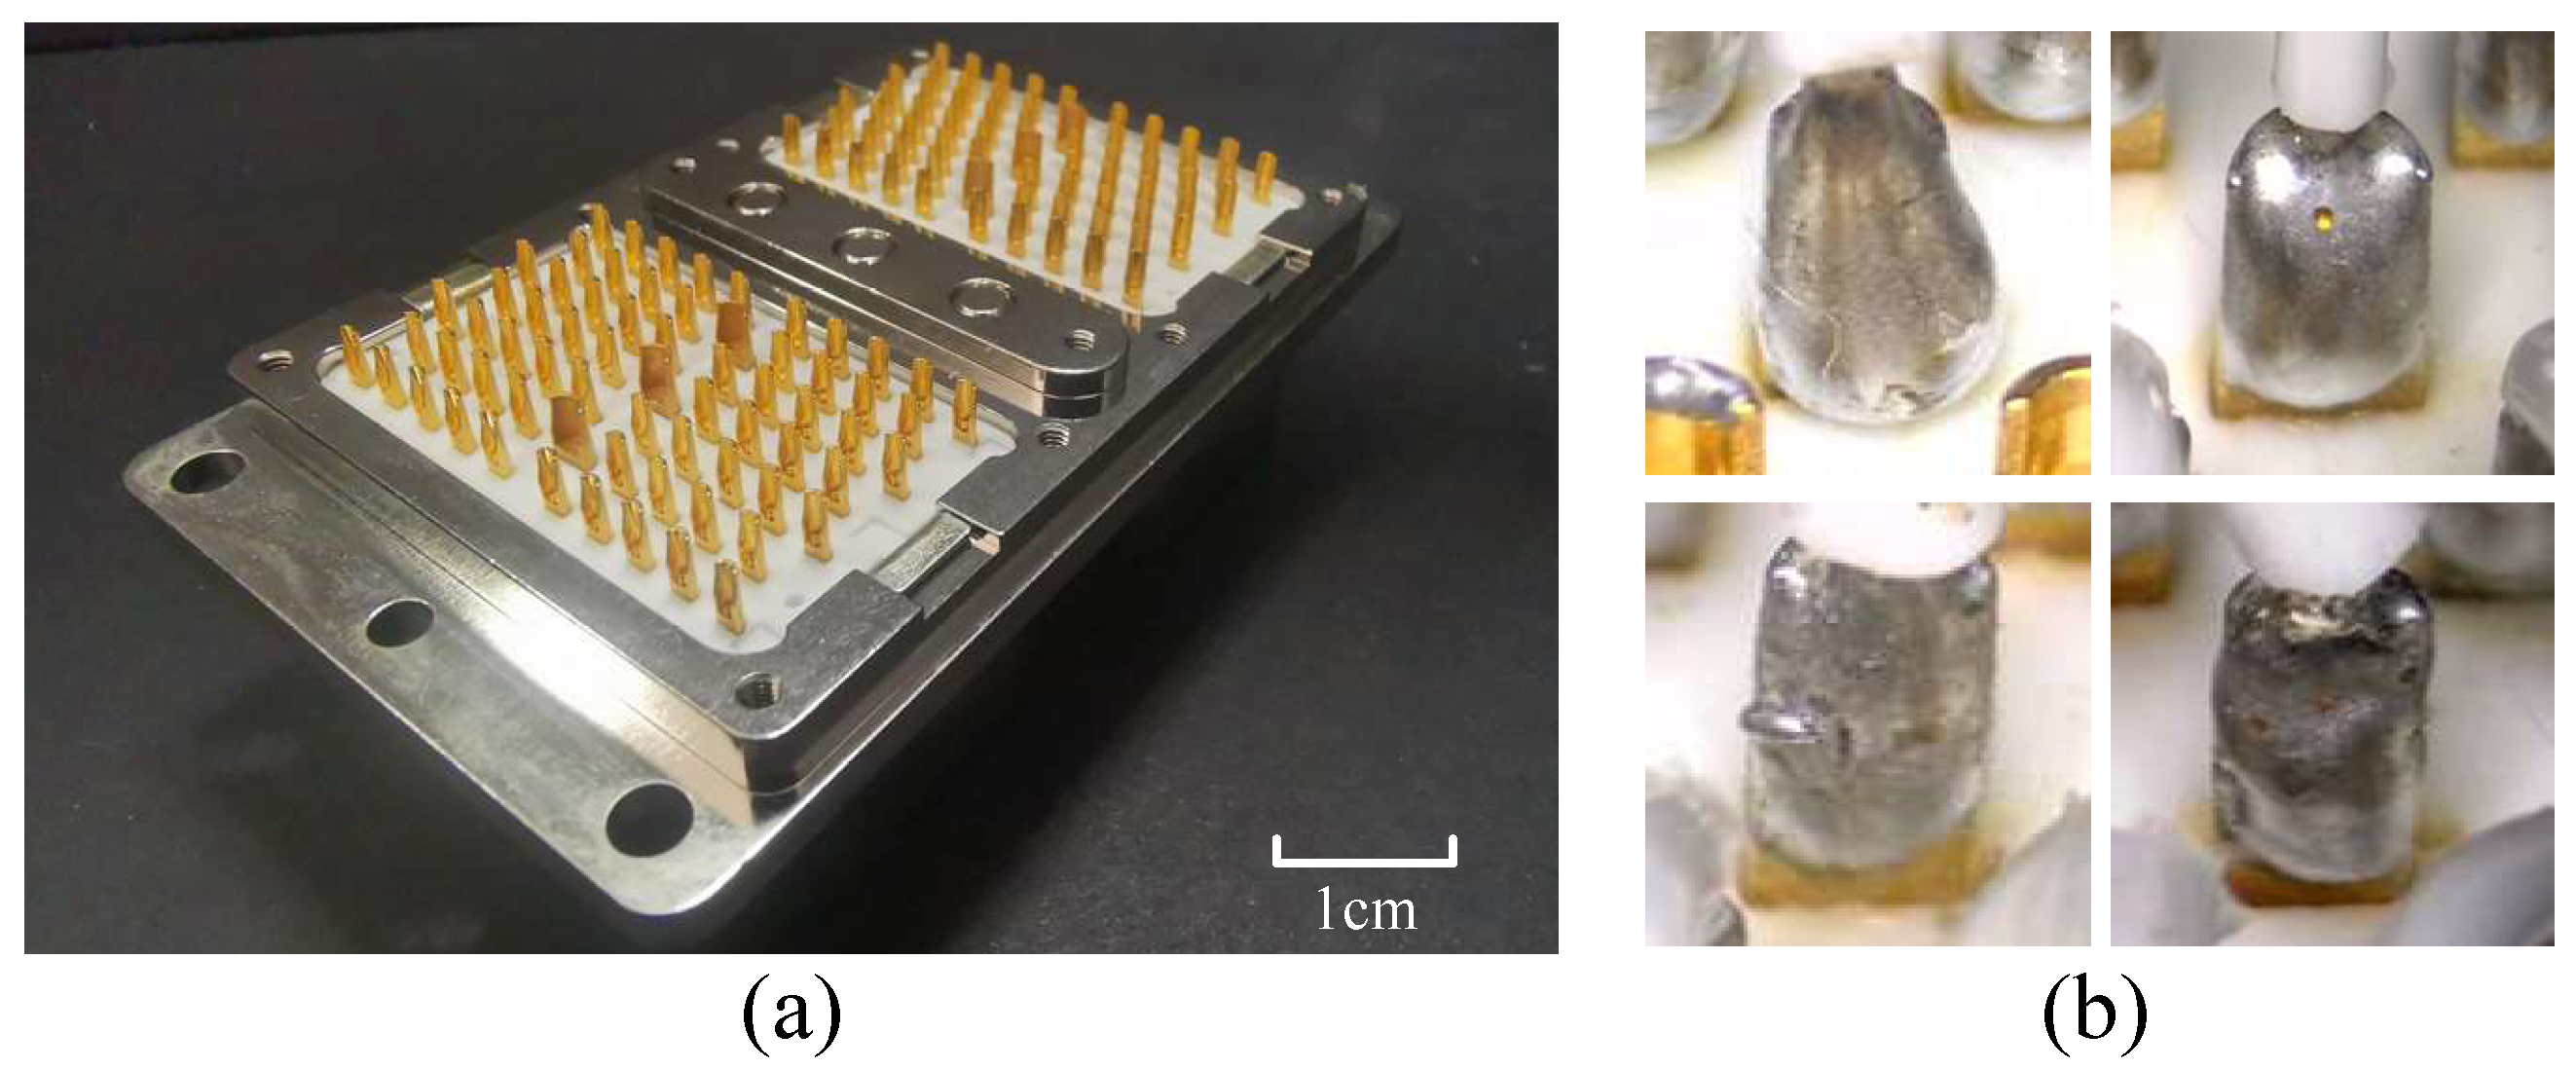
Aviation plugs shown in Figure 1a are important electromechanical components in a variety of modern electronic equipment. While the welding failures of solder joints inside them will directly affect their conduction performance and then damage the reliability of the circuit [1,2]. Therefore, quality inspection of solder joints on aviation plugs has become a necessary and essential process. Currently, this task still relies heavily on manual visual inspection after welding, which suffers from the problems of low efficiency and low accuracy. In addition, it is susceptible to producing inconstant and unreliable detection results due to subjective evaluation. Recently, to reduce manual intervention and increase inspection accuracy and efficiency, a number of machine vision-based methods have been used in several specific industrial scenarios and have delivered impressive results. Despite that, due to the special structure of the aviation plugs studied in this paper, an automated system for detecting solder joints on them has not yet been developed. Thus, it is becoming increasingly urgent to develop an accurate and automated inspection system specifically for inspecting solder joints on aviation plugs.
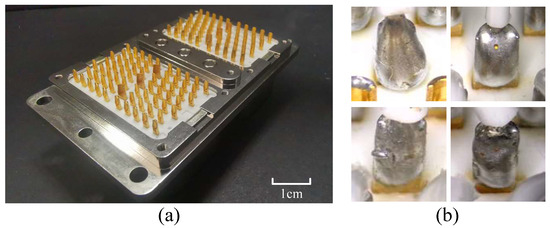
Figure 1.
The example of (a) aviation plug and (b) defects of solder joints.
Throughout modern non-destructive testing technology, the approaches for weld inspection can be divided into ultrasonic testing [3,4,5], magnetic particle testing [6,7], X-rays testing [8,9], and optical testing [10,11,12], etc. Since optical detection methods have low requirements for the material being tested and the ability to monitor each product sustainably, they are gradually becoming the preferred choice in the industry. The mainstream is to take a photo of the regions to be examined by cameras and make estimates using some image recognition algorithms. Earlier algorithms generally used some traditional image processing technologies, which required pre-processing of the captured images firstly, typically including image normalization [12], filtering [13], enhancement [14,15], and so on. Afterward, the pre-processed images are subjected to localization and segmentation operations, such as template matching [14,16], thresholding [5,17], or edge-based segmentation [18,19], and then some algorithmic rules are designed using human experience, such as shape, area, greyscale, texture, etc. to characterize the target features. Finally, some common classification algorithms are adopted for quality assessment. For example, Cai et al. [20] proposed a new automated optical inspection algorithm based on a Gaussian mixture model to inspect the solder joints of integrated circuits. Some researchers [21,22] have also tried the use of a support vector machine for the classification of solder joints. In recent years, robust principal component analysis has been introduced into various defect detection tasks [23,24] and achieved impressive results. However, as illustrated in Figure 1b, typical defects of solder joints on aviation plugs have an extremely similar appearance to normal solder joints. Therefore, it is difficult to distinguish them using only handcrafted low-level features. Meanwhile, the above methods are usually not fast enough for real-time online inspection. In general, although the above traditional methods using handcrafted features perform well in some simple tasks, they suffer from low accuracy and low robustness due to the limited feature representation capability.
In recent years, deep convolutional neural networks (CNNs) have attracted significant attention in various anomaly detection tasks [25,26,27,28], particularly in image data [29,30,31], since they are capable of automatically learning the features with robust and generalized representation. Weld quality assessment is a typical anomalous object detection that needs to locate and classify the anomalous objects in an image. In addition, there are two main categories of detectors in the generic object detection methods: one-stage detectors and two-stage detectors. Representative two-stage detectors like Fast R-CNN [32] and Mask R-CNN [33] follow a coarse-to-fine detection pipeline, i.e., first generating the rough object candidates and then using a region classifier to predict the classes and refine the localization of these proposed regions. They can achieve high detection accuracy, but are rarely used in engineering applications due to high computational complexity and poor real-time ability. To accelerate detection speed, some one-stage detectors only need one-step inference have been developed and can directly predict the coordinates of bounding boxes and their class probabilities, such as SSD [34], YOLO [35], and their variants [36,37]. Due to their good inference speed and decent detection precision, and, thus, are widely used for quality inspection in several industrial fields. Dlamini et al. [38] designed a model to detect surface mount defects on printed circuit boards, which consists of a MobileNetV2 and Feature Pyramid Network (FPN) to generate enhanced multi-scale features, followed by an SSD to locate the objects. Yao et al. [39] adopted a YOLOv5 model for detecting Kiwifruit defects. A fast and accurate inspection model BV-Net based on the YOLOv4 is proposed in [40] for tubular solder joint detection. In [41], Hou and Jing integrated a Res-Head and Drop-CA into YOLOv5 to accurately detect the complex surface texture of the magnetic tile in real time. To achieve accurate inspection of tiny chip pads in semiconductor manufacturing, an object convolution attention module is introduced into YOLOv5 [42]. Meanwhile, the presented design principle for the attention layer can yield a lightweight model. Yang et al. [43] proposed an improved YOLOv5 model for the detection of laser welding defects in lithium battery poles and achieved a better result compared to the original YOLOv5. Table 1 gives a concise overview of the above two types of CNN-based detection methods and briefly discusses their advantages and disadvantages. It can be seen that YOLOv5 has become the most popular and reliable approach in a wide range of defect detection tasks due to its high efficiency, high accuracy, and strong generalization ability. Following this trend, we are attempting to use it for weld quality detection of aviation plugs.

Table 1.
Strengths and weaknesses of different detection methods.
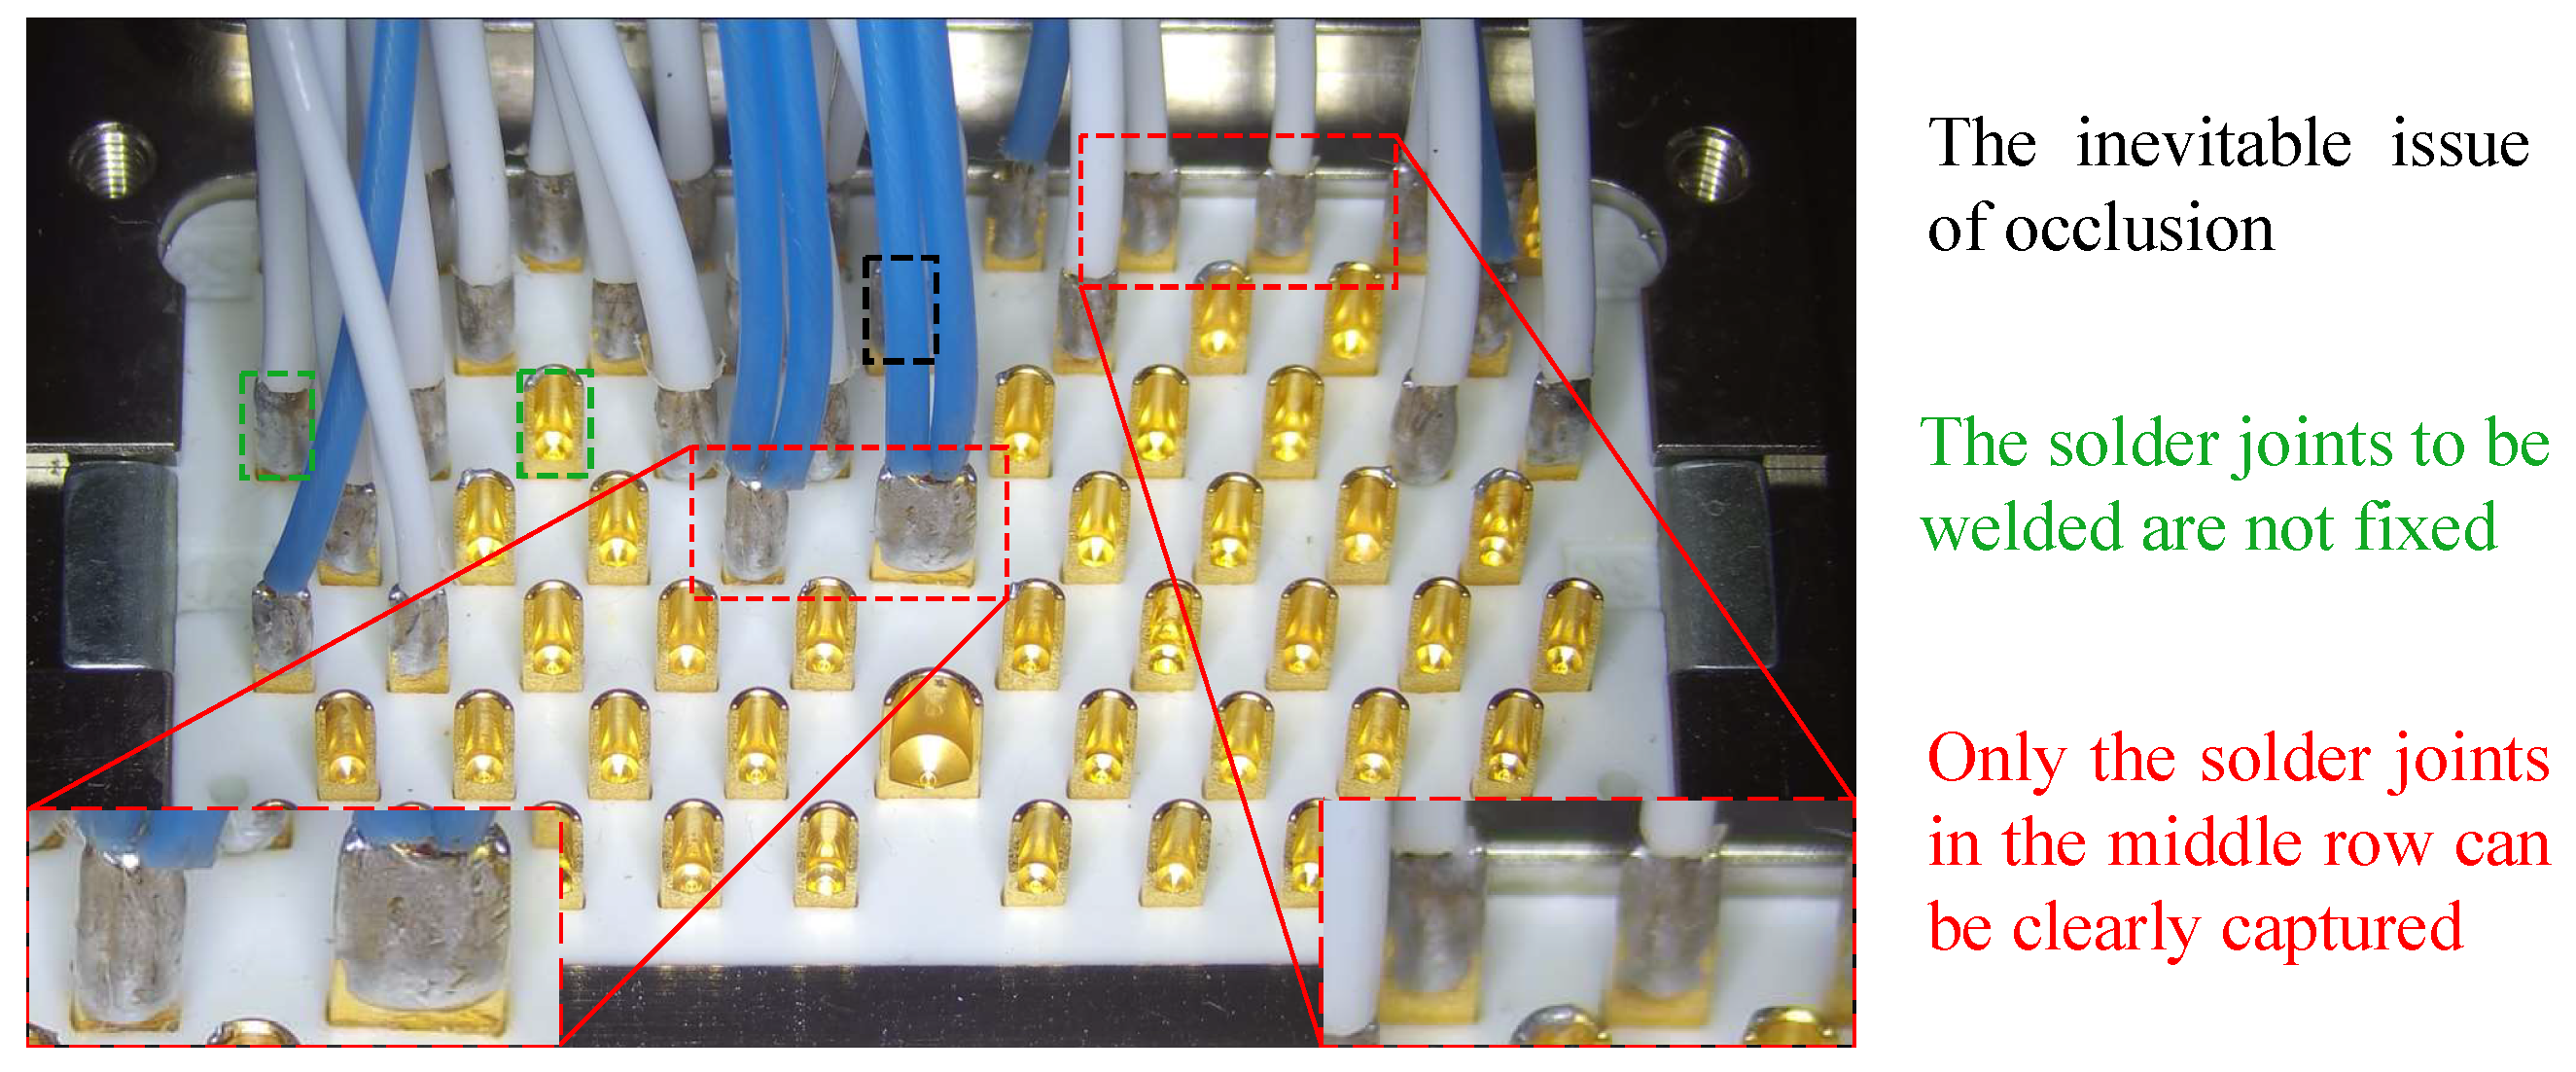
However, it is not appropriate to directly use existing YOLOv5 for solder joint quality inspection of aviation plugs for the following reasons. Small solder joints in the complex background: As shown in Figure 2, the solder joints are arranged in a regular, horizontally staggered pattern. While the appearance of the rear solder joints is inevitably obscured by the cables in the front solder joints. In addition, the aviation plug contains multiple small solder joints, and the positions to be welded are not fixed. Therefore, directly applying the YOLOv5 model to recognize these small solder joints from the complex background is difficult. Difficulties with image collection: YOLOv5 is a data-driven model that requires many images for training. Therefore, image collection is extremely critical and directly related to the final detection performance. However, because the solder joints in aviation plugs have a non-planar, layer-by-layer stack structure, they are at different object distances from the lens, meaning that the camera cannot directly capture a complete and clear image. As shown in Figure 2, only the intermediate region of the captured image is clear, while the ends are slightly blurred, which affects the assessment of the solder joint quality.
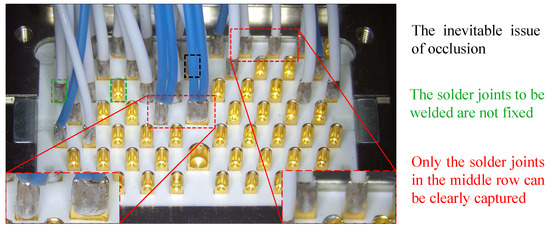
Figure 2.
An example of solder joints in the complex background on aviation plugs.
To overcome the mentioned difficulties, in this paper, we propose an accurate and automated weld quality detection approach based on two fine-tuned YOLOv5 models and design the corresponding system for aviation plug welding production lines. During the inspection, we adopt a top-down strategy, i.e., detecting a row of solder joints as soon as it has been welded to reduce the obscured issue between adjacent rows of solder joints. Meanwhile, the detecting process is implemented through two phases: ROI extraction and quality assessment. Firstly, a fine-tuned YOLOv5 model is used to extract the ROI within the entire captured image, i.e., the row of solder joints to be inspected after welding. Then the extracted ROI is automatically moved to the center of the image via a sliding platform to enhance its imaging clarity. Afterward, the adjusted ROI is fed into another fine-tuned YOLOv5 model to realize the weld quality assessment. Meanwhile, a graphical user interface (GUI) has also been developed, making it easier for operators on production lines to use.
In summary, the main contribution of this paper can be summarized as follows:
- 1.
- An accurate solder joint quality detection approach for aviation plugs is proposed, which uses two fine-tuned YOLOv5 models to perform ROI extraction and quality assessment, respectively. This two-phase strategy effectively eliminates the blurring and occlusion problem of solder joints, resulting in high-quality solder joint defect detection.
- 2.
- An intelligent solder joint quality inspection system for aviation plugs is developed, which can automatically capture high-resolution images of solder joints from an oblique angle. By combining the proposed detection approach, our system can effectively recognize the weld defects of aviation plugs.
- 3.
- A concise and easy-to-use GUI has been designed and deployed in the real production lines, which enables the recognized results to be viewed and stored in real time. The application testing on real production lines also shows that our system can meet the requirements for weld defect detection of aviation plugs.
The rest of this paper is structured as follows: in Section 2, the methods and materials are described in detail, including data acquisition and detection approach. The experimental results and experimental analysis are then presented in Section 4. Finally, the conclusion is summarized in Section 4.
2. Methods and Materials
2.1. System Overview
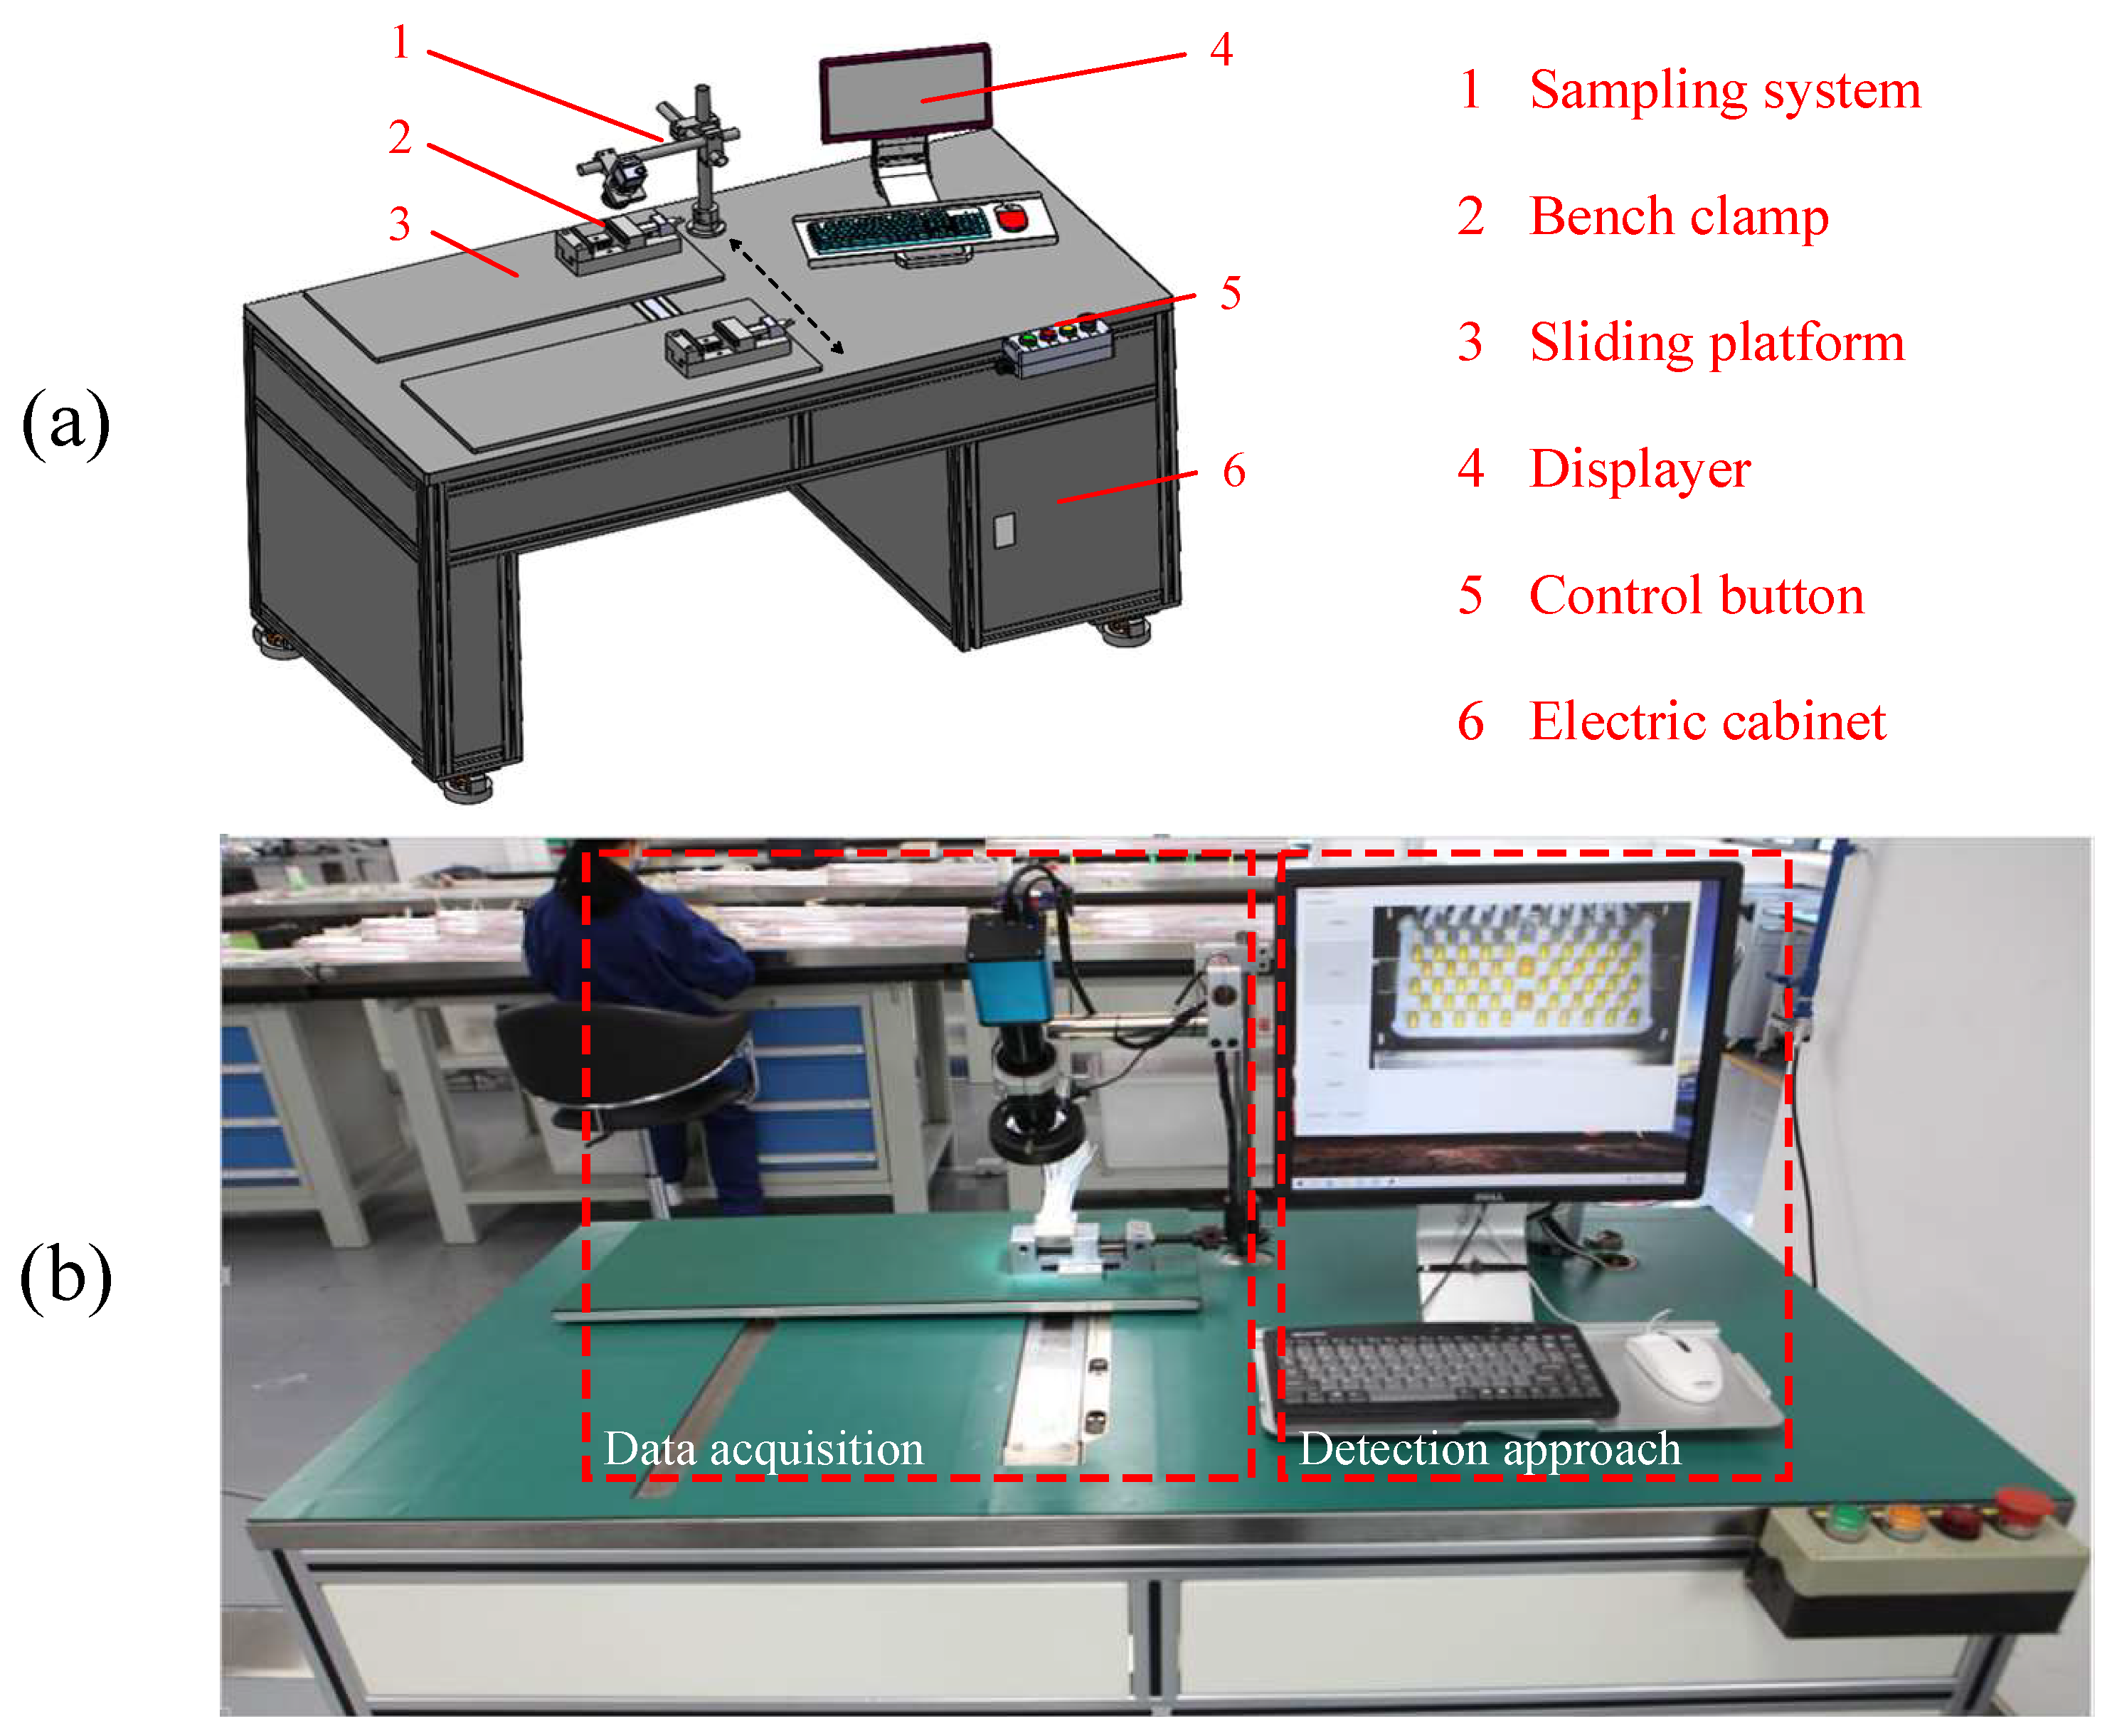
The proposed solder joint quality detection system for aviation plugs is shown in Figure 3. It is mainly composed of two parts: data acquisition and detection approach. The data acquisition is the hardware part of our system and is mainly responsible for moving and taking pictures of the aviation plugs. The detection algorithm is the software part of our system, which consists of two main modules: ROI extraction and quality assessment. They are responsible for providing the distance to fine-adjust the sliding platform and achieving accurate defect detection, respectively.
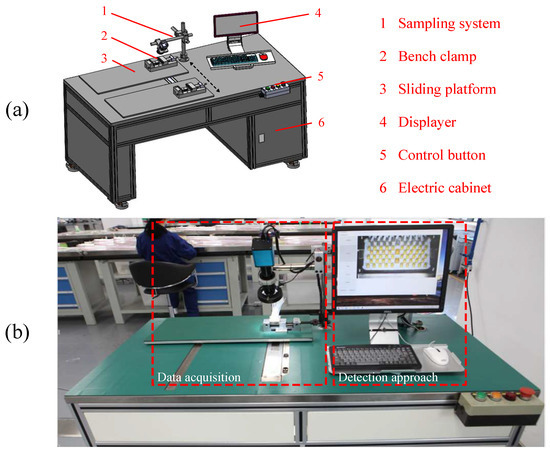
Figure 3.
The scheme of solder joint quality detection system for aviation plugs. (a) Schematic diagram. (b) Prototype platform.
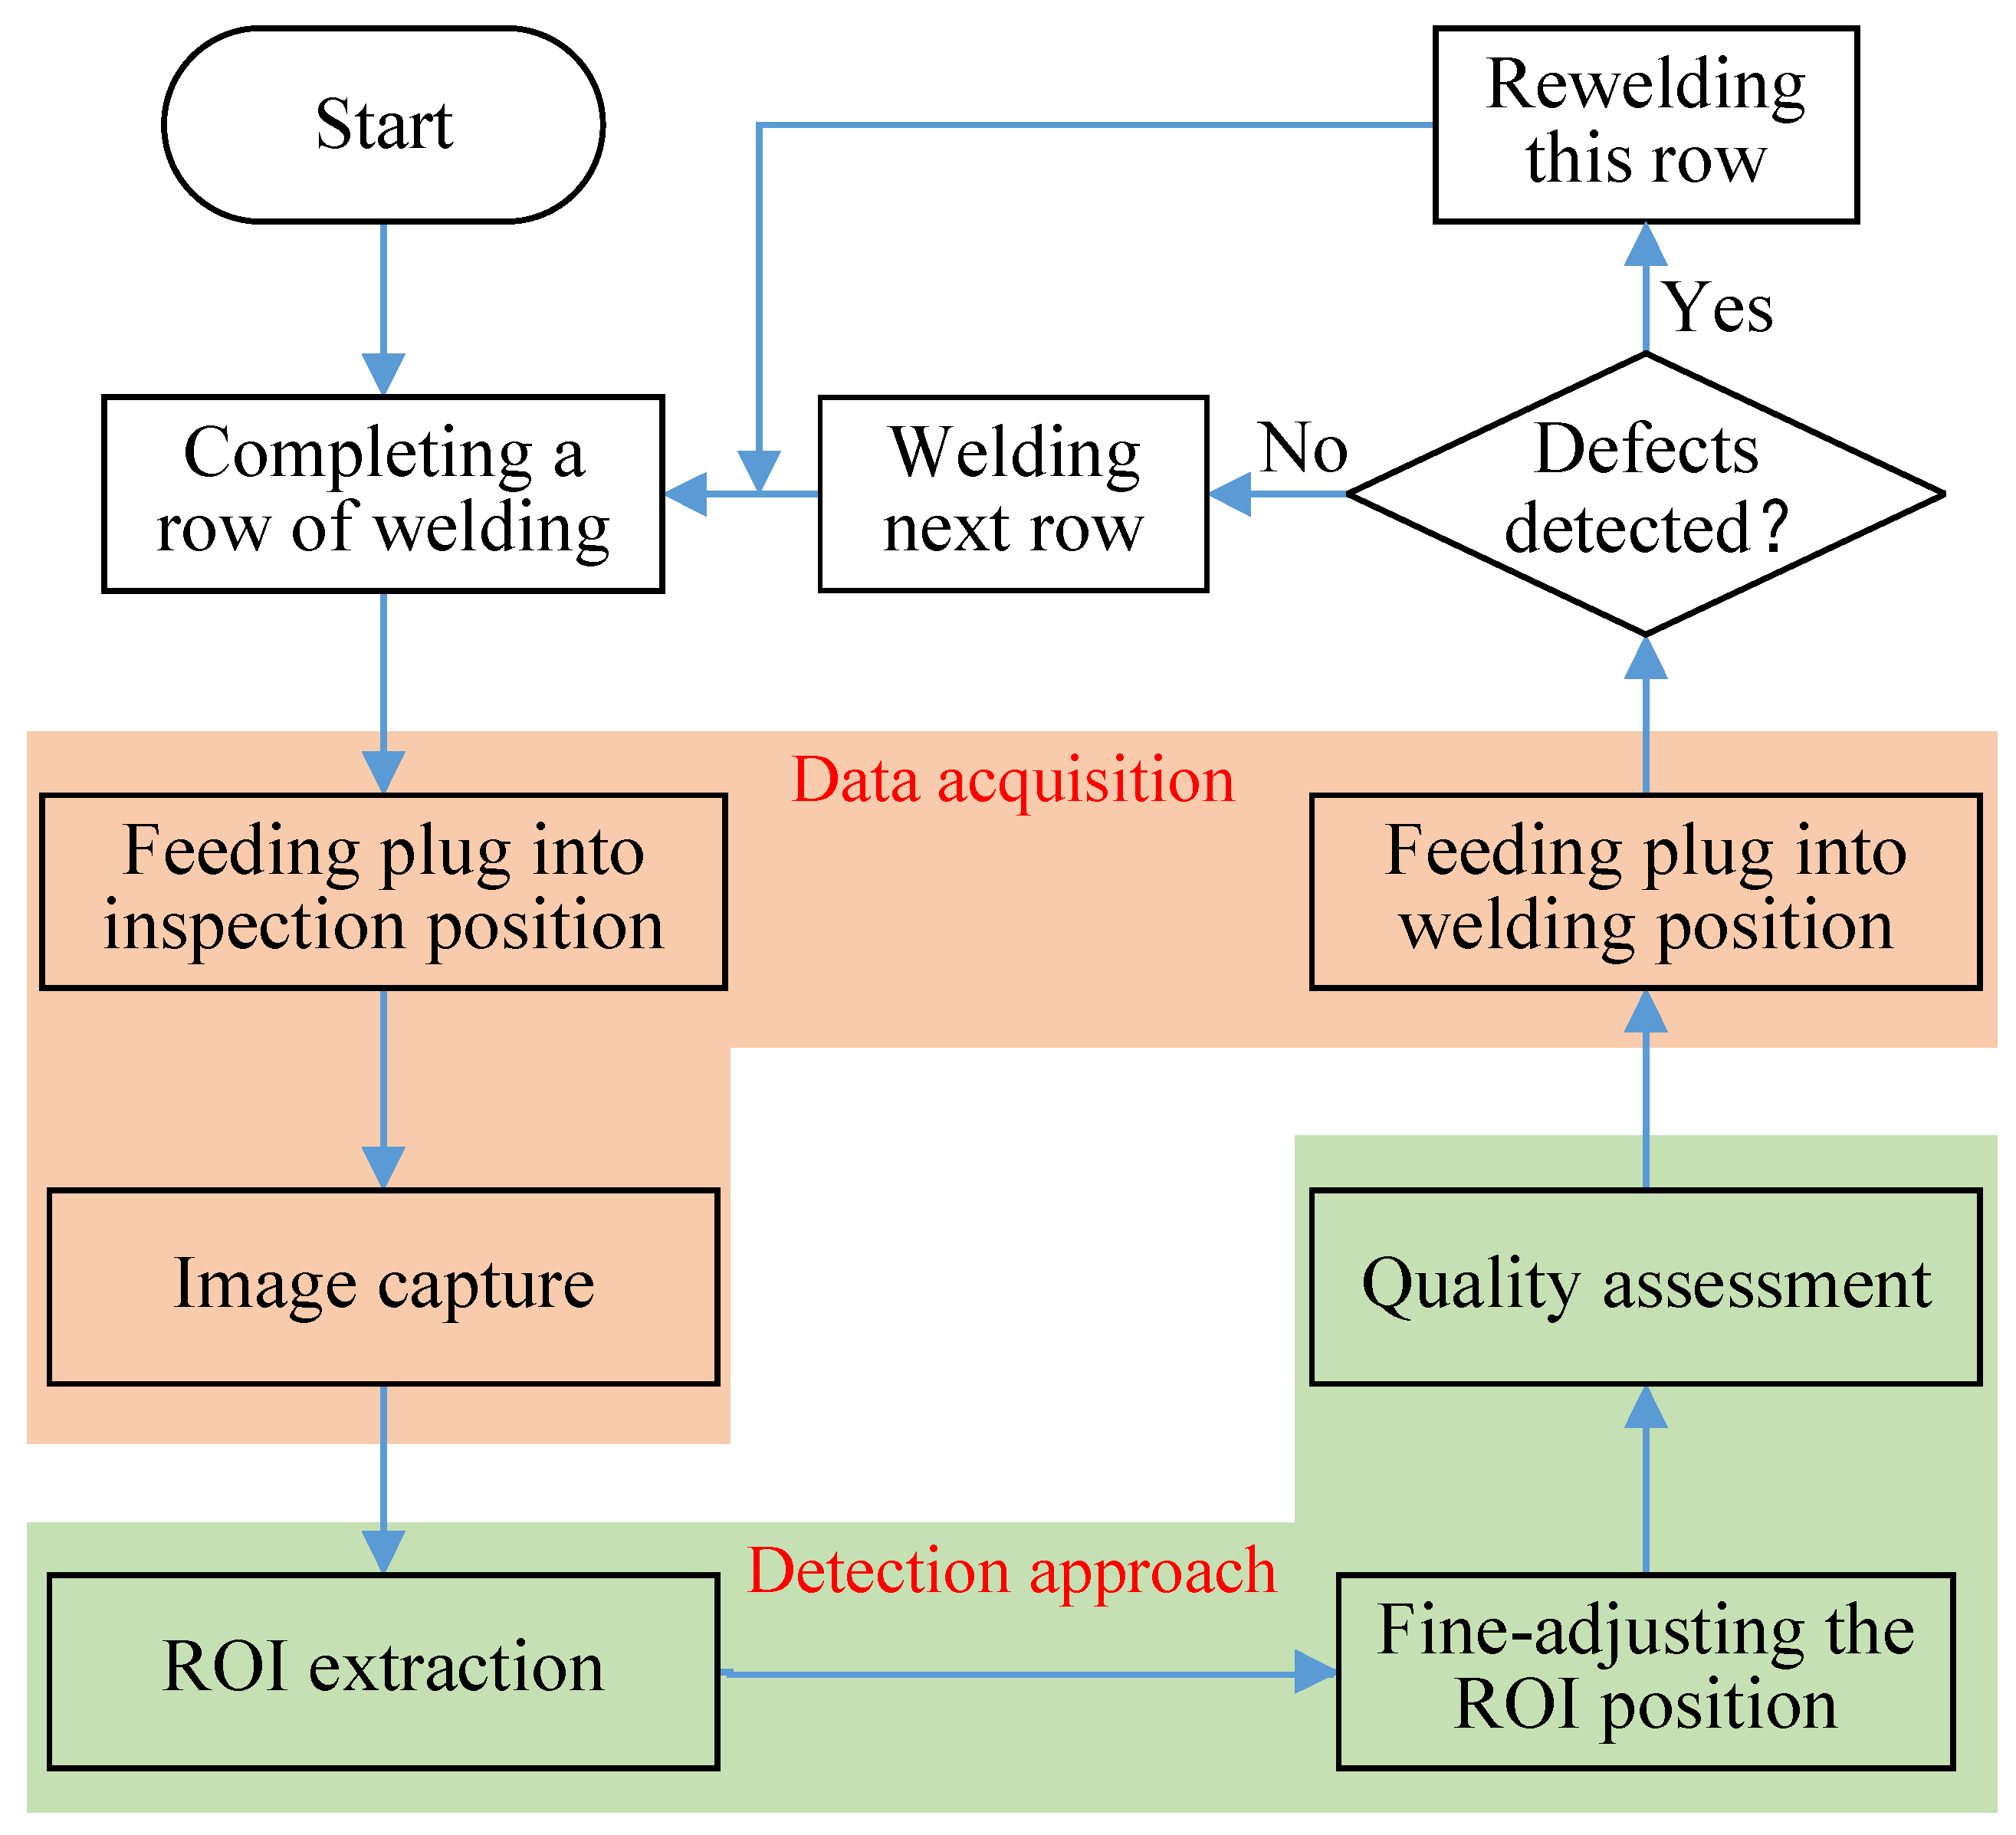
The pipeline of our system is illustrated in Figure 4. Overall, we adopt a top-down sequential inspection strategy, i.e., detecting a row of solder joints as soon as it has been welded. Specifically, the proposed inspection system consists of the following steps.
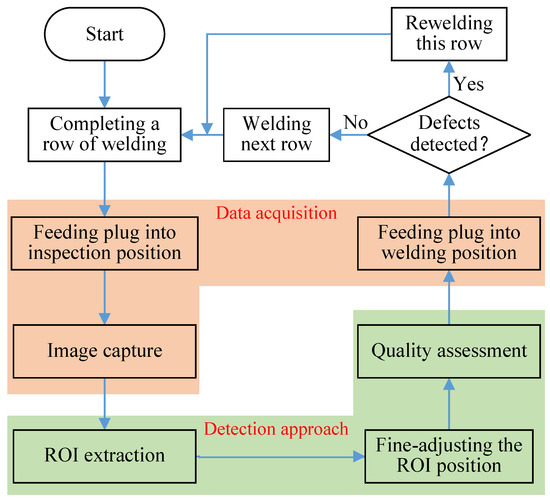
Figure 4.
The flowchart of solder joint quality inspection system for aviation plug.
Step 1: After welding a row of solder joints fixed in the bench clamp, our system moves the aviation plug to the inspection position via the sliding platform and takes pictures via the sampling system.
Step 2: Using a computer placed in the electronic cabinet, a fine-tuned YOLOv5 model is applied to extract the ROI within the captured image, namely the row of solder joints that have just been soldered and need to be detected.
Step 3: According to the coordinates of the extracted ROI, the ROI is fine-adjusted to the center of the image via the sliding platform to enhance its imaging clarity.
Step 4: Another fine-tuned YOLOv5 model performs a quality assessment of solder joints in the adjusted ROI, and the results are displayed on the displayer in real-time.
Step 5: The aviation plug is moved to the welding position. In addition, if a defect is detected, the solder joints in that row are re-welded, otherwise welding the next row.
Obviously, the key components of our proposed system are the data acquisition and detection approach, and we describe these in detail below.
2.2. Data Acquisition
The weld quality inspection for aviation plugs requires an acquisition system to capture the image of each solder joint. In addition, the resulting image dataset is directly related to the quality of the final inspection results. In this section, we will illustrate the details of data acquisition, including the sampling system, image labeling, and image augmentation.
2.2.1. Sampling System
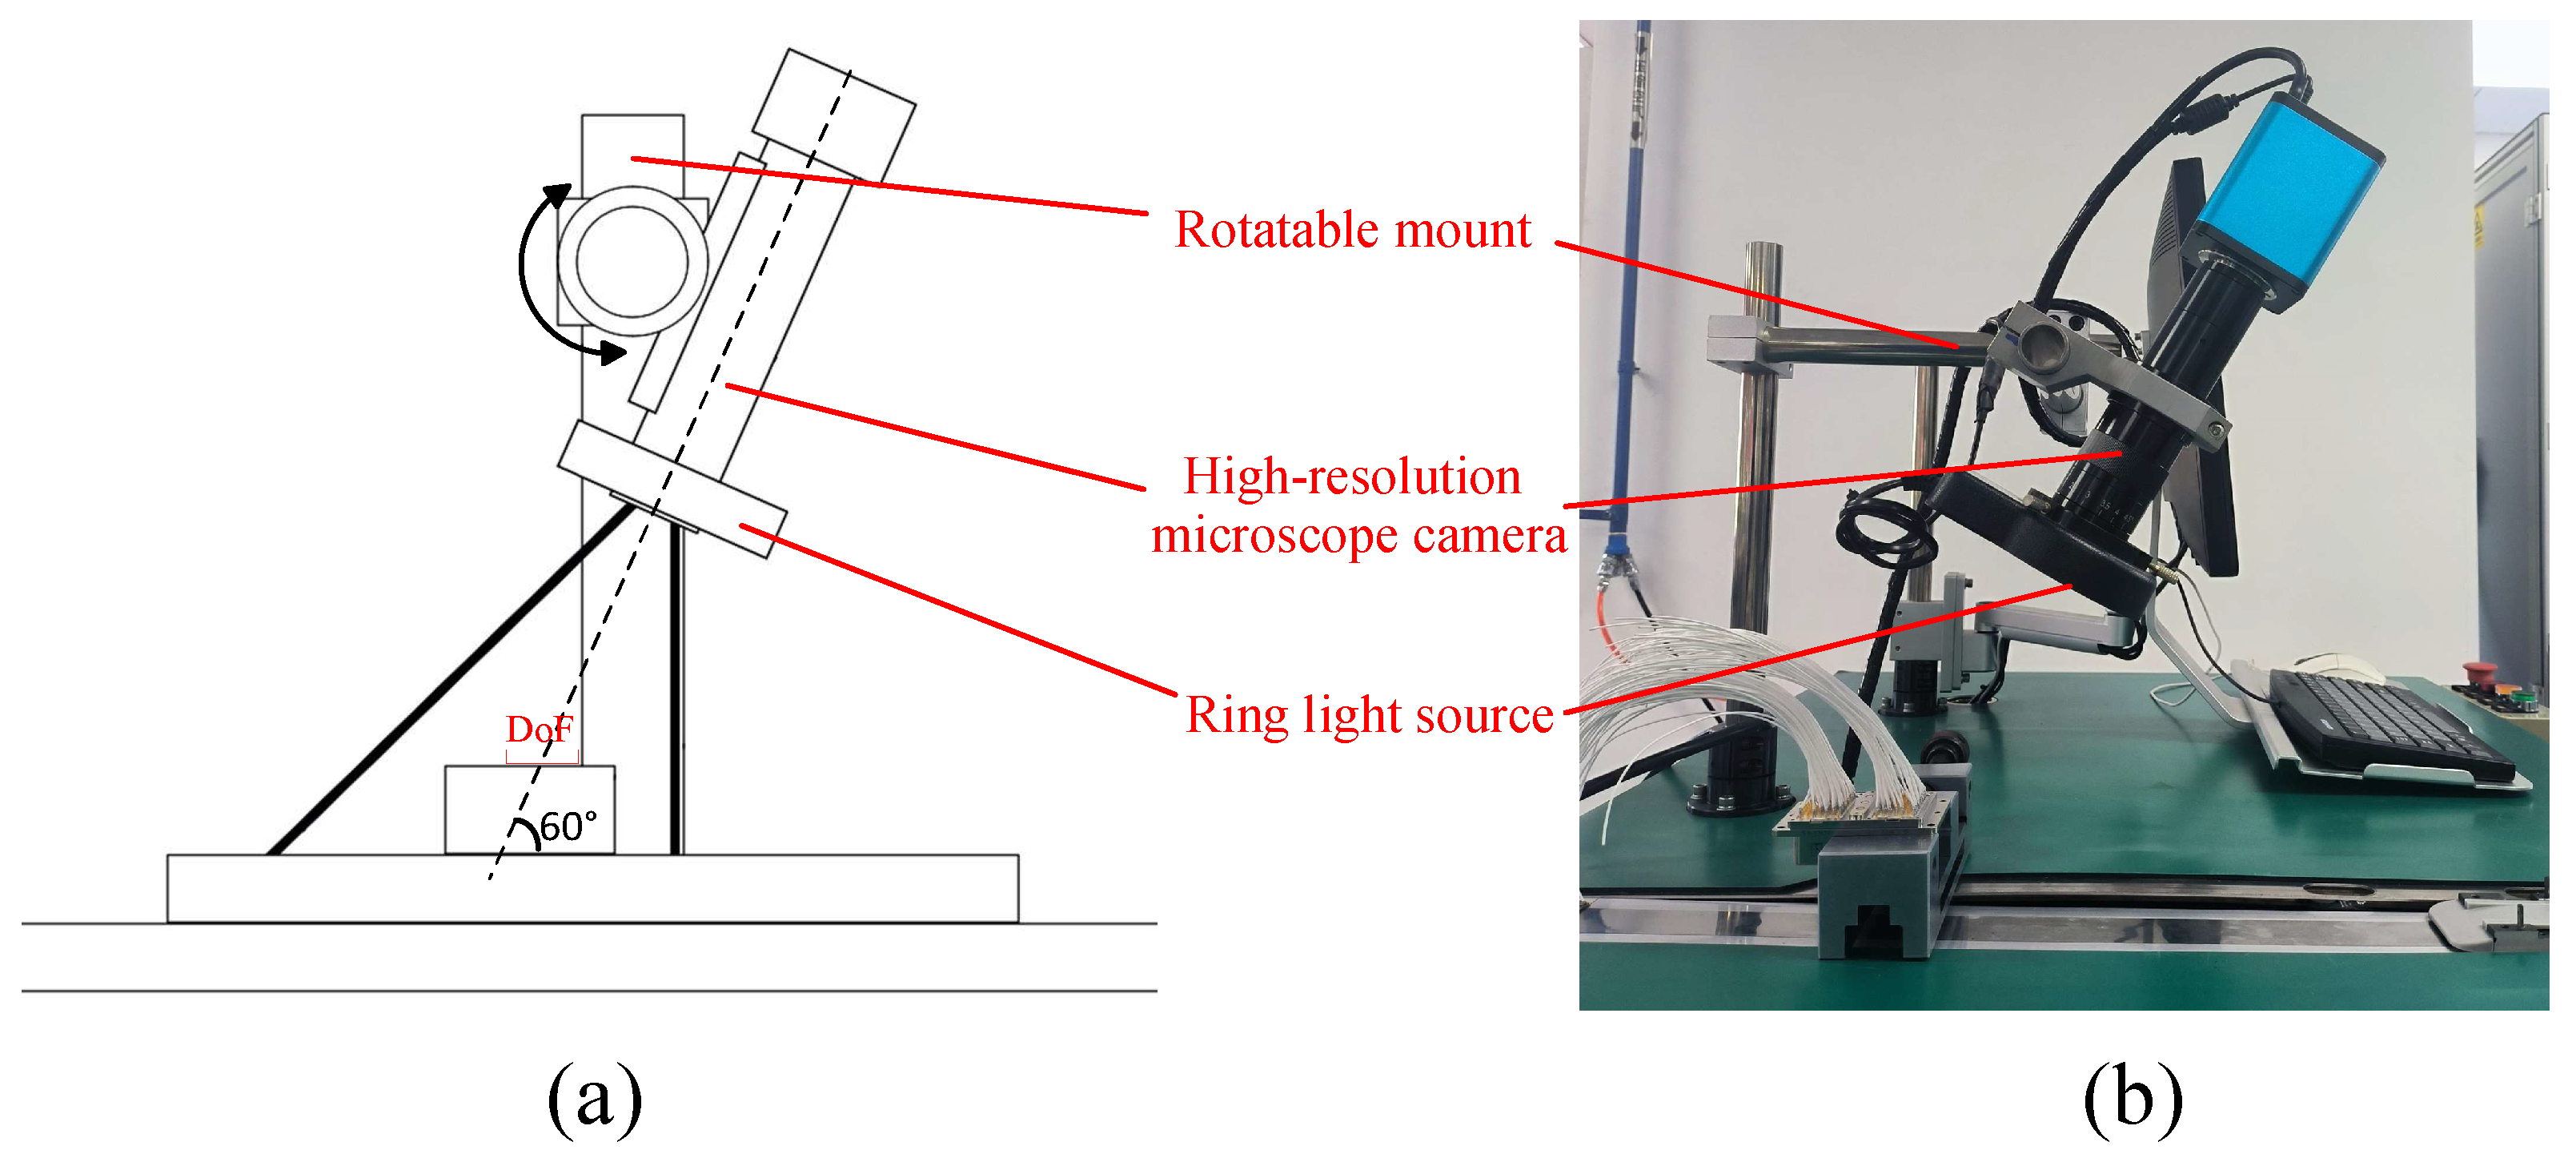
The designed image sampling system mainly consists of three parts, including a rotatable mount, a high-resolution microscope camera, and a ring light source, as shown in Figure 5. As you can see from Figure 1, the aviation plug contains multiple rows of small solder joints, the smallest of which is just 1 mm. Therefore, with the aid of an auxiliary microscope lens (0.5× magnification), an industrial camera with a pixel size of 0.01 mm and a resolution of 4000 × 3000 pixels, capable of capturing 30 frames per second (FPS) is adopted. The rotatable mount is responsible for the angle adjustment of the shot. Due to the non-planar, layered structure of solder joints in the aviation plug, the vertical acquisition angle cannot capture the surface characteristics of the solder joints. To alleviate this problem, we use an oblique angle to take the picture as shown in Figure 5. In practice, to avoid the problem of occlusion between adjacent rows of solder joints, the angle between the optical axis of the camera and the horizontal plane is set to 60. However, because the angle of the shot is inclined, each row of solder joints is not at an equal distance from the lens. As a result, a camera with a given depth of field (DoF) cannot cover the entire image, resulting in only the middle region of the image can be clearly captured, while the others are slightly blurred. For this reason, a two-phase strategy is used in the detection approach. To provide sufficient and uniform light, a ring light source with a power of 5 w is mounted at the end of the camera lens. Meanwhile, the camera and light source are kept on a center line for a good shot. The sampling system is installed in a fixed position, and only moving the aviation plug via a sliding platform is needed to capture the characteristics of these small solder joints. In addition, the captured images are transferred to the computer via a USB cable for subsequent processing.
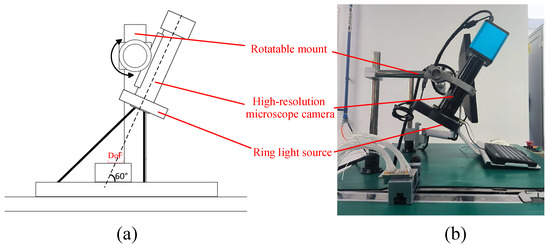
Figure 5.
Hardware structure of the sampling system. (a) Setup diagram. (b) Physical device.
2.2.2. Image Labeling
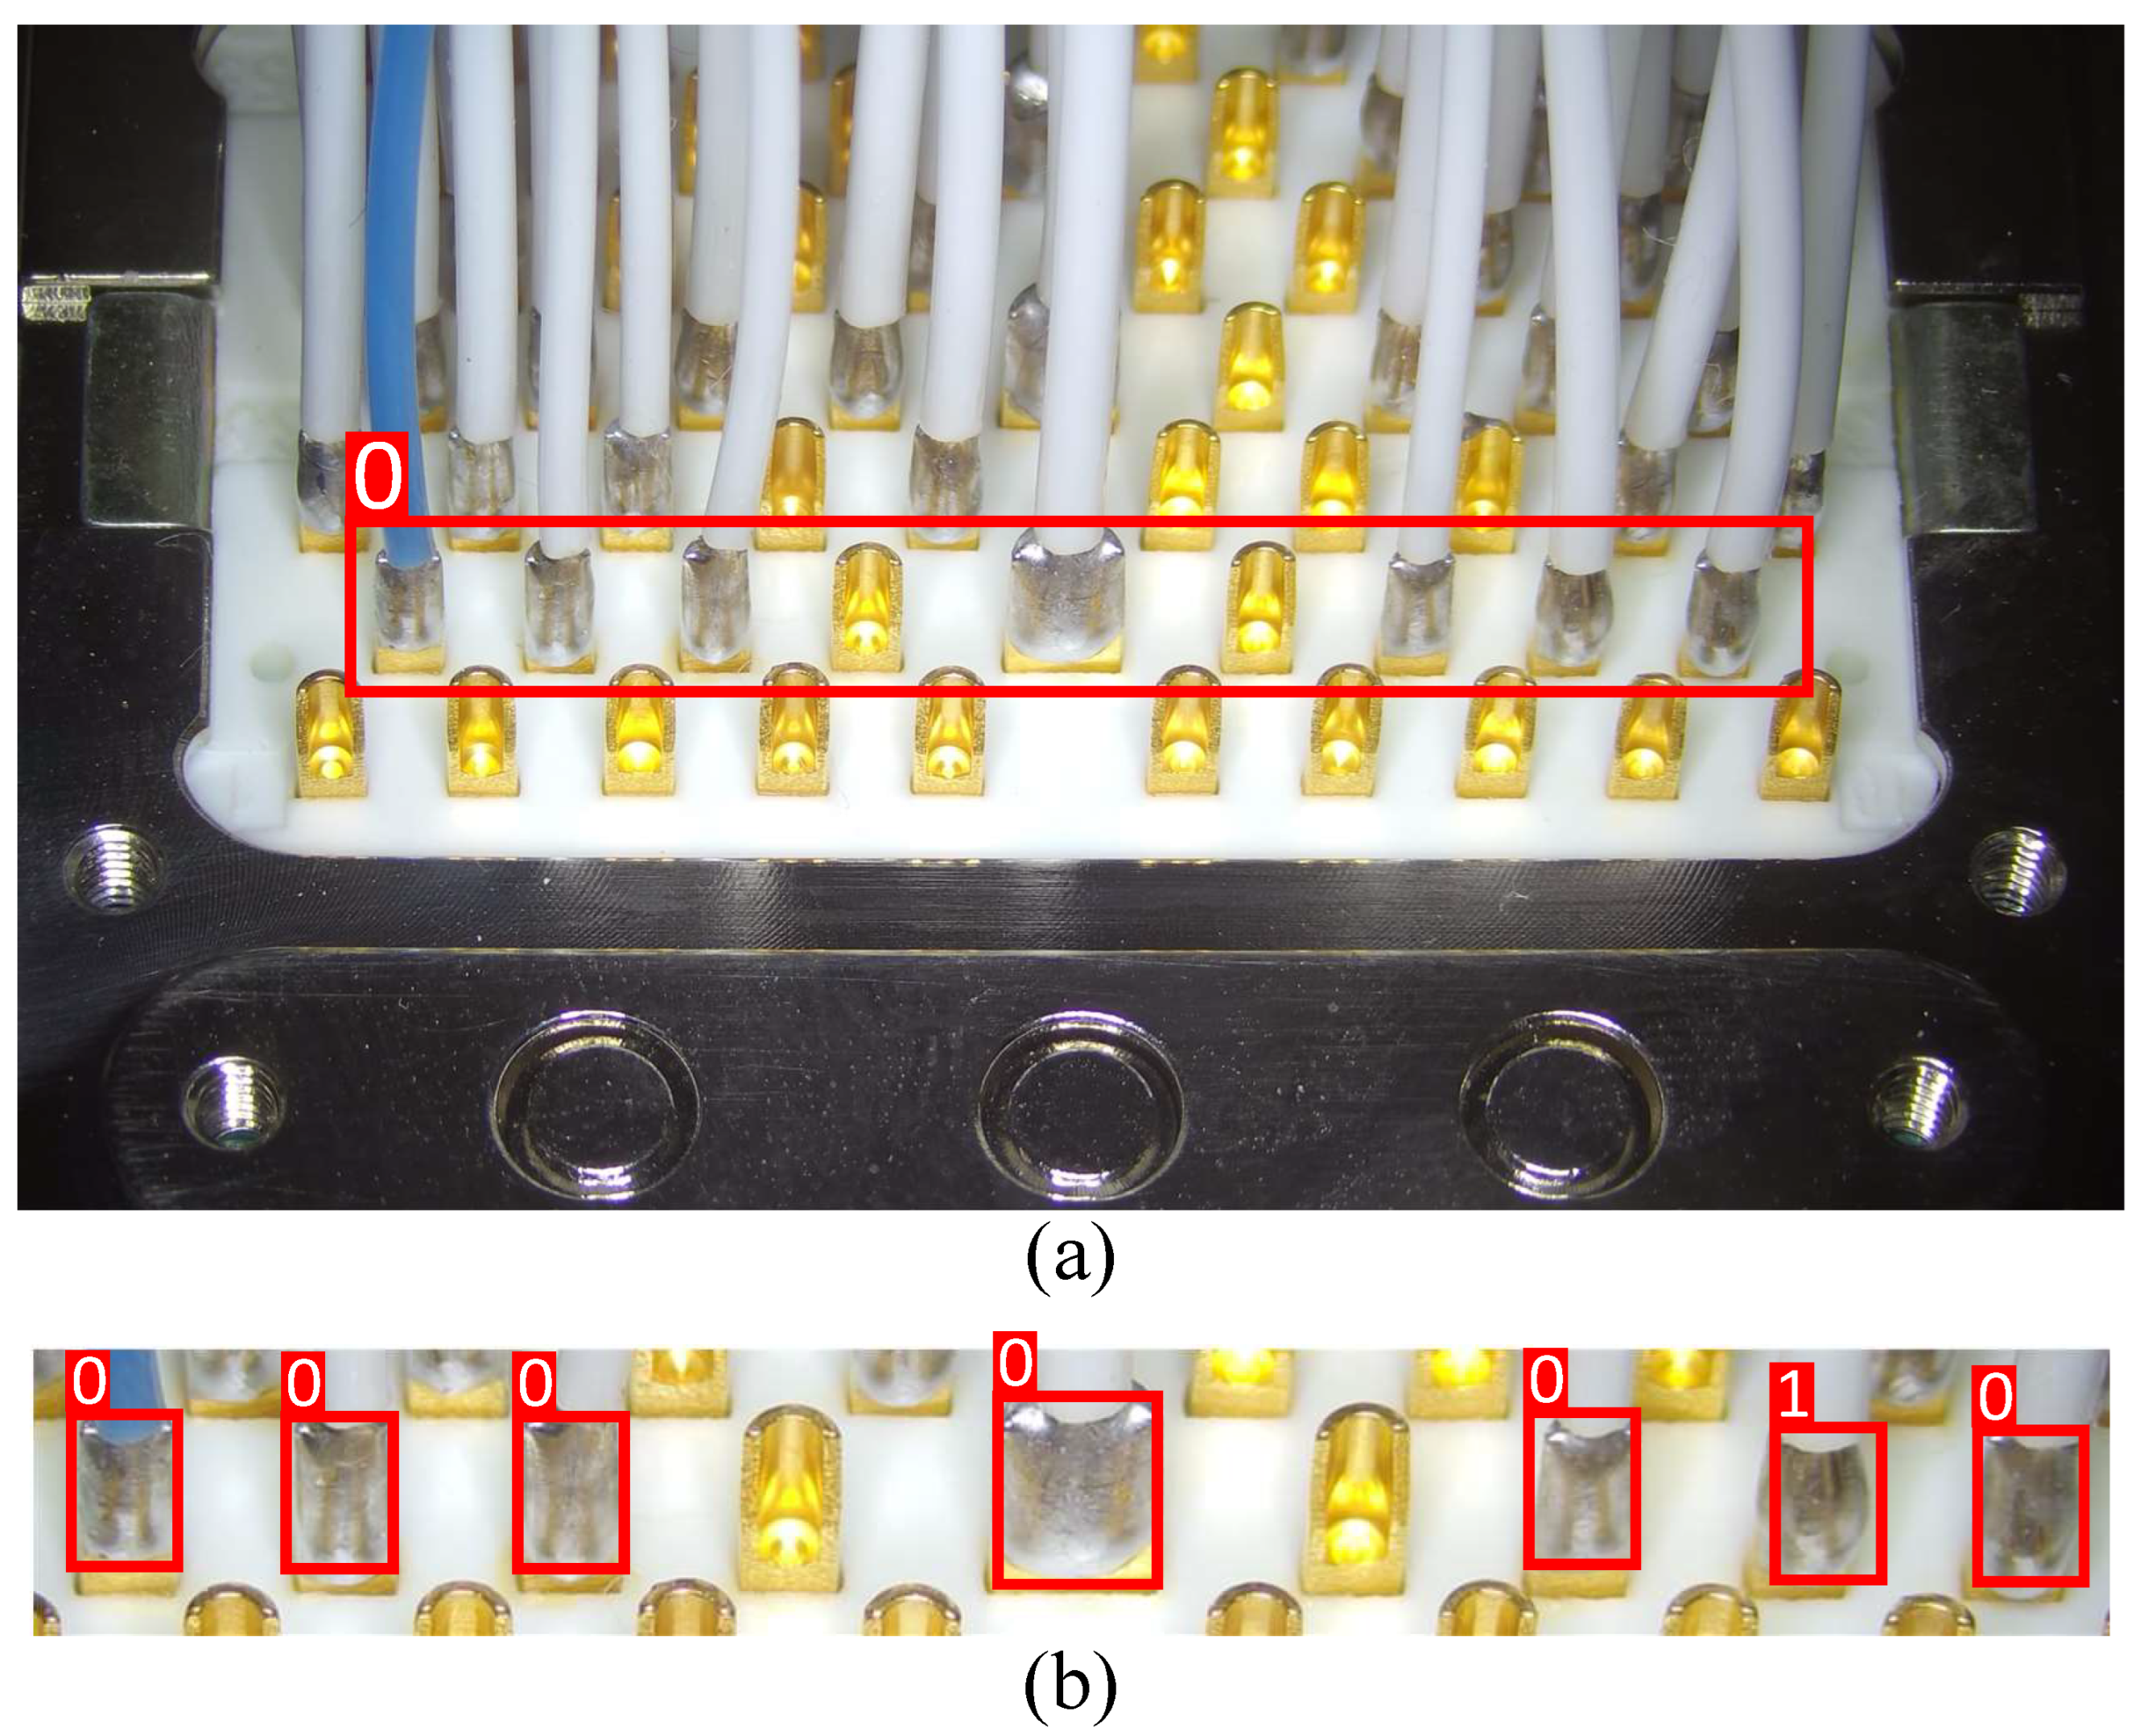
Once enough sample images are available, they need to be labeled to provide ground truth, which is extremely important for model training. The process of labeling is to manually mark the region of interest on the image with a bounding box according to the objective of the model training. For example, in Figure 6, we show the different annotations that are required for ROI extraction and quality assessment. The number 1 in Figure 6b means the defective solder joints. During the labeling, each training image is labeled by two professional quality inspectors from the factory. When two people have different opinions, the sample is discarded, which effectively reduces mislabeling due to subjective judgment. Meanwhile, an open-source graphical image annotation tool LabelImg is used to make labeling easier. In addition, the obtained annotation information is stored in a text format for the training of YOLOv5.
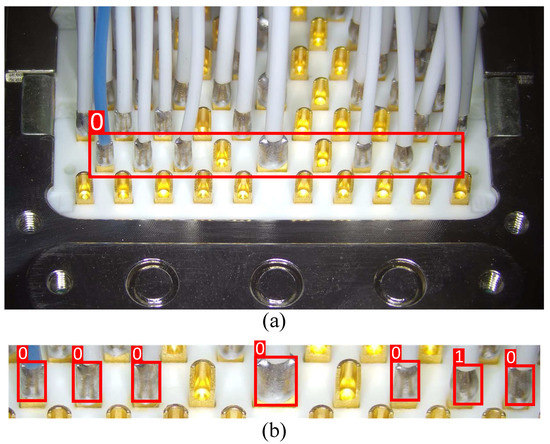
Figure 6.
The annotation example for ROI extraction (a) and quality assessment (b).
2.2.3. Image Augmentation
The YOLOv5 model we used is a deep learning-based method that requires a large number of training images to achieve good detection results. However, to achieve high economic efficiency, many efforts are made to avoid manufacturing defects in the production process. At the same time, artificially creating a large number of defects can lead to a waste of resources. Therefore, the number and type of defective samples that can be collected are usually limited, leading to model over-fitting and performance degradation. Fortunately, image augmentation can overcome this problem by producing some more diversified versions of images from the given image dataset. Taking into account the characteristics of the solder joints on aviation plugs, the following methods for image augmentation are employed in this paper.
Image graying: Converting images from RGB to grayscale is intended to make predictions about images without relying on any color information. This makes it easier for the model to extract information from the Image context rather than the color and can improve the model’s ability to generalize.
Image blurring: Due to platform movement, camera shake, and depth of field, the captured images of solder joints may appear blurred. Therefore, we use mean filtering and median filtering to simulate solder joints with varying degrees of clarity in aviation plugs, which can improve the recognition ability for blurred images.
Horizontal flipping: As can be seen, the aviation plug is a left-right symmetrical structure, which means that the horizontal flapping cannot change its appearance. Therefore, the horizontal flipping is adopted to expand the images in this paper.
HSV jittering: Converting the image from RGB space to HSV space, and then changing the values of the three channels, including hue, saturation, and value. In this way, different scenes and illumination conditions can be simulated without destroying the key information of the image, thus, increasing the diversity of the training images.
Mosaic [38]: The four training samples are randomly scaled and distributed, then merged into one image and sent to the model for training. Without any additional computational load, this method allows four images to be fed into the model at a time, and, thus, can learn more robust features. Moreover, as the images are scaled, some small objects may appear in the merged image. This will greatly improve the ability of the model to detect small targets.
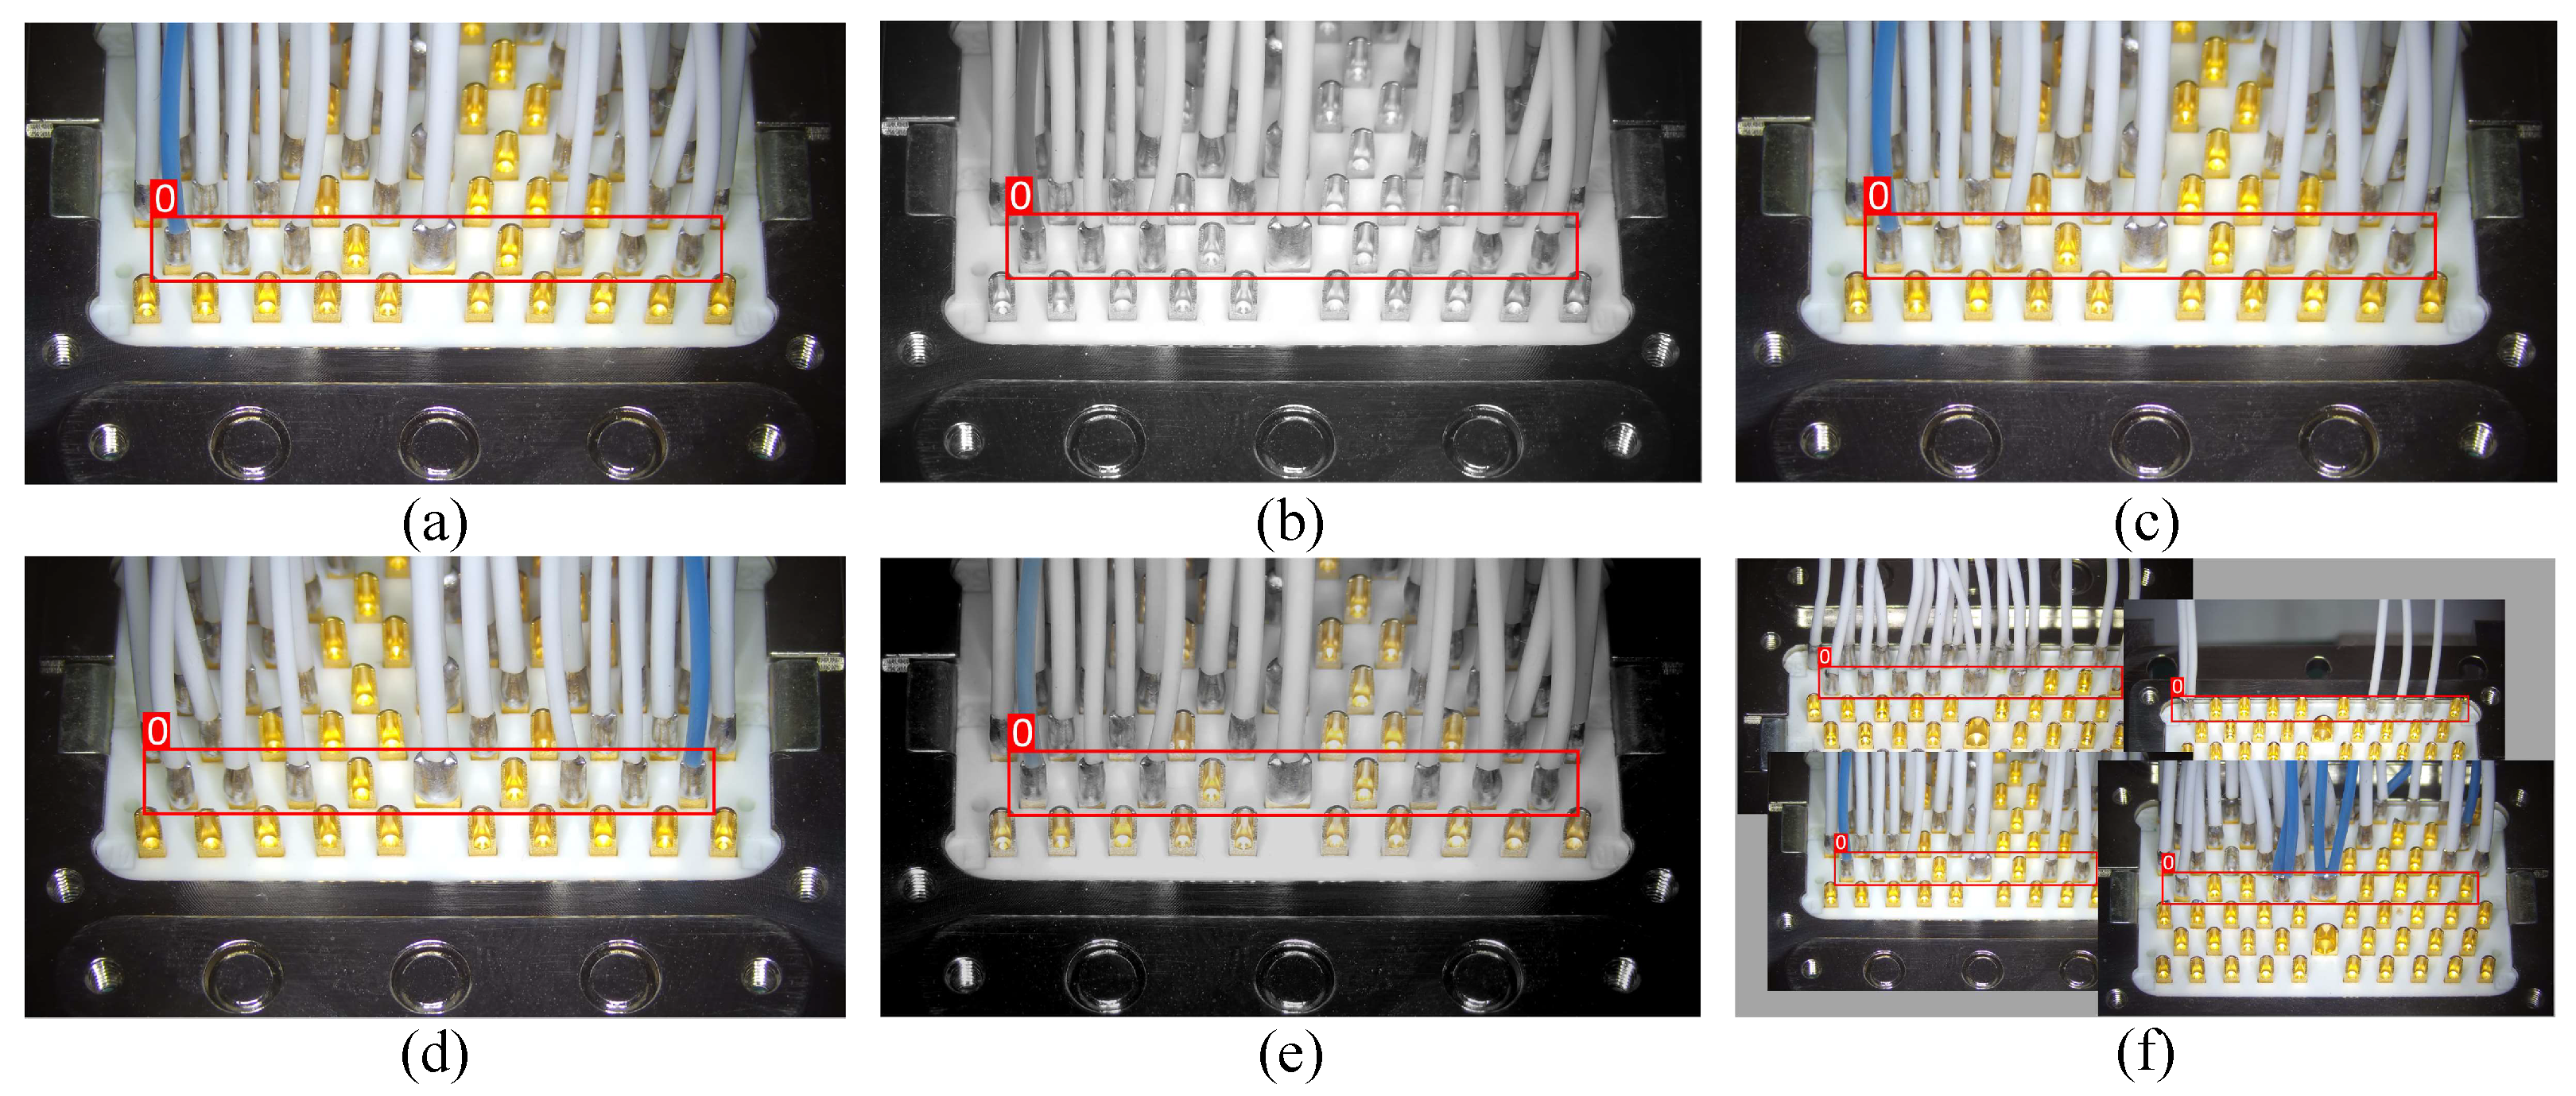
Taking the ROI extraction as an example, the augmented results are shown in Figure 7. Although these generated images don’t change the image structure too much, they could change the spatial and semantic information of the objects. Meanwhile, in practice, the above data augmentation methods are used in conjunction with each other with a certain probability to improve the number and diversity of the dataset.
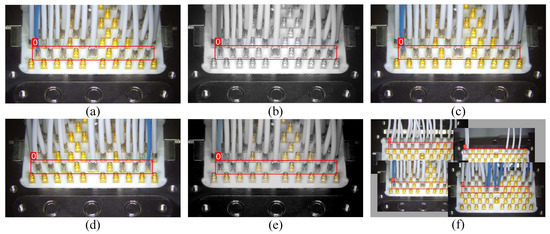
Figure 7.
The example of image augmentation for ROI extraction. (a) Original image. (b) Image graying. (c) Image blurring. (d) Horizontal flipping. (e) HSV jittering. (f) Mosaic.
2.3. Detection Approach
After obtaining enough training images with high-quality annotations, an accurate two-phase approach for weld quality detection is presented in this section. It consists of ROI extraction and quality assessment, which can provide the distance for fine adjustment of the sliding platform and achieve accurate defect detection respectively.
2.3.1. ROI Extraction
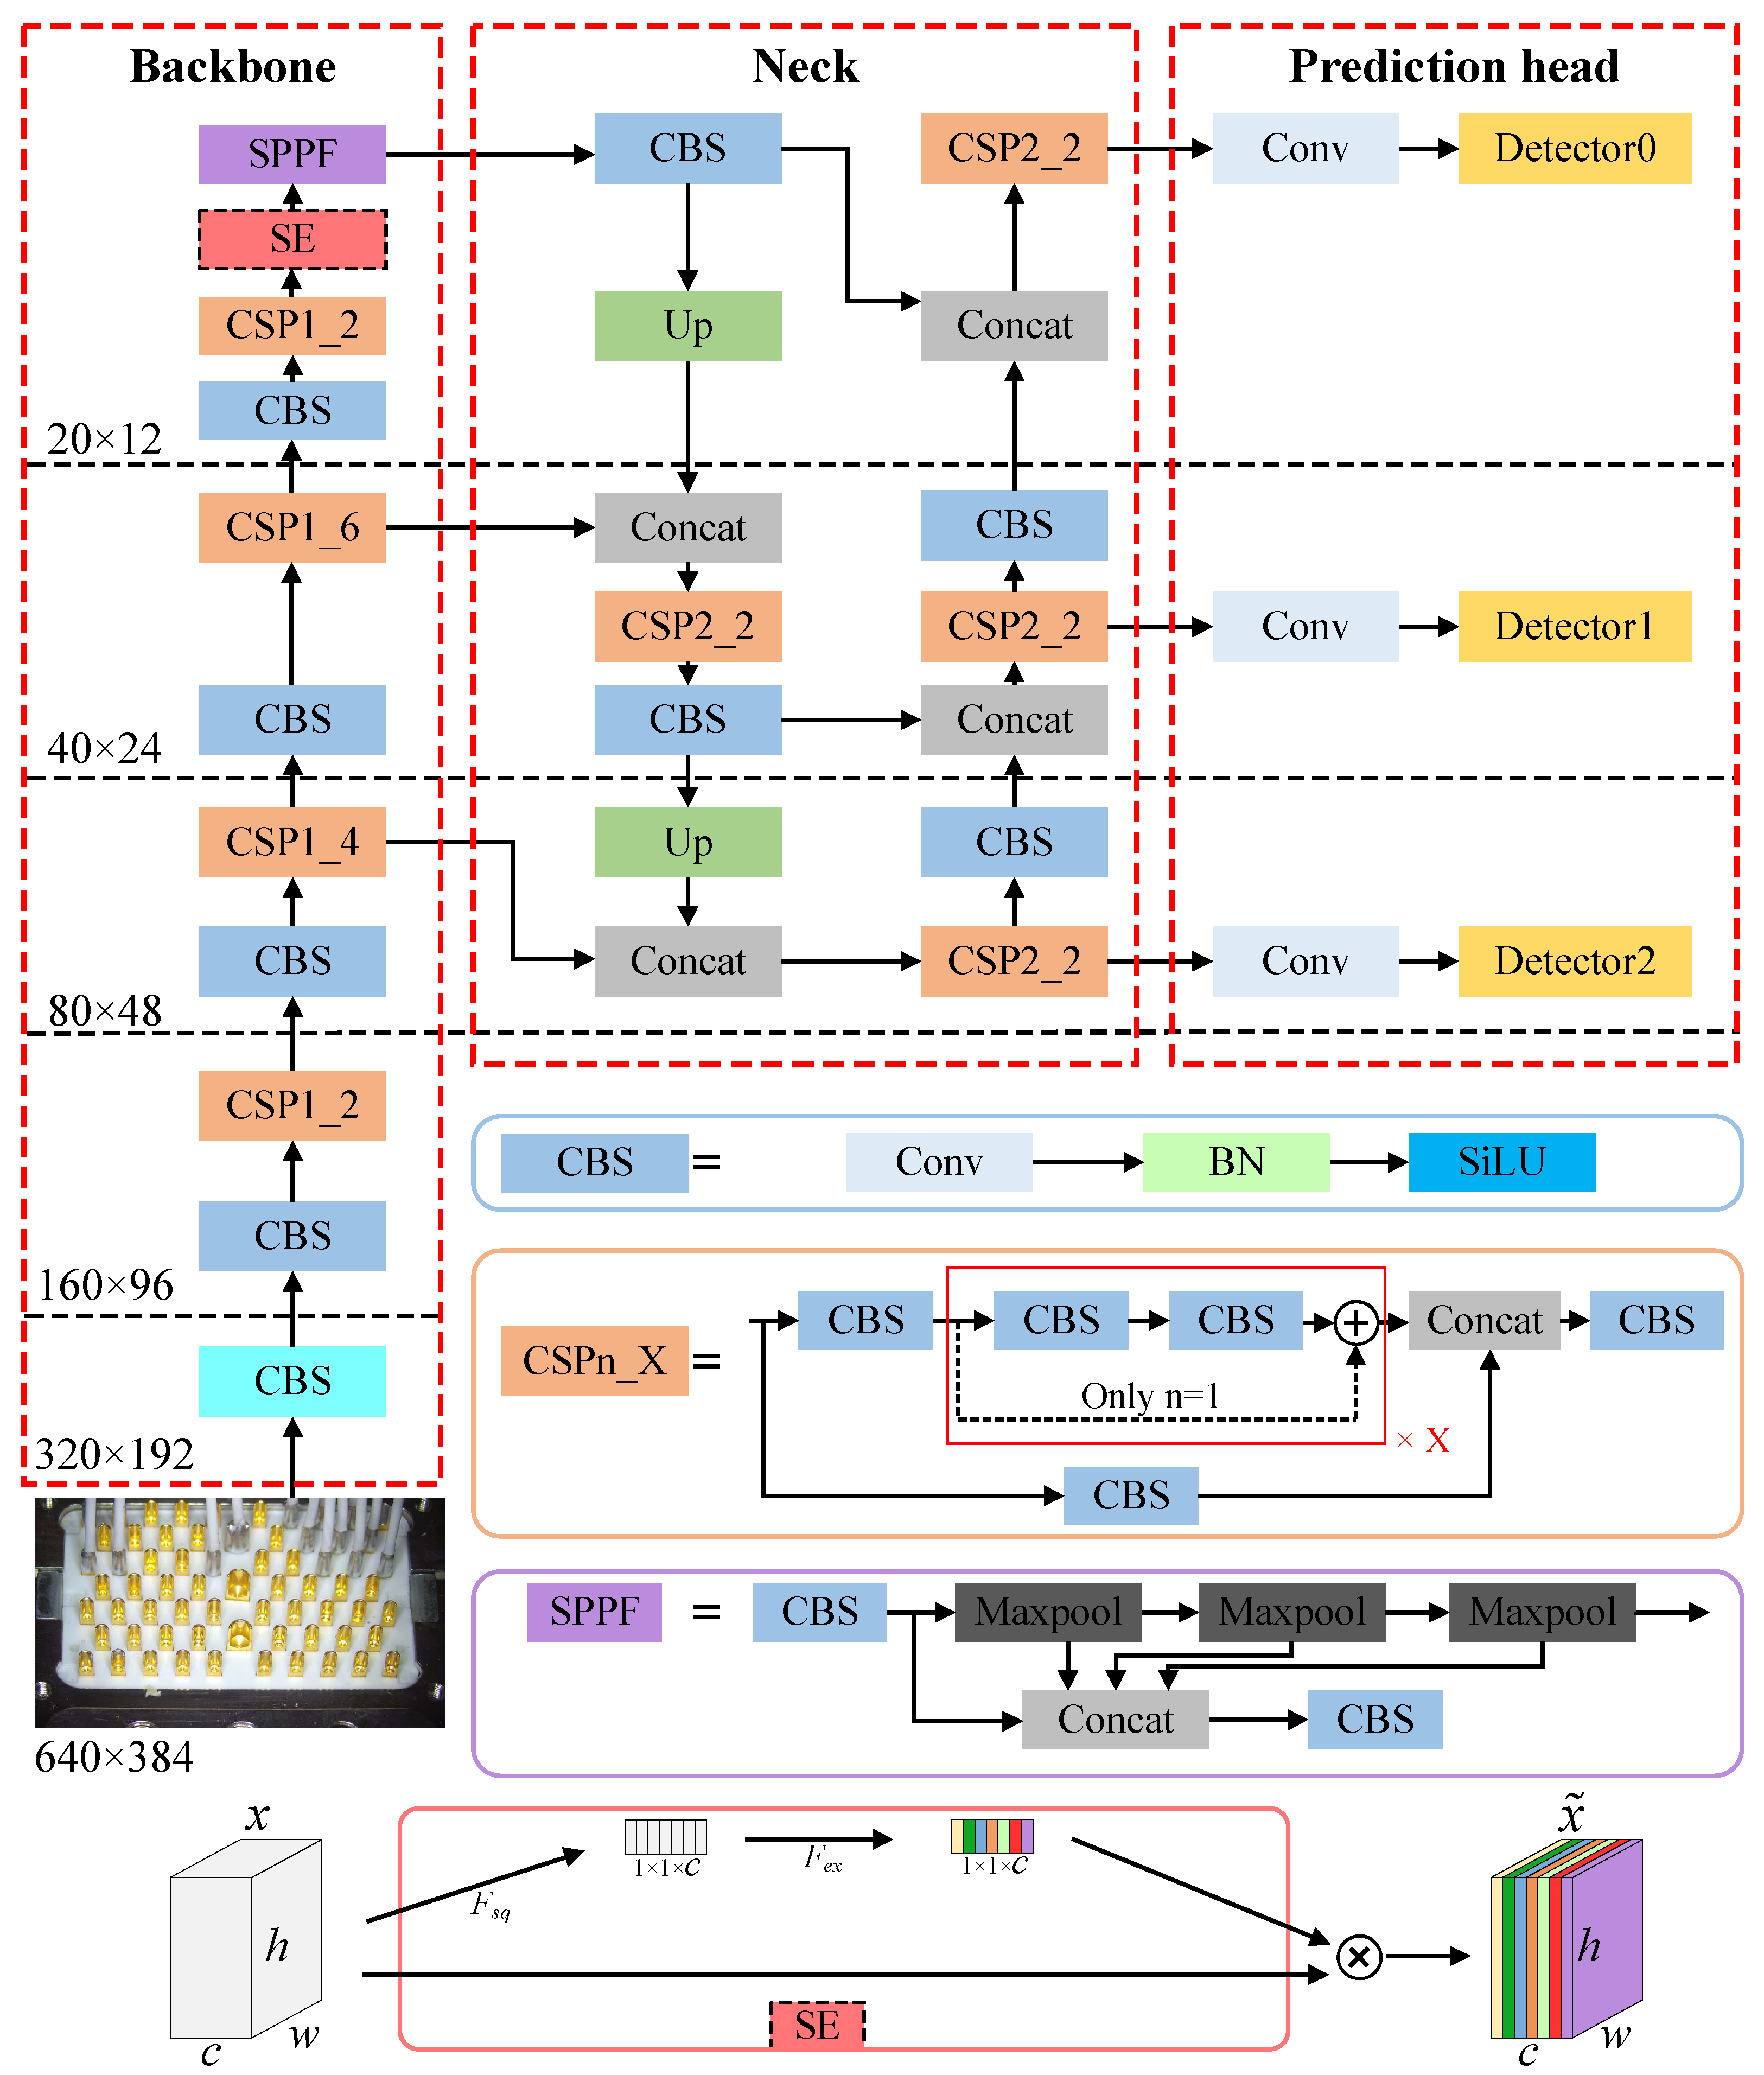
The special structure of solder joints in aviation plugs prevents the camera with a limited DoF from covering the entire image, resulting in only the middle region of image can be clearly captured. The top-down sequential detection strategy cannot ensure that the row of solder joints to be detected remains in the DoF. Therefore, in our detection approach, we first use a fine-tuned YOLOv5 to detect the coordinate of the row to be examined, i.e., ROI extraction. According to this coordinate, the extracted ROI is then fine-adjusted to the center of the DoF via the sliding platform. In this case, the clarity and detail of ROI can be significantly enhanced to facilitate subsequent quality assessment. Moreover, limiting the scope of quality assessment to ROI will greatly reduce background interference. Among the four versions of YOLOv5, we choose YOLOv5m with a good balance between accuracy and speed for ROI extraction. The structure of YOLOv5m with the added squeeze-and-excitation (SE) block [44] is shown in Figure 8, and is made up of three main components: backbone, neck, and prediction head. The numbers indicate the size of the longest side of the image or feature map.
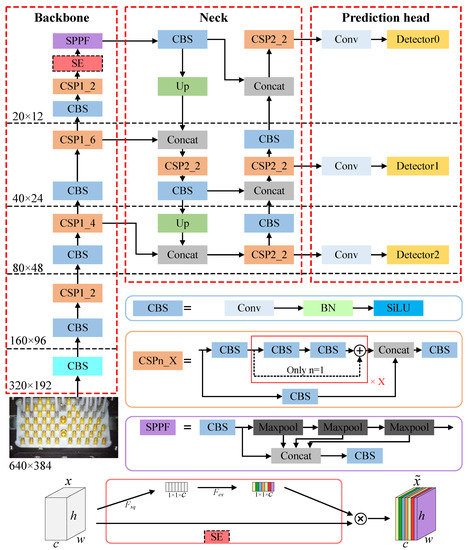
Figure 8.
The structure of YOLOv5m with the added SE block.
The backbone module is designed to extract multi-scale features of the input image through layer-by-layer convolution. It consists of five CBS blocks, four CSP1_X blocks, one SPPF block and one SE block. The CBS block is used to achieve image downsampling, and it is stacked with a convolution operation, a batch normalization (BN), and a SiLU activation function. In practice, with the exception of the first CBS block, which uses a convolutional layer with kernel size 6, stride 2, and padding size 2, the others in the backbone are all with kernel size 3 and stride 2. The SCP1_x block is derived from the cross stage partial network [45], and used to enhance model learning capability while ensuring lightweight. It splits the input feature into two paths. One path passes through a CBS model followed by X residual structures, while the other goes directly through a CBS block. Finally, the outputs of the two paths are concatenated and then go through a CBS model. The SPPF block is a fast version of spatial pyramid pooling, which can integrate the feature maps of different receptive fields at a low computational cost. As shown in Figure 8, firstly, a CBS block with kernel size 1 is used to halve the feature channel, and then three serial Maxpool operations are used to obtain three feature maps of different receptive fields, and finally, the above four outputs are concatenated followed by a CBS block with kernel size 1 to restore the original feature channel.
The Neck module fuses and combines the feature maps generated from the backbone module through the FPN-PAN [46] structure. It is mainly constructed by four CBS blocks, four CSP2_X blocks, some concatenation and upsampling operations. The CSP2_X block is similar to the CSP1_X block but does not have a shortcut connection in the residual structure. As shown in Figure 8, the FPN structure can propagate semantically strong features via a top-bottom path, while the PAN structure boosts the propagation of localization information existing in the shallower layer via a bottom-top path. This dual fusion strategy ensures that each feature layer contains sufficient semantic and localization information, thus, enhancing the ability to detect objects of different sizes and scales.
The prediction head aims to output object detection results from three feature maps with different sizes respectively. Since different feature layers contain different semantic and location information, such multi-scale prediction can improve the final detection results and has become a basic operation in modern object detection models. For each feature layer, the number of channels is first reduced to (nc + 5) × na using a 1 × 1 convolutional layer, where nc means the number of target classes, and na is the default number of anchors set to 3. Then, a detector using the joint loss function, including classification, localization and confidence loss, is used to predict target categories, and generate bounding boxes with confidence. Specifically, localization loss employs a CIoU loss to obtain the more accurate coordinate of object. The confidence loss uses a BCE loss to indicate the reliability of the predicted bounding box. The classification loss also uses BCE loss to predict the class probability of the object in the bounding box. Note that classification loss is disabled in the case of ROI extraction (nc = 1).
With the YOLOv5 described above, a large number of candidate bounding boxes are generated at the same target location, so a non-maximum suppression (NMS) is applied to eliminate the redundant bounding boxes and find the optimal bounding box of the objects to be inspected.
2.3.2. Quality Assessment
Having acquiring a clear image of ROI, we use another YOLOv5m model as the basic network for quality assessment, and propose an improvement described below. Note that the value of nc in prediction head is set to 2, as the solder joint needs to be judged as fine or bad.
The difference between the qualified and unqualified solder joints is subtle and mainly concentrated in the contour and gray characteristics. To make the model focus more on these indistinctive characteristics and suppress other useless information, we introduced an attention structure, SE block [45], before the SPPF block in backbone. The SE block illustrated in Figure 8 mainly contains two operations of squeeze and excitation. First, the squeeze operation performs a global average pooling on the input feature to encode the spatial feature on each channel into a constant statistic . Then, in the excitation operation, two 1 × 1 convolutional layers and non-linearity activations are used to fully capture channel-wise dependencies and yield the weight for each input channel. In addition, the channel-wise multiplication between the input and the learned weight results in the final output of the SE block. Formally, given an input , the output in SE block can be represented as
where and denotes the ReLU and Sigmoid activation functions respectively. and refer to the parameters of two 1 × 1 convolutional layers used to reduce and increase the dimensionality respectively. By this means, our model can adaptively learn the importance of different channels for the current task and reassign their weights accordingly.
3. Experiment and Analysis
3.1. Experimental Setups
3.1.1. Implementation Details
Our two-phase detection approach is implemented using Pytorch framework on a Windows 10 platform, which has an Intel i9-7900X CPU and an NVIDIA GeForce RTX2070 (8 GB) GPU for acceleration. The software environment is CUDA 10.2, CUDNN 7.6, and Python 3.7. Two YOLOv5 models used for ROI extraction and quality assessment are trained separately. We update the network parameters using SGD optimizer with momentum 0.937 and weight decay 0.0005. Batch size and the maximum epoch are set to 8 and 600, respectively. The OneCycleLR scheduler with lr_man = 0.01 and lr_mix = 0.001 is adopted to adjust the learning rate during each epoch. During the training, depending on the respective training dataset, the optimal values of anchor boxes in two models are adaptively calculated using k-means clustering algorithm. Meanwhile, adaptive image scaling is utilized to resize the images to a size where the longest side is 640.
3.1.2. Dataset
Two home-made datasets are provided to demonstrate the applicability of the proposed solder joint quality inspection system, including an ROI extraction dataset and a quality assessment dataset. They are collected from the production line of an astronautics electronics equipment manufacturing factory in Beijing, China. The ROI extraction dataset contains 60 training samples and 60 testing samples with a resolution of 1920 × 1080 pixels. The quality assessment dataset consists of 150 training samples and 150 testing samples, whose raw resolutions are about 1500 × 160 pixels. High-quality annotations of all samples are provided by the strategy described earlier, and the examples with annotations of two datasets are shown in Figure 6. Meanwhile, to avoid the overfitting problem for the models, the training samples in both datasets are enhanced by the five image enhancement methods described earlier. The luminance of the testing samples in the two datasets is also reduced and increased respectively to test the performance of the proposed method under different lighting conditions.
3.1.3. Evaluation Criteria
We evaluate our method using the following criteria: Precision, Recall, AP, and mAP. Precision is used to evaluate whether the predictions of objects are accurate, and Recall is adopted to evaluate whether all the objects have been inspected. They are computed as follows:
where TP, FP, and FN mean the number of positive samples with correct prediction, negative samples with false prediction and positive samples with incorrect prediction, respectively.
AP represents the average precision, the value of which is the area under the Precision-Recall curve. AP@0.5 is the value of AP when IoU threshold is set to 0.5, and AP@0.5:0.95 is the average value of AP when IoU threshold is set to 0.5 to 0.95 with an interval of 0.05. The mAP denotes the mean average precision, which is calculated by summing the AP of all classes and then dividing by the number of classes. Formally, the AP and mAP are formulated as
3.2. Results for ROI Extraction
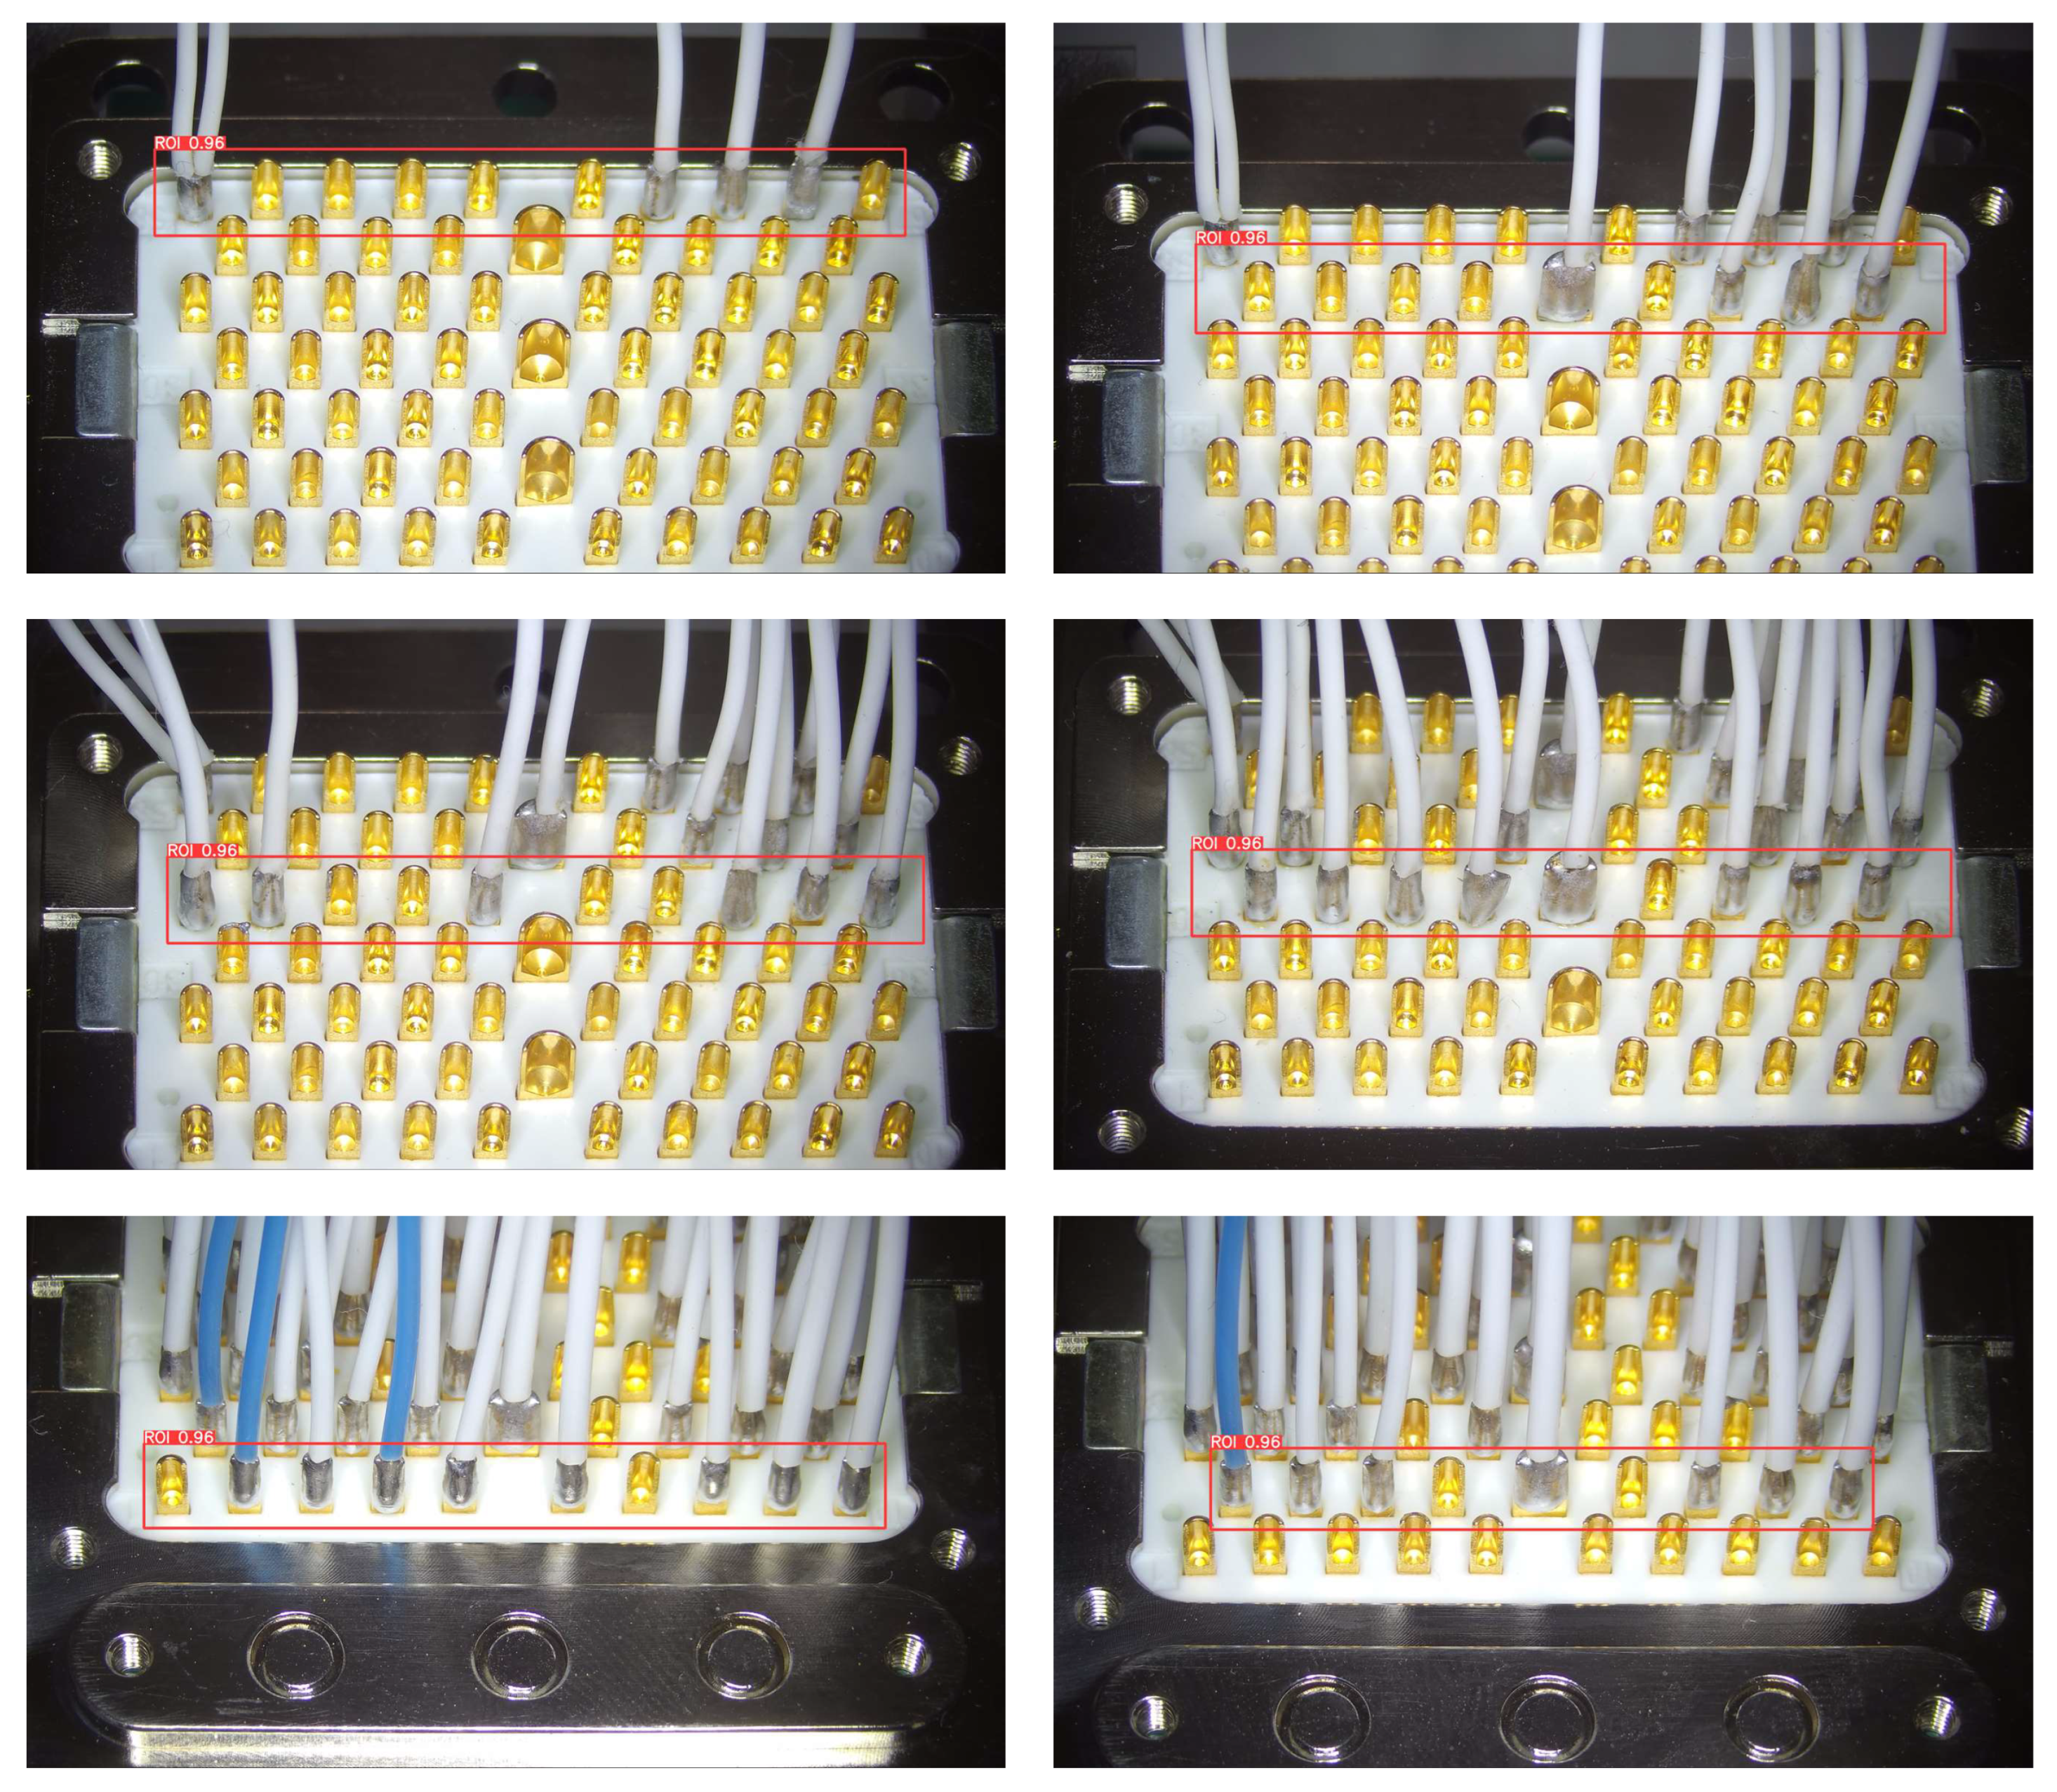
Figure 9 visualizes the training loss of the YOLOv5 model used for ROI extraction, including localization, classification and confidence losses. It can be seen that the classification loss is not available and its value is always 0, since ROI extraction is a single target detection problem. Meanwhile, as the number of iterations rises, the two remaining curves gradually converge and the final loss values fall to close to zero. This means that the training process of the model used for ROI extraction should be correct.

Figure 9.
The curves of training loss on ROI extraction.
The performance comparison of different methods on ROI extraction are listed in Table 2, and the partial visual results results of our method are shown in Figure 10. As can be seen from the data in Table 2, the most striking observation is that both precision and recall values of our adopted YOLOv5 can reach 100%. The AP values at two different thresholds are also high, which are 99.5% and 99.3%, respectively. Another mainstream one-stage detector, the SSD, has an acceptable detection speed of 0.019 s, but its performance is relatively poor. Although the Faster R-CNN, a representative of the two-stage detector, is competitive in terms of individual criteria, it takes 0.097 s to detect a single image, which is much slower than the 0.013 s of our method. Figure 10 shows that with the adopted YOLOv5 model, the rows to be detected (i.e., the ROI) can all be detected with high confidence, without interference from the cables behind them.

Table 2.
Performance comparison of different methods on ROI extraction.
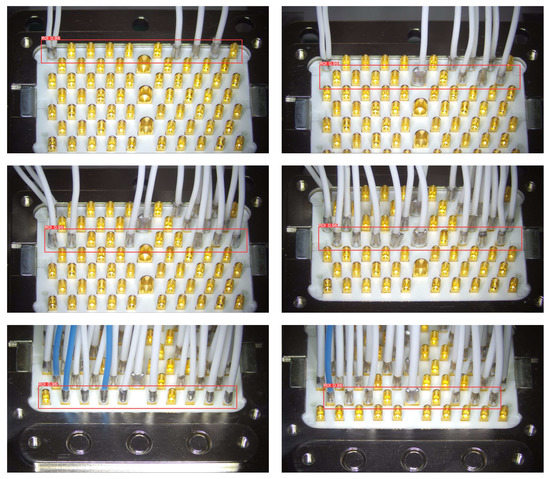
Figure 10.
Visual results of the adopted YOLOv5 on ROI extraction.
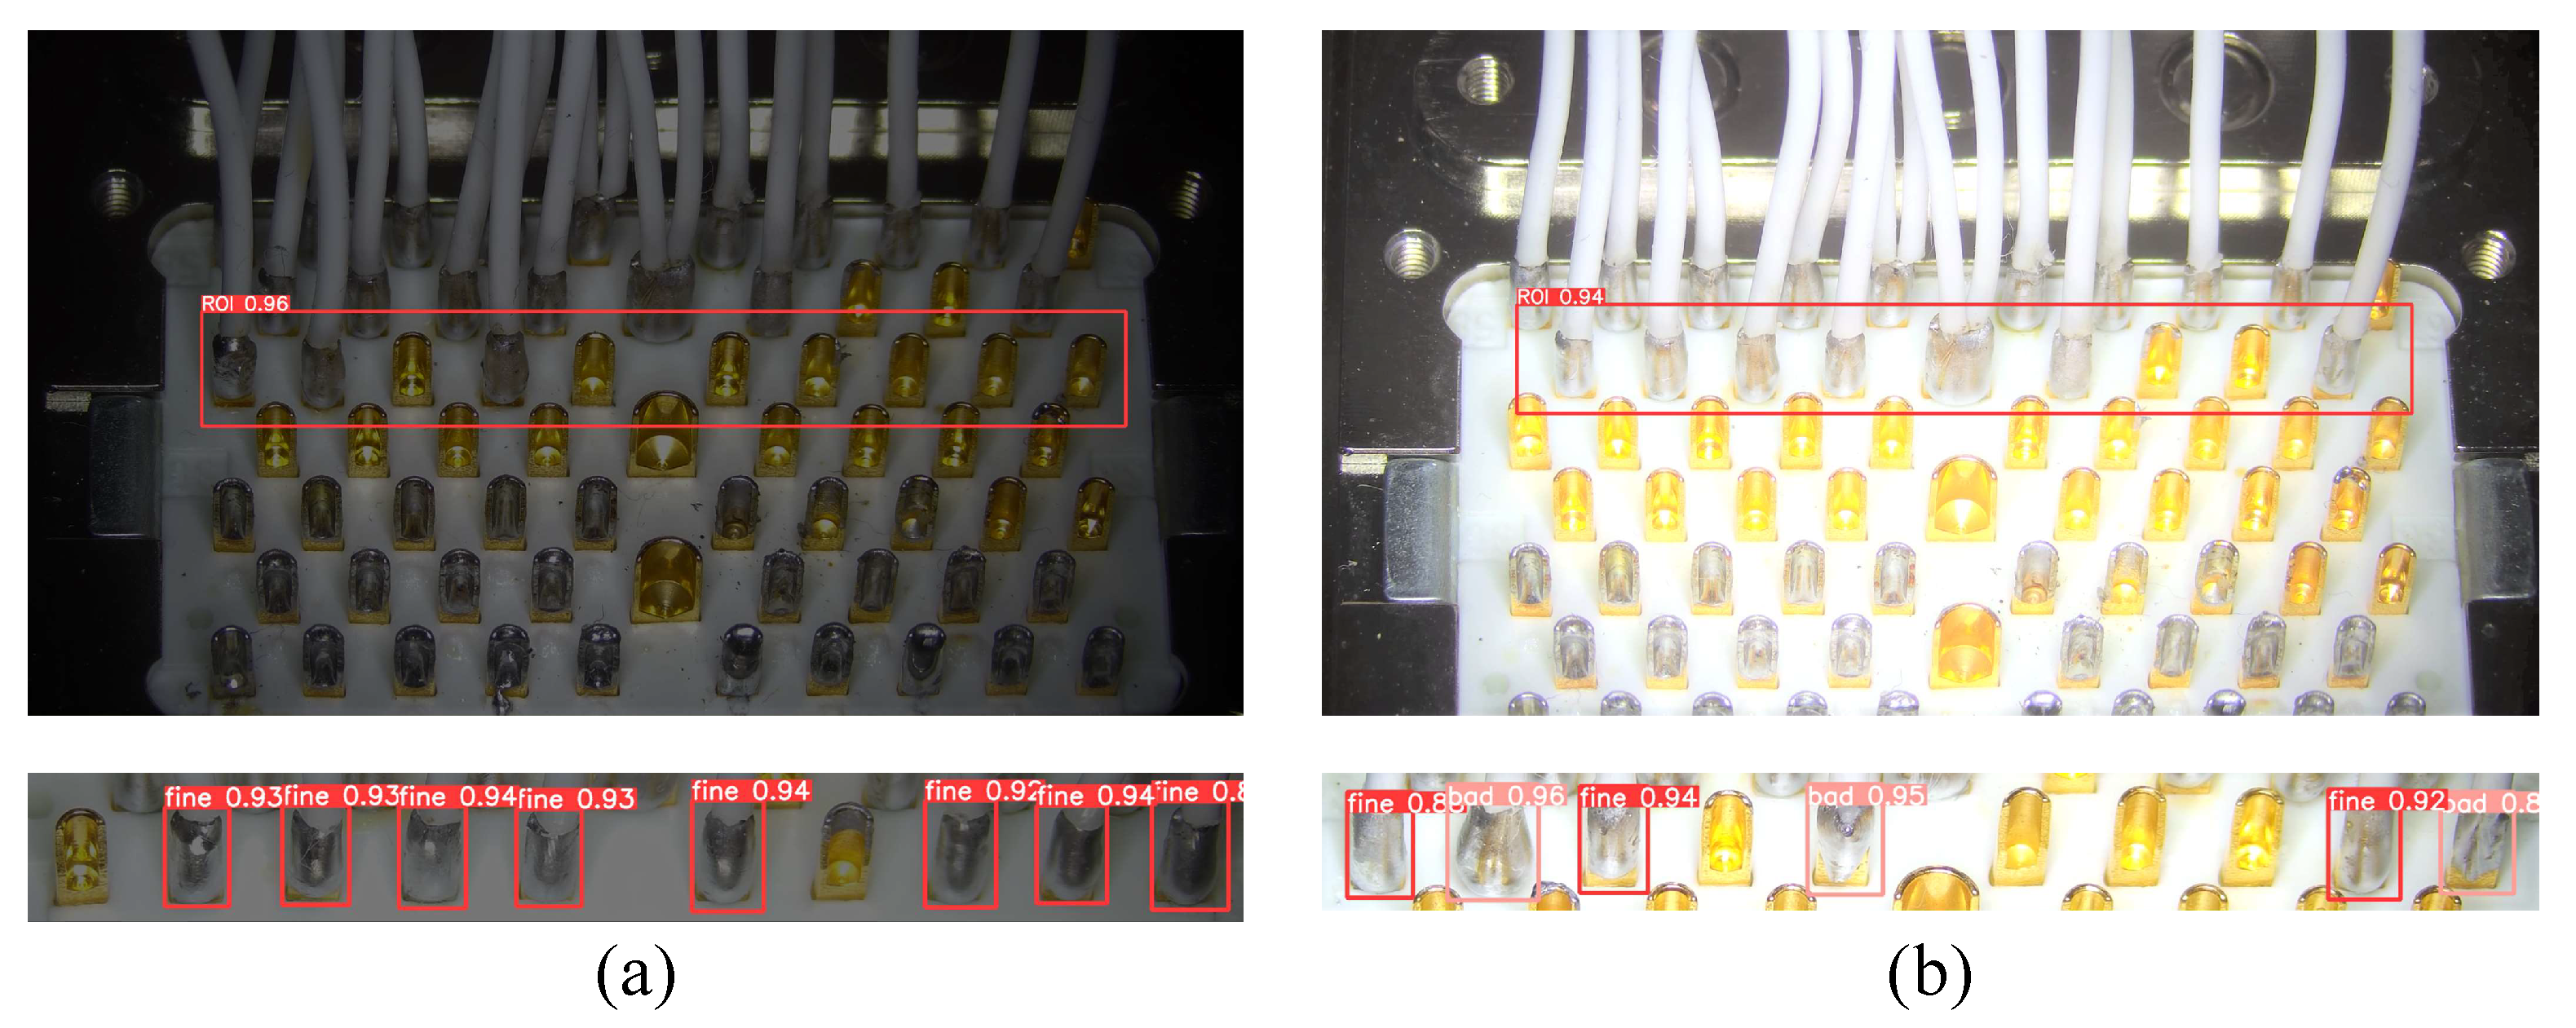
To verify the robustness of the method used for ROI extraction to lighting, we test it on the ROI extraction dataset with different levels of lighting conditions. As can be seen in Figure 11, our method has strong light resistance and can always locate the ROI accurately. From Table 3, we can observe that the used model, YOLOv5, consistently maintains a high performance regardless of whether the light gets brighter or darker. The above numerical and visual results consistently show that the original YOLOv5, after fine-tuning, is fully competent for the ROI extraction task. Meanwhile, it has excellent robustness to lighting, making it ideal for use in industrial scenarios where the environment is uncertain.
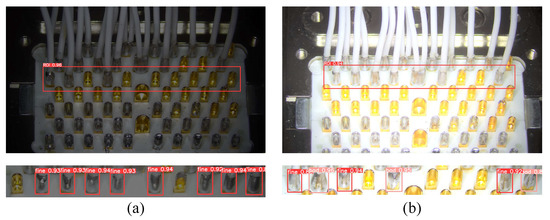
Figure 11.
Visual results of our method under different levels of lighting conditions. (a) Low light; (b) high light.

Table 3.
Quantitative results of our method under different levels of lighting conditions. P, R, mAP and mAP mean Precision, Recall, mAP@0.5, and mAP@0.5:0.95, respectively.
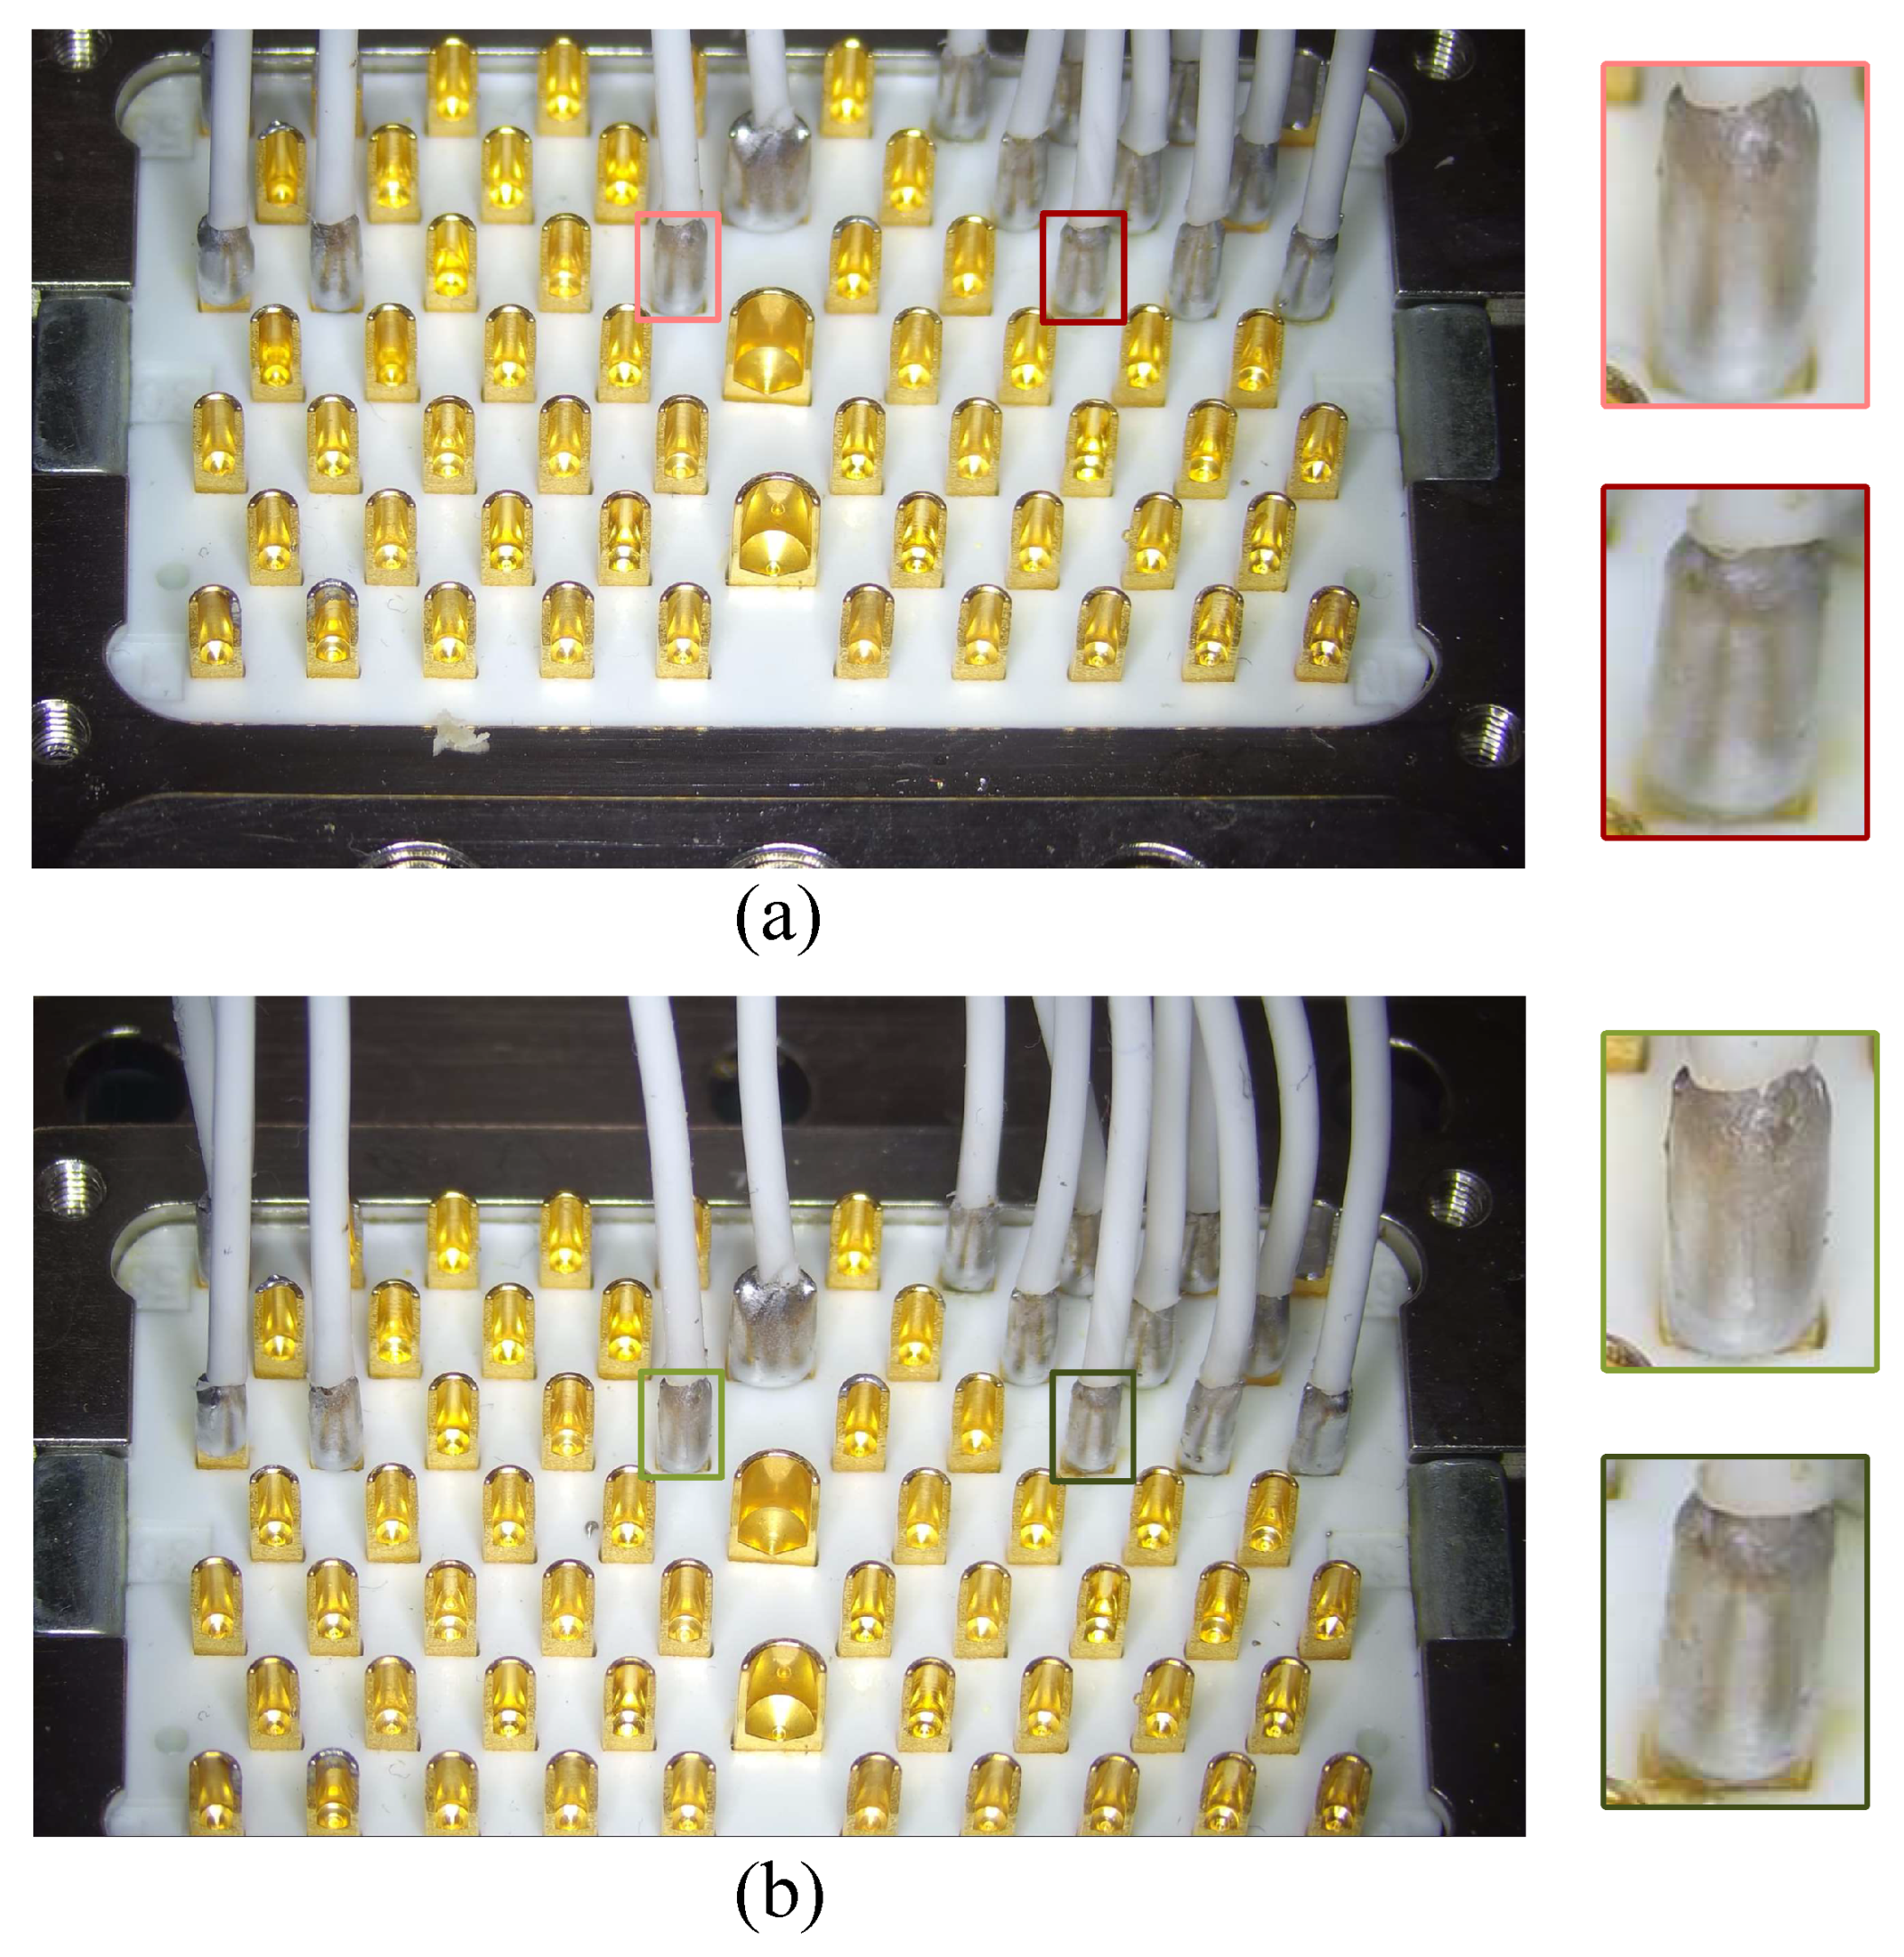
Figure 12 shows the importance of ROI extraction for the solder joint quality inspection on aviation plugs. From Figure 12a, we can observe that the row of solder joints to be inspected, located at the top or bottom of the aviation plug, are not within the DoF of the camera before the fine-adjusting, so their surface is blurred. Obviously, direct inspection at this moment is prone to false detections. After the ROI extraction, the row of solder joints to be inspected is fine-adjusted into the camera’s DoF using a sliding platform. Consequently, the captured images of the solder joints shown in Figure 12b become clear and shiny, which will facilitate the subsequent quality assessment task.
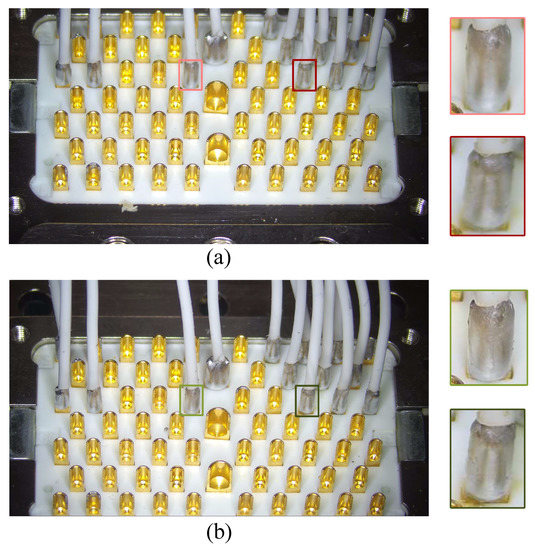
Figure 12.
The comparison of ROI before (a) and after (b) the fine-adjusting.
3.3. Results for Quality Assessment
The comparison between the different methods on quality assessment is tabulated in Table 4. It can be seen that the detection performance of the SSD model is poor and clearly cannot meet the need for accurate detection. Compared to the SSD model, the Faster R-CNN performs much better, with a precision of 94.3% and a mAP@0.5 of 94.6%. However, its recognition speed is slow and cannot meet the demand of real-time detection. The precision, recall and mAP@0.5 values of the original YOLOv5 model are 99.98%, 100% and 99.5% respectively, reaching a very high peak with little room for improvement. While under the condition that the IoU threshold is set from 0.5 to 0.95, its mAP@0.5:0.95 value is only 91.4%. To make the model focus more on the features helpful for quality assessment, we introduce an SE block into the original YOLOv5 model, namely the YOLOv5-Ours model. It can be observed that by adding the SE block, the YOLOv5-Ours gets a decent improvement of 5.4% and there is no increase in detection speed.

Table 4.
Performance comparison of different methods on quality assessment.
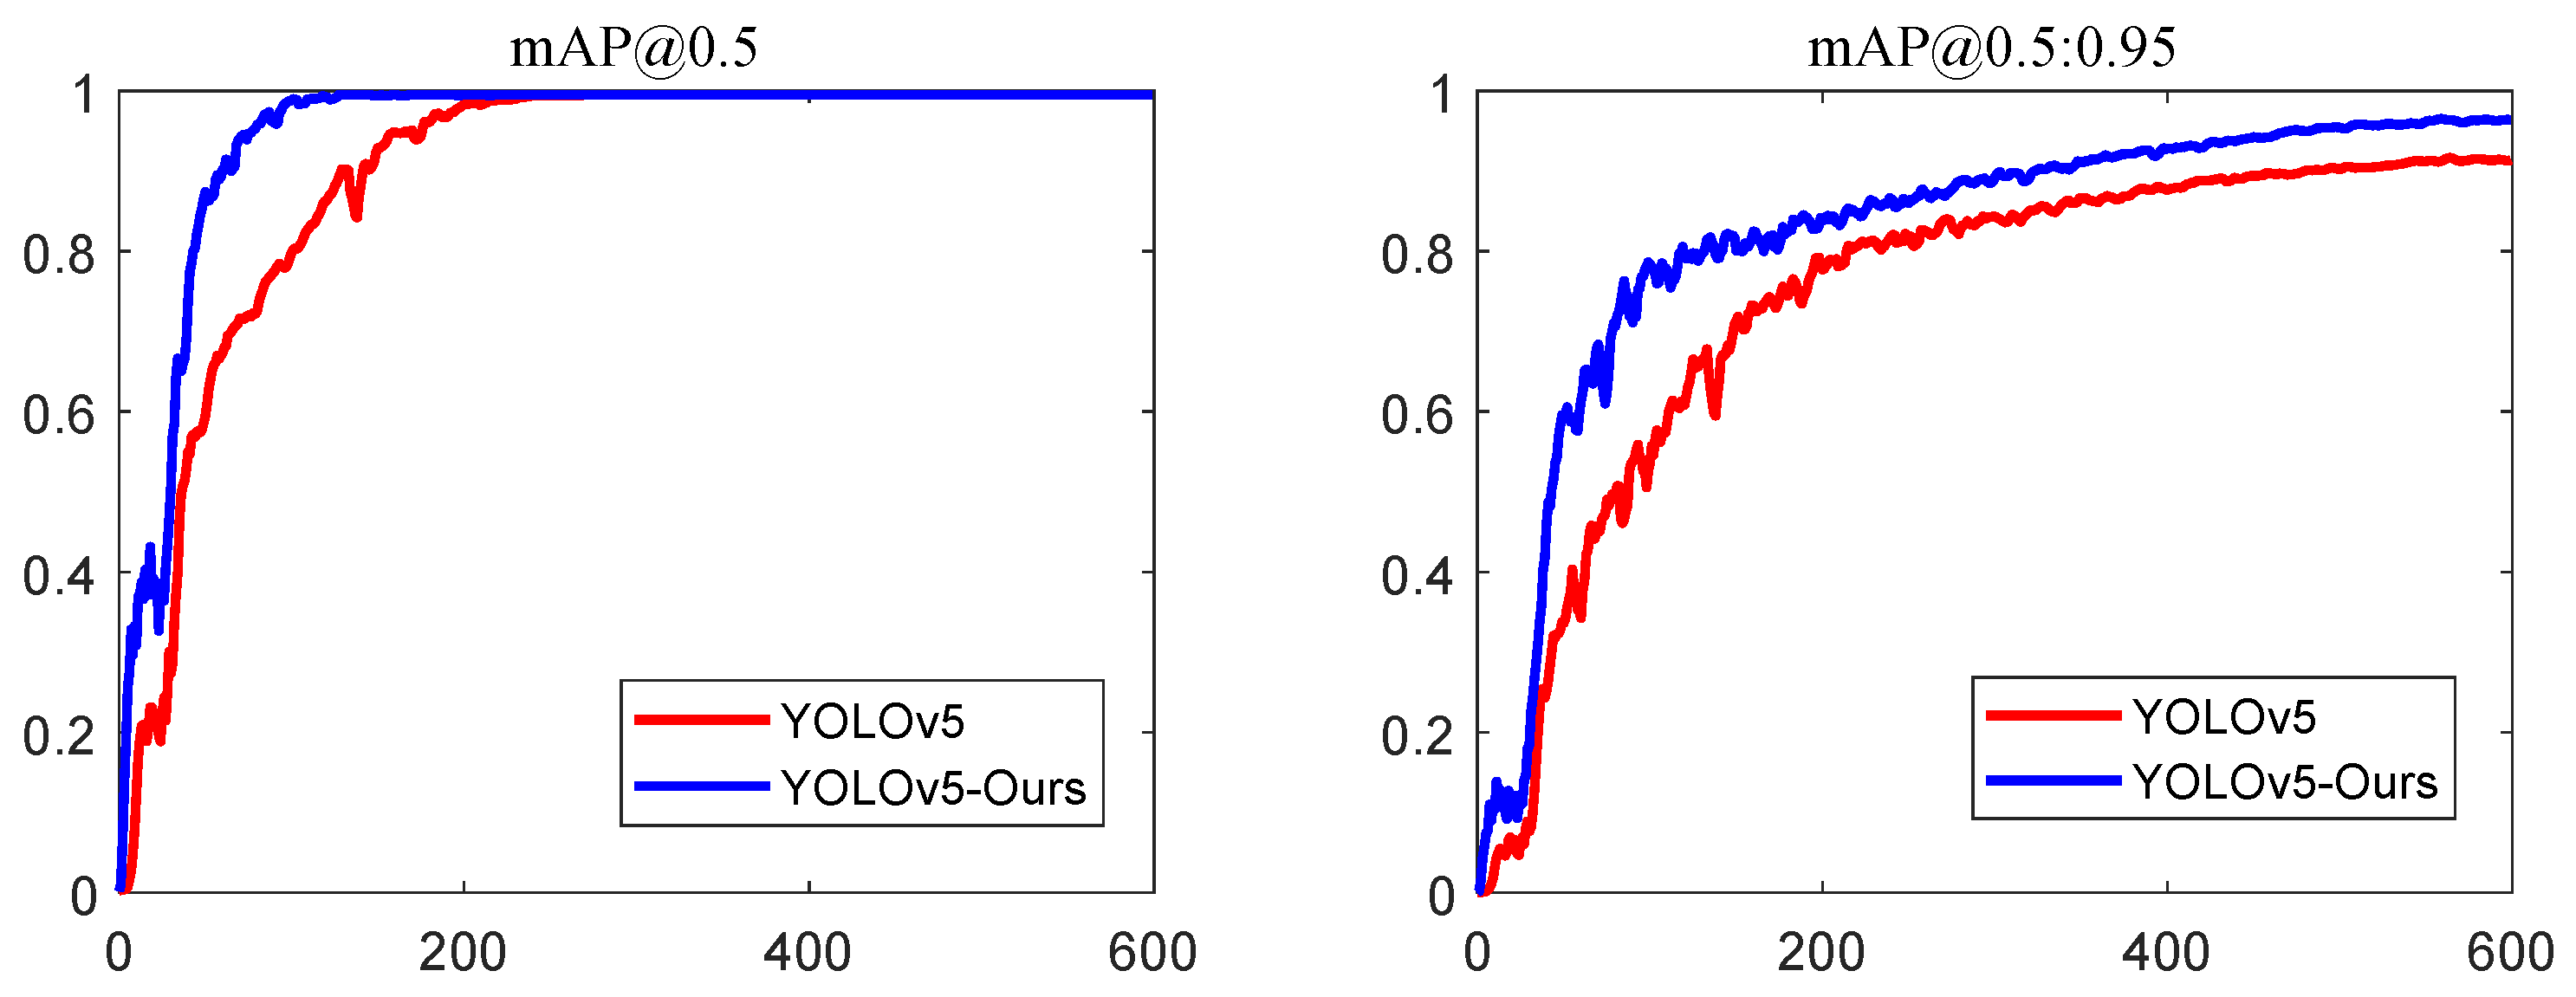
The results in Figure 13 are consistent with the conclusion drawn from Table 4. We can clearly observe from the comparison curves that as the iteration increases, the mAP@0.5 values of two models gradually stabilize and reach a similar maximum value. It should be noted that the mAP@0.5 curve of YOLOv5-Ours rises more steeply and peaks earlier, meaning it is easier to optimize after improvement. Another noteworthy finding is that the mAP@0.5:0.95 curve of YOLOv5-Ours is consistently higher than that of YOLOv5 throughout the training process.
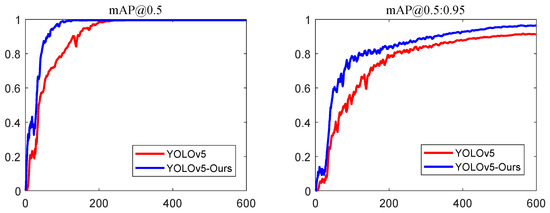
Figure 13.
The Comparison of mAP curves between the two models on quality assessment.
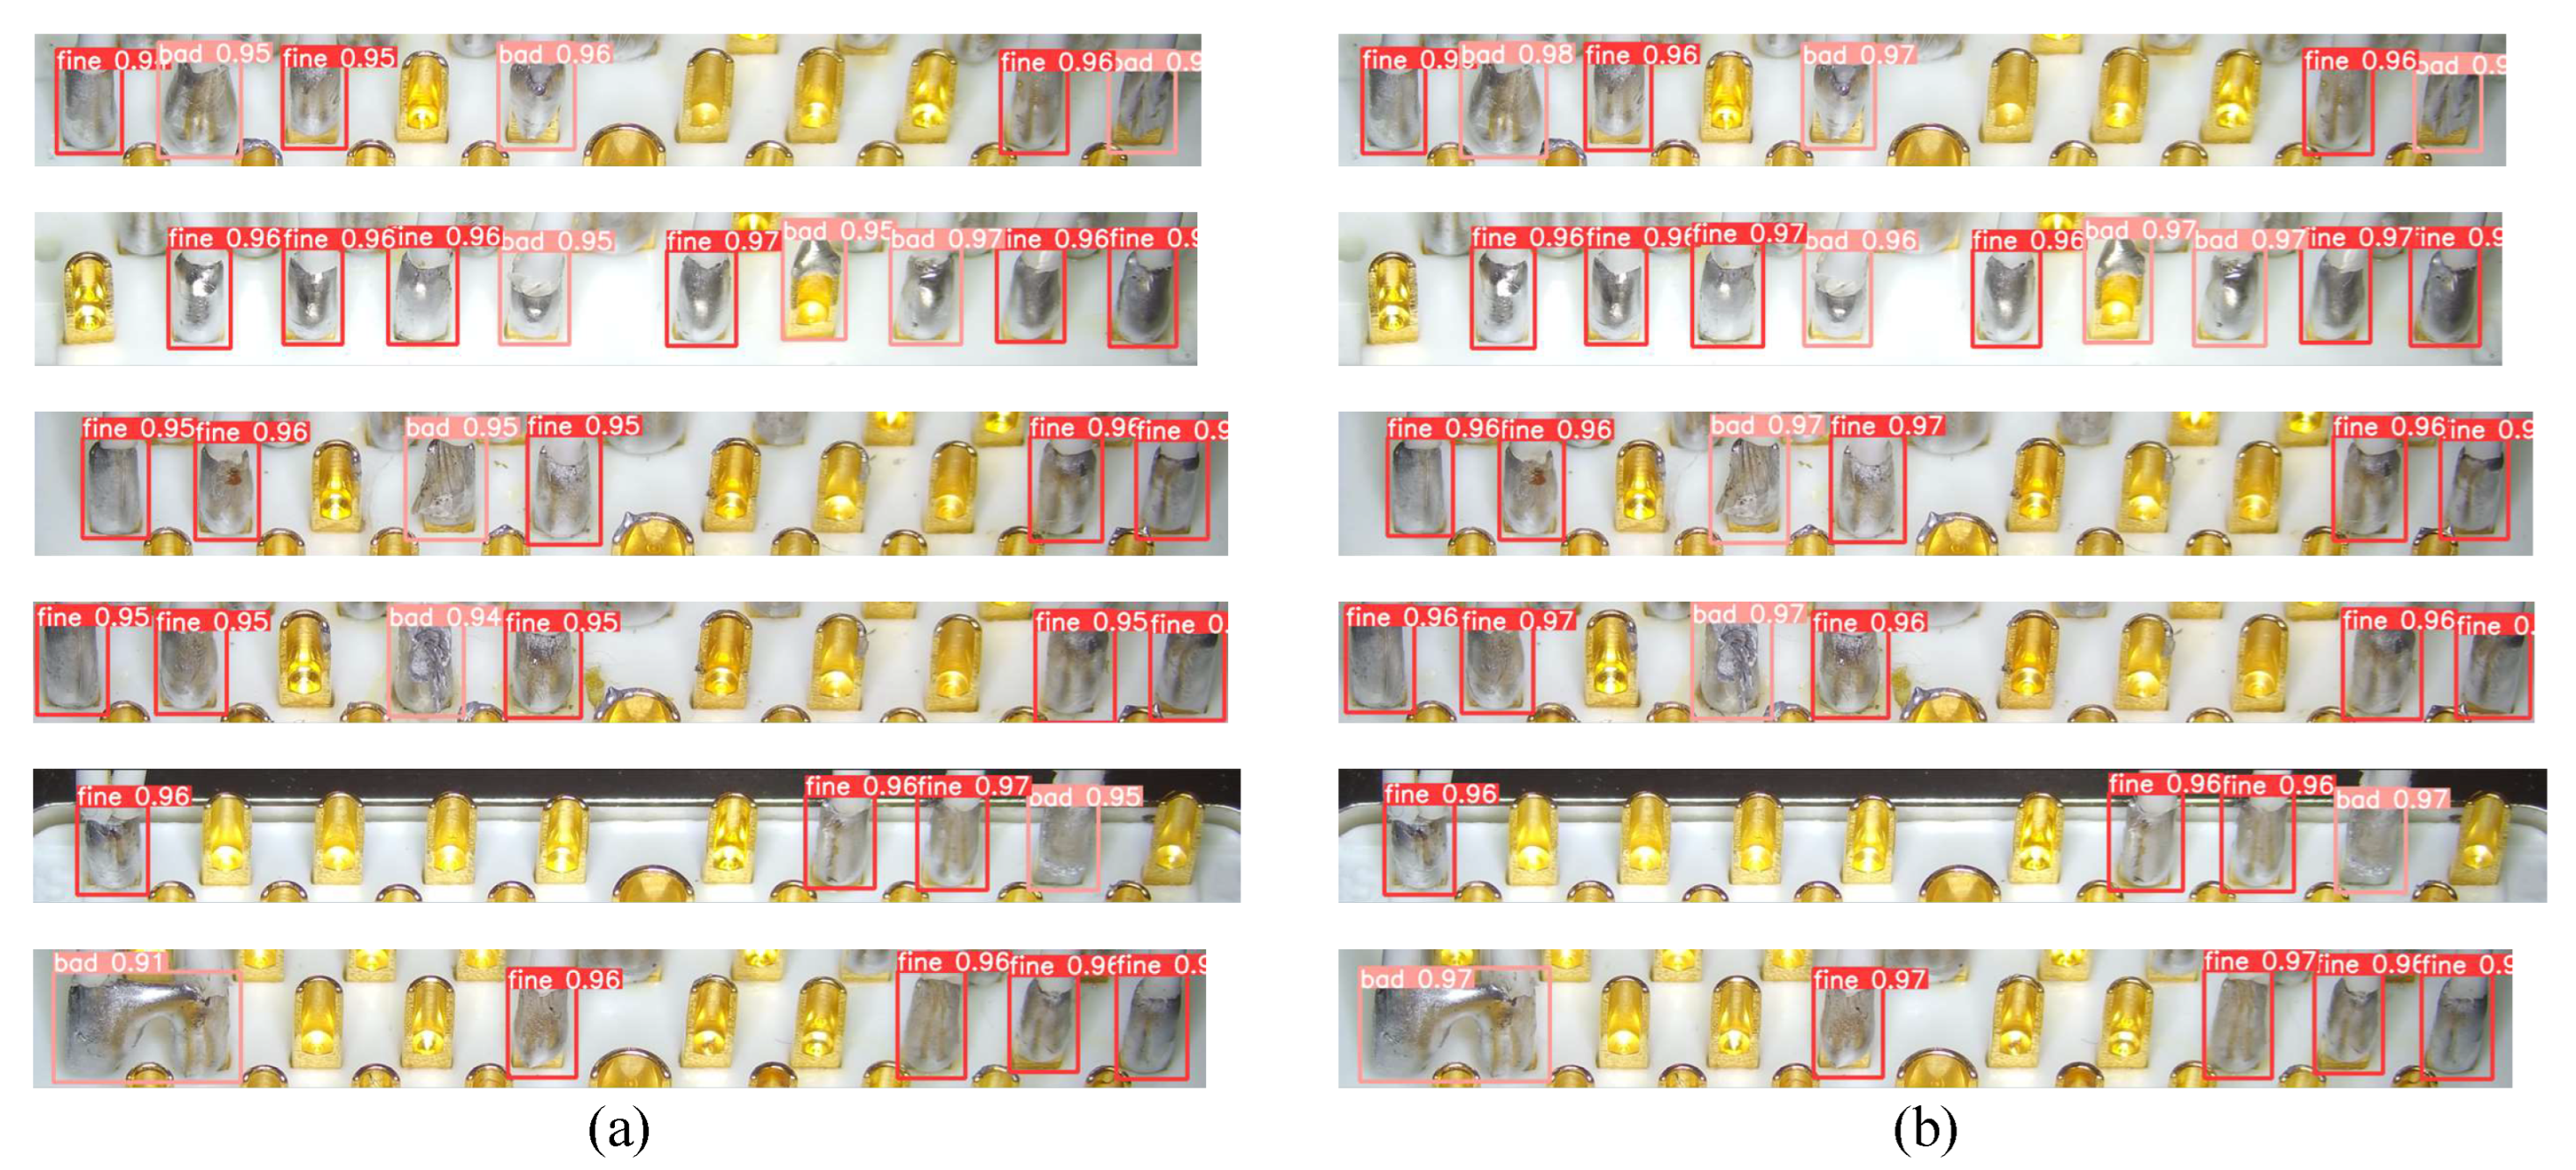
From Figure 14, it can be clearly observed that the original YOLOv5 model can successfully detect and correctly classify solder joints, but the confidence of the detection results is not at a high level, ranging from 0.91 to 0.96. The reason for this may be that the distinction between normal and abnormal solder joints is not obvious, making it difficult for the original model to distinguish them with certainty. With the addition of SE block, our model can automatically learn more information that is useful for quality assessment, resulting in a better confidence score in the prediction, ranging from 0.96 to 0.98. Higher confidence means that the abnormal solder joints can be detected more accurately and have more reliable performance. Meanwhile, the quantitative results of quality assessment in Table 3 show that the YOLOv5-Ours model is almost unaffected and continues to perform well at both low and high light. The visual results in Figure 11 are also consistent with this, demonstrating that YOLOv5-Ours model is less sensitive to lighting changes. The above results show that by introducing the SE block, our model can be better adapted to the needs of engineering applications.
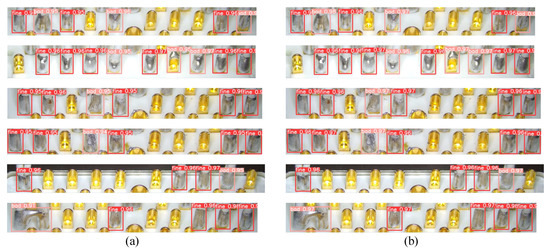
Figure 14.
The visual comparison of quality assessment before (a) and after (b) improvement.
3.4. Results on Production Lines
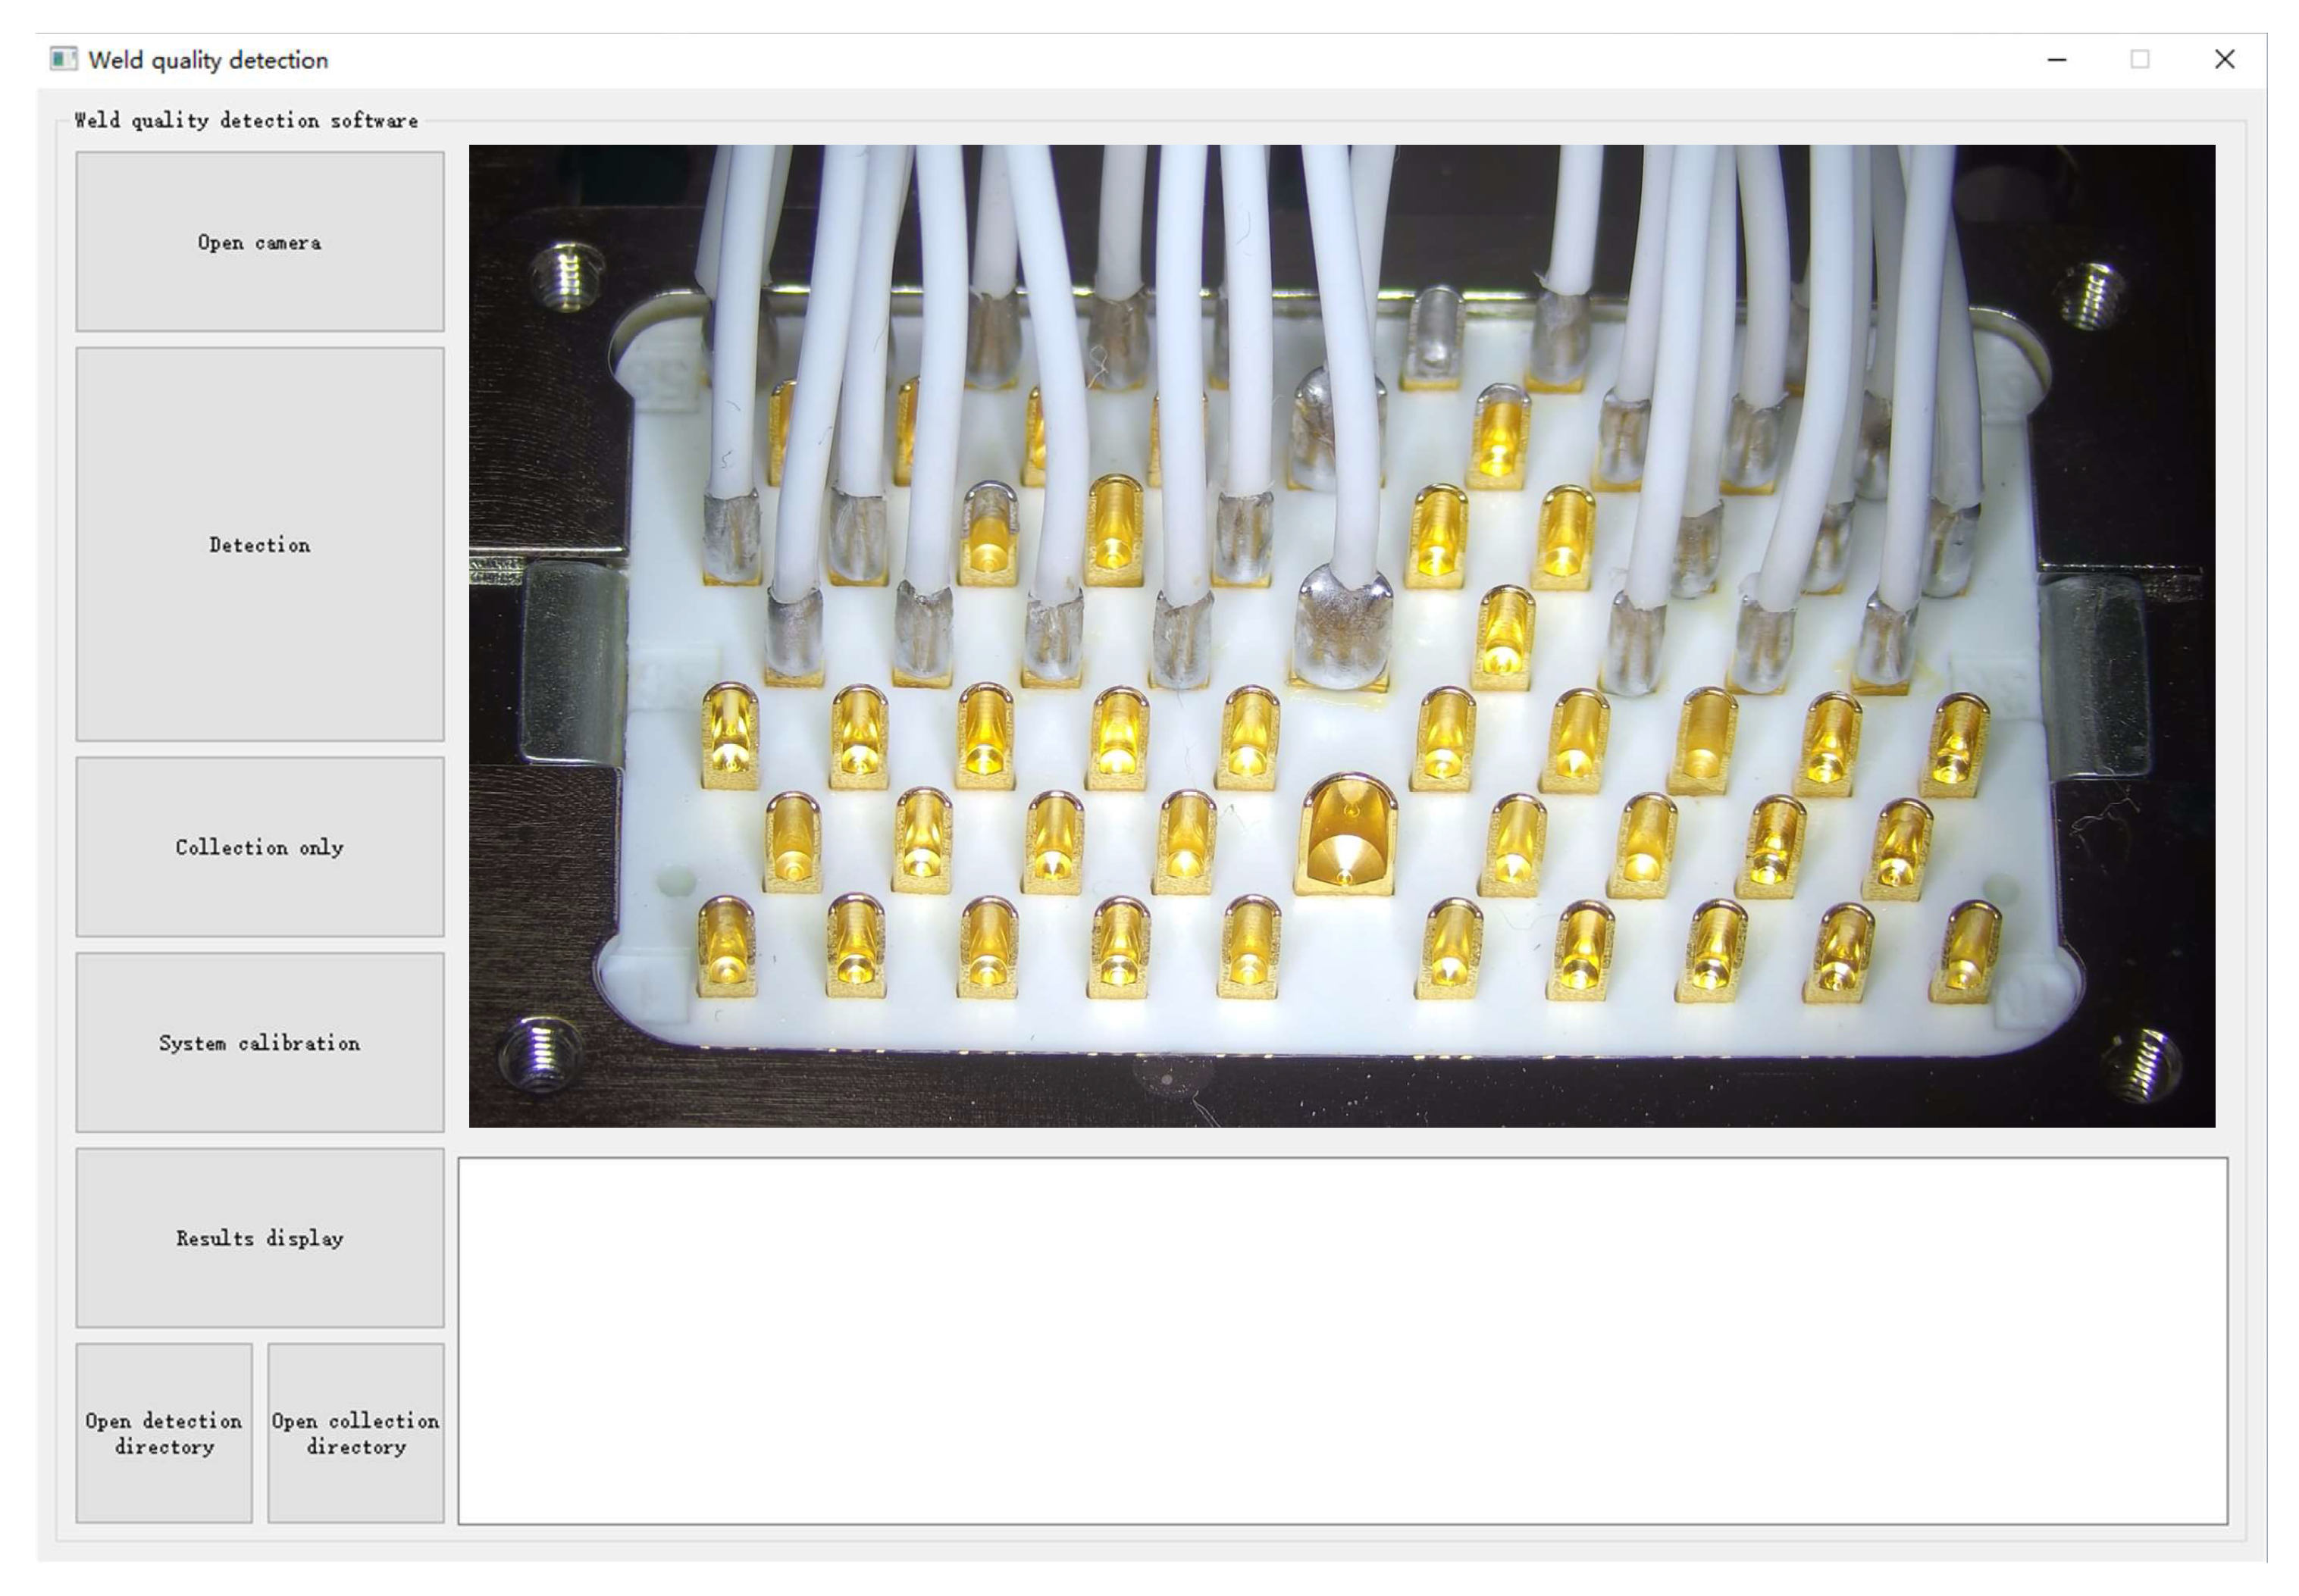
After the two YOLOv5 models are fine-tuned separately on their respective training datasets, they could have been directly integrated into the designed solder joint quality inspection system. However, since the ultimate aim of this work is to propose an accurate and automated solder joint inspection method for application in real production, we develop a simple and easy-to-use graphical interface software shown in Figure 15 for workers to operate. In addition, it is implemented with PyQT5, where the toolbox of Qt Designer is need. After clicking on the “Detection” button, the software will read the real-time image from the camera and display the processed result on the right. Once a defect is detected, manual confirmation is forced before the next step can be taken. At the same time, the abnormal parts are recorded for later review. A demo video of our system in action is available to view (https://pan.baidu.com/s/13Gt9eT9yRR-bEZW2MTwUbg?pwd=0927) (accessed on 22 March 2023).
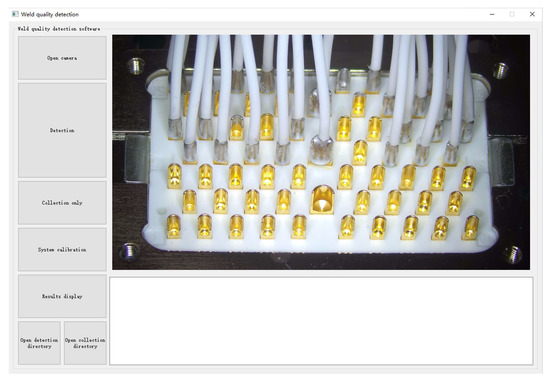
Figure 15.
The developed graphical interface software of inspection system.
The developed inspection system has been successfully used on a complex real production line for about a month and has shown strong performance. For ROI extraction, the detection speed is relatively fast at 0.06 s with a high detection accuracy of more than 99.8%. For the quality assessment, the detection accuracy can reach 97.8% at a speed of less than 0.1 s. Overall, the proposed system can meet the requirements for accurate and continuous solder joints quality inspection of aviation plugs. In addition, the cost of the system built is mainly for the camera and computer, with a total value of only about RMB 25,000. Its application on production lines significantly reduces quality inspection time and increases production speed. It also minimizes the rate of non-conforming products and enhances the competitiveness of the products, which has a profound effect on increasing the economic efficiency of the manufacturer.
4. Conclusions and Future Work
An automated inspection system is presented in this paper for accurate quality evaluation of solder joints on aviation plugs. According to the characteristics of the aviation plug, we specially designed a sampling system to capture small solder joints from an oblique angle of 60. Then, two fine-tuned YOLOv5 models are used for ROI extraction and quality assessment respectively to effectively recognize the defective solder joints. Finally, an easy-to-use GUI is designed and successfully deployed into a real-world production line. The experimental results show that our method can quickly inspect the defects of solder joints with high accuracy and high confidence. Moreover, our method has a strong robustness to changes in lighting conditions. Therefore, we conclude that our system can meet the requirements of actual production.
Although our inspection system achieves promising assessment results for weld quality on aviation plug, it can only identify the localization of the defective solder joints. Meanwhile, our method still requires a high hardware configuration for fast detection. In the future, we plan to conduct research on how to determine the attributes of defective solder joints and use pruning technology to optimize our method for deployment into mobile applications.
Author Contributions
Conceptualization, J.S.; methodology, J.S. and J.W.; software, J.S. and H.H.; validation, J.S., J.W. and H.H.; formal analysis, J.S.; investigation, J.W.; resources, H.H.; data curation, J.W. and H.H.; writing—original draft preparation, J.S.; writing—review and editing, J.W. and G.X.; visualization, H.H.; supervision, Y.Y.; project administration, Y.Y. and G.X.; funding acquisition, Y.Y. and G.X. All authors have read and agreed to the published version of the manuscript.
Funding
This research was supported in part by National Natural Science Foundation of China: 62073161; Postgraduate Research & Practice Innovation Program of Jiangsu Province: Grant KYCX21_0202.
Data Availability Statement
Data are unavailable due to privacy or ethical restrictions.
Conflicts of Interest
The authors declare no conflict of interest.
References
- Li, H.; Lyu, K.; Yong, Z.; Xiaolong, W.; Qiu, J.; Liu, G. Multichannel parallel testing of intermittent faults and reliability assessment for electronic equipment. IEEE Trans. Components Packag. Manuf. Technol. 2020, 10, 1636–1646. [Google Scholar] [CrossRef]
- Zhang, M.; Feng, J.; Niu, S.; Shen, Y. Aviation plug clustering based fault detection method using hyperspectral image. In Proceedings of the 2020 39th Chinese Control Conference (CCC), Shenyang, China, 27–29 July 2020; pp. 6018–6022. [Google Scholar]
- Aleshin, N.P.; Kozlov, D.M.; Mogilner, L.Y. Ultrasonic testing of welded joints in polyethylene pipe. Russ. Eng. Res. 2021, 41, 123–129. [Google Scholar] [CrossRef]
- Amiri, N.; Farrahi, G.H.; Kashyzadeh, K.R.; Chizari, M. Applications of ultrasonic testing and machine learning methods to predict the static & fatigue behavior of spot-welded joints. J. Manuf. Process. 2020, 52, 26–34. [Google Scholar]
- Sazonova, S.A.; Nikolenko, S.D.; Osipov, A.A.; Zyazina, T.V.; Venevitin, A.A. Weld defects and automation of methods for their detection. J. Phys. Conf. Ser. 2021, 1889, 022078. [Google Scholar] [CrossRef]
- Tang, Y.; Wang, C.; Zhang, X.; Zhou, Z.; Lu, X. Research on Intelligent Detection Method of Forging Magnetic Particle Flaw Detection Based on YOLOv4. In Advanced Manufacturing and Automation XII; Springer Nature: Singapore, 2023; pp. 129–134. [Google Scholar]
- Zolfaghari, A.; Zolfaghari, A.; Kolahan, F. Reliability and sensitivity of magnetic particle nondestructive testing in detecting the surface cracks of welded components. Nondestruct. Test. Eval. 2018, 33, 290–300. [Google Scholar] [CrossRef]
- Yu, H.; Li, X.; Song, K.; Shang, E.; Liu, H.; Yan, Y. Adaptive depth and receptive field selection network for defect semantic segmentation on castings X-rays. NDT E Int. 2020, 116, 102345. [Google Scholar] [CrossRef]
- Su, L.; Wang, L.Y.; Li, K.; Wu, J.; Liao, G.; Shi, T.; Lin, T. Automated X-ray recognition of solder bump defects based on ensemble-ELM. Sci. China Technol. Sci. 2019, 62, 1512–1519. [Google Scholar] [CrossRef]
- Zhang, K.; Shen, H. Solder joint defect detection in the connectors using improved faster-rcnn algorithm. Appl. Sci. 2021, 11, 576. [Google Scholar] [CrossRef]
- Zhang, K.; Shen, H. An Effective Multi-Scale Feature Network for Detecting Connector Solder Joint Defects. Machines 2022, 10, 94. [Google Scholar] [CrossRef]
- Sun, J.; Li, C.; Wu, X.J.; Palade, V.; Fang, W. An effective method of weld defect detection and classification based on machine vision. IEEE Trans. Ind. Inform. 2019, 15, 6322–6333. [Google Scholar] [CrossRef]
- Long, Z.; Zhou, X.; Zhang, X.; Wang, R.; Wu, X. Recognition and classification of wire bonding joint via image feature and SVM model. IEEE Trans. Components Packag. Manuf. Technol. 2019, 9, 998–1006. [Google Scholar] [CrossRef]
- Peng, Y.; Yan, Y.; Chen, G.; Feng, B. Automatic compact camera module solder joint inspection method based on machine vision. Meas. Sci. Technol. 2022, 33, 105114. [Google Scholar] [CrossRef]
- Wenjin, L.; Peng, X.; Xiaozhou, L.; Wenju, Z.; Minrui, F. Modified Fusion Enhancement Algorithm Based on Neighborhood Mean Color Variation Map for AOI Solder Joint Detection. In Proceedings of the 2022 41st Chinese Control Conference (CCC), Hefei, China, 25–27 July 2022; pp. 6521–6526. [Google Scholar]
- Zhang, M.; Lu, Y.; Li, X.; Shen, Y.; Wang, Q.; Li, D.; Jiang, Y. Aviation plug on-site measurement and fault detection method based on model matching. In Proceedings of the 2019 IEEE International Instrumentation and Measurement Technology Conference (I2MTC), Auckland, New Zealand, 20–23 May 2019; pp. 1–5. [Google Scholar]
- Shah, H.N.M.; Sulaiman, M.; Shukor, A.Z.; Kamis, Z.; Ab Rahman, A. Butt welding joints recognition and location identification by using local thresholding. Robot. Comput.-Integr. Manuf. 2018, 51, 181–188. [Google Scholar] [CrossRef]
- Fonseka, C.; Jayasinghe, J. Implementation of an automatic optical inspection system for solder quality classification of THT solder joints. IEEE Trans. Components Packag. Manuf. Technol. 2018, 9, 353–366. [Google Scholar] [CrossRef]
- Ieamsaard, J.; Muneesawang, P.; Sandnes, F. Automatic optical inspection of solder ball burn defects on head gimbal assembly. J. Fail. Anal. Prev. 2018, 18, 435–444. [Google Scholar] [CrossRef]
- Cai, N.; Ye, Q.; Liu, G.; Wang, H.; Yang, Z. IC solder joint inspection based on the Gaussian mixture model. Solder. Surf. Mt. Technol. 2016, 28, 207–214. [Google Scholar] [CrossRef]
- Wu, H.; You, T.; Xu, X.; Rodic, A.; Petrovic, P.B. Solder joint inspection using imaginary part of Gabor features. In Proceedings of the 2021 6th IEEE International Conference on Advanced Robotics and Mechatronics (ICARM), Chongqing, China, 3–5 July 2021; pp. 510–515. [Google Scholar]
- Kumar, N.P.; Varadarajan, R.; Mohandas, K.N.; Gundu, M.K. Weld Microstructural Image Segmentation for Detection of Intermetallic Compounds Using Support Vector Machine Classification. In Recent Advances in Manufacturing, Automation, Design and Energy Technologies: Proceedings from ICoFT 2020; Springer: Singapore, 2022; pp. 455–463. [Google Scholar]
- Cai, N.; Zhou, Y.; Ye, Q.; Liu, G.; Wang, H.; Chen, X. IC solder joint inspection via robust principle component analysis. IEEE Trans. Components Packag. Manuf. Technol. 2017, 7, 300–309. [Google Scholar] [CrossRef]
- Wang, J.; Xu, G.; Li, C.; Wang, Z.; Yan, F. Surface defects detection using non-convex total variation regularized RPCA with kernelization. IEEE Trans. Instrum. Meas. 2021, 70, 5007013. [Google Scholar] [CrossRef]
- Krichen, M.; Lahami, M.; Al–Haija, Q.A. Formal Methods for the Verification of Smart Contracts: A Review. In Proceedings of the 2022 15th International Conference on Security of Information and Networks (SIN), Sousse, Tunisia, 11–13 November 2022; pp. 1–8. [Google Scholar]
- Lin, G.; Wen, S.; Han, Q.L.; Zhang, J.; Xiang, Y. Software vulnerability detection using deep neural networks: A survey. Proc. IEEE 2020, 108, 1825–1848. [Google Scholar] [CrossRef]
- Miller, A.; Cai, Z.; Jha, S. Smart contracts and opportunities for formal methods. In Leveraging Applications of Formal Methods, Verification and Validation. Industrial Practice: 8th International Symposium; Springer: Cham, Switzerland, 2018; pp. 280–299. [Google Scholar]
- Zhang, C.; Song, D.; Chen, Y.; Feng, X.; Lumezanu, C.; Cheng, W.; Ni, J.; Zong, B.; Chen, H.; Chawla, N.V. A deep neural network for unsupervised anomaly detection and diagnosis in multivariate time series data. Proc. AAAI Conf. Artif. Intell. 2019, 33, 1409–1416. [Google Scholar] [CrossRef]
- Farady, I.; Kuo, C.C.; Ng, H.F.; Lin, C.Y. Hierarchical Image Transformation and Multi-Level Features for Anomaly Defect Detection. Sensors 2023, 23, 988. [Google Scholar] [CrossRef] [PubMed]
- Wang, J.; Xu, G.; Yan, F.; Wang, J.; Wang, Z. Defect transformer: An efficient hybrid transformer architecture for surface defect detection. Measurement 2023, 211, 112614. [Google Scholar] [CrossRef]
- Wang, J.; Xu, G.; Li, C.; Gao, G.; Wu, Q. SDDet: An Enhanced Encoder-Decoder Network with Hierarchical Supervision for Surface Defect Detection. IEEE Sens. J. 2022, 23, 2651–2662. [Google Scholar] [CrossRef]
- Ren, S.; He, K.; Girshick, R.; Sun, J. Faster r-cnn: Towards real-time object detection with region proposal networks. In Proceedings of the Advances in Neural Information Processing Systems 28 (NIPS 2015), Montreal, QC, Canada, 7–12 December 2015. [Google Scholar]
- He, K.; Gkioxari, G.; Dollár, P.; Girshick, R. Mask r-cnn. In Proceedings of the IEEE International Conference on Computer Vision, Venice, Italy, 22–29 October 2017; pp. 2961–2969. [Google Scholar]
- Liu, W.; Anguelov, D.; Erhan, D.; Szegedy, C.; Reed, S.; Fu, C.Y.; Berg, A.C. SSD: Single shot multibox detector. In Computer Vision—ECCV 2016: Proceedings of the 14th European Conference, Amsterdam, The Netherlands, 11–14 October 2016, Part I; Springer International Publishing: Cham, Switzerland, 2016; pp. 21–37. [Google Scholar]
- Redmon, J.; Divvala, S.; Girshick, R.; Farhadi, A. You only look once: Unified, real-time object detection. In Proceedings of the IEEE Conference on Computer Vision and Pattern Recognition, Las Vegas, NV, USA, 27–30 June 2016; pp. 779–788. [Google Scholar]
- Redmon, J.; Farhadi, A. YOLO9000: Better, faster, stronger. In Proceedings of the IEEE Conference on Computer Vision and Pattern Recognition, Honolulu, HI, USA, 21–26 July 2017; pp. 7263–7271. [Google Scholar]
- Bochkovskiy, A.; Wang, C.Y.; Liao, H.Y.M. Yolov4: Optimal speed and accuracy of object detection. arXiv 2020, arXiv:2004.10934. [Google Scholar]
- Dlamini, S.; Kuo, C.F.J.; Chao, S.M. Developing a surface mount technology defect detection system for mounted devices on printed circuit boards using a MobileNetV2 with Feature Pyramid Network. Eng. Appl. Artif. Intell. 2023, 121, 105875. [Google Scholar] [CrossRef]
- Yao, J.; Qi, J.; Zhang, J.; Shao, H.; Yang, J.; Li, X. A real-time detection algorithm for Kiwifruit defects based on YOLOv5. Electronics 2021, 10, 1711. [Google Scholar] [CrossRef]
- Zhou, C.; Shen, X.; Wang, P.; Wei, W.; Sun, J.; Luo, Y.; Li, Y. BV-Net: Bin-based Vector-predicted Network for tubular solder joint detection. Measurement 2021, 183, 109821. [Google Scholar] [CrossRef]
- Hou, W.; Jing, H. RC-YOLOv5s: For tile surface defect detection. Vis. Comput. 2023, 1–12. [Google Scholar] [CrossRef]
- Xu, J.; Zou, Y.; Tan, Y.; Yu, Z. Chip Pad Inspection Method Based on an Improved YOLOv5 Algorithm. Sensors 2022, 22, 6685. [Google Scholar] [CrossRef]
- Yang, Y.; Zhou, Y.; Din, N.U.; Li, J.; He, Y.; Zhang, L. An Improved YOLOv5 Model for Detecting Laser Welding Defects of Lithium Battery Pole. Appl. Sci. 2023, 13, 2402. [Google Scholar] [CrossRef]
- Hu, J.; Shen, L.; Sun, G. Squeeze-and-excitation networks. In Proceedings of the IEEE Conference on Computer Vision and Pattern Recognition, Salt Lake City, UT, USA, 18–22 June 2018; pp. 7132–7141. [Google Scholar]
- Wang, C.Y.; Liao, H.Y.M.; Wu, Y.H.; Chen, P.Y.; Hsieh, J.W.; Yeh, I.H. CSPNet: A new backbone that can enhance learning capability of CNN. In Proceedings of the IEEE/CVF Conference on Computer Vision and Pattern Recognition Workshops, Seattle, WA, USA, 14–19 June 2020; pp. 390–391. [Google Scholar]
- Liu, S.; Qi, L.; Qin, H.; Shi, J.; Jia, J. Path aggregation network for instance segmentation. In Proceedings of the IEEE Conference on Computer Vision and Pattern Recognition, Salt Lake City, UT, USA, 18–22 June 2018; pp. 8759–8768. [Google Scholar]
Disclaimer/Publisher’s Note: The statements, opinions and data contained in all publications are solely those of the individual author(s) and contributor(s) and not of MDPI and/or the editor(s). MDPI and/or the editor(s) disclaim responsibility for any injury to people or property resulting from any ideas, methods, instructions or products referred to in the content. |
© 2023 by the authors. Licensee MDPI, Basel, Switzerland. This article is an open access article distributed under the terms and conditions of the Creative Commons Attribution (CC BY) license (https://creativecommons.org/licenses/by/4.0/).

