
Development of a New Test-Rig for Wheel–Rail Contact Experiments under Large Slip Conditions

Abstract
:1. Introduction
1.1. Rolling Contact Theories
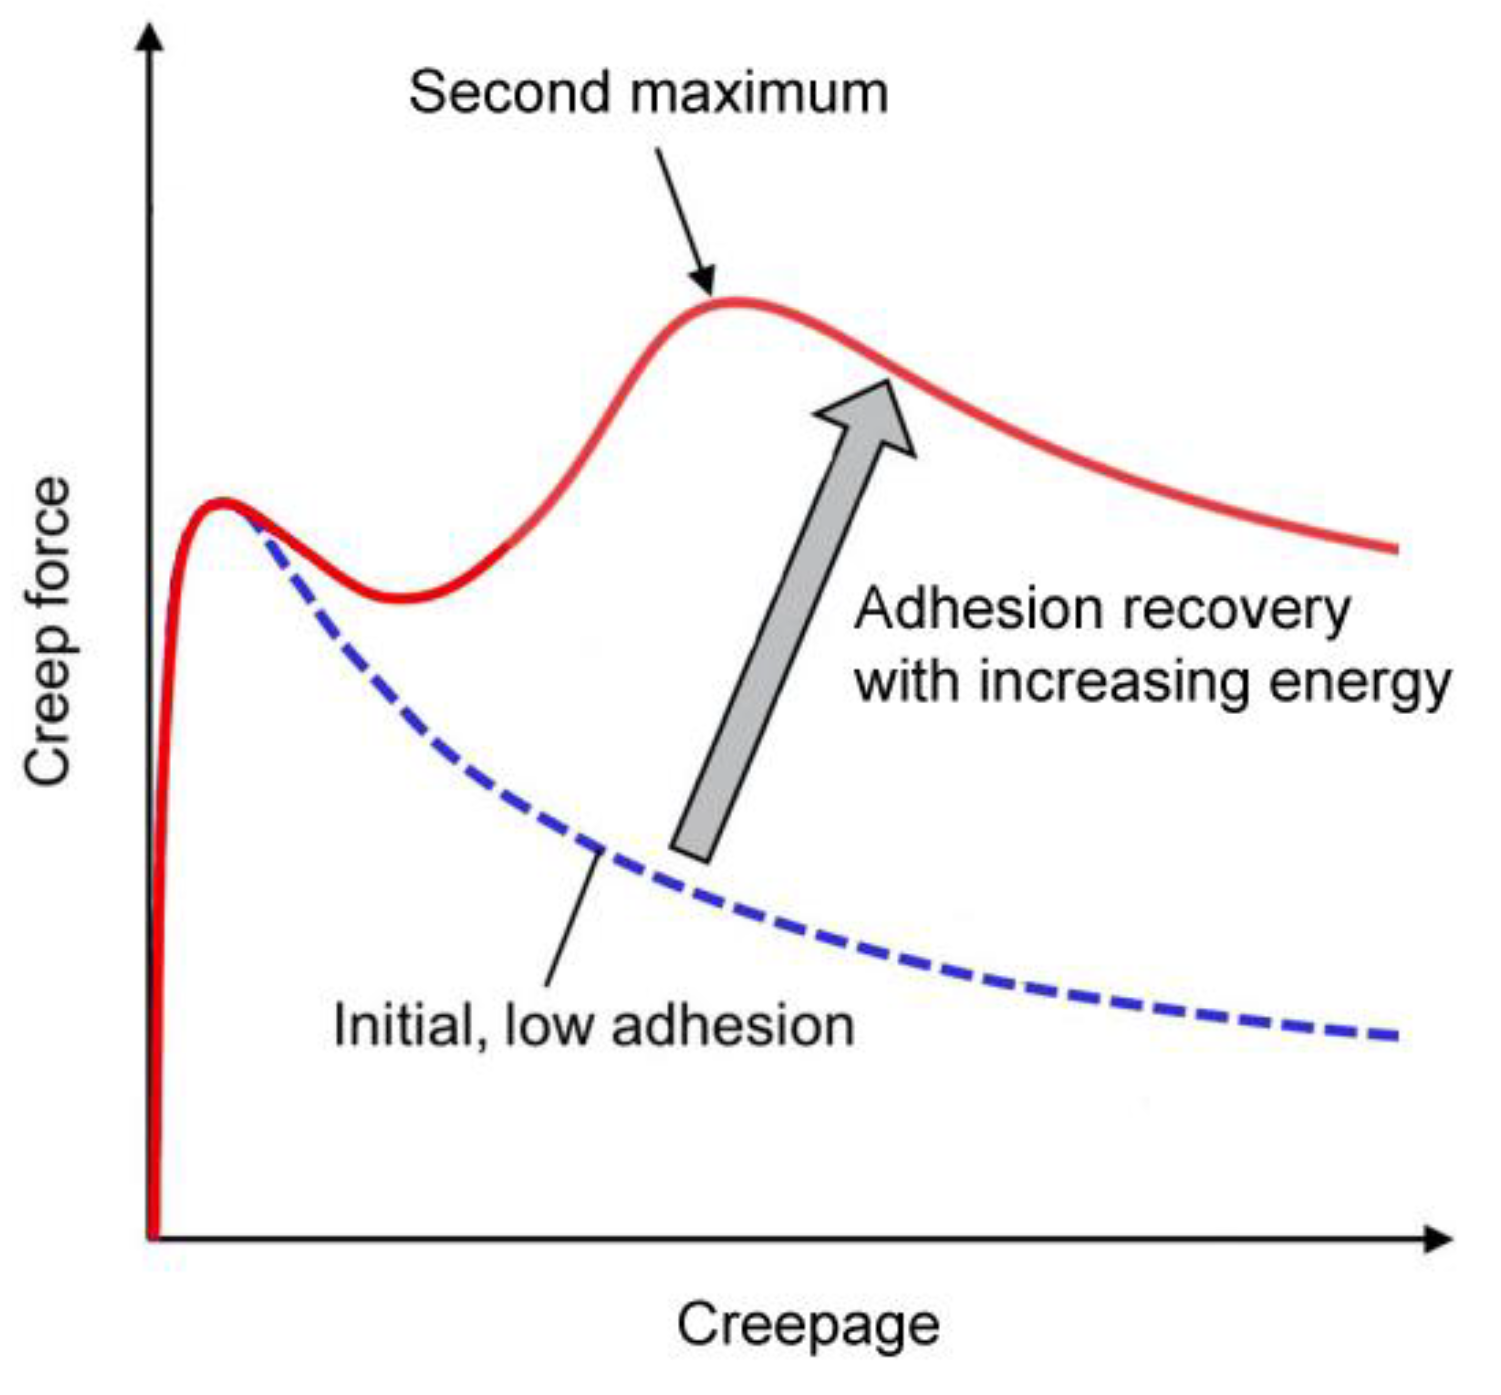
1.2. Adhesion Recovery in Large Slip Conditions
1.3. Experimental Investigations
1.4. Scope of This Paper
2. Overall Design
2.1. Category Selection
2.2. Scale and Power
- The ratio of the longitudinal semi-axis length a to the transversal semi-axis length b of the elliptical contact patch is the same in both test-rig and reality;
- The maximum contact pressure q of contact patch is the same in both test-rig and reality.
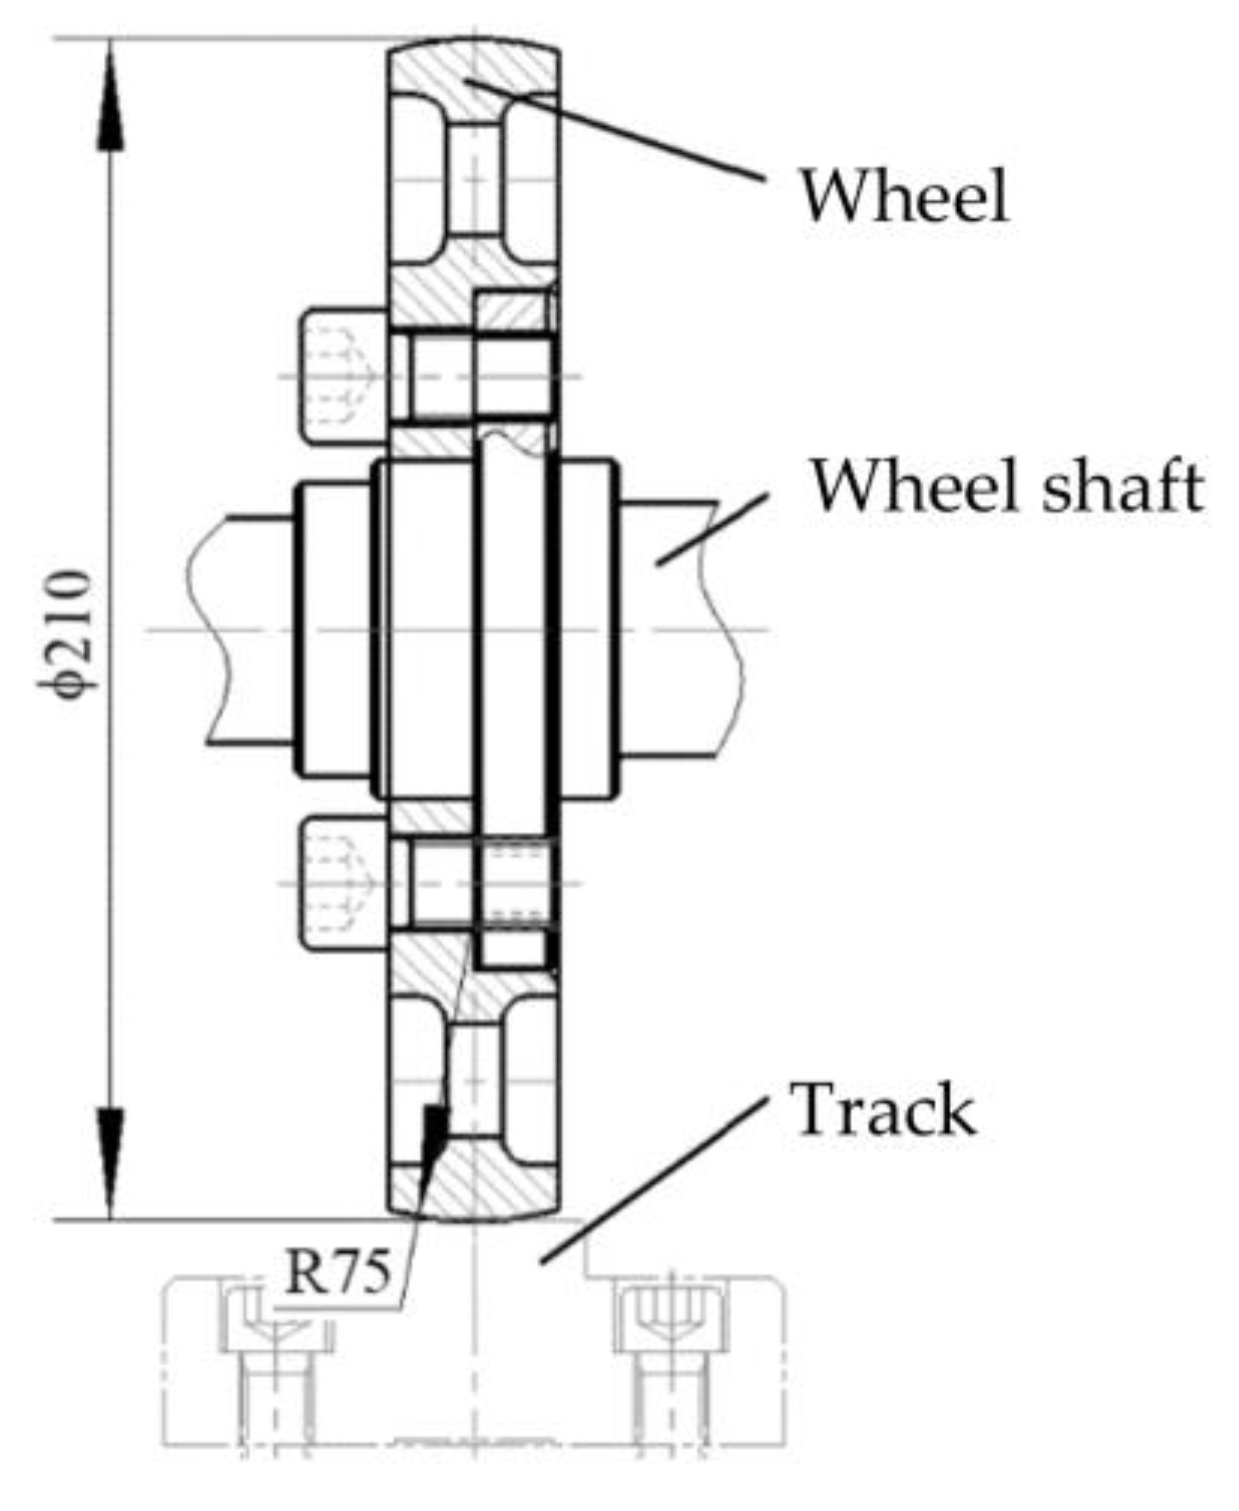
2.3. Wheel–Rail Contact and Circling Diameter
3. Detailed Description
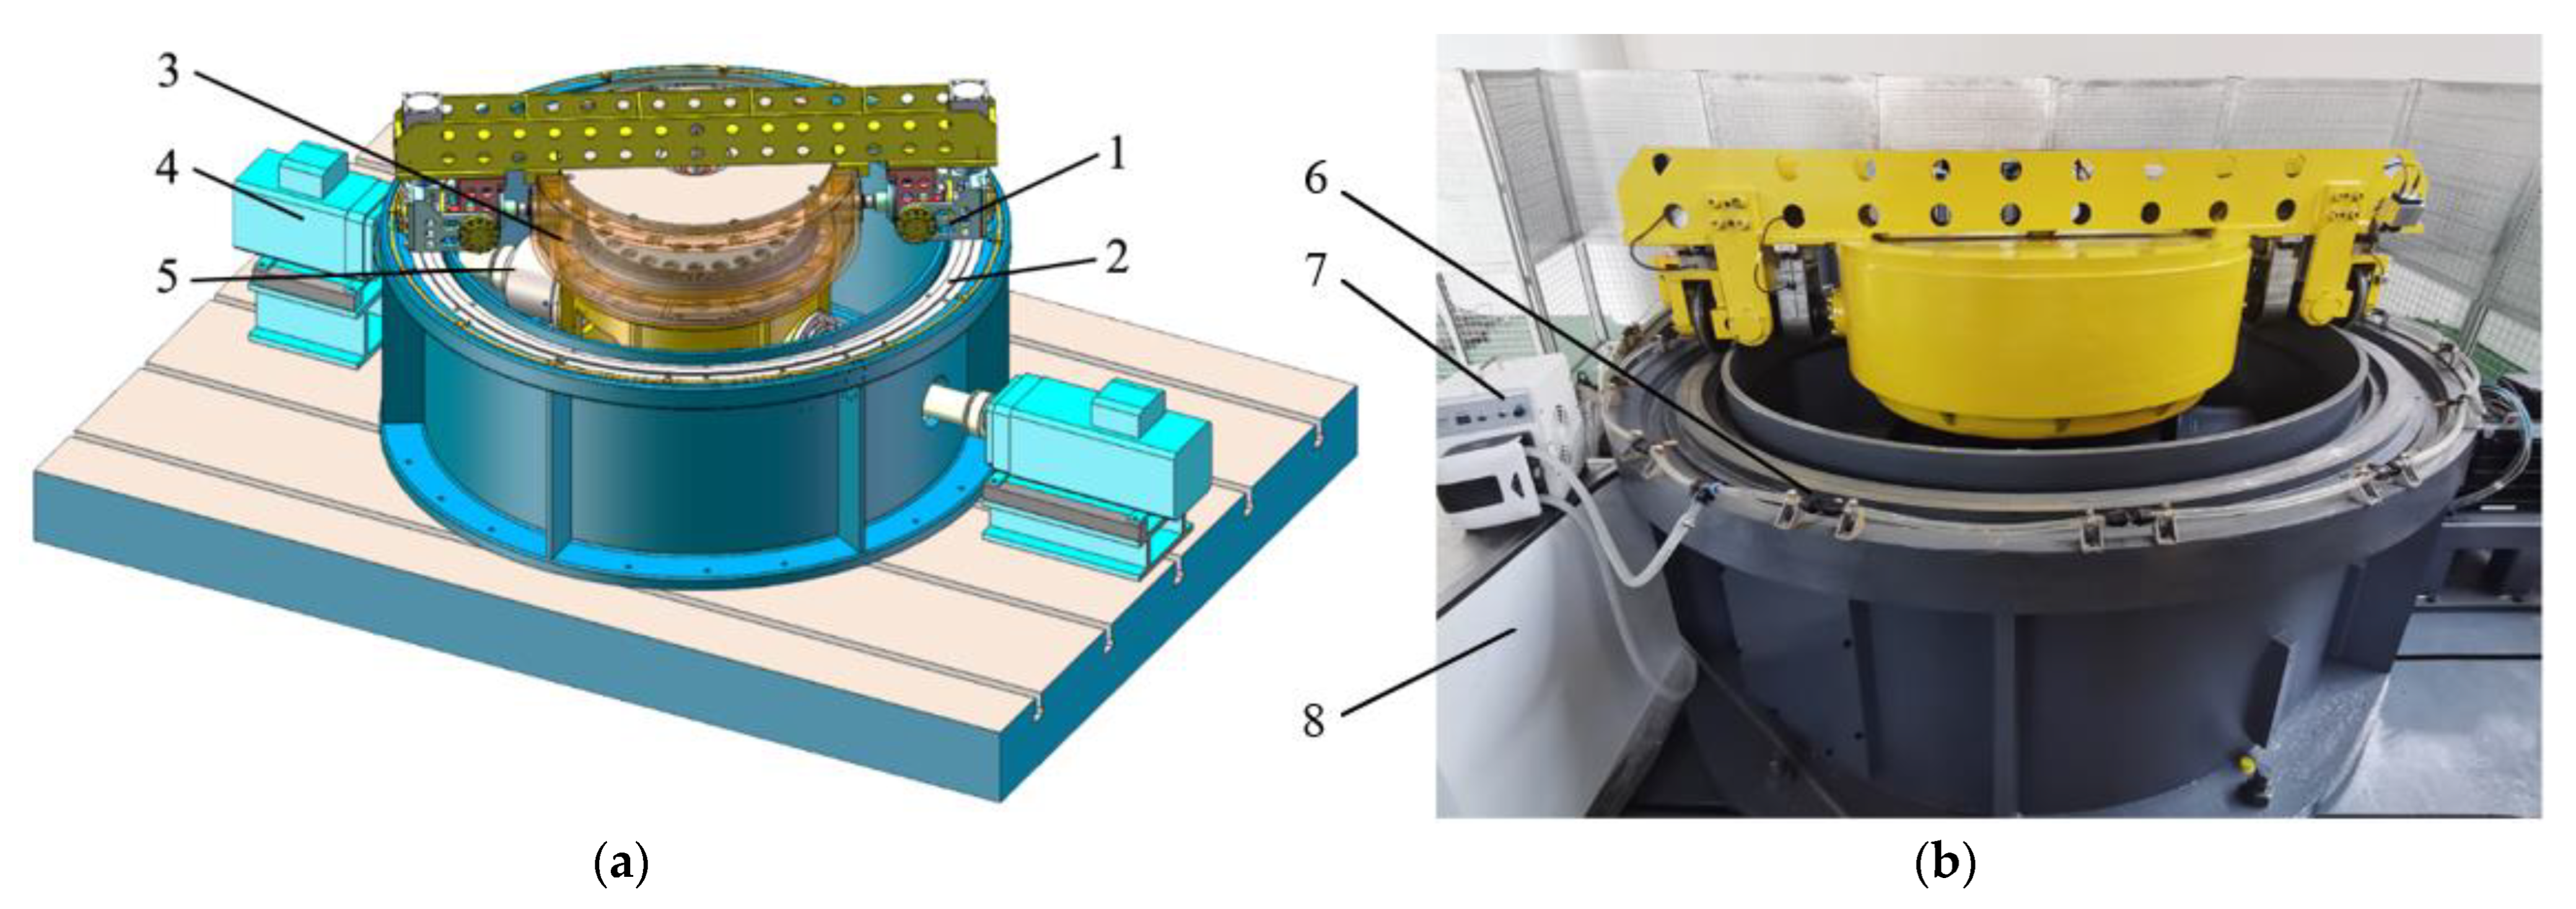
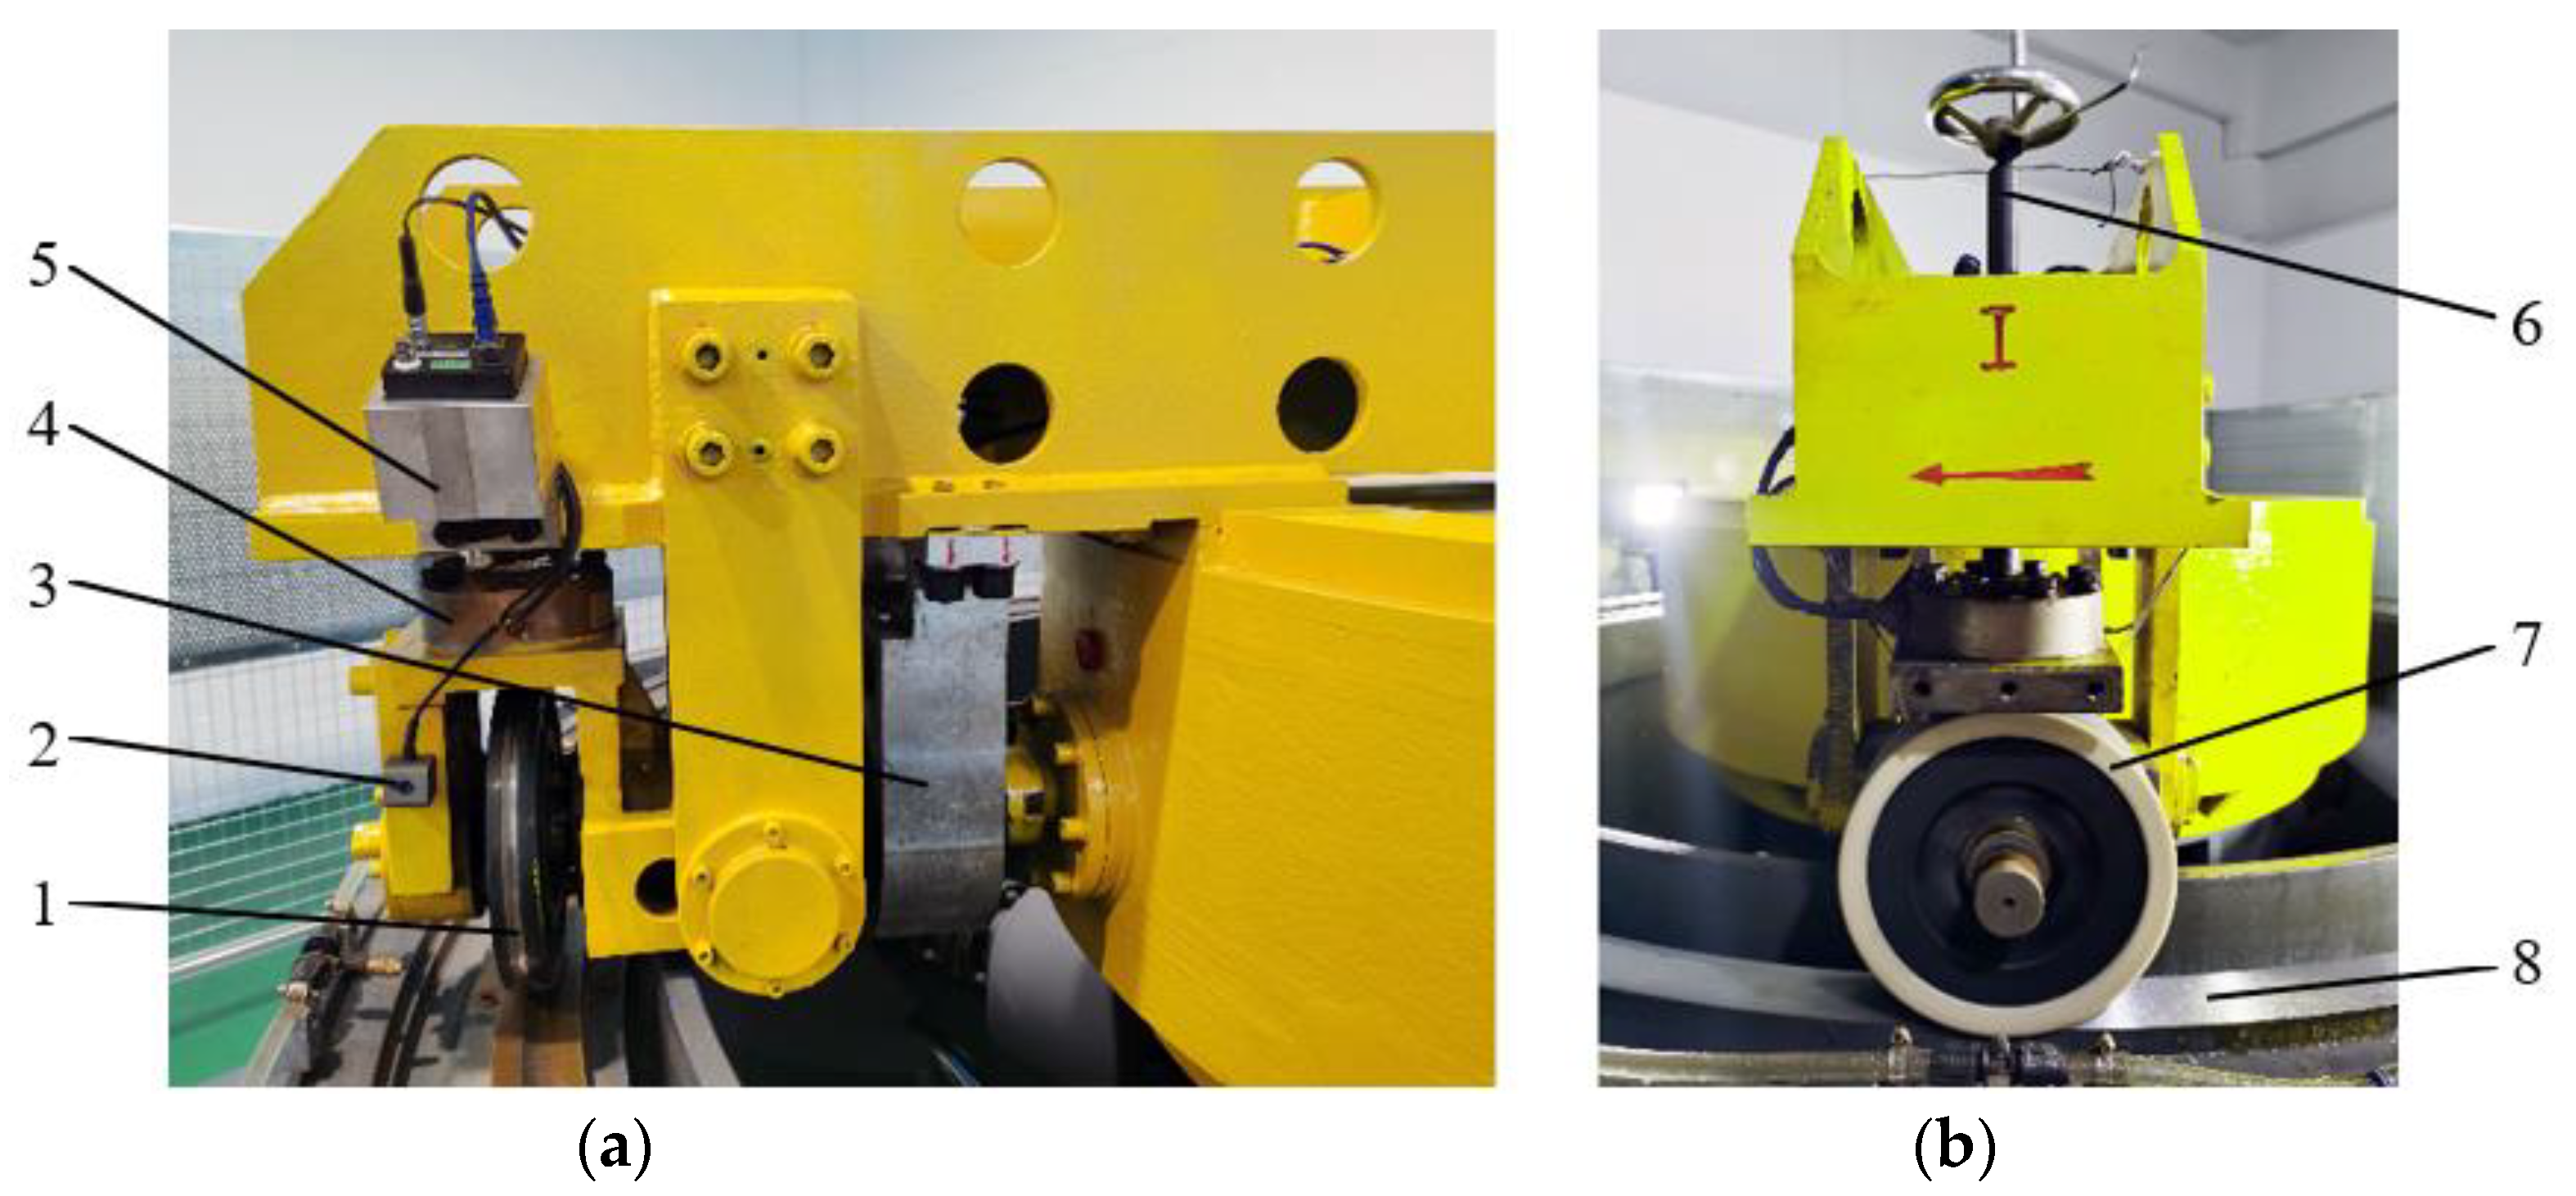
3.1. Structure of the Test-Rig
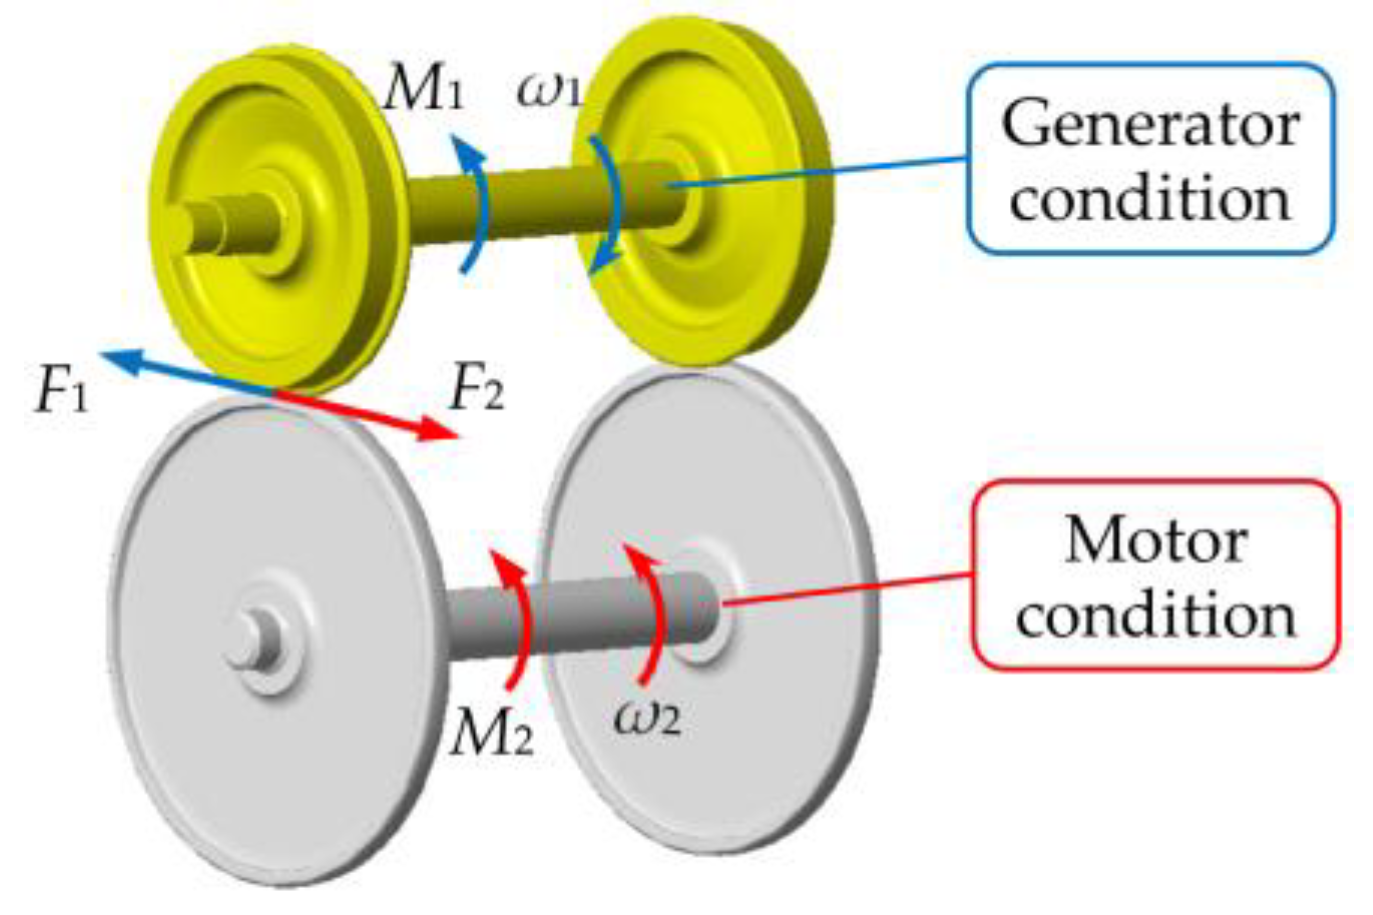
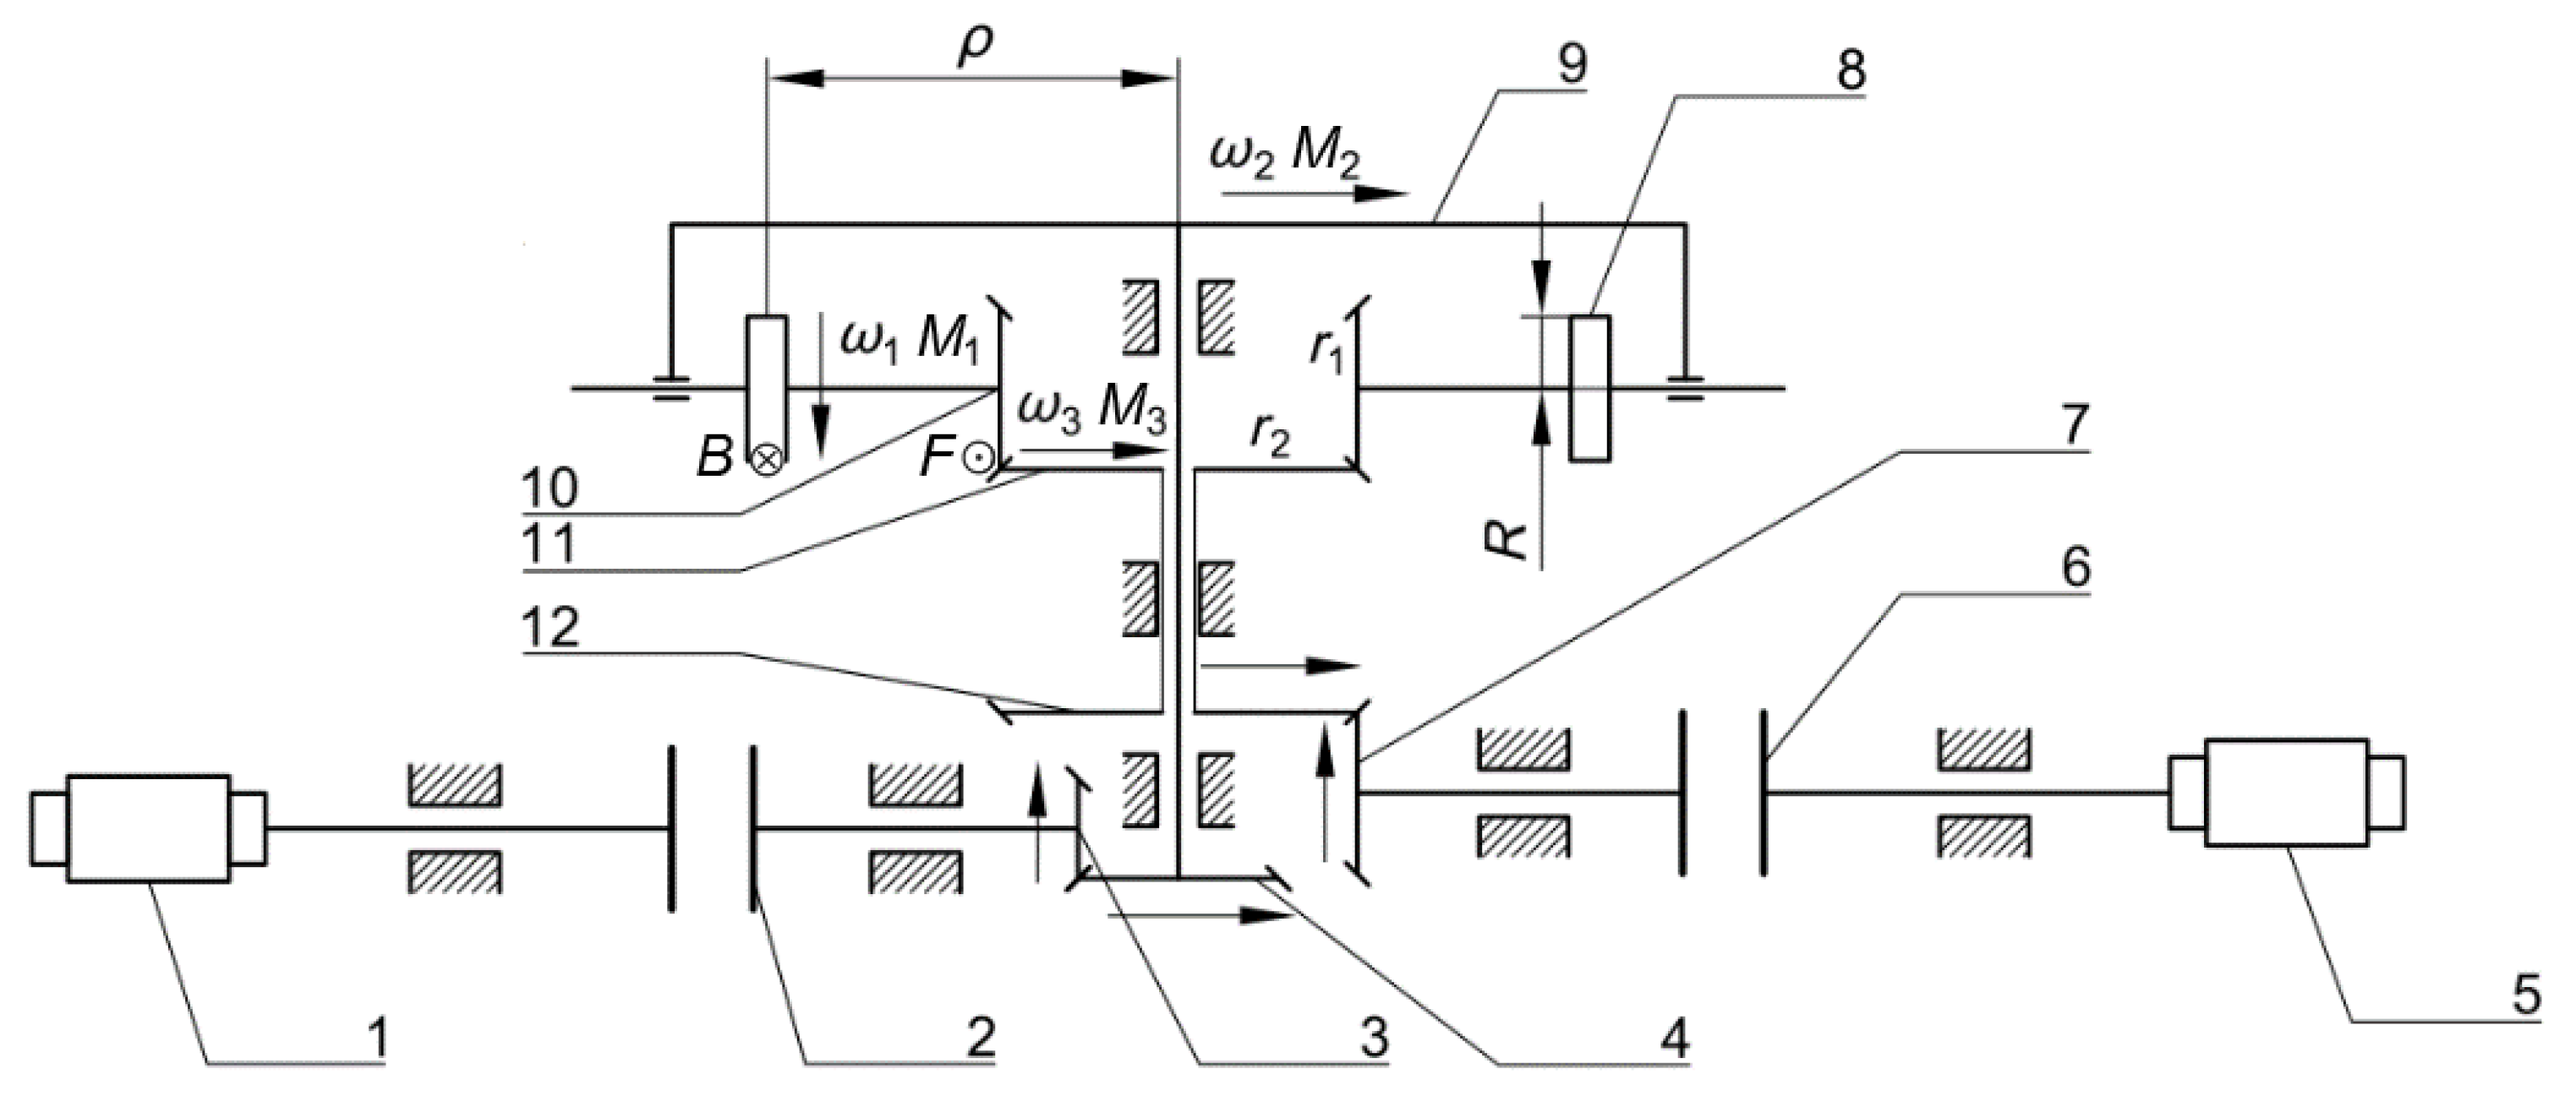
3.2. Dynamics Analysis
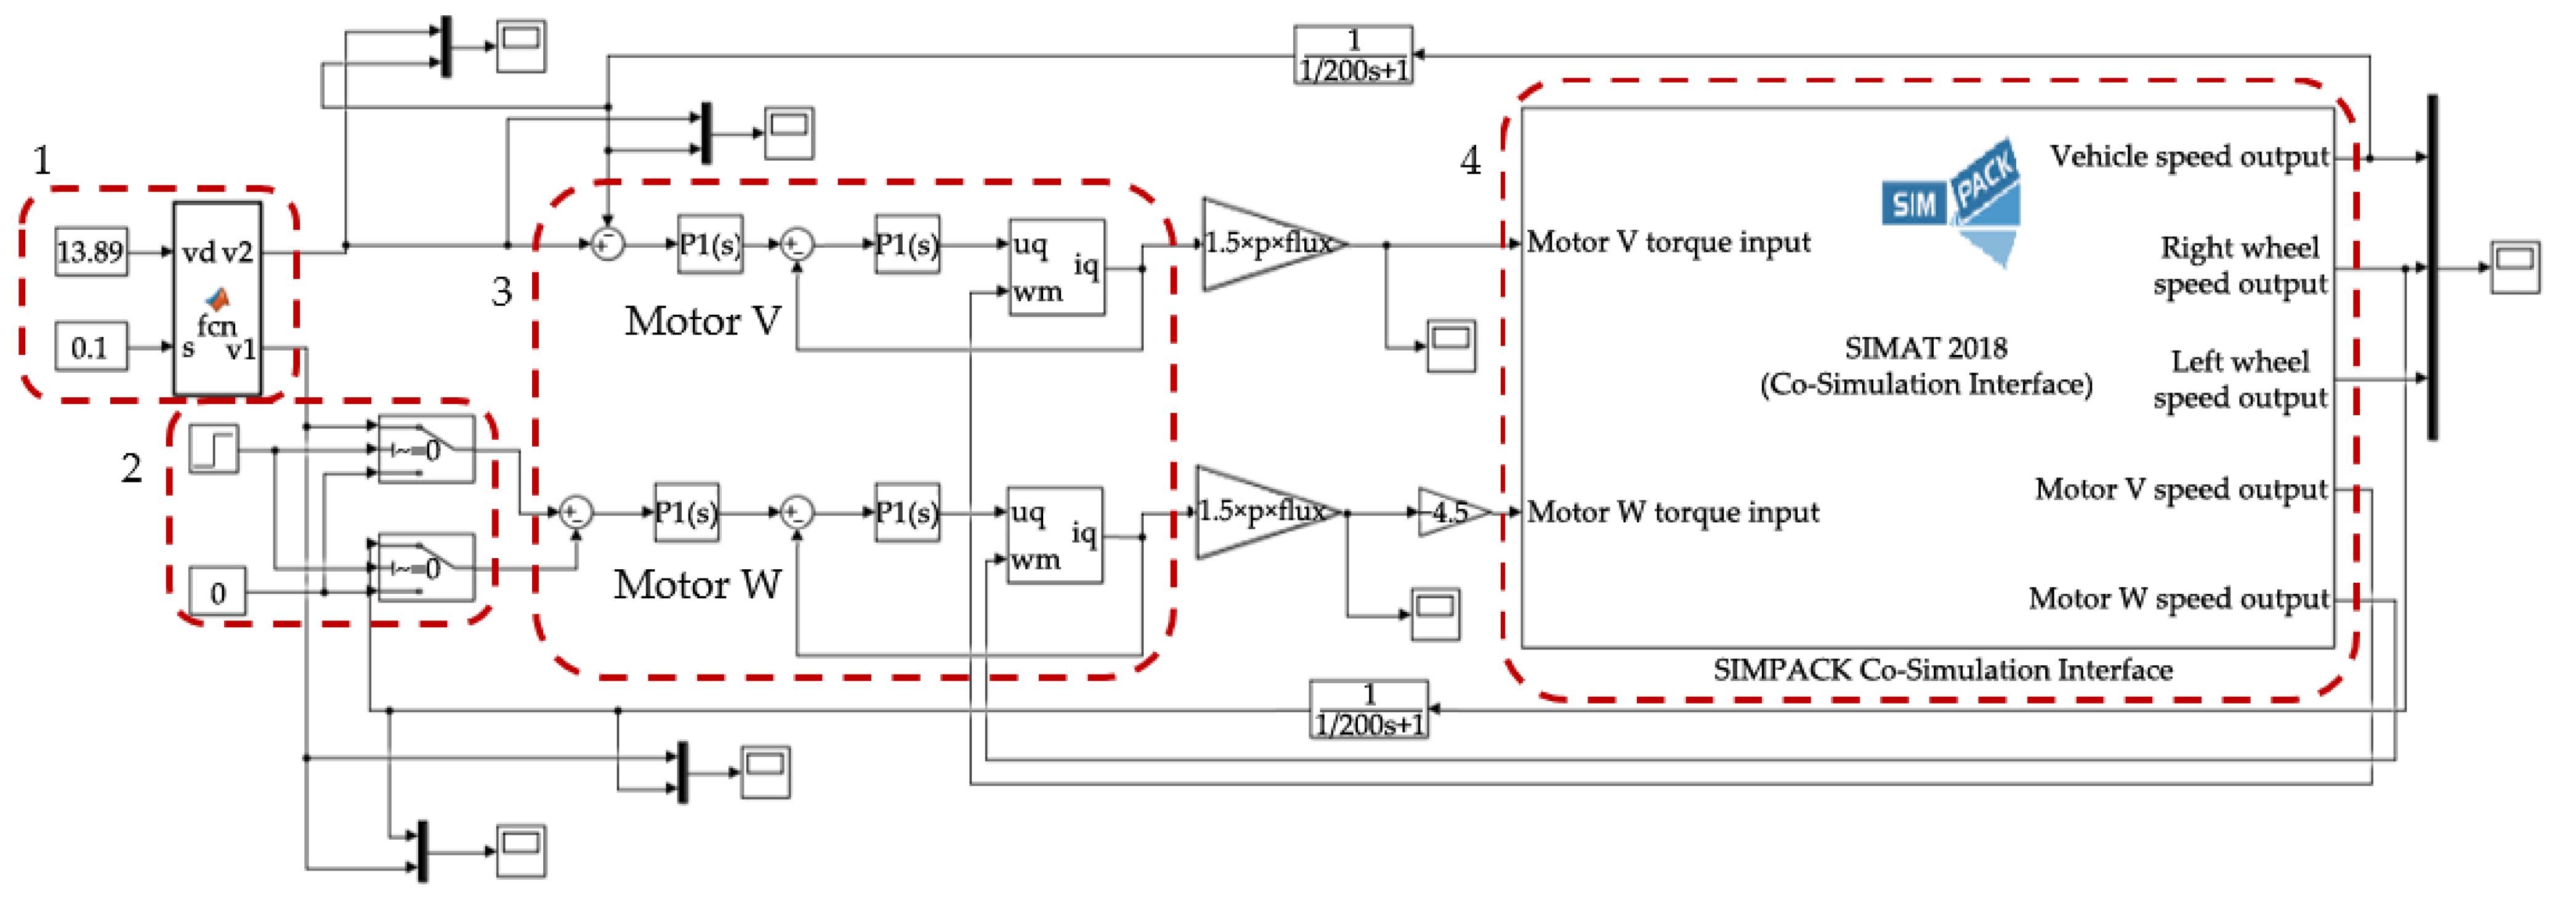
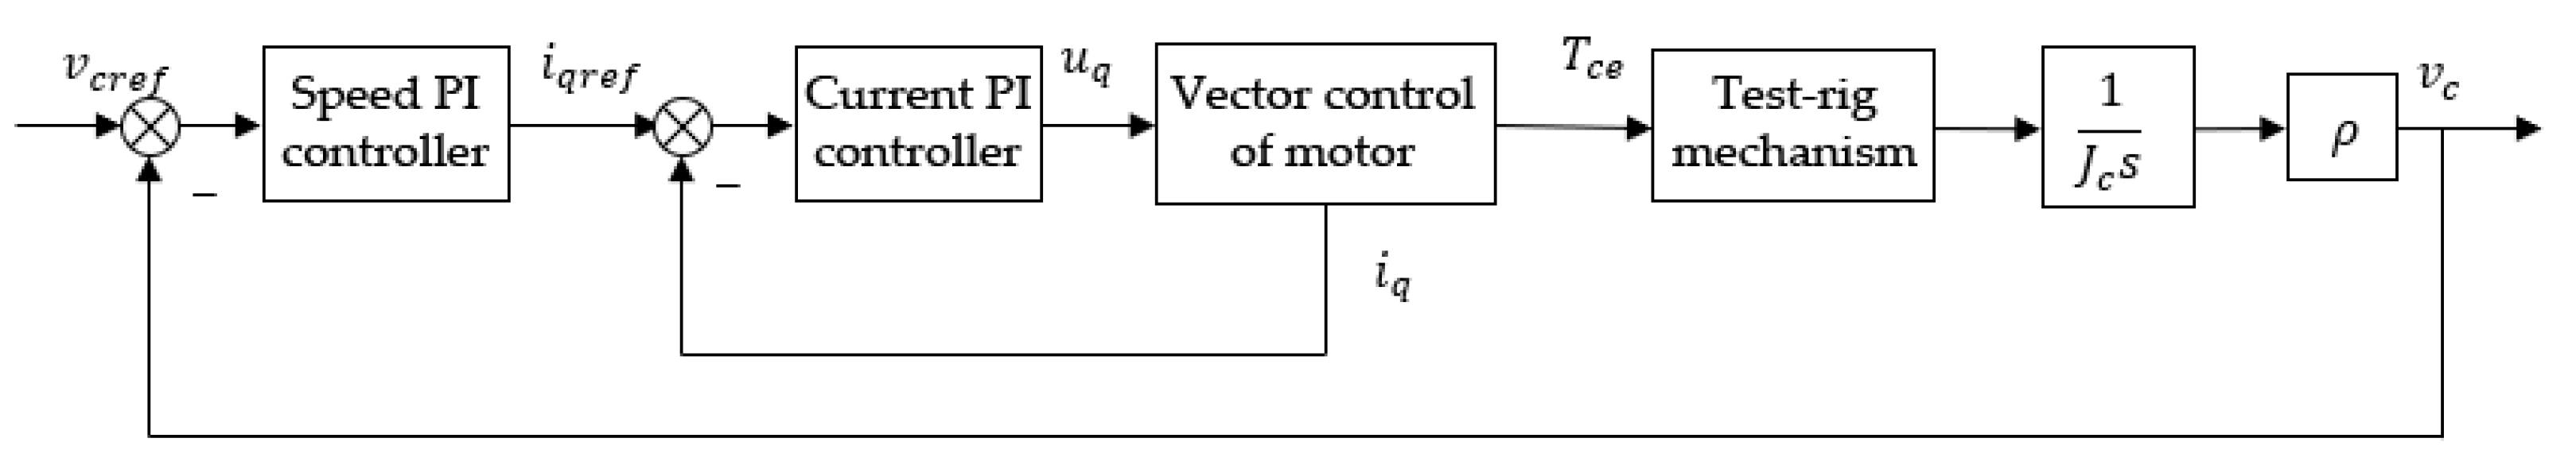
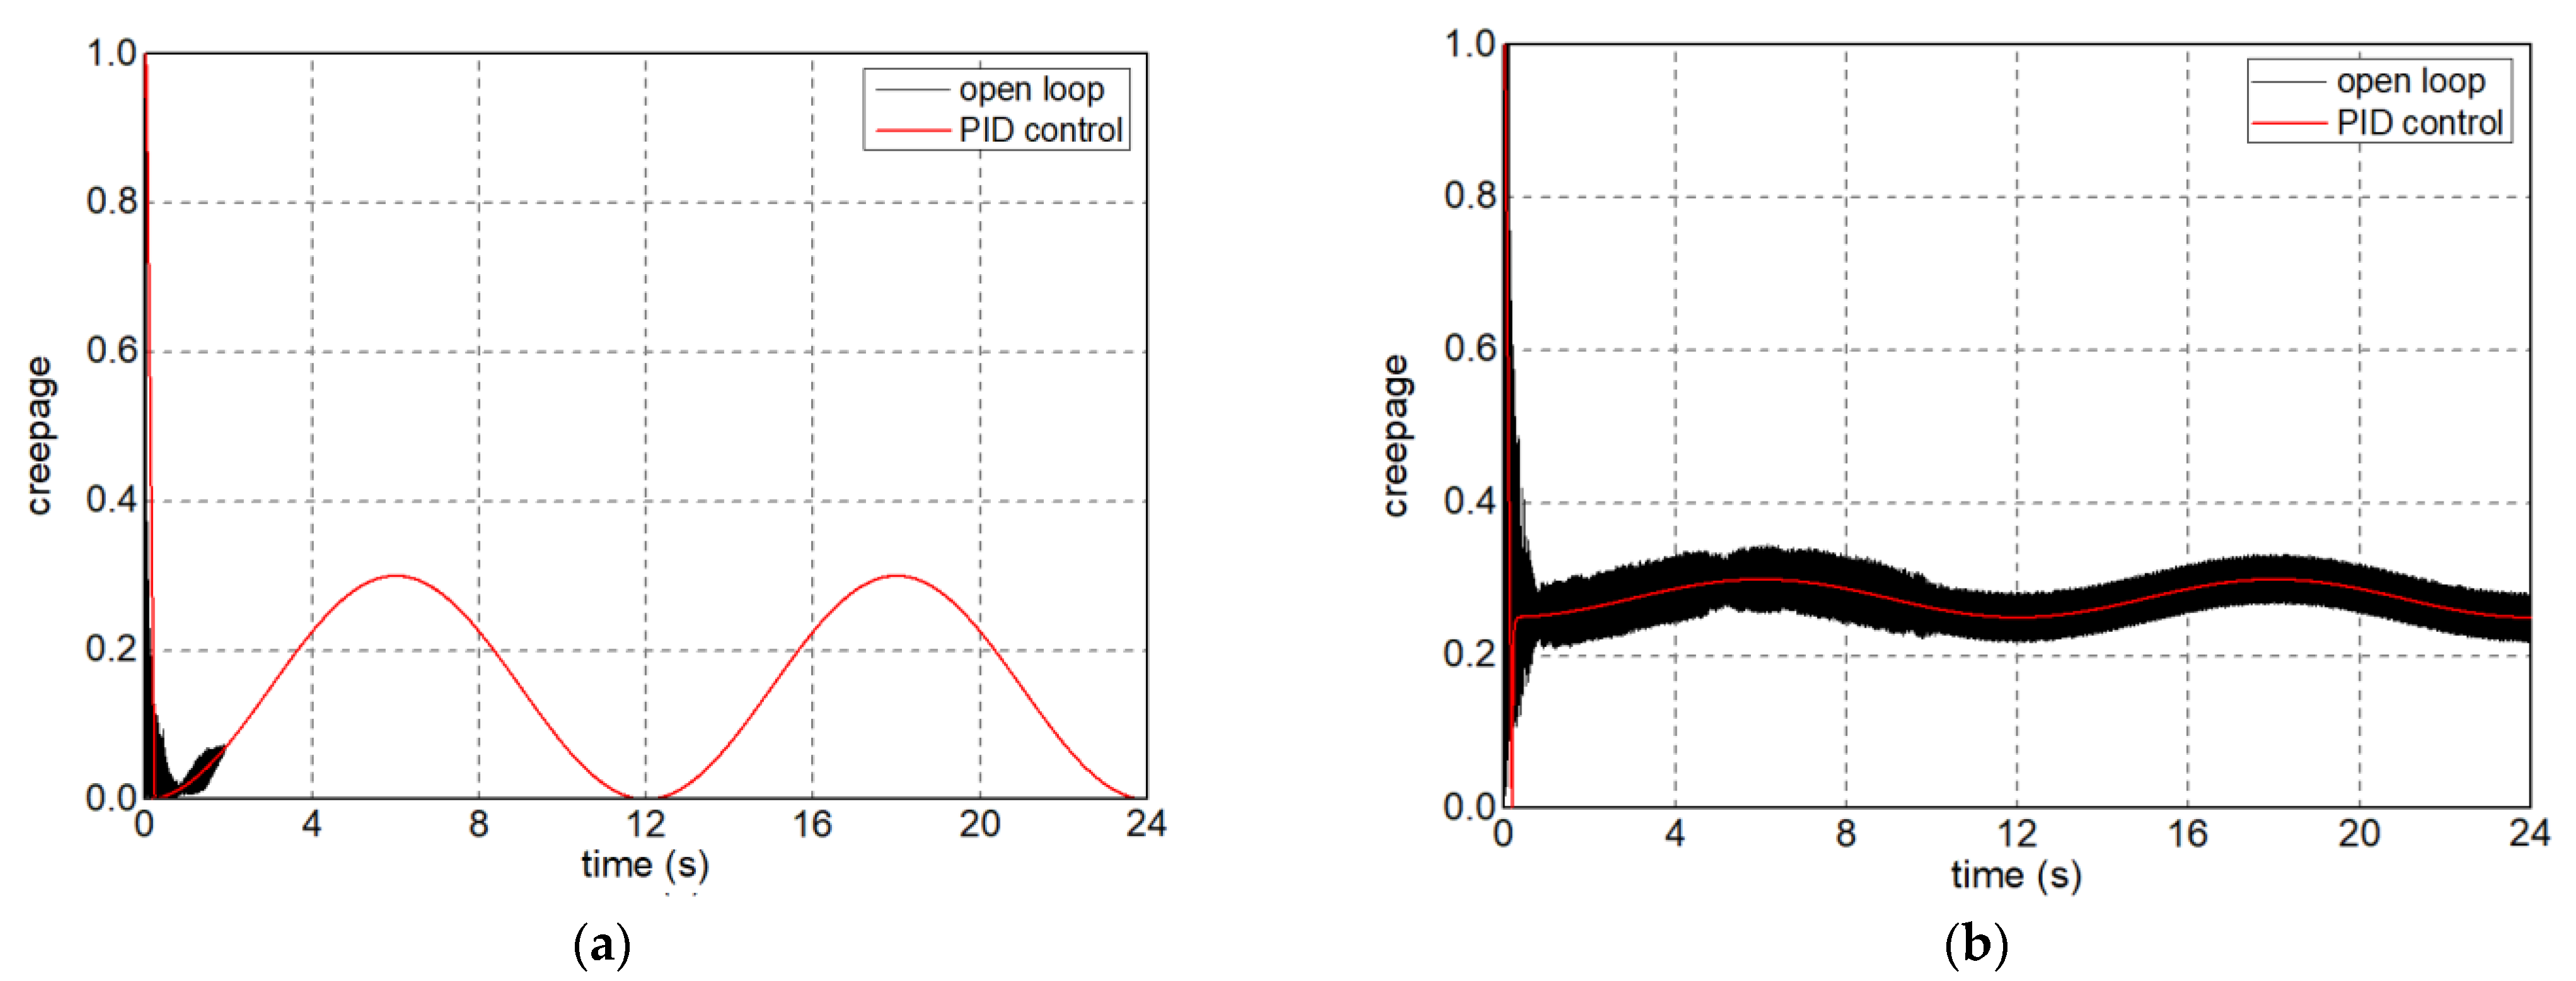
3.3. Simulation of Precise Slip Control
4. Experimental Research
4.1. Validation Experiments
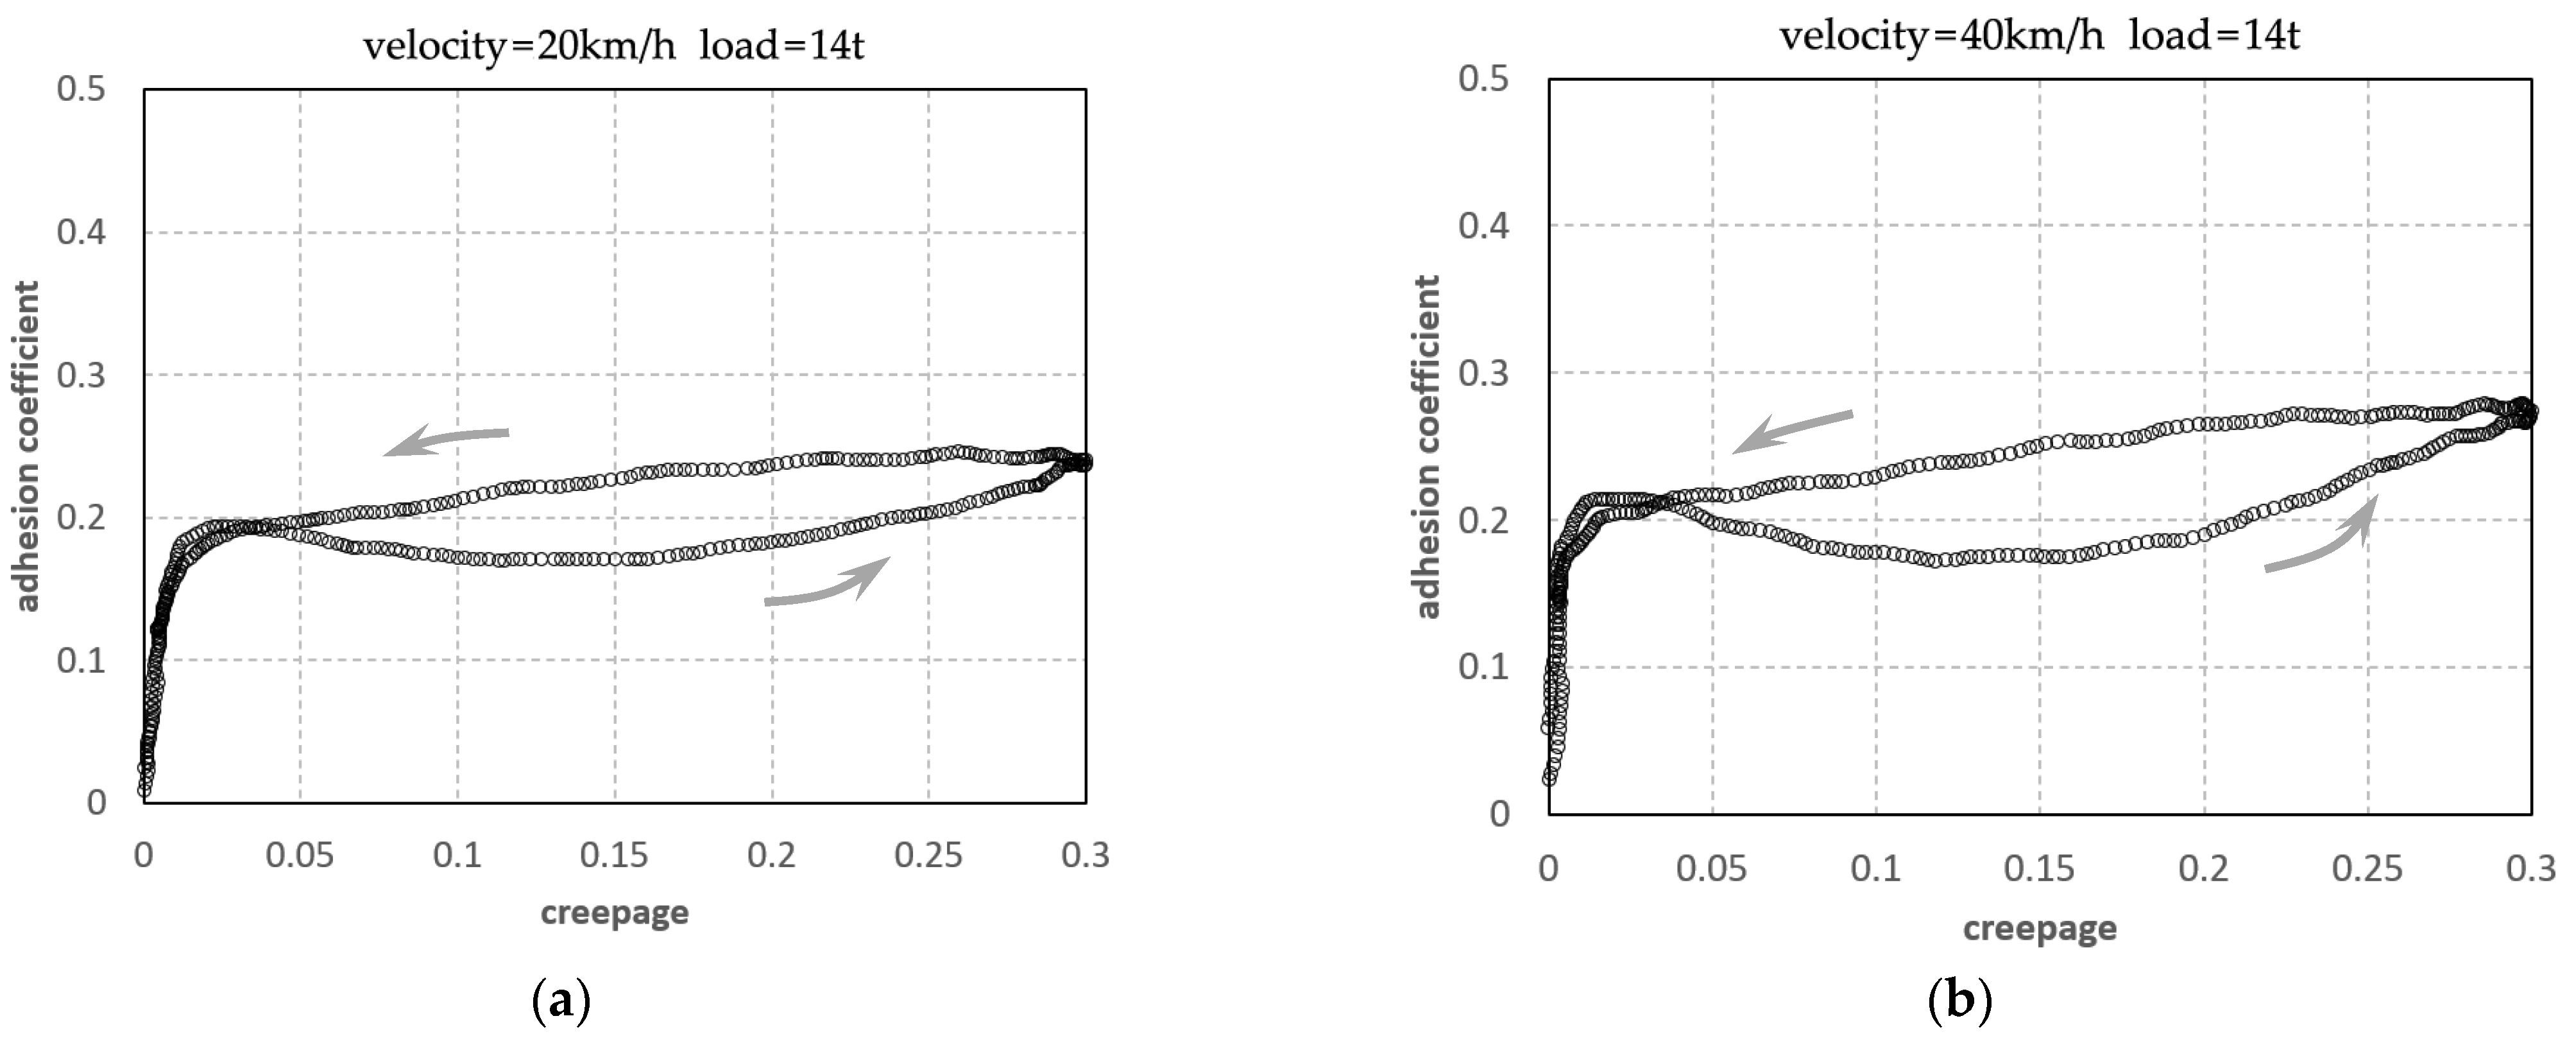
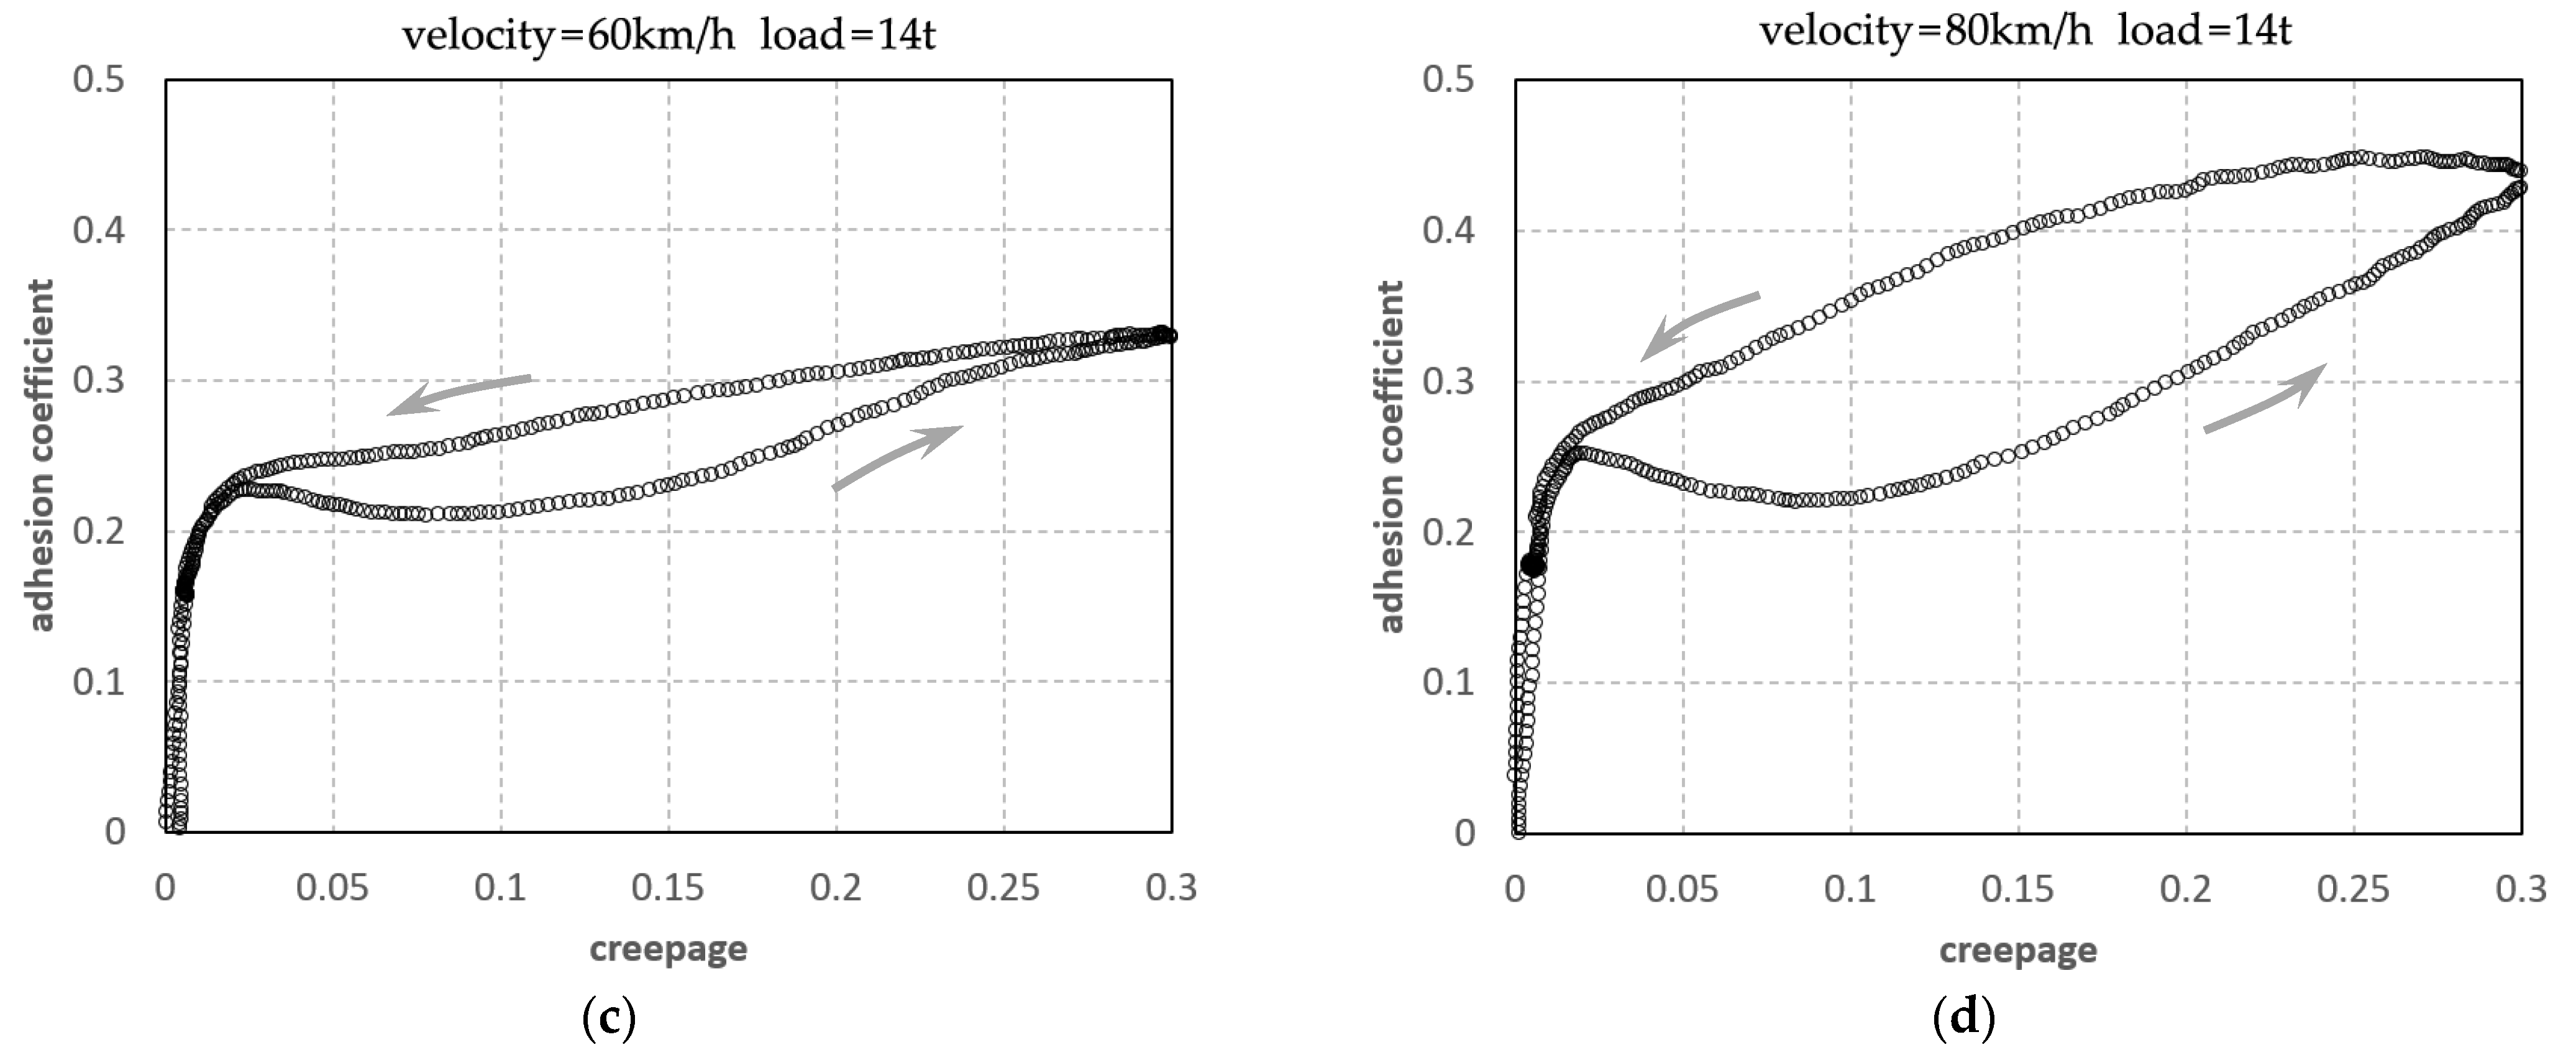
4.2. Experiments of Different Speeds
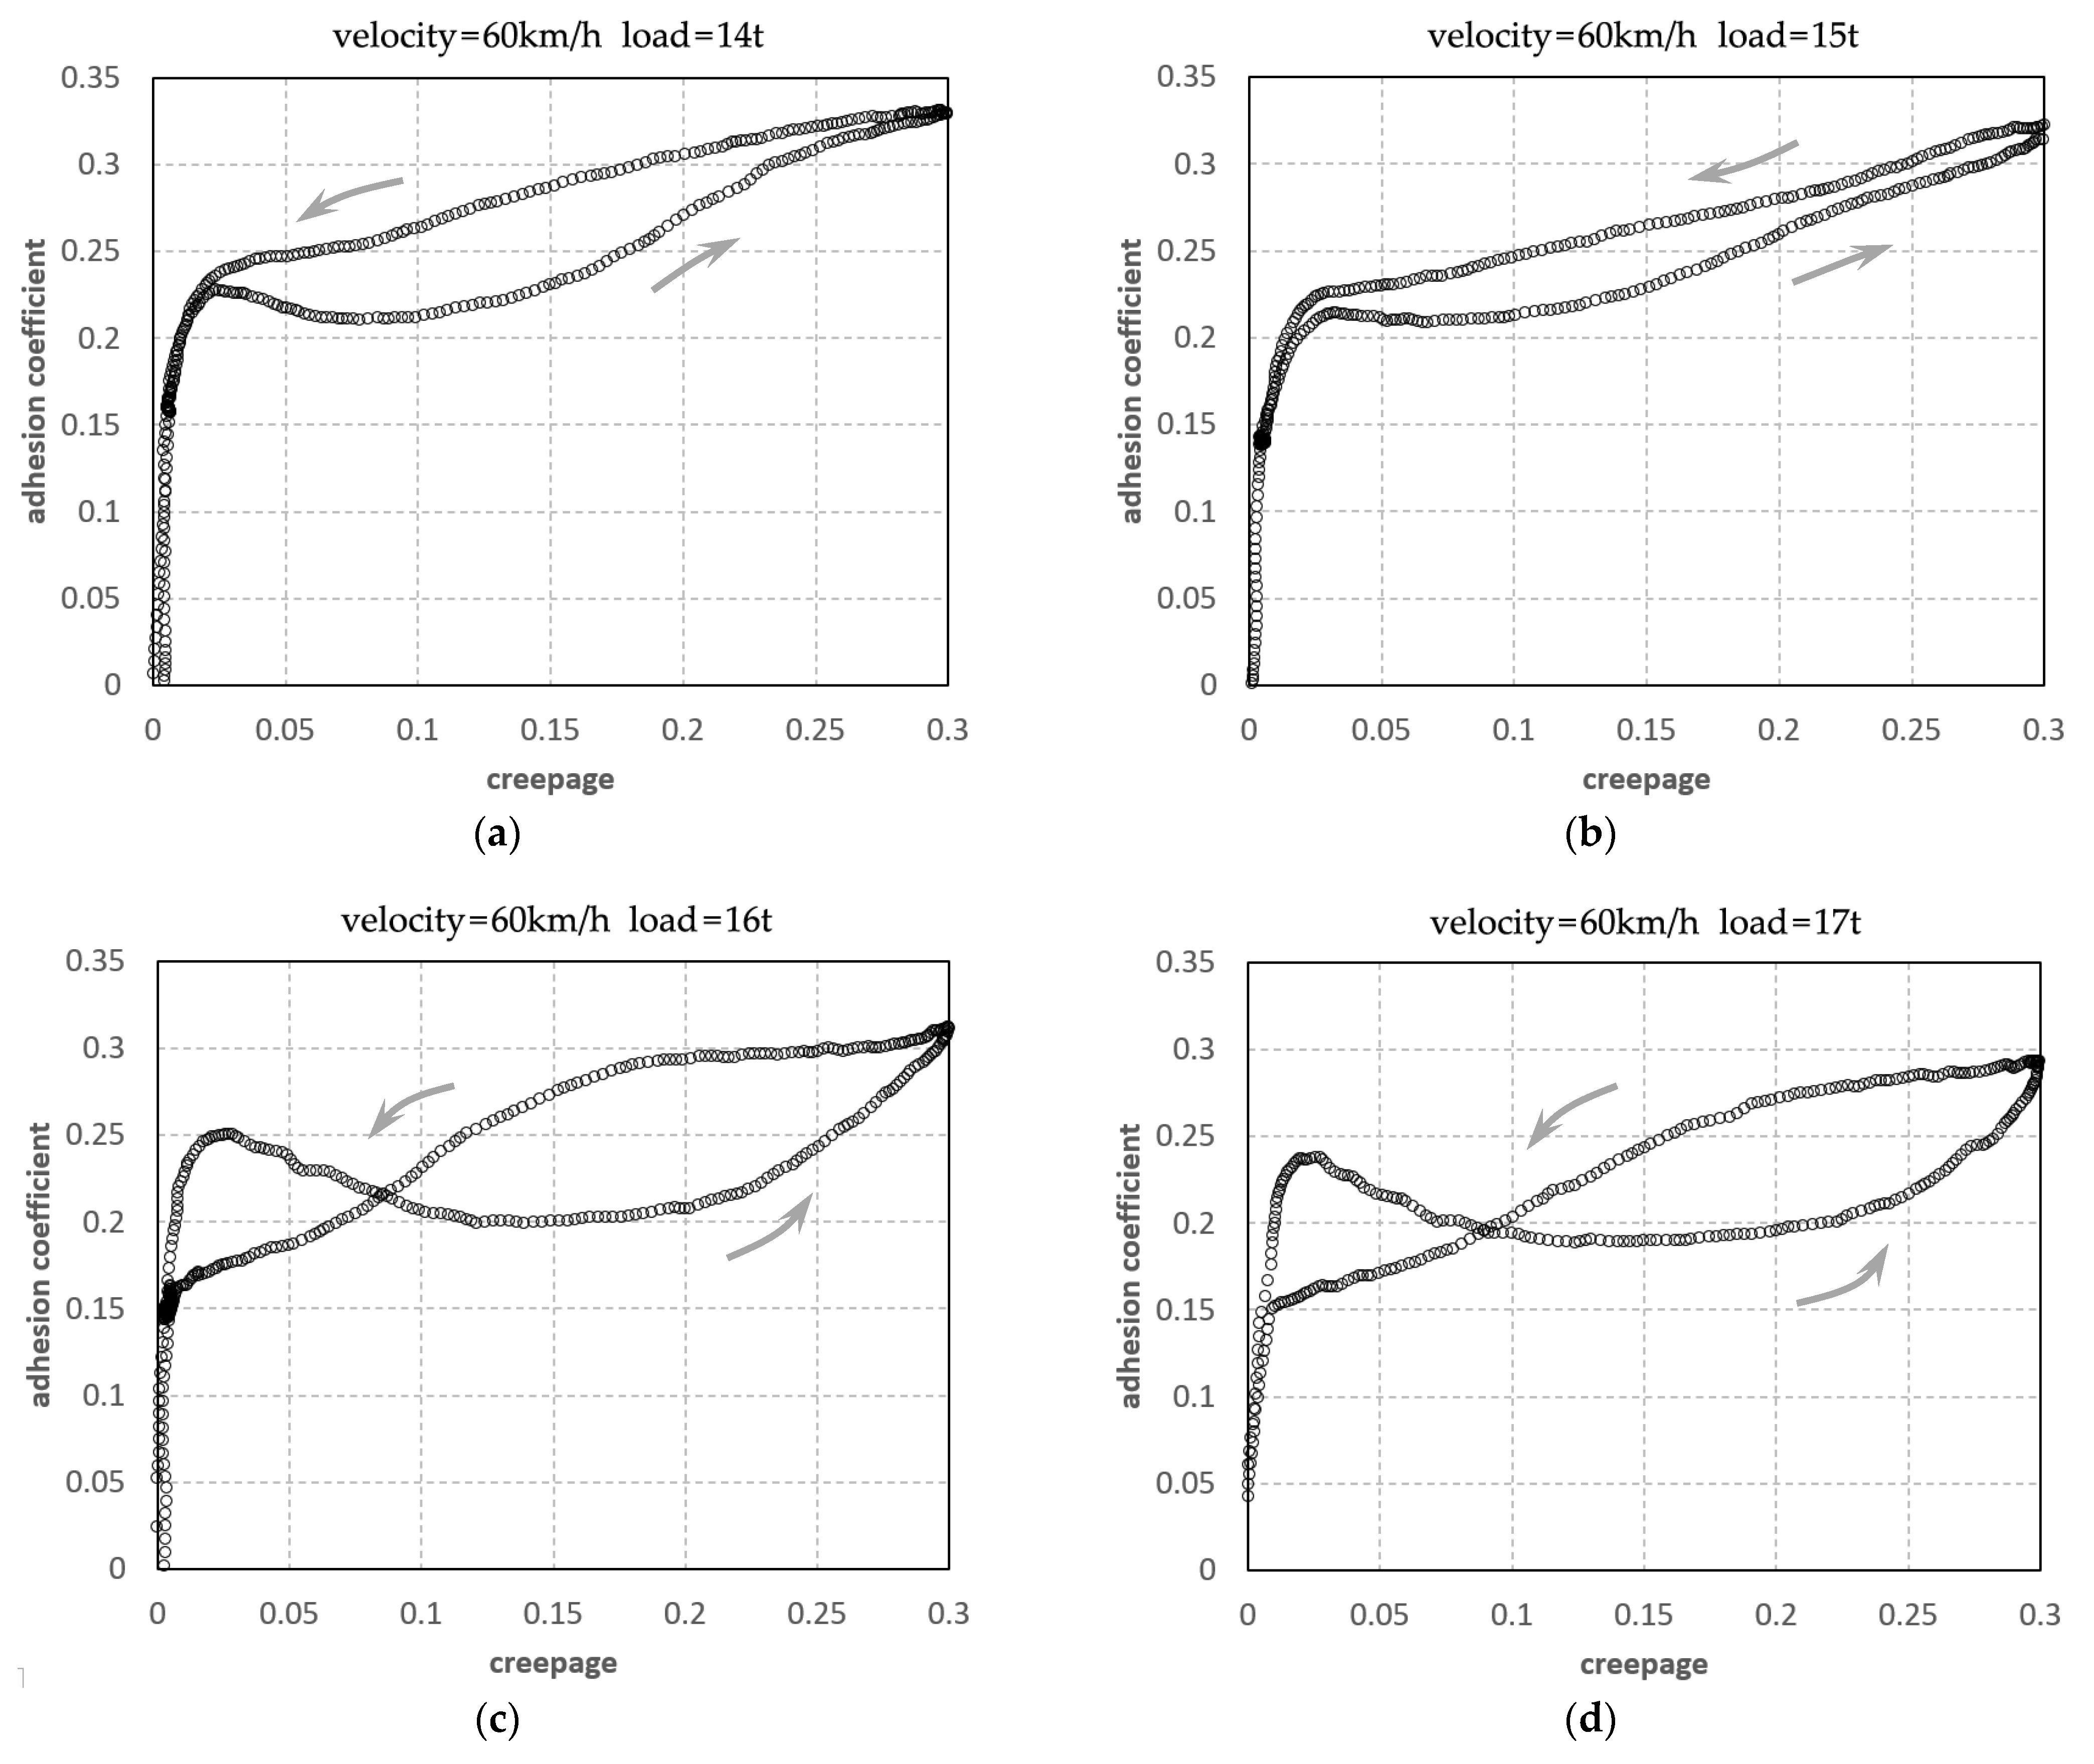
4.3. Experiments of Different Loads
4.4. Experiments of Different Surface Contaminants
5. Conclusions
- A wide range of existing test devices for wheel–rail contact experiments were classified and comparatively reviewed. Three categories of test-rig were distinguished and functionally evaluated: (1) wheel-on-roller, (2) wheel-on-rail, (3) wheel-on-ring. With the requirements for quantitative control of fluid layer thickness and precise control of the slip between wheel and rail, the wheel-on-ring test-rig was finally selected;
- The scale of the test-rig determines the wheel diameter as well as the required power of the test-rig. The circling diameter of the test-rig affects the similarity of longitudinal creepage and creep force on the contact patch to that of the actual vehicle. Considering the power limit in the laboratory and wheel–rail contact similarity, a scale factor of 1/4 and a circling diameter of 2 m were adopted for the new test-rig;
- The downscale test-rig consists of wheel assemblies, ring track, gearbox, motors and sprinkler system in the main structure. The creepage was the specific value of two torque meters while the adhesion coefficient was calculated from the torque meter and the load sensor. By selecting an appropriate gear ratio of the gearbox, the two motors of the test-rig were decoupled. Precise slip control was realized in MATLAB/Simulink simulation under PID control;
- Validations of the test-rig were conducted and showed little impact on creepage due to a sudden change in adhesion, meanwhile the error between measured and target creepage was not greater than 0.005. Adhesion experiments under large slip conditions with different speeds, axle loads and surface contaminants were performed. Positive correlation with running speed and negative correlation with axle load of adhesion recovery were observed. Oil and leaf contaminants caused no adhesion recovery under large slip conditions;
- The experimental results of wheel–rail adhesion indicate the accuracy of the test-rig. The phenomenon of adhesion recovery reproduced on the test-rig suggests that changes in wheel–rail interface conditions during large creepage contribute to restoring adhesion, including the effects of water evaporation caused by temperature rise and the removal of the surface layer. In accordance with other experimental observations, the test-rig is capable of performing further adhesion experiments under various surface conditions.
6. Patents
- Chao Chen; Chun Tian; et al. A Circular wheel-rail adhesion simulation test-rig and its application. CN202111032398.3, 03 December 2021;
- Chao Chen; Chun Tian; et al. A dual speed reducer generating slip with speed coupling. CN202111100869.X, 17 December 2021.
Author Contributions
Funding
Institutional Review Board Statement
Informed Consent Statement
Data Availability Statement
Conflicts of Interest
References
- Carter, F.W. On the action of a locomotive driving wheel. Proc. R. Soc. A 1926, 112, 151–157. [Google Scholar]
- Olofsson, U.; Lewis, R.; Harmon, M. Tribology of the wheel-rail contact. In Handbook of Railway Vehicle Dynamics, 2nd ed.; Iwnicki, S., Spiryagin, M., Cole, C., McSweeney, T., Eds.; CRC Taylor and Francis: Boca Raton, FL, USA, 2019; Chapter 8; pp. 281–306. [Google Scholar]
- Edwin, V.; Klaus, S.; Oldrich, P. Challenges and progress in the understanding and modelling of the wheel-rail creep forces. Veh. Syst. Dyn. 2021, 59, 1026–1068. [Google Scholar]
- Knothe, K. History of wheel/rail contact mechanics: From Redtenbacher to Kalker. Veh. Syst. Dyn. 2008, 46, 9–26. [Google Scholar] [CrossRef]
- Johnson, K.L. The effect of spin upon the rolling motion of an elastic sphere upon a plane. J. Appl. Mech. 1958, 25, 332–338. [Google Scholar] [CrossRef]
- Johnson, K.L. The effect of a tangential contact force upon the rolling motion of an elastic sphere upon a plane. J. Appl. Mech. 1958, 25, 339–346. [Google Scholar] [CrossRef]
- Kalker, J.J. On the Rolling Contact of Two Elastic Bodies in the Presence of Dry Friction. Ph.D. Thesis, Delft University of Technology, Delft, The Netherlands, 1967. [Google Scholar]
- Kalker, J.J. Simplified theory of rolling contact. Delft Progr. Rep. Ser. C1 1973, 1, 1–10. [Google Scholar]
- Kalker, J.J. A fast algorithm for the simplified theory of rolling contact. Veh. Syst. Dyn. 1982, 11, 1–13. [Google Scholar] [CrossRef]
- Kalker, J.J. The computation of three-dimensional rolling contact with dry friction. Int. J. Numer. Methods Eng. 1979, 14, 1293–1307. [Google Scholar] [CrossRef]
- Kalker, J.J. Rolling contact phenomena-linear elasticity. In Rolling Contact Phenomena; Jacobson, B., Kalker, J., Eds.; Springer: Vienna, Austria, 2000; Volume 411, pp. 1–85. [Google Scholar]
- Kalker, J.J. Three-Dimensional Elastic Bodies in Rolling Contact; Springer: Dordrecht, The Netherlands, 1990; pp. 185–236. [Google Scholar]
- Bosso, N.; Gugliotta, A. Study of wheel–rail adhesion during braking maneuvers. Procedia Struct. Integr. 2019, 24, 680–691. [Google Scholar] [CrossRef]
- Chang, C.; Chen, B.; Cai, Y. Experimental Study on Large Creepage Adhesion of Wheel/Rail Braking at 400 km·h−1(I)-Adhesion Characteristics under Water Medium. China Railw. Sci. 2022, 43, 96–103. [Google Scholar]
- Krettek, O. Zur Schlupfgesetzmässigkeit bei Bremsung mit gleitschutzüberwachten Scheibenbremsen. In Proceedings of the International Conference on Railway Bogies and Running Gears, Budapest, Hungary, 3 September 2007; pp. 117–126. [Google Scholar]
- Dellmann, T.; Viereck, U. Dynamisches Kraftschluss-Schlupfmodell zur Beschreibung von Bremsvorgängen. ZEVrail 2008, 132, 144–153. [Google Scholar]
- Boiteux, M. Le Problème de L’Adhérence en Freinage. Rev. Générale Chemins Fer 1986, 105, 59–72. [Google Scholar]
- Zhou, J.; Wu, M.; Tian, C. Experimental investigation on wheel–rail adhesion characteristics under water and large sliding conditions. Ind. Lubr. Tribol. 2021, 73, 366–372. [Google Scholar] [CrossRef]
- Voltr, P.; Lata, M. Transient wheel–rail adhesion characteristics under the cleaning effect of sliding. Veh. Syst. Dyn. 2015, 53, 605–618. [Google Scholar] [CrossRef]
- Chen, H.; Tanimoto, H. Experimental observation of temperature and surface roughness effects on wheel/rail adhesion in wet conditions. Int. J. Rail Transp. 2018, 6, 101–112. [Google Scholar] [CrossRef]
- Bosso, N.; Magelli, M.; Zampieri, N. Investigation of adhesion recovery phenomenon using a scaled roller-rig. Veh. Syst. Dyn. 2021, 59, 295–312. [Google Scholar] [CrossRef]
- Eadie, D.T.; Elvidge, D.; Oldknow, K. The effects of top of rail friction modifier on wear and rolling contact fatigue: Full-scale rail–wheel test rig evaluation, analysis and modelling. Wear 2008, 265, 1222–1230. [Google Scholar] [CrossRef]
- Naeimi, M.; Li, Z.; Petrov, R. Development of a New Downscale Setup for Wheel-Rail Contact Experiments under Impact Loading Conditions. Exp. Tech. Publ. Pract. Eng. 2017, 42, 1–17. [Google Scholar] [CrossRef]
- Zhang, P.; Moraal, J.; Li, Z. Design, calibration and validation of a wheel-rail contact force measurement system in V-Track. Measurement 2021, 175, 109105. [Google Scholar] [CrossRef]
- Holder, D.E.; Csenge, M.V.; Qian, Y. Laboratory investigation of the Skl-style fastening system’s lateral load performance under heavy haul freight railroad loads. Eng. Struct. 2017, 139, 71–80. [Google Scholar] [CrossRef]
- Zhang, W.; Chen, J.; Wu, X. Wheel/rail adhesion and analysis by using full scale roller rig. Wear 2002, 253, 82–88. [Google Scholar] [CrossRef]
- Instrument Sharing Platform of Tongji University. Available online: https://yqgx.tongji.edu.cn/dxyq/gxyqqt/dxyqDetail.jsp?wid=201801310039504308 (accessed on 9 February 2023).
- Michitsuji, Y.; Suda, Y. Running performance of power-steering railway bogie with independently rotating wheels. Veh. Syst. Dyn. 2006, 44, 71–82. [Google Scholar] [CrossRef]
- Matsumoto, A.; Sato, Y.; Ohno, H.; Mizuma, T.; Suda, Y.; Tanimoto, M.; Oka, Y. Study on curving performance of railway bogies by using full-scale stand test. Veh. Syst. Dyn. 2006, 44, 862–873. [Google Scholar] [CrossRef]
- Matsumoto, A.; Sato, Y.; Tanimoto, M.; Oka, Y. Wheel-rail contact mechanics at full scale on the test stand. Wear 1996, 191, 101–106. [Google Scholar] [CrossRef]
- Allen, P.D.; Zhang, W.; Liang, Y. Roller Rigs. In Handbook of Railway Vehicle Dynamics, 2nd ed.; Iwnicki, S., Spiryagin, M., Cole, C., McSweeney, T., Eds.; CRC Taylor and Francis: Boca Raton, FL, USA, 2019; Chapter 19; pp. 815–822. [Google Scholar]
- Bosso, N.; Allen, P.D.; Zampieri, N. Scale Testing Theory and Approaches. In Handbook of Railway Vehicle Dynamics, 2nd ed.; Iwnicki, S., Spiryagin, M., Cole, C., McSweeney, T., Eds.; CRC Taylor and Francis: Boca Raton, FL, USA, 2019; Chapter 20; pp. 838–853. [Google Scholar]
- Ayasse, J.; Chollet, H.; Sebès, M. Wheel-Rail Contact Mechanics. In Handbook of Railway Vehicle Dynamics, 2nd ed.; Iwnicki, S., Spiryagin, M., Cole, C., McSweeney, T., Eds.; CRC Taylor and Francis: Boca Raton, FL, USA, 2019; Chapter 7; pp. 251–265. [Google Scholar]
- Chen, C.; Tian, C.; Huang, T.; Zhu, W. Design and validation of a wheel-rail adhesion simulator in PLS-Circulator. J. Phys. Conf. Ser. 2022, 2355, 012038. [Google Scholar] [CrossRef]
- Tian, C.; Zhai, G.; Gao, Y.; Chen, C.; Zhou, J. Study on Creepage Control for PLS-160 Wheel-Rail Adhesion Test Rig Based on LADRC. Sensors 2023, 23, 1792. [Google Scholar] [CrossRef] [PubMed]


| Categories | Wheel-On-Roller | Wheel-On-Rail | Wheel-On-Ring |
|---|---|---|---|
| single wheel | 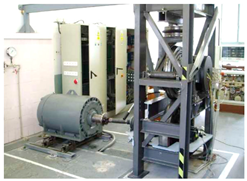 |  | 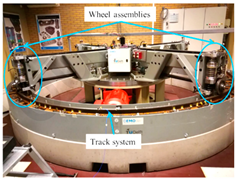 |
| U Pardubice Tram Wheel Test-Rig [19] | VAS Full Scaled Test-Rig [22] | TU Delft V-Track [23,24] | |
| wheel set | 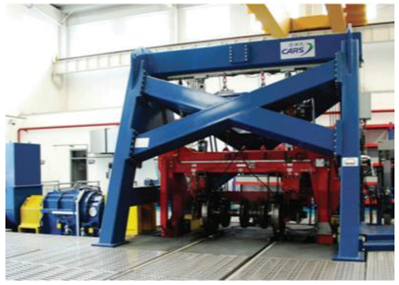 |  | not found |
| CARS Roller Rig [14] | UIUC Track Loading System [25] | ||
| bogie/vehicle |  | 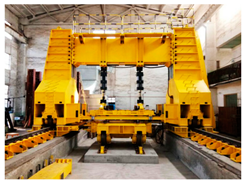 | 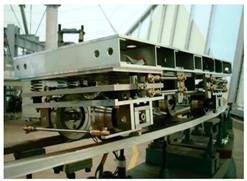 |
| SWJTU Full Scale Roller Rig [26] | TONGJI Bogie Loading Bench [27] | U Tokyo Scaled Model Vehicle [28] |
| Scale | 1:1 | 1:2 | 1:4 |
|---|---|---|---|
| Rw1 (mm) | 420 | 210 | 105 |
| Rw2 (mm) | 300 | 150 | 75 |
| Nmax * (kN) | 85 | 21.3 | 5.3 |
| P (kW) | 756 | 189 | 47 |
| PI Controller Parameters | Motor V | Motor W | |
|---|---|---|---|
| speed PI controller | kp | 8000 | 30 |
| ki | 20 | 600 | |
| current PI controller | kp | 0.3 | 0.7 |
| ki | 51.6 | 226.7 | |
Disclaimer/Publisher’s Note: The statements, opinions and data contained in all publications are solely those of the individual author(s) and contributor(s) and not of MDPI and/or the editor(s). MDPI and/or the editor(s) disclaim responsibility for any injury to people or property resulting from any ideas, methods, instructions or products referred to in the content. |
© 2023 by the authors. Licensee MDPI, Basel, Switzerland. This article is an open access article distributed under the terms and conditions of the Creative Commons Attribution (CC BY) license (https://creativecommons.org/licenses/by/4.0/).
Share and Cite
Chen, C.; Tian, C.; Zhou, J.; Zhai, G.; Yu, H. Development of a New Test-Rig for Wheel–Rail Contact Experiments under Large Slip Conditions. Appl. Sci. 2023, 13, 5320. https://doi.org/10.3390/app13095320
Chen C, Tian C, Zhou J, Zhai G, Yu H. Development of a New Test-Rig for Wheel–Rail Contact Experiments under Large Slip Conditions. Applied Sciences. 2023; 13(9):5320. https://doi.org/10.3390/app13095320
Chicago/Turabian StyleChen, Chao, Chun Tian, Jiajun Zhou, Gengwei Zhai, and Hao Yu. 2023. "Development of a New Test-Rig for Wheel–Rail Contact Experiments under Large Slip Conditions" Applied Sciences 13, no. 9: 5320. https://doi.org/10.3390/app13095320