Abstract
Electrical energy generation in solar modules is mainly limited by the increase in their temperature, and a heat removal process plays an important role. The main goal of the experiment was to keep the temperature of the cooled module below 47 °C through a series of the five short cooling and heating cycles and to determine the changes in the solar module output power during the cooling process with 96% ethyl alcohol. The optimal duration of the cooling cycles was determined to be between 3–6 min and for the heating process, it was 4–5 min. During the heating and cooling cycles the temperature of the cooled module did not exceed 42.1 °C. At the end of five active cooling cycles the temperature difference of 22.6 °C was achieved. The biggest difference in power between the cooled and uncooled module was 4.9%. The solar module efficiency was increased by 3.2%. It was concluded that alcohol, due to its evaporative losses, is not a viable cooling agent for solar modules. Nevertheless, it can serve as a potent additive in both active and passive cooling systems to augment the output power of solar modules.
1. Introduction
Global warming is considered to be one of the most hazardous anthropogenic phenomena for the entire planet. Solar modules represent a viable solution to the global energy shortage, offering a clean and readily available form of energy. Solar energy can be considered as a clean and renewable form of energy that is available all over the world. Electricity can be produced by smaller photovoltaic systems in urban areas as well as in large photovoltaic power plants [1,2].
Research indicates that only 15–20% of the Sun’s energy can be converted into electricity, with the remainder being converted into heat [3,4,5,6,7,8,9]. This leads to an increase in temperature and potential overheating of solar modules, which can reach temperatures as high as 70 °C. The temperature rise adversely affects solar cell efficiency. The mechanism behind this effect is primarily due to the increased rate of electron-hole recombination as the temperature rises. In a solar cell, when photons from the sun strike the semiconductor material, they excite electrons, creating electron-hole pairs. These free electrons and holes then move towards the p-n junction, where they are separated by the built-in electric field and generate a current. However, at high temperatures, the rate of electron-hole recombination increases, reducing the number of free electrons and holes available for generating a current. This results in a decrease in the solar cell’s efficiency [10,11].
The current-voltage curve (I-V characteristic) and the power-voltage curve (P-V characteristic) of a 100 Wp solar module were investigated depending on the solar irradiation intensity and temperature [12,13]. As the temperature increases a gradual drop in voltage occurs, while the current does not change significantly. As for the P-V characteristic the increase in the solar module temperature leads to the voltage and power decrease, therefore the electrical conversion efficiency decreases. The temperature rise of 10 °C decreases the nominal power by 5 W, i.e., by 5%, and nominal power at 65 °C was 79.5 W, while the solar irradiation remained 1000 W/m2. Also, the maximum power point (MPP) descended to the left [12]. Having this in mind, cooling techniques are necessary, and the selection of an appropriate cooling fluid is crucial [3]. The cooling fluid must meet specific requirements such as including high thermal conductivity and to effectively remove heat from the solar module [14,15]. Common cooling fluids include air, water, nanofluids, and alcohol mixtures.
Odeh et al. [16] experimentally investigated the performance of a polycrystalline solar module with water cooling. Cooling was performed using a tube (60 cm in length and 2.5 cm in diameter) consisting of 32 holes with a diameter of 5 mm, placed on the upper edge of the module. The cooling system included a submersible pump that pumped water from the tank at a flow rate of 5 L/min. During the experiment, the water temperature in the tank was close to the ambient temperature. By cooling the front side of the module with water, the temperature was reduced from 58 °C to 32 °C, and the output power was increased by 10%.
Krauter et al. [17] studied the performance of actively water-cooled solar modules. They used two solar modules with a single power of 55 W and cooling was done by 24 nozzles. On the front side of the module, an average water flow of 4.4 L/min per m2 was achieved. The average thickness of the water flow was about 1 mm, and a pump was used to circulate the water. By applying this water cooling technique, the temperature of the solar module was significantly reduced from 60 °C to 38 °C. The electrical conversion efficiency was increased by 10.5% compared to the efficiency of the uncooled module.
Balamuralikrishnan et al. [18] performed an experiment to improve the performance of a solar module by spraying water over the front surface of the module. They used LM35 temperature sensors that were attached to the front surface of the module and connected to the Programmable Logic Controller (PLC). The temperature sensors detected a moment when the temperature of the front of the module reached 35 °C and sent a signal to the PLC, which signaled the water pump to pump water from the tank for 30 s. They observed that a decrease in solar module temperature of 8 °C led to a 3% increase in electrical efficiency.
Casado et al. [19] studied the performance of photovoltaic evaporative chimney, which is a new solar-cooling system that has the dual benefit of increasing the efficiency of PV panels and cooling down a water stream to dissipate heat from a refrigeration cycle. The results show that the system successfully increasing the power generated by the PV panels by approximately 10% through its cooling effect.
Agyekum et al. [20] proposes an innovative approach by combining active and passive cooling mechanisms to enhance the electrical output of a photovoltaic (PV) module. Aluminum fins and an ultrasonic humidifier were used as a heat sink to cool the PV panel. The cooling system was able to reduce the temperature of the panel by an average of 14.61 °C and increase electrical efficiency for 6.8%.
Benato et al. [21] developed a PV spraying cooling system to control the temperature of the modules and improve electricity generation. The results showed that a cooling system can improve the module’s efficiency from 11.18% to 13.27% by reducing the temperature up to 24 °C.
Benato et al. [22] conducted a series of experiments to determine the optimal cooling arrangement that balances water-film uniformity, module temperature reduction, water consumption, and module power production. The results indicate that a cooling system equipped with three nozzles with a 90° spraying angle, an inlet pressure of 1.5 bar, and operating for 30 s followed by 120 s off, can decrease module temperature by 28 °C and improve module efficiency by 14%.
Hadipour et al. [23] developed pulsed-spray water cooling system to improve the efficiency of photovoltaic panels while reducing water consumption. The results of the study show that compared to an uncooled panel, the maximum electrical power output of the photovoltaic panel increases by about 33.3%, 27.7%, and 25.9% when using the steady-spray water cooling, the pulsed-spray water cooling with the duty cycle, DC = 1 and 0.2, respectively.
Kamarudin et al. [24] developed an automatic active cooling system for a solar panel with a real-time energy monitoring system using internet of things (IoT) technology. The operation of a cooling system is based on a cut-off temperature of 45 °C. As a result of this cooling process, the average system output power increases from 14.97 W to 18.06 W.
Naghdbishi et al. [25] conducted an experimental study on the use of multi-wall carbon nanoparticles in ethylene-glycol as a coolant for a solar module. The experiments were carried out in Qazvin, Iran. Both energy and exergy analyses were performed, revealing that the thermal and electrical efficiencies were improved by 23.5% and 4.2%, respectively.
Lotfi et al. [26] investigated cooling of the back side of a 60 W polycrystalline solar module. A channel was attached to the back side of the module, through which fluids were passed at a flow rate of about 0.4 L/min. The temperatures of modules cooled by water, ethylene glycol, and a mixture of water and ethylene glycol were, respectively, 32.7 °C, 35.6 °C, and 33.7 °C. At the same time, the temperature of the uncooled solar module reached a value of 71.6 °C. An increase in electrical efficiency by 6.84%, 6.03%, and 5.21%, respectively, was obtained. During the cooling, a temperature drop of at least 36 °C was achieved. They concluded that water, as a working fluid, has the best thermal performance compared to pure ethylene glycol and a mixture of water and ethylene glycol.
Maiti et al. [27] cooled a silicon solar module with an area of 0.13 m2 with water and a liquid filter made of an alcohol mixture. The upper glass cover of the module was removed, and in front of the module at a distance of 0.02 m, a coated glass was placed. The glass contained a mixture of ethylene glycol, propylene glycol, and glycerol in the ratio of 1:1:3 (liquid filter). The mixture used had high radiation transmittance in the spectral range specific to silicon (600–900 nm), as well as high absorption of the IR and UV spectral ranges, which increased the operating temperature of the solar module. With this cooling technique, the module’s output power was increased by about 2.4 times.
High operating temperatures of solar modules reduce their lifetime as well as the lifetime of the entire photovoltaic system. For this reason, it is necessary to efficiently cool the solar module with some suitable cooling technique in order to remove the excess heat [28]. Although it is well known that water is safe and eco-friendly solvent, it is valuable resource and with time not low-cost as it used to be. Alcohol, with the addition of nanoparticles, is utilized for cooling the back side of the module. Even though, this cooling method is more expensive and complicated, its advantage is that there are no losses caused by evaporation. In the case of the module cooling with alcohol from the front side, in closed cooling systems, polluting influence of alcohol is at low level but gain achieved by cooling is unneglectable. Given that alcohol evaporates much faster than water, the idea was to experimentally monitor the change in module temperature and electrical characteristics by cooling it from the front. Also, based on available literature, this type of examination of the effect of alcohol cooling from the front is not often investigated.
The aim of this was to experimentally determine the changes in output power of the solar module during the cooling process using 96% ethyl alcohol and to keep the temperature of the cooled module below 47 °C through a series of short cooling and heating cycles. For this purpose, an active cooling system was constructed. A plastic pipe with numerous holes was placed on the upper edge of the module, in order to form a thin layer of fluid on the front side of the module. At the same time, a pipe was placed on the lower edge of the module to collect and return the fluid back into the tank. The plastic tank was insulated during the experiment to prevent heating of the working fluid. The cooling system was equipped with a submersible pump to facilitate alcohol circulation. Continuous measurement of output power of referent and cooled solar modules were done before, during and after five cooling cycles. The optimal duration of the cooling and heating cycle of solar module was determined. After five cooling cycles, increase in power and efficiency as well as cooling and evaporation rate were achieved.
2. Materials and Methods
2.1. Theoretical Aspects
The solar module’s conversion of solar irradiation energy (G) into electrical energy is only a small fraction of the total solar irradiation energy that reaches the module’s surface . Most of the solar irradiation energy is transformed into heat, which increases the module’s temperature and internal energy . Part of this energy is released to the environment through convection and radiation, resulting in . In the case of active cooling of the module by the working fluid from the front side, the process of heat release consists of loss due to convection (), radiation (), and heat loss due to evaporation of the working fluid (), as depicted in Figure 1.
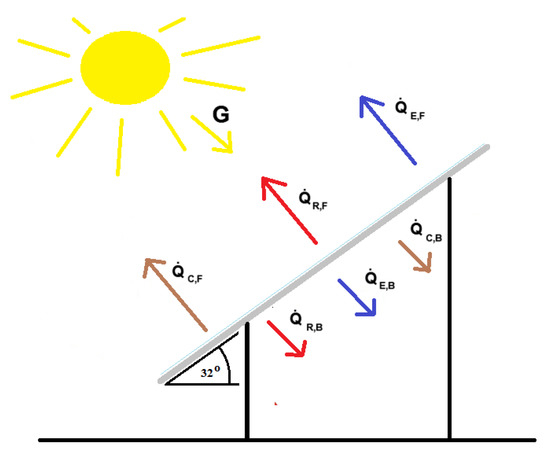
Figure 1.
The process of heat release for active cooling of the module by the working fluid from the front side.
The solar irradiation energy that reaches the module’s surface can be defined by the equation:
where represents the absorptivity coefficient. The total heat loss, , can be calculated using the following equation:
Since the process of heat release by convection occurs on both sides of the module, can be expressed as:
where and are the heats given off by convection from the front and back side of the module, respectively. and are calculated as follows:
where and represent the convection coefficients of heat transfer from the front and back sides of the module, and are the temperatures of the front and back sides of the module, and и represent the temperatures of the air around the front and back sides of the module, respectively.
The total heat loss by radiation can be expressed using the following equation:
where and represent the heat losses by radiation from the front and back side of the module, respectively. is defined as:
This equation should be formulated for both the front and back surfaces of the solar module, taking into account the relevant view factors and temperatures and . In Equation (7), is the Stefan-Boltzmann constant, represents emissivity, is the view factor for the front and back side of the module and represents the fraction of irradiation leaving one surface which is intercepted by a second surface. The temperature refers to the temperature of the front and back surfaces of the solar module, where is the ambient temperature near the front and back.
The heat loss due to evaporation can be obtained using the following equation:
A more general form of the heat loss due to evaporation is:
The variables and represent the vapor pressure on the module surface and ambient vapor pressure, respectively. The difference between and is the difference in vapor pressure of the fluid (alcohol) in the atmosphere and at the skin surface.
The evaporation coefficient plays a significant role in determining the amount of heat released through evaporation and is dependent on various factors including the temperature of the surrounding air, the temperature of the fluid and the relative humidity of the surrounding air, which is related to the water vapor pressure in the environment. The average temperature of the module is also crucial due to the rate of heat transfer between the surface of the module and the fluid [23,29].
Finally, in accordance with the first law of thermodynamics, the equilibrium equation that can be utilized to determine the temperature of solar modules is expressed as:
Here, denotes the output power of the solar module in watts [W] [29].
2.2. Experimental Setup
The city of Niš is in the south-eastern region of the Republic of Serbia, in the Nišava valley, with a moderate-continental climate and pronounced local characteristics. The experiment was conducted at the Solar Energy Laboratory located in the Faculty of Science and Mathematics in Niš, Serbia. The setup shown in Figure 2 was used to investigate the changes in output power of actively cooled solar module using 96% ethyl alcohol.
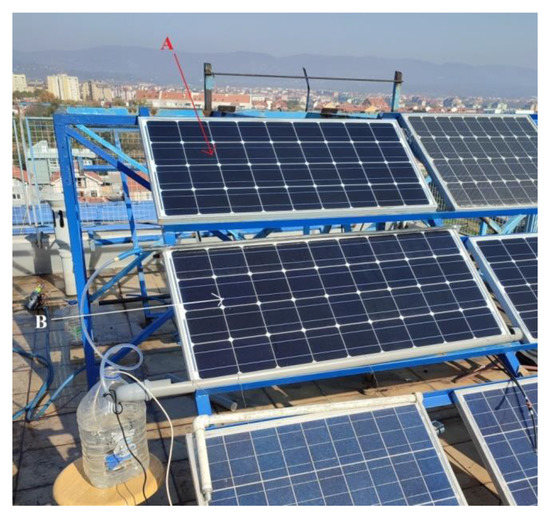
Figure 2.
Experimental setup.
Two monocrystalline silicon solar modules LX-100M/125-36 (manufactured by Luxor Solar GmbH, Stuttgart, Germany), each with output power of 100 W, were used and their technical specifications are given in Table 1.

Table 1.
Technical characteristics of LX-100M/125-36 solar module.
The solar modules were positioned one above the other at an optimal annual angle of 32° for Niš. The lower solar module (B) was equipped with an active cooling system, while the upper module (A) was used as a referent (uncooled). The front surface of the module was cooled with 96% ethyl alcohol (96% alcohol and 4% water), and its physical properties are presented in Table 2.
Table 2.
Physical property of 96% ethyl alcohol.
A pipe, 1200 mm in length, was placed on the upper edge of module B, which contained 23 holes spaced 5 cm apart, to allow the flow of alcohol over the front surface, forming a thin layer of fluid. The cooling system was equipped with a submersible pump (power of 3 W) to facilitate alcohol circulation at a flow rate of 1.5 L/min. A pipe was placed on the lower edge of the module to collect and return the fluid back into the tank. The plastic tank with a volume of 8 L was insulated during the experiment to prevent heating of the working fluid.
Continuous measurements of the modules’ output power were recorded every 5 s using the PV CHECK device (manufactured by HT ITALIA S.R.L., Faenza, Italy), (Figure 3). The solar irradiation intensity that reached the modules’ surface was measured using a pyranometer CMP22 (manufactured by Kipp & Zonen, Delft, The Netherlands) placed in the plane of the modules (at an angle of 32°). Wind speed and ambient temperature were measured using the DAVIS Vantage PRO meteorological station (manufactured by Davis Instruments Corporation, Hayward, CA, USA).
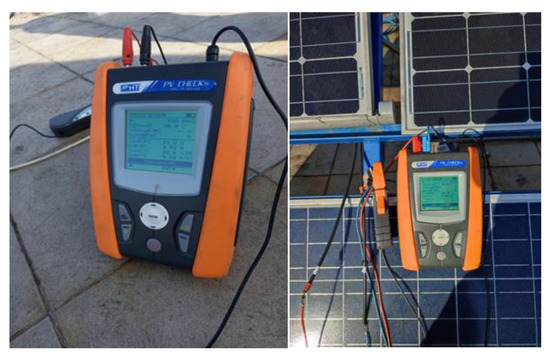
Figure 3.
PV CHECK device.
FLIR C5 (manufactured by Teledyne FLIR LLC, Wilsonville, OR, USA) infrared camera was used to measure the temperature of the solar modules before, during and after cooling and to obtain images of thermal distribution of the front and back sides of the modules. The flow rate of the working fluid was measured by a Kamstrup MULTICAL 401 device (manufactured by Kamstrup A/S, Skanderborg, Denmark), while the temperature of the working fluid in the tank was measured by a high-speed and accuracy digital thermometer NIGOS DTM-921(manufactured by Nigos elektronik, Niš, Serbia).
If ethanol is released to the atmosphere, it quickly disperses in the vapor phase and settles in low-lying areas. Since evaporated alcohol can have negative impacts on air quality and lead to safety hazards, it is important to carefully consider the use of ethanol as a cooling fluid and take appropriate safety and environmental precautions, assess in the appropriate context and in accordance with relevant regulations and guidelines [30].
Before experimental measurements, reference values of the solar modules’ electrical parameters were determined. On 1 November 2022, the experimental measurements were conducted from 10:30 to 11:30, which corresponds to solar noon and the maximum solar irradiation intensity. The solar module cooling by alcohol was carried out in five cycles, each with a duration representing the time intervals in which the pump was switched on and alcohol circulation was obtained. The alcohol flow was constant for all cycles and was 1.5 L/min. The optimal duration of the cooling cycle, with alcohol as a working fluid, was determined to be between 3–6 min for cooling and 4–5 min for heating, based on previous measurements. This time interval has been shown to maintain the temperature of the back side of the module below 47 °C (NOCT) while optimizing alcohol consumption, leading to the optimal efficiency of the cooling process.
The five solar module cooling cycles were as follows:
- Cooling cycle I, which lasted 3 min, was applied from 10:45:55 to 10:48:55, after which the module heating process followed, that lasted 4 min;
- Cooling cycle II, which lasted 4 min, was applied from 10:52:55 to 10:57:10, after which the module heating process followed, that lasted 4 min;
- Cooling cycle III, which lasted 4 min, was applied from 11:01:15 to 11:05:15, after which the module heating process followed, that lasted 5 min;
- Cooling cycle IV, which lasted 6 min, was applied from 11:10:25 to 11:16:30, after which the module heating process followed, that lasted 5 min;
- Cooling cycle V, which lasted 5 min, was applied from 11:21:20 to 11:26:20.
Based on IEC 61215 the manufacturer provides a label that guarantees operating temperatures in the range from −40 °C to +85 °C with a maximum power reduction of up to 5%. Although, the cooling and heating cycles can affect the solar module microstructure through thermally induced mechanical stresses, in this experiment the temperature difference before and after module cooling was lower than 10 °C. Before each cooling cycle, thermal images of the front and back sides of the solar modules were taken, temperatures of the front and back sides were measured and the temperature of the working fluid were recorded. The same procedure was repeated at the end of each cooling cycle. After the five cooling cycles, the loss of alcohol due to evaporation was recorded and the rate of alcohol evaporation was determined. The output power of the modules was continuously measured throughout the experiment. During the experiment, the solar modules were tested under load using a 55 W light bulb.
3. Results and Discussion
3.1. Solar Irradiation Intensity, Ambient Temperature, Solar Module Temperature
The changes in solar irradiation intensity and ambient temperature during the experiment are shown in Figure 4.
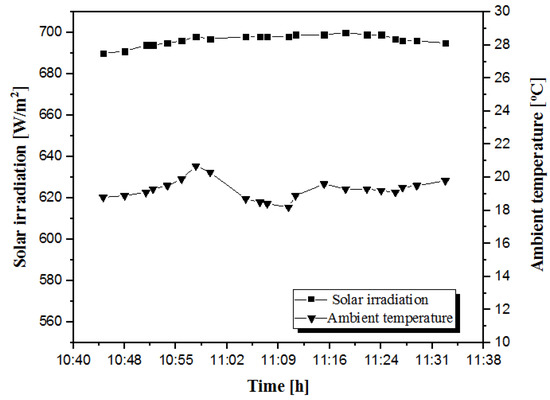
Figure 4.
Variation of solar irradiation intensity and ambient temperature during the experiment.
The ambient temperature ranged from 18.2 °C to 20.7 °C, and the average wind speed was 0.5 m/s. The solar irradiation intensity was almost constant, ranging from 690 W/m2 at the beginning of the experiment to 700 W/m2 at solar noon, and then decreased to 695 W/m2 at the end of the experiment.
Thermal images of the front side of the uncooled and cooled solar modules during the first cooling cycle are presented in Figure 5. The first image shows the front side of both modules before the cooling process. The second image shows the beginning of the cooling process, the third image shows the end of the cooling cycle, and the last image shows the front side of the cooled solar module two minutes after the end of the cooling cycle.
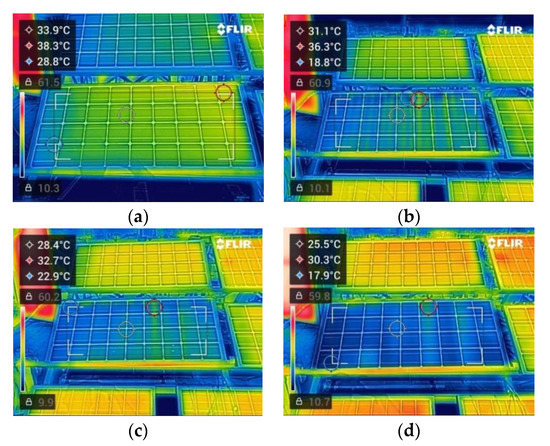
Figure 5.
Thermal images of the front side of uncooled and cooled solar module during the first cooling cycle. The images, denoted as (a–d), were taken at 10:45, 10:46, 10:48, and 10:50, respectively.
Before the first cooling cycle, the maximum temperatures of the back side of the cooled and uncooled modules were 48.4 °C and 49.4 °C, respectively, and the temperature of the working fluid was 16.5 °C. After three minutes of cooling, the maximum temperatures of the back side of the cooled and uncooled modules were 39.4 °C and 51.9 °C, respectively. The minimum temperature on the back side of the cooled module was 23.1 °C, while the minimum temperature on the back side of the uncooled module was 44 °C. The temperature of the working fluid had increased by 10.2 °C, reaching 26.7 °C.
Thermal images of the back side of the cooled module before and at the end of each cooling cycle are shown in the Figure 6 and Figure 7.
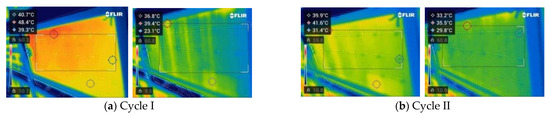
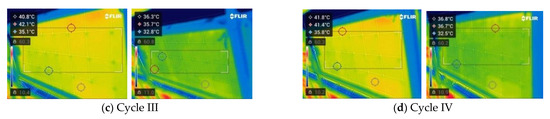
Figure 6.
Thermal images of the back side of the cooled solar module before and at the end of cooling cycle I (a), II (b), III (c) and IV (d), respectively.
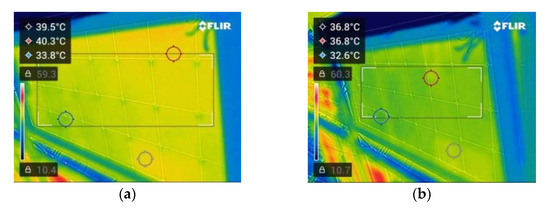
Figure 7.
Thermal images of the back side of the cooled solar module (a) before and (b) at the end of the cooling cycle V.
Based on a series of thermal images of cooling cycles, it can be seen that the temperature of the cooled module did not exceed 42.1 °C, which means that it was maintained below the NOCT value (47 °C), as intended. Furthermore, a uniform thermal distribution was achieved during all cooling cycles except the first one.
Back side temperatures of cooled and uncooled solar modules during the experiment are shown in Figure 8.
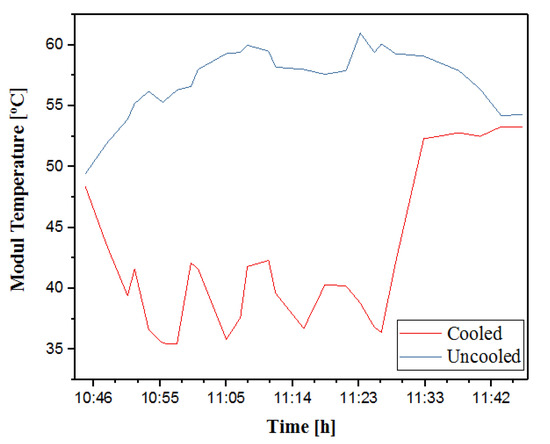
Figure 8.
Back side temperatures of cooled and uncooled solar modules during the experiment.
The temperature of the uncooled module increased with the increase of solar irradiation intensity and occasionally decreased due to gusts of wind. After solar noon, the temperature of the uncooled module slowly decreased. The maximum temperature recorded for the uncooled module was 61 °C, whereas the temperature of the cooled module was 38.8 °C at that time. The cooling cycles are clearly visible in Figure 8, accompanied by a noticeable drop in temperature. The heating process of the cooled module in between cycles is also evident. Two minutes after the end of the first cooling cycle, a temperature drop of 4.2 °C was recorded on the front side of the module. This is attributed to the evaporation of the remaining alcohol on the surface of the module after the cooling cycle. The alcohol evaporates at the expense of the solar module’s heat, leading to a temperature reduction of the front side and solar cells. Although the working fluid layer passes over the front of the module during cooling, the most intense evaporation occurs after the end of each cooling cycle, when a smaller amount of fluid remains on the surface. The wind also contributes to the evaporation of alcohol from the surface of the solar module. After all five cooling cycles, it took almost 15 min for the temperatures of the two modules to equalize.
The measured maximum temperatures of the back side of the solar modules before and after each cooling cycle, as well as the cooling rate are given in Table 3.
Table 3.
The measured maximum temperatures of the back side of the solar modules before and after each cooling cycles and the cooling rate.
As shown in Table 3, the lowest temperature of the cooled module was achieved at the end of cycle II, which was 35.5 °C. After five cycles of active cooling, the maximum temperature of the back side of the cooled solar module was 36.8 °C, while the temperature of the uncooled module was 59.4 °C, resulting in a temperature difference of 22.6 degrees.
The highest cooling rate of 3 °C/min was achieved in cycle I, while the lowest was in cycle V, which was 0.7 °C/min. The highest cooling rate in cycle I was due to the initial alcohol temperature of 16.5 °C, which increased by 11 °C by the end of the cycle, reaching 27.5 °C, as a result of heat transfer from the solar module.
The temperature change of the alcohol in the tank throughout all five cooling cycles is given in Figure 9.
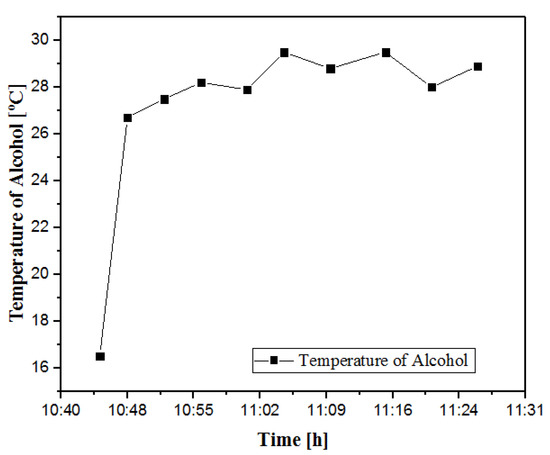
Figure 9.
Change in temperature of the alcohol in the tank during all five cooling cycles.
The points in Figure 9 indicate the beginning and end of each cooling cycle. It can be observed that the temperature of the alcohol increases with time at the expense of the heat absorbed by the alcohol from the surface of the solar module. The alcohol temperature increased by 10.2 °C after the first cooling cycle, followed by insignificant changes in temperature. At the end of the second, third, fourth, and fifth cycles, the temperature of the working fluid increased by 0.7 °C 1.6 °C, 0.7 °C, and 0.9 °C, respectively, while cooling down between cycles.
After five cooling cycles, about 0.8 L of alcohol was lost due to evaporation from the total volume of alcohol in the cooling system tank, which was 3 L. To determine the rate of alcohol evaporation, the time for which the alcohol remained after active cooling on the front side and evaporated was added to the duration of all five cycles. The total duration of all active cooling cycles is 22 min, and an additional 6 min representing the time for which the alcohol remaining on the surface evaporates were added. Hence, the rate of alcohol evaporation is approximately 0.0285 L/min.
3.2. Power and Efficiency of Cooled and Uncooled Solar Module
Changes in the power output of a solar module immediately before, during, and after five cycles of active cooling are presented in Figure 10. The upper curve represents the change in power of the cooled solar module, with the indicated moments at which each cycle starts and ends, where the labels I, II, III, IV, and V refer to the sequence number of the cycle, and the labels s and f refer to the beginning and end of the cycle, respectively.
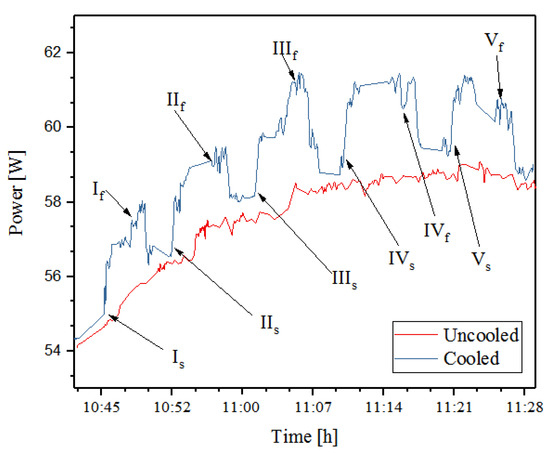
Figure 10.
Change in solar modules power immediately before, during and after cooling, for five cycles of active cooling.
The Figure 10 shows that the power of both modules increases with an increase in solar irradiation intensity. After solar noon, a slight decrease in solar irradiation intensity leads to a small decrease in the power of the modules. Before the start of the first cooling cycle, the powers of the solar modules differ slightly. However, an increase in power of the cooled solar module with each cooling cycle is clearly observed, as well as the decrease in power corresponding to the heating process of the module.
All cycles are characterized by approximately the same form of change in power. During the first 45 s of cooling with alcohol, a rapid increase in power is observed, after which the power increases slowly. This time interval corresponds to the rapid alcohol evaporation, due to greater temperature difference between solar module and alcohol. For cycle I, power increased by 3.2% during the first 45 s of cooling, while for cycle II, III, IV, and V, the power increased by 2.7%, 2.7%, 2.6%, and 2.7%, respectively. The moment immediately after the pump was turned off and the supply of alcohol to the front surface of the module has stopped can be seen, whereby the further increase in power that lasts about 70 s was recorded. It is during this time interval that intense evaporation of the alcohol remaining on the front side occurs. At the end of the first cycle, an additional increase in power from 57.33 W to 57.98 W was recorded, which is an increase of 1.1%. This increase is consistent with the decrease in modules temperature noted for cycle I. At the end of cycles II, III, IV, and V, an additional increase in power by 0.9%, 0.3%, 0.4%, and 0.6% was recorded, respectively.
The measured power values before and after the cooling cycles, as well as the percentage difference in power before the start and at the end of each cycle are shown in Table 4.
Table 4.
Measured power values before and after the cooling cycles and the percentage difference in power before the start and at the end of each cycle.
Based on the values given in Table 4, it can be seen that the biggest change in power occurred at the end of cycle III, when the power of the cooled module was 4.9% higher than the power of the uncooled module. Before the beginning of the cooling cycle I, when both modules were heated, the power of the cooled module was 0.3% higher than the power of the uncooled module. Before the beginning of cycle V, the power of the cooled module was higher by 1.1% due to the greater difference in modules temperature. The pump used in the experiment operated in five minutes cycles and consumes power of 2.32 W/m2 per hour, which applies for one sunny day in November.
Figure 11 shows the change in solar modules efficiency before, during, and after cooling for five cycles of active cooling.
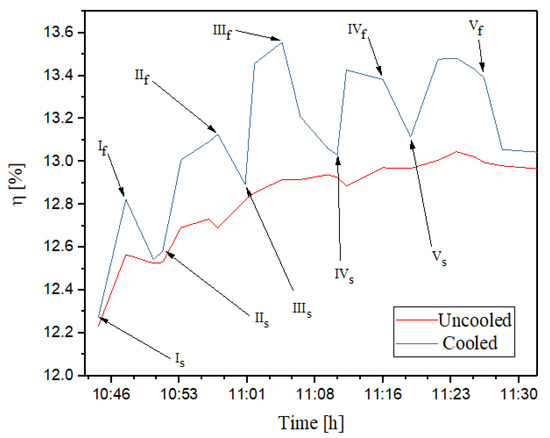
Figure 11.
Change in solar modules efficiency immediately before, during and after cooling, for five cycles of active cooling.
The efficiency of both modules increases with an increase in solar irradiation intensity. The efficiency of the modules changes in exactly the same way as their power, and Figure 11 shows the calculated efficiency for certain moments before, during, and after cooling. The increase in efficiency of the cooled solar module for each cooling cycle is clearly observed, as well as the decrease in efficiency corresponding to the heating process of the module. Calculated efficiency before the start and at the end of the cooling cycles, as well as the percentage difference in efficiency, are shown in Table 5.
Table 5.
Calculated efficiency before and after the cooling cycles, as well as the percentage difference in efficiency before the start of the cycle and at the end of the cycle.
The greatest difference in efficiency (4.9%) was observed at 11:05 at the end of cooling cycle III that lasted 4 min. During this cycle, a decrease in ambient temperature and a slight increase in wind speed were recorded. On average, solar module efficiency for all five cooling cycles increased by 3.2%.
Alcohol, due to its ability to quickly enhance the module’s performance, can be used as an addition to active and passive cooling for further increase in the output power of a solar module. Thus, reducing the alcohol consumption caused by evaporation and achieving higher module efficiency in already cooled modules. For this purpose, alcohol can be used for cooling cycles lasting 1 to 2 min.
4. Conclusions
Increase in the solar modules temperature is the main limiting factor for electrical energy generation, thus heat removal process plays an important role.
The measurements presented in this paper were taken on a clear, sunny day on 1 November 2022 in Niš, Serbia (which has a moderate-continental climate). During the experiment the ambient temperature ranged from 18.2 °C to 20.7 °C, and the average wind speed was 0.5 m/s. The solar irradiation intensity was around 700 W/m2. Based on the measurement results, it can be concluded that the temperature of the cooled module did not exceed 42.1 °C, which means that it was maintained below the NOCT value of 47 °C. The lowest temperature of the cooled module was achieved at the end of cycle II and was 35.5 °C. After five cycles of active cooling, the maximum temperature of the back side of the cooled solar module was 36.8 °C, while the temperature of the uncooled module was 59.4 °C, resulting in a temperature difference of 22.6 degrees. The highest cooling rate was achieved in cycle I and was 3 °C/min, while the lowest was in cycle V at 0.7 °C/min. Alcohol loss due to evaporation, after five cooling cycles, was measured and the rate of evaporation was 0.0285 L/min.
All cycles are characterized by approximately the same form of change in power, with rapid increase in power for the first 45 s of cooling, after which the power increases slowly. When the each cooling cycle ends, a further increase in power due to rapid alcohol evaporation, which lasts about 70 s, was recorded. For the first 45 s in cycle I, power increased by 3.2%, in cycle II by 2.7%, in cycle III by 2.7%, in cycle IV by 2.6%, and in cycle V by 2.7%. The time interval of 70 s after the pump was turned-off, an additional increase in power was recorded: 1.1% for cycle I, 0.9% for cycle II, 0.3% for cycle III, 0.4% for cycle IV, and 0.6% for cycle V. The highest increase in power occurred at the end of cycle III, when the power of the cooled module was 4.9% higher than the power of the uncooled module. On average, solar module efficiency for all five cooling cycles increased by 3.2%.
Based on the obtained results, a recommendation of additional alcohol cooling system for the already existing active and passive cooling systems in solar modules can be given, since alcohol cooling can be applied for further increase the solar module’s power output and delay the start of a new cooling cycle.
Author Contributions
The following authors contributed to conceptualization, S.D., L.P., M.K., I.R., A.P. and M.M.; methodology, S.D. and L.P.; formal analysis, S.D. and A.P.; investigation, S.D. and L.P.; writing—original draft preparation, S.D., A.P. and L.P.; writing—review and editing, S.D., L.P., M.K., M.M. and I.R., visualization, S.D. and M.K.; supervision, L.P., M.M. and I.R.; project administration S.D. and L.P. All authors have read and agreed to the published version of the manuscript.
Funding
This work was financially supported by the Faculty of Sciences and Mathematics, University of Niš, and the Ministry of Science, Technological Development and Innovation of the Republic of Serbia (Contract No. 451-03-47/2023-01/200124). This research was financially supported by the Ministry of Science, Technological Development and Innovation of the Republic of Serbia (Contract No. 451-03-47/2023-01/200109). This work has been supported by the Ministry of Science, Technological Development and Innovation of the Republic of Serbia (Contract No. 451-03-47/2023-01/200102).
Institutional Review Board Statement
Not applicable.
Informed Consent Statement
Not applicable.
Data Availability Statement
The data that support the findings of this study are openly available on request.
Conflicts of Interest
The authors declare no conflict of interest.
References
- Hattam, S.Y. Experimental and Numerical Study to Improve the Performance of Solar Cell Using Water Cooling System; Al-furat Al-awsat Technical University Engineering Technical College: Najaf, Iraq, 2022. [Google Scholar]
- Al-Waeli, A.H.A.; Sopian, K.; Chaichan, M.T.; Kazem, H.A.; Hasan, H.A.; Al-Shamani, A.N. An Experimental Investigation of SiC Nanofluid as a Base-Fluid for a Photovoltaic Thermal PV/T System. Energy Convers. Manag. 2017, 142, 547–558. [Google Scholar] [CrossRef]
- Singh Madan Mohan, D.; Nath Tripathi, M.; Singh, D. A Review on Performance Improvement of Solar Photovoltaic Using Various Cooling Methods. In Proceedings of the International Conference on “Advances and Soft Computing Applications in Design and Manufacturing (ASCADM-2018)”, MED, NIT Patna, Patna, India, 4–6 June 2018. [Google Scholar]
- Salman, A.H.A.; Hilal, K.H.; Ghadhban, S.A. Enhancing Performance of PV Module Using Water Flow through Porous Media. Case Stud. Therm. Eng. 2022, 34, 102000. [Google Scholar] [CrossRef]
- Tomar, V.; Tiwari, G.N.; Bhatti, T.S.; Norton, B. Thermal Modeling and Experimental Evaluation of Five Different Photovoltaic Modules Integrated on Prototype Test Cells with and without Water Flow. Energy Convers. Manag. 2018, 165, 219–235. [Google Scholar] [CrossRef]
- Govardhanan, M.S.; Kumaraguruparan, G.; Kameswari, M.; Saravanan, R.; Vivar, M.; Srithar, K. Photovoltaic Module with Uniform Water Flow on Top Surface. Int. J. Photoenergy 2020, 2022, 1–9. [Google Scholar] [CrossRef]
- Safitra, A.G.; Sholihah, F.H.; Fauziyyah, I.N. Experimental Study of Slope Angle and Low e Glazing Effects on Photovoltaic Module. IOP Conf. Ser. Earth Environ. Sci. 2018, 105, 012027. [Google Scholar] [CrossRef]
- Grubišić-Čabo, F.; Nižetić, S.; Marco, T.G. Photovoltaic panels: A review of the cooling techniques. Trans. FAMENA 2016, 40, 63–74. [Google Scholar]
- Teo, H.G.; Lee, P.S.; Hawlader, M.N.A. An Active Cooling System for Photovoltaic Modules. Appl. Energy 2012, 90, 309–315. [Google Scholar] [CrossRef]
- Pantic, L.S.; Pavlović, T.M.; Milosavljević, D.D.; Radonjic, I.S.; Radovic, M.K.; Sazhko, G. The Assessment of Different Models to Predict Solar Module Temperature, Output Power and Efficiency for Nis, Serbia. Energy 2016, 109, 38–48. [Google Scholar] [CrossRef]
- Skoplaki, E.; Palyvos, J.A. On the Temperature Dependence of Photovoltaic Module Electrical Performance: A Review of Efficiency/Power Correlations. Sol. Energy 2009, 83, 614–624. [Google Scholar] [CrossRef]
- Pretvornika, F. Utjecaj Temperature Na Efikasnost Solarnih Fotonaponskih Pretvornika. Ph.D. Thesis, University of Split, Split, Croatia, 2022. [Google Scholar]
- Amelia, A.R.; Irwan, Y.M.; Leow, W.Z.; Irwanto, M.; Safwati, I.; Zhafarina, M. Investigation of the Effect Temperature on Photovoltaic (PV) Panel Output Performance. Int. J. Adv. Sci. Eng. Inf. Technol. 2016, 6, 682–688. [Google Scholar]
- Zubeer, S.A.; Mohammed, H.A.; Ilkan, M. A Review of Photovoltaic Cells Cooling Techniques. In Proceedings of the E3S Web of Conferences, Semarang, Indonesia, 15–16 August 2017; Volume 22. [Google Scholar]
- Murtadha, T.K.; Hussein, A.A. Optimization the Performance of Photovoltaic Panels Using Aluminum-Oxide Nanofluid as Cooling Fluid at Different Concentrations and One-Pass Flow System. Results Eng. 2022, 15, 100541. [Google Scholar] [CrossRef]
- Odeh, S.; Behnia, M. Improving Photovoltaic Module Efficiency Using Water Cooling. Heat Transf. Eng. 2009, 30, 499–505. [Google Scholar] [CrossRef]
- Krauter, S. Increased Electrical Yield via Water Flow over the Front of Photovoltaic Panels. Sol. Energy Mater. Sol. Cells 2004, 82, 131–137. [Google Scholar] [CrossRef]
- Balamuralikrishnan, B.; Deepika, B.; Nagajothi, K.; Shubaashree, S.; Subasini, P.T. Efficiency Enhancement of Photovoltaic Cell. Int. J. Adv. Res. Electr. Electron. Instrum. Energy 2014, 3, 305–313. [Google Scholar]
- Casado, P.; Blanes, J.M.; Valero, F.J.A.; Torres, C.; Miralles, M.L.; Ramírez, J.R. Photovoltaic Evaporative Chimney I-V Measurement System. Energies 2021, 14, 8198. [Google Scholar] [CrossRef]
- Agyekum, E.B.; PraveenKumar, S.; Alwan, N.T.; Velkin, V.I.; Shcheklein, S.E.; Yaqoob, S.J. Experimental investigation of the effect of a combination of active and passive cooling mechanism on the thermal characteristics and efficiency of solar PV module. Inventions 2021, 6, 63. [Google Scholar] [CrossRef]
- Benato, A.; Stoppato, A.; De Vanna, F.; Schiro, F. Spraying Cooling System for Pv Modules: Experimental Measurements for Temperature Trends Assessment and System Design Feasibility. Designs 2021, 5, 25. [Google Scholar] [CrossRef]
- Benato, A.; Stoppato, A. An Experimental Investigation of a Novel Low-Cost Photovoltaic Panel Active Cooling System. Energies 2019, 12, 1448. [Google Scholar] [CrossRef]
- Hadipour, A.; Rajabi Zargarabadi, M.; Rashidi, S. An Efficient Pulsed- Spray Water Cooling System for Photovoltaic Panels: Experimental Study and Cost Analysis. Renew. Energy 2021, 164, 867–875. [Google Scholar] [CrossRef]
- Kamarudin, M.N.; Rozali, S.M.; Jamri, M.S. Active Cooling Photovoltaic with Iot Facility. Int. J. Power Electron. Drive Syst. 2021, 12, 1494–1504. [Google Scholar] [CrossRef]
- Naghdbishi, A.; Yazdi, M.E.; Akbari, G. Experimental Investigation of the Effect of Multi-Wall Carbon Nanotube-Water/Glycol Based Nanofluids on a PVT System Integrated with PCM-Covered Collector. Appl. Therm. Eng. 2020, 178, 115556. [Google Scholar] [CrossRef]
- Lotfi, M.; Shiravi, A.H.; Bahrami, T.; Firoozzadeh, M. Cooling of PV Modules by Water, Ethylene-Glycol and Their Combination; Energy and Environmental Evaluation. J. Sol. Energy Res. 2022, 7, 1047–1055. [Google Scholar]
- Maiti, S.; Vyas, K.; Ghosh, P.K. Performance of a Silicon Photovoltaic Module under Enhanced Illumination and Selective Filtration of Incoming Radiation with Simultaneous Cooling. Sol. Energy 2010, 84, 1439–1444. [Google Scholar] [CrossRef]
- Ristić, S. Fizička Elektronika; Elektronski fakultet: Niš, Srbija, 2008. [Google Scholar]
- Nižetić, S.; Čoko, D.; Yadav, A.; Grubišić-Čabo, F. Water Spray Cooling Technique Applied on a Photovoltaic Panel: The Performance Response. Energy Convers. Manag. 2016, 108, 287–296. [Google Scholar] [CrossRef]
- Massachusetts Department of Environmental Protection. Large Volume Ethanol Spills—Environmental Impacts & Response Options; Massachusetts Department of Environmental Protection: Boston, MA, USA, 2011. [Google Scholar]


Disclaimer/Publisher’s Note: The statements, opinions and data contained in all publications are solely those of the individual author(s) and contributor(s) and not of MDPI and/or the editor(s). MDPI and/or the editor(s) disclaim responsibility for any injury to people or property resulting from any ideas, methods, instructions or products referred to in the content. |
© 2023 by the authors. Licensee MDPI, Basel, Switzerland. This article is an open access article distributed under the terms and conditions of the Creative Commons Attribution (CC BY) license (https://creativecommons.org/licenses/by/4.0/).