Article

Numerical Investigation of the Heat Transfer Characteristics and Wall Film Formation of Spray Impingement in SCR Systems

1
School of Mechanical and Precision Instrument Engineering, Xi’an University of Technology, Xi’an 710048, China
2
College of Frontier Cross, Hunan University of Technology and Business, Changsha 410205, China
*
Author to whom correspondence should be addressed.
Appl. Sci. 2023, 13(9), 5353; https://doi.org/10.3390/app13095353
Submission received: 3 March 2023 / Revised: 22 April 2023 / Accepted: 24 April 2023 / Published: 25 April 2023

Abstract

:
This work established a numerical model to investigate the heat transfer characteristics and wall film formation of spray impinging on the wall in the selective catalytic reduction (SCR) system. The model is developed by the Eulerian–Lagrangian approach, where the Lagrangian approach is used to represent the spray generated by a commercial non-air-assisted pressure-driven injector and the Eulerian approach is adopted to represent exhaust gas. The Stochastic Kuhnke Model is applied to spray/wall interaction. The model considers relevant processes, which include mass transfer, momentum transfer, heat transfer, droplet phase change, spray/wall interaction, and wall film formation. The numerical results compared with that of the experiment indicate that the model can accurately estimate the heat transfer characteristics of the wall surface during the spray impingement. Based on the numerical results, the causes of the spray local cooling effect and the rapid cooling effect are analyzed. The correlation between the critical transition temperature and the critical heat flux temperature for wall film formation is derived from the trends of wall temperature and heat flux. In this work, the Stochastic Kuhnke Model is applied and compared with the Kuhnke Model, which proves that it can improve the disadvantage of sudden change during the wall film formation. When the wall temperature is below the critical transition temperature, the wall film mass is sensitive to the wall temperature and increases as the wall temperature decreases.

1. Introduction

Increasing air pollution due to vehicle exhausts and increasingly stringent emission regulations require the advanced purification technology of automobile exhaust or further optimized control strategies to improve purification efficiency [1,2]. As one of the major mobile source pollutants, nitrogen oxides (NOx) are mainly released by diesel vehicles [3]. Selective catalytic reduction (SCR) is a state-of-the-art method to reduce NOx emissions with minimal impact on engine efficiency [4]. Ammonia (NH3) is usually chosen as the reductant to selectively reduce NOx to nitrogen (N2) [5]. In mobile source applications, the urea water solution (UWS) is generally adopted as an ammonia precursor due to its nontoxicity and convenient storage [6,7]. UWS is sprayed into the SCR system through an injector, and NH3 is finally generated through the processes of evaporation, pyrolysis, and hydrolysis. This series of processes strongly influences the reduction efficiency of the SCR system.
Due to the relatively long time scale required for urea decomposition and the trend toward the compact design of the post-treatment system [8], the incomplete decomposition of urea and spray impingement are inevitable. Spray impingement can lead to the local cooling of the exhaust pipe and mixer, which causes the formation of liquid film when the wall temperature drops. The heat transfer between the liquid film and the wall furtherly occurs, which results in a number of problems, such as the nonhomogeneous distribution of urea [9] and the low decomposition efficiency of urea [10,11] as well as deposit formation [12,13] when the temperature of the liquid film reaches a specific interval. The spatial distribution uniformity of the reductant and the conversion efficiency of the reductant are crucial factors for the denitration efficiency of the SCR system. These two factors can be affected by spray/wall interaction besides evaporation and decomposition. Therefore, it is necessary to recognize the heat transfer characteristics during spray impingement.
There have been many findings on the heat transfer of spray/wall interaction during spray impingement so far. Musa et al. [14] investigated the evaporation characteristics of a single UWS droplet on a heated surface and found that the evaporation pattern can be classified into two different forms, namely, rapid evaporation and slow evaporation, with the critical heat flux as the demarcation point. Wang et al. [15] reached similar conclusions via an electric furnace experiment under static conditions about the multi-stage evaporation behavior of UWS droplets. The first stage is the evaporation of water that follows the D2 law. The second stage is characterized by a micro-explosion, the extent of which is determined by the ambient temperature. Meanwhile, some academics realized the significance of spray/wall interaction and investigated its mechanism. Kuhnke [16] considers all relevant impingement phenomena by classifying them into four regimes based on the Mundo number K and the wall temperature: spread (or deposition), rebound, splash, and dry splash (thermal breakup). The deposition and splash regimes lead to the formation of a wall film. Grout et al. [17] adopted the synthetic Schlieren method to enable the transient visualization study of liquid film and used Mie scattering to show a side view of the spray penetration distribution under exhaust flow conditions. Eventually, the global spray evaporation rate is derived from consecutive distributions. Ravikuma et al. [18] measured temperatures at different positions of the wall during air-assisted spray impingement by thermocouples and investigated the effect of an aqueous polymer additive on the heat flux. Fu et al. [19] investigated the correlation between different spray inclination angles and the temperature of the spray impingement zone and deduced the optimal angle at which the heat flux density is maximized. Nayak et al. [20] systematically investigated the effects of spray characteristics (e.g., mass flux, inlet pressure, and nozzle tip to wall) and plate thicknesses on heat transfer. Farshchian et al. [21] found that higher spray impingement velocity contributes to the heat transfer between the droplets and the wall. Liao et al. [1] used infrared thermography to investigate the heat transfer characteristics of spray/wall interaction during spray impingement under typical diesel exhaust flow conditions and derived the effect of the exhaust flow conditions on the heat transfer characteristics. Wang et al. [22] investigated the influence of injection rate, injection height, and crossflow on wall temperature evolution with infrared thermography. The results show that at higher jet densities, a higher injection rate promotes the cooling rate of the wall and the diffusion of the low temperature area. A lower injection height results in droplet breakup and promotes evaporation. Crossflow leads to an asymmetric distribution of wall temperature around the impinging center.
Since the study of the heat transfer of spray/wall interaction is very challenging, it is increasingly important to investigate its characteristics via computational fluid dynamics (CFD). Well-established mathematical models have been built to investigate the heat transfer characteristics of spray impingement in SCR systems. Birkhold et al. [23] included spray/wall interaction in his numerical model of UWS injection to calculate the formation of a wall film. An improved surface tension model was developed to improve the prediction accuracy of the liquid film distribution in the work of Baleta et al. [24]. Rogóż et al. [25] proposed a two-zone spray model for the injection process of UWS. The proposed model can calculate the distribution of liquid film more accurately and, thus, improve the prediction accuracy of ammonia distribution uniformity.
In this work, a numerical model of the spray process for the SCR system is proposed and implemented in the commercial CFD software FLUENT to investigate the heat transfer characteristics of the spray/wall impingement under the typical low load exhaust flow conditions of a diesel engine. A spray model developed in our previous study is applied to characterize the inhomogeneous mass distribution in the spray cone. The Stochastic Kuhnke Model is applied to account for spray/wall interaction properties by using the Weber number and critical transition temperature. The calculated heat transfer characteristics of spray/wall interaction are verified with the experimental results in ref. [1]. In addition, the effects of different spray/wall interaction models and initial wall temperatures on the wall film formation are simulated and discussed.

2. Numerical Methods and Model Setup

In this work, a numerical model is developed to study the heat transfer characteristics and wall film formation of spray impingement under low load exhaust conditions, in which the Eulerian–Lagrangian method is adopted to solve the multiphase flow. The model considers mass transfer, momentum transfer, heat transfer, water evaporation, spray/wall interaction, and wall film formation.

2.1. Governing Equations of the Continuous Phase

The continuous phase (exhaust gas) is regarded as an ideal gas, which obeys the conservation of mass, momentum, and energy. The unsteady governing equations of the continuous phase are:
ρ g t + ( ρ g u ) = S m
t ( ρ g u ) + ( ρ g u u ) = p + ( τ = ) + ρ g g + S f
t ( ρ g ( e + u 2 2 ) ) + ( ρ g u ( h + u 2 2 ) ) = ( k e T i h i j i + τ = e u ) + S h
with gas density ρg; velocity vector u; mass source term Sm; static pressure p; stress tensor τ = ; gravitational acceleration g; momentum source term Sf; internal energy e; velocity scalar u; enthalpy h; effective conductivity ke; diffusion flux for ith spiece j i ; heat source term Sh.

2.2. Governing Equation of the Discrete Phase

The droplets in spray are represented in the Lagrangian approach. The trajectory of a discrete phase droplet is predicted by integrating the force balance on the droplet. This force balance equates the particle inertia with the force acting on the droplet, which is written in a Lagrangian coordinate. The equation can be written as:
m l d u l d t = m l u g u l τ r + m l g ( ρ l ρ g ) ρ l + F d
where ml is the droplet mass, ul and ug represent the liquid velocity and gas velocity, respectively, τ r corresponds to the droplet relaxation time, and Fd represents the additional force.

2.3. Evaporation Model

In the case of UWS spray evaporation, the model has been adopted following the approach of Abramzon [26,27,28]. The evaporization rate and temperature variation rate can be derived from the mass and energy conservation equations in the surrounding gas of the droplet surface, which are as follows:
d m l d t = π d l ρ g Γ i , m S h ln ( 1 + B m )
d T l d t = d m l d t 1 m l c p , l ( c p , v ( T g T l ) B T L )
with droplet mass ml; droplet diameter dl; gas density ρg; diffusion coefficient of vapor in the bulk Γi,m; Sherwood number Sh; Spalding mass number Bm; temperature of droplet Tl; heat capacities of droplet cp,l; heat capacities of vapor cp,v; temperature in the bulk gas Tg; droplet temperature Tl; Spalding heat transfer number BT; latent heat of vaporization L. Bm and BT are calculated as:
B m = Y v , s Y v , g 1 Y v , s
B T = ( 1 + B m ) 1 L e S h N u r p C p , v C p , g 1
where Yv,s and Yv,g comprise the vapor mass fraction at the surface vapor and in the bulk gas; Le represents the Lewis number; Nurp corresponds to the Nusselt number calculated from the Reynolds number and the Prandtl number; cp,g is the heat capacity of gas.
The evaporation model considers the influence of Stefan flow on mass and heat transfer, where the mass transfer coefficient and the convective heat transfer coefficient are calculated with the modified Sherwood number and the Nusselt number [29,30].

2.4. Wall Film Model

The wall film model uses transient Lagrangian particles to simulate liquid droplets colliding with walls and forming thin liquid films.

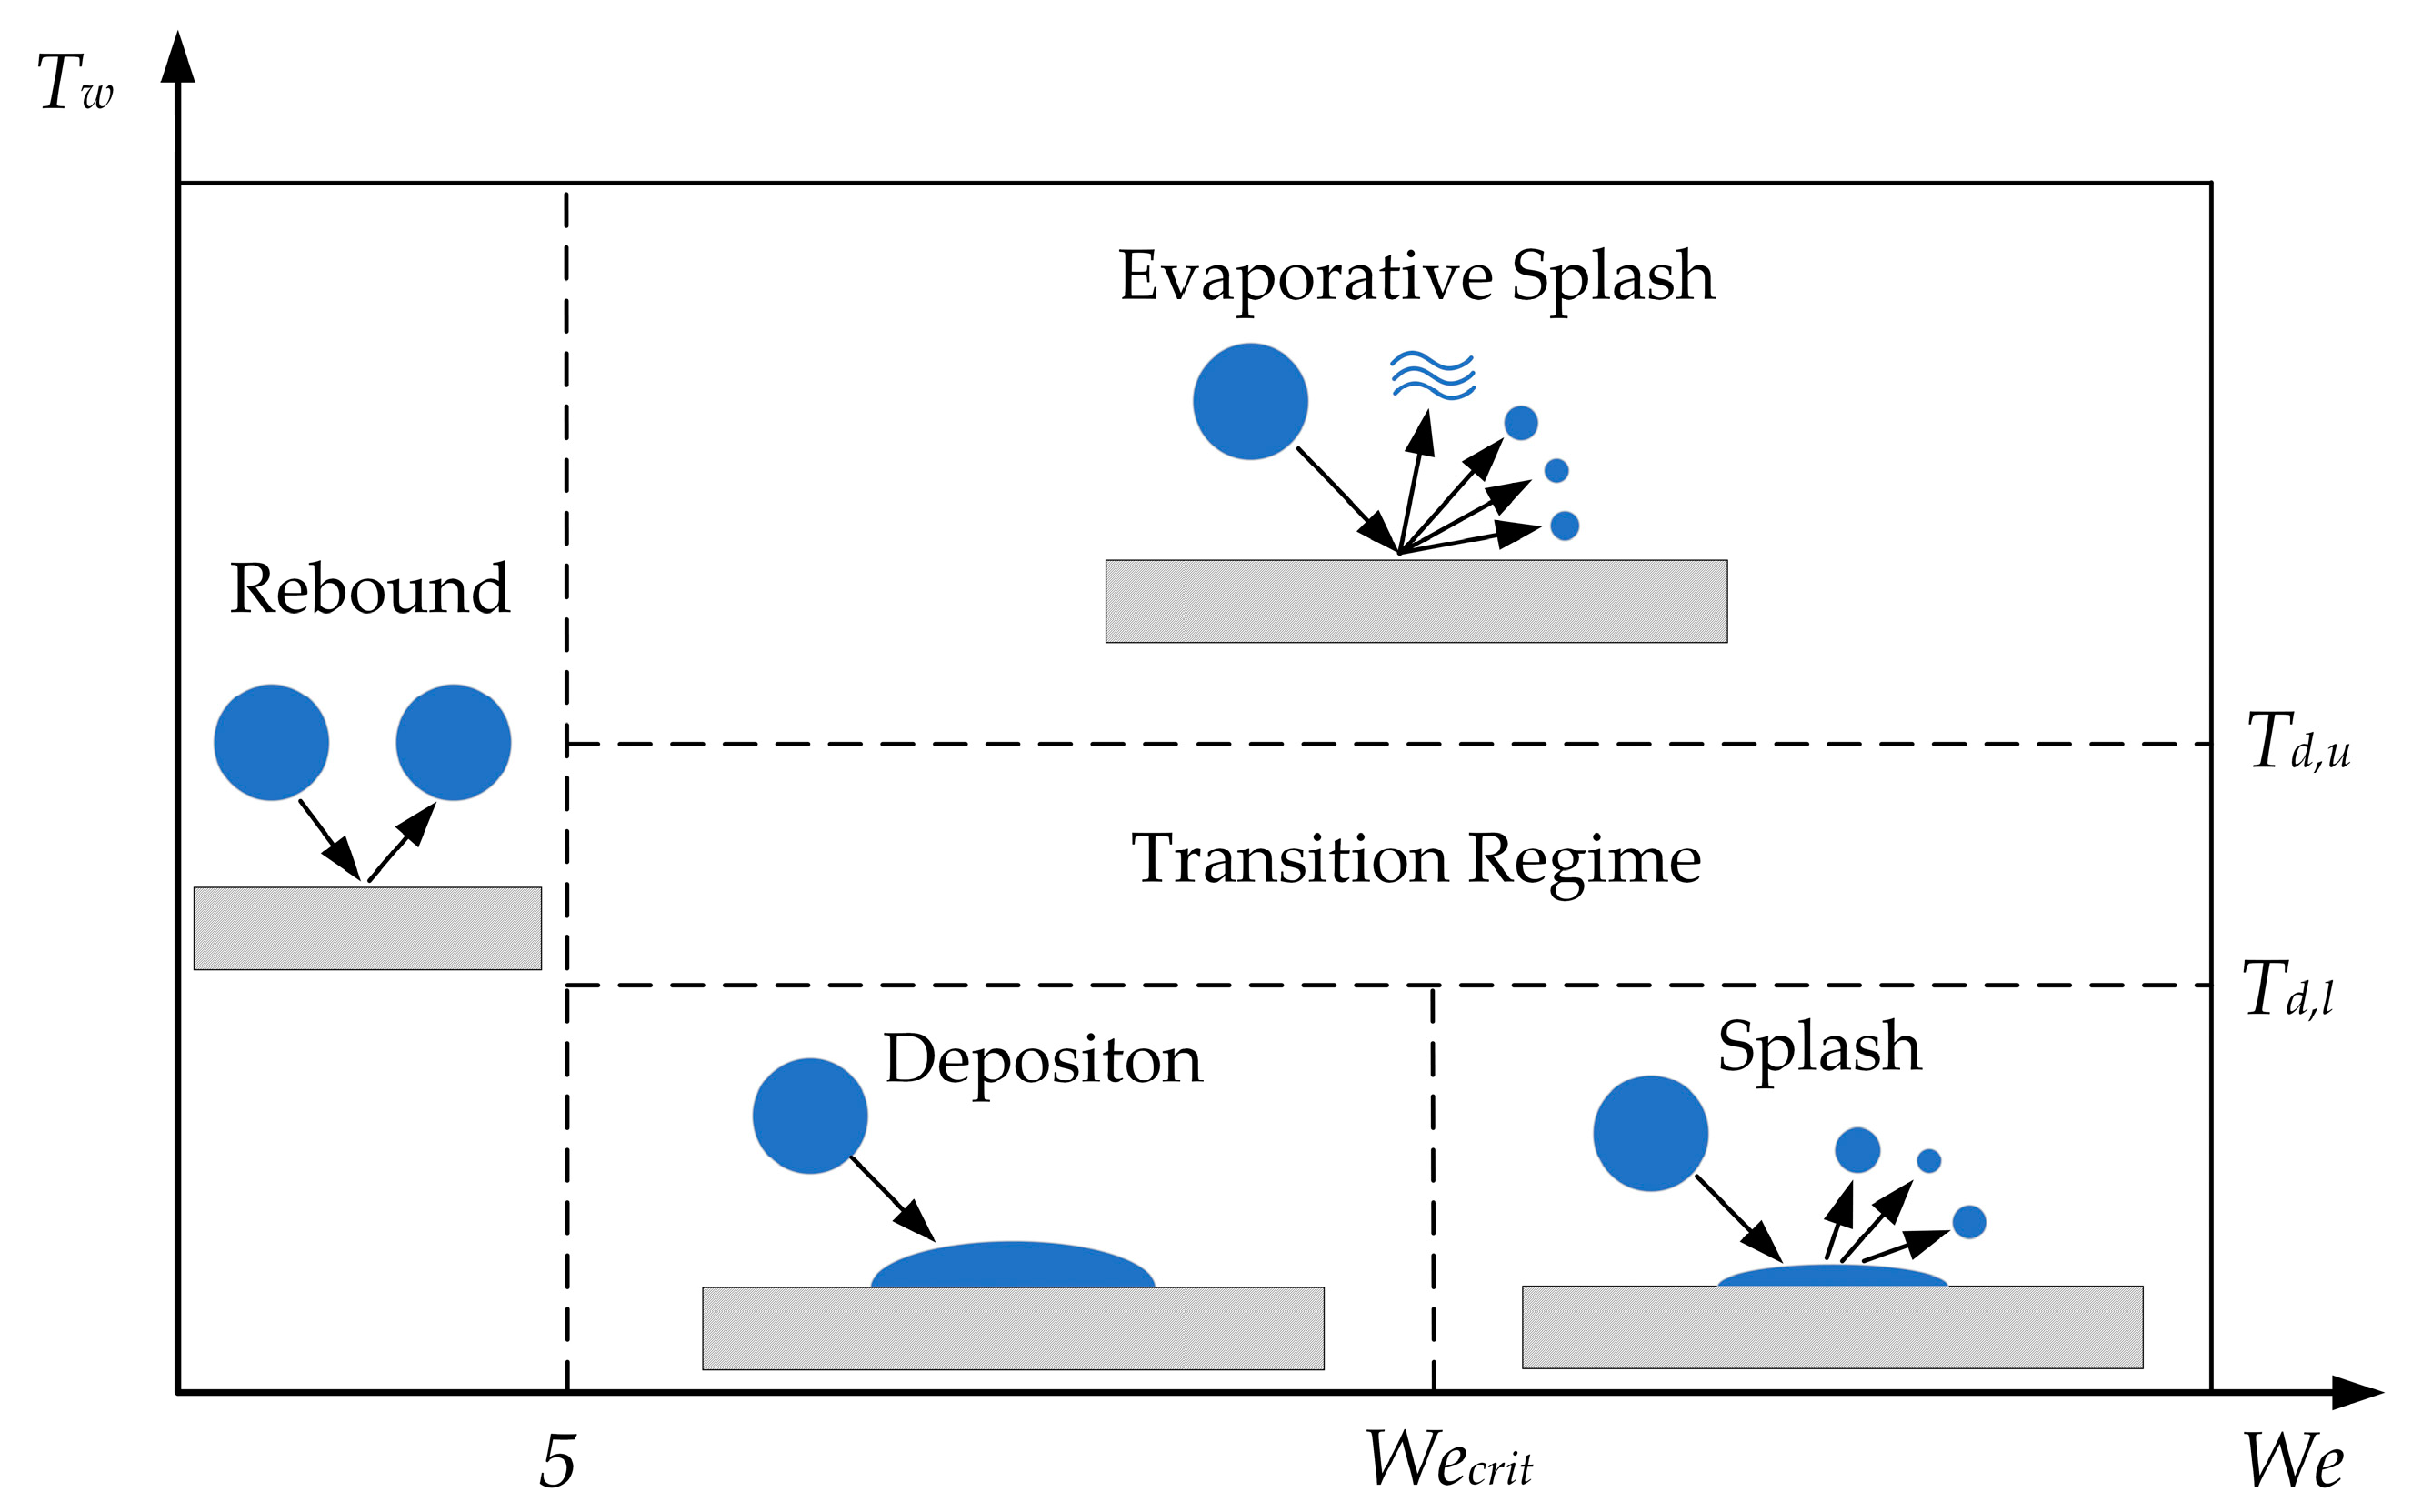
2.4.1. Spray Impingement Model

The physical mechanisms during spray/wall impingement are complex because of the large number of parameters involved. The outcome of any impingement is governed by the droplet properties (density, viscosity, or surface tension), the impingement conditions (droplet diameter or droplet velocity), and wall characteristics (wall temperature, surface roughness, or wall film thickness). Therefore, the Stochastic Kuhnke Model was used to calculate the spray/wall interaction in this study. The model classifies all relevant impingement behaviors into four regimes based on critical temperature and the Weber number: rebound, spread, splash, and evaporative splash. The spread and splash regimes are the main causes of wall film formation. The transition regime is introduced to improve the prediction accuracy of the wall film production quantity. The critical value of regime transition is as described below. The upper and lower limits of the critical deposition temperature are defined as follows:
T d , u = T s a t + Δ T o
T d , l = T d , u Δ T r
with upper limit of deposition temperature Td,u; droplet saturation temperature Tsat; upper limit offset of deposition temperature ∆To; lower limit of deposition temperature Td,l; temperature difference of deposition range ∆Tr.
The critical Weber number for the transition between the spread and splash regimes is defined according to the initial conditions of the wall:
W e c r i t , w = A c L a 0.18
W e c r i t , d = A L a 0.18
where Wecrit,w and Wecrit,d comprise the critical Weber number for impinging wet and dry walls, respectively; Ac refers to the Laplace number constant; La corresponds to the Laplace number; A is a function of wall roughness. The regime map of the Stochastic Kuhnke Model is sketched in Figure 1.

2.4.2. Governing Equations for Wall Film

The wall film model in this study is based on O’Rourke’s work. The governing equations of mass, momentum, and energy for individual parcels are as follows:
N · = N u r s Γ i A f m l / m f ρ g ln ( 1 + B m )
d u l d t = τ g i ρ l δ f + 2 μ f u w ρ l δ f 2 + ( g α w ) 2 μ f ρ l δ f 2 u l
d d t ( m l c p , l T l ) = k f ( A f m l / m f ) δ f / 2 ( T w T l ) + ( A f m l / m f ) K f ( T g T s ) d m l d t L
with vapor mass flux N · ; Nusselt number calculated from the Reynolds number and the Schmidt number Nurs; binary diffusivity of ith species Γi; wall film face area Af; wall film mass mf; shear stress of the gas flow on the wall film surface τg; unit vector in the direction of the wall film surface velocity i; film thickness at the parcel location δf; liquid film viscosity μl; wall velocity uw; thermal conductivity of the wall film kf; wall temperature Tw; wall film surface temperature Ts.

2.5. Model Setup

A three-dimensional computational domain with 986,487 cells of 150 mm in length and 80 mm by 80 mm in cross section was used. Polyhexcore meshing was adopted to generate hexahedral cells inside the core of the domain and polyhedron cells close to the boundaries. The base–element sizes of the surface mesh and volume mesh were set to 0.5–1 mm and 0.5–2 mm. A 304 stainless steel sheet with a thickness of 0.3 mm was placed 14 mm above the bottom of the flow channel as a spray impingement wall. The spray was injected from the top of the channel at an angle of 50° toward the gas flow direction. The sectional view of the computational domain is illustrated in Figure 2. The calculations were conducted with the mass transfer, momentum transfer, heat transfer, Lagrangian spray, and Lagrangian wall film models activated.
To eliminate the influence of grid size on the numerical results, mesh sensitivity analyses were performed before the study began. As shown in Table 1, four cases with different mesh sizes were performed and compared. Figure 3 shows the time-varying maximum heat flux on the thin plate with different mesh sizes. It can be seen from the figure that the time-varying maximum heat flux tends to be the same for case 3 and case 4. Therefore, we adopted the mesh setup of case 3 for further study.

2.6. Spray Characterization

2.6.1. Spray Pattern

It is well-known that an accurate representation of the spray is critical to a CFD simulation of the reductant supply process in the SCR system. Therefore, the spray process of a commercial three-hole, pressure-driven, non-air-assisted injector was modeled. The three 0.19 mm diameter nozzles of the injector were uniformly distributed on a 1.9 mm diameter circle, which means the spray consists of three plumes. A single spray plume was set like a solid cone with a cone angle of 11°, and the inclination angle of a single spray plume was set to 9°. The main characteristics of spray are shown in Figure 4. The spray parameters, such as the number of spray plumes, inclination angle, cone angle, mass flow rate, and initial velocity, were obtained from the experiment [31] and calibrated with our previous numerical study [32], which is shown in Table 2. It has been shown that water and UWS behave similarly in terms of bulk spray characteristics [33]. Therefore, water was adopted as the liquid phase in the spray model to simplify the model and facilitate comparison with experimental results.

2.6.2. Droplet Size Distribution

For a proper characterization, besides the spray pattern, droplet size distribution is also of great importance as an initial boundary condition. This is because the initial droplet size distribution can influence the spatial distribution of droplet sizes. In other words, large droplets are more likely to maintain their original state of motion due to their large inertia, while small droplets are more likely to be affected by the air flow during momentum transfer.
Due to the spray characteristics of the low-pressure non-air-assisted injector, the droplet size distribution after the primary breakup is usually used as the initial droplet size distribution of the spray (generally at 10–30 mm from the nozzle exit) [24,25]. In this study, the droplet size distribution (volume basis) at a 30 mm distance from the nozzle exit was measured and fitted with the experimental method and the Rosin–Rammler method, and the fitted droplet size distribution was input as an initial boundary condition. The initial droplet size distribution at 0.9 MPa is shown in Figure 5. For the Rosin–Rammler distribution, the cumulative volume fraction of droplets with a diameter no greater than dl is given by:
Y d l = 1 e ( d l / d l ¯ ) n
where d l ¯ is the characteristic diameter, and n corresponds to the spread parameter.

3. Results and Discussion

3.1. Model Validation and Heat Transfer Characteristics Analysis

In order to verify the heat transfer characteristics of spray/wall interaction predicted by the numerical model, a simulation case was completed under the typical diesel exhaust flow conditions of 300 °C and 100 kg/h and compared with the experimental data in Ref. [1]. Figure 6a, b shows the numerical results and the experimental results of the front surface temperature distribution of the plate at different times after the start of injection (SOI), respectively. It can be noticed from both the numerical and experimental results that the spray/wall interaction forms three independent quasi-elliptical cooling regions with a large temperature drop in the thin plate. The three regions are referred to as upstream, midstream, and downstream cooling zones depending on the direction of air flow. In each cooling zone, the simulation and experimental results show a significant temperature drop, and the temperature drop slowly recovers after the injection. There are time differences between the temperature drops in different cooling zones because the distance from each nozzle to the wall surface is not consistent.
To quantitatively study the cooling effect of the spray, the wall temperature distributions at different time periods along the centerline of the air flow direction in each cooling zone are shown in Figure 7. The simulation results are in good agreement with the experimental data in Ref. [1], but the numerical results in the upstream and midstream cooling zones show a deeper temperature drop. The maximum relative error of the lowest temperature is about 10%. The main reason for the error may be the numerical model having some error in the characterization of the spray. As shown in Figure 7, the lowest temperature appears at the center of each cooling zone, and the temperature drop decreases with the increase in the distance from each cooling center. The asymmetry of temperature distribution is attributed to the inclination angle of the spray to the wall and the entrainment effect of air flow. In all three cooling zones, the wall temperature decreases significantly from the spray impingement start, and the temperature gradient drop first increases and then decreases with time.
The significant temperature drop means that the initial wall temperature is below or equal to the critical transition temperature of wall film formation. Birkhold et al. [23] indicated that the critical transition temperature is characterized by an abrupt change in the gradient of the wall temperature-time curve, as illustrated in Figure 8a. Figure 8b provides a full explanation of the trend of the wall temperature gradient. When the wall temperature is marginally higher than the critical heat flux temperature and continues to decrease, the heat flux first increases and then decreases and reaches the maximum at the critical heat flux temperature (220 °C) [22,34]. Therefore, the evaporation mode at the liquid/solid interface transitioned from the transition boiling regime to the nucleate boiling regime during the injection cycle.
Figure 9 shows the variation of the maximum heat flux of the front surface during an injection cycle. The maximum heat flux of the front surface increases rapidly at 3 ms from the start of injection (SOI) and reaches a critical value at 10 ms from SOI. In this phase, the evaporation mode at the liquid–solid interface of spray impingement is the transition boiling regime. Subsequently, the maximum heat flux shows a relatively gentle decreasing trend until the end of the injection process. The evaporation mode in the core and peripheral regions successively transitions to the nucleate boiling regime. As indicated in Figure 10, the maximum heat flux moves radially from the core region to the peripheral region with time. The trend of wall heat flux is the result of the interaction of the local spray mass flux [34] and the evaporation mode at the liquid–solid interface. The maximum heat flux starts to decrease at a faster rate after the end of the injection process. The main reason is that the wall film stops increasing at the end of the injection cycle and evaporates rapidly due to the heat transfer with the air flow. The minor reason is that the evaporation mode at the liquid–solid interface transitioned to the free convection regime, which weakens the heat transfer between the wall film and the wall surface.

3.2. Effect of Wall Film Model on the Estimation of Wall Film Mass

Figure 11 shows the wall film mass evolution with the Stochastic Kuhnke Model incorporated into the existing numerical model, and the numerical results based on the Kuhnke Model are adopted as a comparison. It can be noticed that the wall film model has an important influence on the formation rate and the cumulative mass of the wall film in an injection cycle. The cumulative wall film mass predicted by the Stochastic Kuhnke Model shows an increasing trend throughout the injection cycle. While the cumulative wall film mass predicted by the Kuhnke Model increased abruptly after 3 ms and almost reached maximum value at 10 ms, thereafter, it remained nearly constant until the end of the injection process. The Kuhnke model significantly overestimated the cumulative wall film mass and misestimated the trend of the cumulative wall film mass. It can be inferred from the Kuhnke Model that when the wall temperature is below the critical transition temperature (280 °C), the droplet impingement phenomena are mainly spread (deposition) and splash (partial deposition). In other words, the wall film is supposed to increase continuously after the wall temperature falls below the critical transition temperature. However, the predictions of the Kuknke Model are not consistent with this inference. The Stochastic Kuhnke Model effectively improves this drawback by introducing the transition regime, and the trend of the estimated wall film mass is consistent with the inference.

3.3. Effect of Wall Temperature on Cumulative Wall Film Mass

If the initial conditions remain the same except for the change in air flow temperature, where the initial wall temperature is consistent with the air flow temperature, the cumulative wall film mass increases significantly with the decrease in wall temperature, as illustrated in Figure 12. In addition, the gradient of accumulated wall film mass increases with the decrease in initial wall temperature. This is because when the initial plate temperature is between the critical transition temperature and the critical heat flux temperature and the spray mass flux is kept constant, the lower the initial wall temperature, the greater the induced temperature drop. Since the spray mass flux decreases gradually along the radial direction, there is a larger cooling area of the spray in the non-core region as the wall temperature decreases that causes the increase in cumulative deposition mass. Figure 13 shows the curve of the wall temperature along the centerline of the air flow direction in each cooling zone at different initial air flow temperatures, which corroborates the above conclusion. Consequently, making the exhaust wall temperature exceed the critical transition temperature is an effective method for avoiding the wall film formation.

4. Conclusions

A numerical investigation of the heat transfer characteristics and deposition mechanism of SCR spray/wall interaction under low load diesel exhaust conditions has been performed. The developed numerical model accounts for the relevant physical processes, which include mass transfer, momentum transfer, heat transfer, water evaporation, spray/wall interaction, and wall film formation. The heat transfer characteristics are verified by the experimental data in ref. [1]. The numerical model can give accurate evaluations of the temporal and spatial distribution of wall temperatures and heat fluxes. The main conclusions of this study are as follows:
  • The derived model contributes to quantitatively predicting the spatial distribution of the wall film and the deposits in the SCR system.
  • The spray cooling effect on the wall surface is localized, and the temperature drop decreases significantly from the core region to the peripheral region along the radial direction because the mass flux in the core region of the spray impingement is larger than that in the peripheral region.
  • The cooling effect of spray is instantaneous since the initial wall temperature is less than or equal to the critical transition temperature of wall film formation.
  • The approximate relationship between the critical transition temperature of wall film formation and the critical heat flux temperature is clarified.
  • The Stochastic Kuhnke Model was adopted as a spray/wall interaction model to improve the drawback of a sudden change in the Kuhnke Model in wall film deposition prediction.
  • When the wall temperature is less than the critical transition temperature, the wall film mass is sensitive to the wall temperature and increases as the wall temperature decreases.

Author Contributions

Conceptualization, C.B. and K.L.; methodology, C.B. and T.Z.; formal analysis, C.B. and J.L.; validation, C.B. and J.L.; writing—original draft preparation, C.B.; writing—review and editing, C.B. and K.L.; visualization, C.B.; supervision, K.L.; funding acquisition, K.L. and T.Z. All authors have read and agreed to the published version of the manuscript.

Funding

This research was funded by the National Natural Science Foundation of China, grant number 51876175.

Institutional Review Board Statement

Not applicable.

Informed Consent Statement

Not applicable.

Data Availability Statement

Not applicable.

Conflicts of Interest

The authors declare no conflict of interest.

References

  1. Liao, Y.; Furrer, R.; Dimopoulos Eggenschwiler, P.; Boulouchos, K. Experimental investigation of the heat transfer characteristics of spray/wall interaction in diesel selective catalytic reduction systems. Fuel 2017, 190, 163–173. [Google Scholar] [CrossRef]
  2. Schmidt, A.; Bonarens, M.; Roisman, I.V.; Nishad, K.; Sadiki, A.; Dreizler, A.; Hussong, J.; Wagner, S. Experimental Investigation of AdBlue Film Formation in a Generic SCR Test Bench and Numerical Analysis Using LES. Appl. Sci. 2021, 11, 6907. [Google Scholar] [CrossRef]
  3. He, L.; Hu, J.; Zhang, S.; Wu, Y.; Guo, X.; Guo, X.; Song, J.; Zu, L.; Zheng, X.; Bao, X. Investigating Real-World Emissions of China’s Heavy-Duty Diesel Trucks: Can SCR Effectively Mitigate NOx Emissions for Highway Trucks? Aerosol Air Qual. Res. 2017, 17, 2585–2594. [Google Scholar] [CrossRef]
  4. Martinovic, F.; Castoldi, L.; Deorsola, F.A. Aftertreatment Technologies for Diesel Engines: An Overview of the Combined Systems. Catalysts 2021, 11, 653. [Google Scholar] [CrossRef]
  5. Forzatti, P. Present status and perspectives in de-NOx SCR catalysis. Appl. Catal. A Gen. 2001, 222, 221–236. [Google Scholar] [CrossRef]
  6. Koebel, M.; Elsener, M.; Kleemann, M. Urea-SCR: A promising technique to reduce NOx emissions from automotive diesel engines. Catal. Today 2000, 59, 335–345. [Google Scholar] [CrossRef]
  7. Birkhold, F.; Meingast, U.; Wassermann, P.; Deutschmann, O. Modeling and simulation of the injection of urea-water-solution for automotive SCR DeNOx-systems. Appl. Catal. B Environ. 2007, 70, 119–127. [Google Scholar] [CrossRef]
  8. Spiteri, A.; Dimopoulos Eggenschwiler, P.; Liao, Y.; Wigley, G.; Michalow-Mauke, K.A.; Elsener, M.; Kröcher, O.; Boulouchos, K. Comparative analysis on the performance of pressure and air-assisted urea injection for selective catalytic reduction of NOx. Fuel 2015, 161, 269–277. [Google Scholar] [CrossRef]
  9. McKinley, T.L.; Alleyne, A.G.; Lee, C.-F. Mixture Non-Uniformity in SCR Systems: Modeling and Uniformity Index Requirements for Steady-State and Transient Operation. SAE Int. J. Fuels Lubr. 2010, 3, 486–499. [Google Scholar] [CrossRef]
  10. Koebel, M.; Strutz, E.O. Thermal and Hydrolytic Decomposition of Urea for Automotive Selective Catalytic Reduction Systems:  Thermochemical and Practical Aspects. Ind. Eng. Chem. Res. 2003, 42, 2093–2100. [Google Scholar] [CrossRef]
  11. Scott Sluder, C.; Storey, J.M.E.; Lewis, S.A.; Lewis, L.A. Low Temperature Urea Decomposition and SCR Performance. SAE Trans. 2005, 114, 669–677. [Google Scholar]
  12. Eichelbaum, M.; Farrauto, R.J.; Castaldi, M.J. The impact of urea on the performance of metal exchanged zeolites for the selective catalytic reduction of NOxPart I. Pyrolysis and hydrolysis of urea over zeolite catalysts. Appl. Catal. B Environ. 2010, 97, 90–97. [Google Scholar] [CrossRef]
  13. Sebelius, S.; Le, T.T.; Pettersson, L.J.; Lind, H. Identification of urea decomposition from an SCR perspective; A combination of experimental work and molecular modeling. Chem. Eng. J. 2013, 231, 220–226. [Google Scholar] [CrossRef]
  14. Musa, S.N.A.; Saito, M.; Furuhata, T.; Arai, M. Evaporation characteristics of a single aqueous urea solution droplet. In Proceedings of the ICLASS-2006, Kyoto, Japan, 27 August 2006. [Google Scholar]
  15. Wang, T.J.; Baek, S.W.; Lee, S.Y.; Kang, D.H.; Yeo, G.K. Experimental investigation on evaporation of urea-water-solution droplet for SCR applications. AIChE J. 2009, 55, 3267–3276. [Google Scholar] [CrossRef]
  16. Kuhnke, D. Spray/Wall-Interaction Modelling by Dimensionless Data Analysis. Ph.D. Thesis, Technische Universität Darmstadt, Aachen, Germany, 2004. [Google Scholar]
  17. Grout, S.; Blaisot, J.-B.; Pajot, K.; Osbat, G. Experimental investigation on the injection of an urea–water solution in hot air stream for the SCR application: Evaporation and spray/wall interaction. Fuel 2013, 106, 166–177. [Google Scholar] [CrossRef]
  18. Ravikumar, S.V.; Jha, J.M.; Tiara, A.M.; Pal, S.K.; Chakraborty, S. Experimental investigation of air-atomized spray with aqueous polymer additive for high heat flux applications. Int. J. Heat Mass Transf. 2014, 72, 362–377. [Google Scholar] [CrossRef]
  19. Fu, T.L.; Wang, Z.D.; Deng, X.T.; Liu, G.H.; Wang, G.D. The influence of spray inclination angle on the ultra fast cooling of steel plate in spray cooling condition. Appl. Therm. Eng. 2015, 78, 500–506. [Google Scholar] [CrossRef]
  20. Nayak, S.K.; Mishra, P.C.; Parashar, S.K.S. Influence of spray characteristics on heat flux in dual phase spray impingement cooling of hot surface. Alex. Eng. J. 2016, 55, 1995–2004. [Google Scholar] [CrossRef]
  21. Farshchian, B.; Pierce, J.; Beheshti, M.S.; Park, S.; Kim, N. Droplet Impinging Behavior on Surfaces with Wettability Contrasts. Microelectron. Eng. 2018, 195, 50–56. [Google Scholar] [CrossRef]
  22. Wang, J.; Fu, H.; Hu, Y.; Cai, Y.; Chen, K. Experiment investigation on the effects of air assisted SCR spray impingement on wall temperature evolution. Energy 2020, 204, 117943. [Google Scholar] [CrossRef]
  23. Birkhold, F.; Meingast, U.; Wassermann, P. Analysis of the Injection of Urea-Water-Solution for Automotive SCR DeNOx-Systems: Modeling of Two-Phase Flow and Spray/Wall-Interaction. In Proceedings of the SAE 2006 World Congress & Exhibition, Detroit, MI, USA, 3–6 April 2006. [Google Scholar]
  24. Baleta, J.; Vujanović, M.; Pachler, K.; Duić, N. Numerical modeling of urea water based selective catalytic reduction for mitigation of NOx from transport sector. J. Clean. Prod. 2015, 88, 280–288. [Google Scholar] [CrossRef]
  25. Rogóż, R.; Kapusta, Ł.J.; Bachanek, J.; Vankan, J.; Teodorczyk, A. Improved urea-water solution spray model for simulations of selective catalytic reduction systems. Renew. Sustain. Energy Rev. 2020, 120, 109616. [Google Scholar] [CrossRef]
  26. Abramzon, B.; Sirignano, W.A. Droplet vaporization model for spray combustion calculations. Int. J. Heat Mass Transf. 1989, 32, 1605–1618. [Google Scholar] [CrossRef]
  27. Miller, R.S.; Harstad, K.; Bellan, J. Evaluation of equilibrium and non-equilibrium evaporation models for many-droplet gas-liquid flow simulations. Int. J. Multiph. Flow 1998, 24, 1025–1055. [Google Scholar] [CrossRef]
  28. Sazhin, S.S. Advanced models of fuel droplet heating and evaporation. Prog. Energy Combust. Sci. 2006, 32, 162–214. [Google Scholar] [CrossRef]
  29. Ranz, W.E.; Marshall, W.R. Evaporation from drops, part I. Chem. Eng. Prog. 1952, 48, 141–146. [Google Scholar]
  30. Ranz, W.E.; Marshall, W.R. Evaporation from drops, part II. Chem. Eng. Prog. 1952, 48, 173–180. [Google Scholar]
  31. Bracho, G.; Postrioti, L.; Moreno, A.; Brizi, G. Experimental study of the droplet characteristics of a SCR injector spray through optical techniques. Int. J. Multiph. Flow 2021, 135, 103531. [Google Scholar] [CrossRef]
  32. Bai, C.X.; Liu, K.; Zhao, T.; Liu, J.J. Study on Spray Characteristics and Breakup Mechanism of an SCR Injector. Appl. Sci. 2022, 12, 9387. [Google Scholar] [CrossRef]
  33. Spiteri, A.; Dimopoulos Eggenschwiler, P. Experimental Fluid Dynamic Investigation of Urea–Water Sprays for Diesel Selective Catalytic Reduction–DeNOx Applications. Ind. Eng. Chem. Res. 2014, 53, 3047–3055. [Google Scholar] [CrossRef]
  34. Mascarenhas, N.; Mudawar, I. Analytical and computational methodology for modeling spray quenching of solid alloy cylinders. Int. J. Heat Mass Transf. 2010, 53, 5871–5883. [Google Scholar] [CrossRef]
Figure 1. Spray impingement regimes based on Stochastic Kuhnke Model.
Applsci 13 05353 g001
Figure 2. Sectional view of computational domain with instruction of boundary conditions.
Applsci 13 05353 g002
Figure 3. The time-varying maximum heat flux on the thin plate with different mesh sizes.
Applsci 13 05353 g003
Figure 4. The diagram of spray.
Applsci 13 05353 g004
Figure 5. The initial droplet size distribution at 0.9 MPa.
Applsci 13 05353 g005
Figure 6. Temperature distribution of the wall surface with time: (a) simulation, (b) experiment.
Applsci 13 05353 g006
Figure 7. Temperature curve across the centerline of each cooling zone on the wall surface at different times after SOI: (a) upstream, (b) midstream, (c) downstream.
Applsci 13 05353 g007
Figure 8. (a) Heat flux—Wall temperature curve; (b) Wall temperature—time curve.
Applsci 13 05353 g008
Figure 9. Maximum heat flux—time curve during an injection cycle.
Applsci 13 05353 g009
Figure 10. Maximum heat flux across the centerline of each cooling zone on the wall surface at different times after SOI: (a) upstream, (b) midstream, (c) downstream.
Applsci 13 05353 g010
Figure 11. Cumulative wall film mass curve predicted by different wall film models during an injection cycle.
Applsci 13 05353 g011
Figure 12. Cumulative wall film mass curve at different air flow temperatures during an injection cycle.
Applsci 13 05353 g012
Figure 13. Wall surface temperature curve across the centerline of each cooling zone in different initial wall temperatures: (a) upstream, (b) midstream, (c) downstream.
Applsci 13 05353 g013
Table 1. Different mesh size setups.
CaseMin Cell Length [mm]Max Cell Length [mm]Total Cells
11.53155,731
212308,344
30.51986,487
40.40.81,449,546
Table 2. Spray parameters operated at 0.9 MPa.
ParametersValue
Number of spray plumes3 (evenly distributed)
Hole center diameter1.9 mm
Inclination angle
Cone angle of a jet11°
Mass flow rate1.2 g/s
Initial velocity32 m/s
Disclaimer/Publisher’s Note: The statements, opinions and data contained in all publications are solely those of the individual author(s) and contributor(s) and not of MDPI and/or the editor(s). MDPI and/or the editor(s) disclaim responsibility for any injury to people or property resulting from any ideas, methods, instructions or products referred to in the content.

