
Risk Assessment of Fixed Obstacles along Roads

Department of Forensic Experts in Transportation, Faculty of Transportation Sciences, Czech Technical University in Prague, Konviktská 20, 110 00 Prague, Czech Republic
*
Author to whom correspondence should be addressed.
Appl. Sci. 2023, 13(9), 5366; https://doi.org/10.3390/app13095366
Submission received: 16 March 2023
/
Revised: 12 April 2023
/
Accepted: 20 April 2023
/
Published: 25 April 2023
(This article belongs to the Section Transportation and Future Mobility)
Abstract
:The primary objective of this article is to determine and subsequently verify the severity of a traffic accident caused by a collision with a fixed obstacle located in rural area sections along international roads in the Czech Republic. The aim is to create a unified assessment tool of fixed obstacles along roads. In this way, it is possible to determine in advance the level of risk of fixed obstacles along roads before traffic accidents could occur at these locations. The work is based on the assumption that the severity level of fixed obstacles in road traffic is determined by the product of the probability of hitting the object and the severity of the consequences. On the basis of these parameters, 54 specific combinations of fixed obstacles and surrounding terrain are determined, to which the specific severity of the combination is assigned in relation to the potential impact on the health of the vehicle occupants. Subsequently, a hypothesis is established that confirms or refutes, in a clear and unified manner, the initial, subjective views on the possible consequences of a traffic accident related to a fixed-obstacle impact. The verification of the hypothesis is carried out using a statistical apparatus based on the principles of conditional probability on 280 traffic accidents related to hitting a fixed obstacle. The proposed procedure verified 36 out of 54 (almost 67%) individual combinations of fixed obstacles and surrounding terrain. It was determined that there were 13 combinations with a high risk, where there is a significant probability of serious injury to occupants; 6 combinations with a moderate severity of injury to occupants; 3 cases with a low severity; and 14 cases where it was shown that the impact with a fixed obstacle was most probably not going to result in personal injury but only in material damage to the vehicle. The results of this research, which applies a unified approach to the risk analysis of fixed obstacles, will systematically improve the level of traffic safety. This primarily means preventing accidents with fixed obstacles, saving lives and reducing economic losses.
1. Basic Knowledge Related to the Issue
One of the main priorities of most countries is to promote the development of security, in all human sectors. Transport is undoubtedly one of these sectors. Improving safety in transport has been set out in the White Paper on European Transport Policy [1], in particular in the context of Vision 0 [2]. Within the Czech Republic, the desire to reduce traffic accidents and improve road safety has also been reflected in the national road safety strategy. This strategy sets safety assessment criteria inspired by the above-mentioned international document [3]. Because it is a strategic European document, it clearly specifies requirements for all EU Member States. Therefore, it can be concluded that the presented research, although conducted in the conditions of the Czech Republic, can be generally applied not only to other EU Member States but also in a global context. The issue of the occurrence of fixed obstacles in the road safety zone can be described as a global traffic safety problem. Of course, it is necessary to take into account local specifics at the individual State level.
Proof for the necessity of constant attention to safety evaluation can be found in numerous psychological research studies [4,5] stating that a human causes an error event approximately every 10 thousand tasks (for comparison, e.g., for machines, an error event per 100 million tasks is calculated). The design of transport infrastructure must reflect this fact. Roads must be comprehensible to all users, who must always easily understand how to use the infrastructure. If this is not the case, there is a high probability of conflict situations occurring, resulting possibly in a traffic accident. For this reason, it is important to ensure that the road fulfills two fundamental principles. These are the principles of self-explanatory and forgiving roads. A self-explanatory road is a concept that means that the design elements and the quality of their construction provide the road user with sufficient clear and unambiguous information to behave and make safe decisions when using the road. This layout prevents the occurrence of an accident. Forgiving roads are to some extent able to eliminate (forgive) driver fault or non-standard vehicle behavior as a result of a fault. These are such elements of the arrangement that eliminate or mitigate the fatal consequences of a traffic accident. Research into the development of a deformable culvert face, for example, demonstrates the specific possibility of implementing the forgiving road principle in the area of fixed obstacles [6,7,8].
The risk of a manned vehicle getting off the road can never be 100% eliminated. This may be caused, for example, by an avoiding maneuver, loss of control of the vehicle or a collision with another motor vehicle. If such a situation occurs, the occupants can easily become victims of serious consequences, e.g., due to collision with fixed objects along the road. For this reason, road managers are generally required to maintain a “safety zone” along the road in which the direction of the vehicle can be corrected just in time or stopped safely. Its width is not constant but depends on the maximum permitted speed, the directional alignment and the position of the road in relation to the surrounding terrain (fill slope, cut slope) [9].
To assess the level of road safety, the knowledge set out in the methodologies for the implementation of safety inspections is used [10,11,12,13,14]. The road safety assessment can vary significantly from country to country, depending on the maturity of the country in the field of road safety assessment, economic possibilities and the will or priority to solve this topic. However, all knowledge related to the analysis of fixed-obstacle risk is provided in the road safety inspection methodology. One similar topic related to the risk assessment of fixed obstacles, specifically trees, was involved in research at the at the Gdansk University of Technology, where they demonstrated the correlation between roadways and accidents using an accident database [15,16]. It was found that the density of road casualties decreases when there are crash barriers and hard shoulders on the section, while trees placed within 3.5 m of the road also have a crucial influence. The use of mathematical models in safety assessment is shown, for example, in an article related to the assessment of traffic accidents near crash barriers. The output of this work is the determination of the risk scale of barrier deficits and the proof of the extent to which traffic deficits affect traffic accidents [17].
Within the Czech Republic road safety inspection methodology certified by the Ministry of Transport of the Czech Republic [18], identified transport safety deficits are assigned a severity on a three-level scale (low, medium, and high risk of deficit severity). However, the evaluation of safety deficits related to the safety inspections carried out is highly influenced by the subjectivity of the evaluators. The auditor, as a person creating an expert assessment of road safety, determines the level of risk based on his expert opinion, without the possibility of verifying his judgment with a validated mathematical tool. The evaluator does not have a detailed standardized metric. On the basis of such an assessment of the level of road safety, it is not possible to make a fully objective decision on the riskiness of a given deficit. For this reason, it is not even possible for road managers to focus on eliminating the riskiest deficits and thus to use the economic and human resources at their disposal more efficiently for the benefit of road safety.
The aim of this research is to develop and validate a methodological approach that will enable the standardized evaluation of the level of severity of specific exposures of fixed obstacles in road traffic located in rural area sections along the most important roads in the Czech Republic. The risk will be determined for the crew of a passenger vehicle. In calculating the risk level, only parameters related to the traffic infrastructure will be analyzed with respect to its construction design. The effects of other road safety factors (e.g., human factors, technical condition of the vehicle, weather conditions or traffic density) will not be included in the calculations. At the same time, this work will only consider fixed obstacles whose shape and structure are only subject to elastic deformation after a vehicle impact (the effect of plastic deformation is considered only in the form of surface damage; however, there will be no significant disruption of the structure supporting the object).
2. The Working Process
For a better understanding of the method of work on the presented research, the following chapter is dedicated to a clear description of the individual steps. the first phase is dedicated to determining the risk of fixed obstacles. This is based on a calculation of the severity of the consequences of traffic accidents and the probability of traffic accidents occurring, which is influenced by the height of the fixed obstacle above the ground level, by the impact of the road ditch, by the effect of the spatial guidance of the road and by the distance of the fixed obstacle. Based on this knowledge, the hypothesis is defined. This is followed by the verification of the hypothesis based on the selection of relevant accidents, the identification of the type and age of vehicles, and the calculation of the consequences of accidents. The next step is to assign traffic accidents to concrete fixed obstacles. An appropriate mathematical tool is then applied to this data file. In the following step, using mathematical tools, the evaluation of the hypotheses is conducted. A confirmation or refutation of the defined hypotheses is decided, and the results are presented. The working process shows Figure 1.
3. Research and General Definition of Input Parameters
The risk rating of fixed obstacles is based on a general consideration of the probability of hitting the object and an estimate of how severe the consequences of the accident will be. The calculation of the resulting risk level is based on the following relation [19]:
Several different factors enter into the calculation of the resulting riskiness of a fixed obstacle along the road, which are assumed to influence the severity of the consequences of the traffic accident. For each parameter, it is important to define the specific values that the parameters can take on. These parameters and their corresponding sub-parameters, which are mentioned in this part of the text, were repeatedly consulted with road safety auditors at the beginning of the work. At the same time, the knowledge base has also been supplemented with knowledge from established and widely used road safety manuals [9,10,11,12,13,14]. As a result of this communication, there was overwhelming agreement on the assumption that the elements mentioned below have the most significant influence on the potential worsening of the consequences of a traffic accident due to a vehicle running off the road.
The first factor necessary to assess the risk of a fixed obstacle is the perpendicular distance of the obstacle from the edge of the lane. In the case of the absence of horizontal road markings, the distance is determined from the hard shoulder of the roadway. The criterion in question is monitored at the following three intervals in Figure 2, Figure 3 and Figure 4. The exposure presented in the Figure 2 represents a high risk, Figure 3 indicates a medium risk, and Figure 4 represents a low risk. The parameter “a” represents the traffic lane width, “c” represents the hard shoulder width, and “e” represents the shoulder width.
At the same time, it is necessary to mention that for the indicative determination of the risk of a fixed obstacle in the road safety zone, a simplifying rule is used, which states: “The width of the safety zone is determined as one-tenth of the maximum permitted speed converted into meters”. Specifically, if the maximum permitted speed is 90 km/h, objects more than 9 m away are no longer considered to be dangerous [19].
From Figure 5 it can be seen that at a speed of 90 km/h there is only a less than 15% probability of a vehicle going off the road within 9 m; for this reason, there is no need to consider a longer perpendicular distance from the paved part of the road as the number of such cases would be very improbable.
The second factor is the influence of the height difference between the road and the bottom of the fixed obstacle. This parameter is related to the gradient of the adjacent ground slope, i.e., whether the roadway is at the level of the surrounding terrain or on a fill slope or cut slope. In order to determine the risk, the relative position of the roadway level and the fixed obstacle was divided into three intervals, as shown in Figure 6, Figure 7 and Figure 8.
The upper limit of the height difference was determined on the basis of the main Czech standard related to road design [6]. The standard shows that if the adjacent slope is correctly graded, objects higher than 1.5 m above the road level may not be considered as fixed obstacles. Parameter “a” represents the traffic lane width, “c” represents the hard shoulder width, “e” represents the shoulder width, and parameter “h” represents the height difference between the traffic lane and the lowest part of the fixed obstacle.
The third criterion is the relative position of the fixed obstacle and the road ditch. The effect of the road ditch on the deceleration of the crashing vehicle that has left the roadway is analyzed in determining the risk. From the conclusions of one study [20], which dealt with the riskiness of exits or separate exits from the point of view of vehicle crashes, it can be concluded that not only the depth of the ditch but also the gradient of the external slope of the ditch has a major influence on the deceleration of the vehicle. These model examples are again based on the long-term professional experience of the author’s team. The following cases (Figure 9, Figure 10 and Figure 11) are distinguished for vehicle movement in a road ditch:
The fourth criterion describes the relative position of the object in relation to the arrival of the crashing vehicle. For this situation, two states are distinguished, namely whether the fixed obstacle is on the right or left side of the road. The probability of the vehicle leaving the roadway on the right and left of the direction of travel of the vehicle was found to be almost identical. Specifically, the probability distribution of collision occurrence is 55% in favor of objects located on the right, i.e., closer in position than objects located on the left from the direction of vehicle travel [20]. This is applicable when right-hand traffic flow is considered. In the case of left-hand traffic flow, the probability distribution of a collision would be reversed—55% in favor of objects located on the left, i.e., closer to the position than objects located on the right of the direction of vehicle movement.
4. Defining Hypothesis
There are a number of scientific disciplines that base the knowledge of the studied objects on the analysis of measured data. These are, for example, all statistical methods within frequency or Bayesian statistics. The classical methods are mainly concerned with static data analysis. It is the principle of Bayesian statistics that will be used in this article. This method is based on a dynamic model of a process and follows its evolution in time [21]. The property of variability may be inherent in a given variable, i.e., there are certain undetectable disturbances that affect the values, or this variability may be due to a certain relationship with another variable or several variables. This situation is described by the so-called correlation, which is also analyzed within the defined hypothesis [22].
The basic assumption for the correct functionality of the model is a monitored set of measured data with complete records. For each accident event recorded and used, all data must be complete for the variables represented in the model. At the same time, these data can be supplemented with expert assumptions that describe the behavior of the model.
The following Table 1 shows the hypothesis in the form of an assumed (estimated) level of risk of fixed obstacles determined by the authors of the work and traffic safety experts. The values in the table are based primarily on the author’s deep empirical understanding of the discussed issues, on consultations with experts in the practice, and last but not least on the above-mentioned related literature. In addition to the three basic levels of risk based on the methodology of safety inspections, the table is supplemented with an additional parameter—“NO RISK”—which indicates only material damage, not injury to the accident participant. The individual columns in the table specify the assumed severity hypothesis for individual fixed-obstacle exposures at the location of rural area sections of Class I roads. The first column represents the identification number of the specific combination and the second column defines the height of the fixed obstacle above the ground level. The third column discusses how exposure is affected by the impact of the road ditch. The fourth column describes the effect of the spatial guidance of the road, and the last column defines the distance of the fixed obstacle.
The hypothesis defined is to verify whether the predicted severity of the fixed obstacles for each combination of the observed parameters listed in Table 1 corresponds to the actual level of risk for the crew of passenger vehicles. The hypothesis is verified even if, due to insufficient data, there is at least one match with the predicted consequence risk.
5. Hypothesis Verification
In order to verify the hypothesis and calibrate the mathematical model, data from publicly available statistical data from the Police of the Czech Republic on the accident rate for passenger vehicle crew were used [23]. It can be stated that the Police of the Czech Republic records traffic accidents in which injuries to people, damage to property of a third person, or material damage to property exceeding CZK 100 thousand (almost EUR 4200) were caused. The typology of traffic accidents used by the Police of the Czech Republic distinguishes nine categories of fixed obstacles. Of these categories, those selected were those that were clearly demonstrable and recorded in police reports and also fulfilled the entry condition that only elastic deformations occur on them: trees, columns, walls, rigid parts of bridges, underpasses, tunnels, and other obstacles.
The year of manufacture of the vehicle was also taken into account as an informative factor in the verification of the hypothesis. For a specific fixed-obstacle exposure, the average year of vehicle manufacture (∅V) is always given, based on accident statistics for the given accident types. Information on the age of the vehicles will allow an assessment of whether the amount of recorded occupant health consequences may have been significantly influenced by the level of passive safety of the crashing vehicle. The average age of the vehicle fleet in the Czech Republic was found to be 14.3 years for the period of crash accidents studied [24].
The hypothesis is tested on the basis of the main assumption defined by the following relation: the resulting riskiness of fixed obstacles in the vicinity of the road (R) is given by the product of the severity of the consequences of traffic accidents (Z) and the probability of traffic accidents (P). These two variables can be replaced by parameters (Fixed-Obstacle Parameter—PP, Road Parameter—PK, Integral Accident Rate Parameter—Rz), for which the most significant influence on the possible worsening of the consequences of a traffic accident due to the vehicle running out of the reserved space on the road has been shown in the previous subsections.
In order to be able to compare the severity of individual traffic accidents with each other, the consequences of accidents were expressed using Rheinhold coefficients and the integral accident rate. The exact calculation of the traffic accident severity is made according to the following relation [25]:
Fixed-Obstacle Parameter —PP (distance of the fixed obstacle from the road, relative height position of the road level and the fixed obstacle).
Road Parameter—PK (effect of road ditch on vehicle deceleration, spatial routing of the road).
Integral Accident Rate Parameter—Rz.
The following Table 2 shows the frequency of occurrence of recorded traffic accidents for the defined intervals Rz. The individual intervals correspond to the identified nature of the consequences of the traffic accidents (see Table 3). The introduction of the intervals in place of operating with specific values resulted from the necessity to limit the dimensionality of the solved problem.
6. Definition of Mathematical Assignment
The solved problem operates with the values of the measured quantities understood as random processes dependent on time t [s]. The modelled quantity yt represents the integral accident rate (Rz), which can be described as a discrete random process. Because of the required transformation of the calculated accident severity Rz into the society-wide road traffic risk yt, four accident severity intervals are observed. Table 3 shows the correlation between the variables Rz and yt. Furthermore, the table provides information on which specific values of these two parameters correspond to the individual characteristics of the consequences of traffic accidents [18]. The section may be divided by subheadings. It should provide a concise and precise description of the experimental results, their interpretation, as well as the experimental conclusions that can be drawn.
In order to test the hypothesis, it is assumed that the subject severity is influenced by the independent variables x1;t, x2;t,…xn;t. These parameters can be described as discrete variables taking only a finite number of different values.
Specifically, the four independent variables mentioned earlier were selected:
- .
The verification of the stated hypothesis consists in comparing the assumptions defined in Table 1 with what is recorded in the accident event. The following tables, based on information based on the accident events, will be obtained by analyzing the probability function (pf) of all the variables considered:
where are the observed independent variables and are the intervals of the integral accident rate Rz, respectively, the severity of the fixed obstacle in road traffic.
The properties of this function, which also contains the searched dependencies, are indicated by the created data file. This pooled probability function is first decomposed into the product of the conditional and marginal pooled probability functions:
where the marginal p(y) reveals the total frequencies of individual traffic accidents located within the defined intervals of Rz (see Table 3), but does not provide information about the relationship x and y. In contrast, the conditional pf p(y) is of interest. Individual can be explicitly broken down as follows:
These pf values reveal the circumstances of the traffic accidents, i.e., the combinations of the values of the explanatory variables xi, where i = 1, 2, 3, 4, for each risk level y. By applying the mathematical relationship to the measured data, the results presented in the hypothesis evaluation were found to fall into the following five categories.
7. Hypothesis Evaluation
1. The hypothesis was confirmed (Table 4). A sufficient number of accident incidents were available to test the hypothesis.
Within this dependence, a specific situation was identified for combination 26. The resulting risk calculation was substantially influenced by the value of the parameter ∅V. The table above shows that accident data corresponding to the second most risky interval (y = 3 − MEDIUM RISK) were measured for this exposure. However, from the analysis of the observed age of the vehicles involved in these three accidents, it is clear that the average year of manufacture of the vehicles (∅V = 2008) in this case differed significantly from the average year of manufacture of the vehicle fleet in the Czech Republic [24]. As a result of the described situation, the assumption was applied that vehicles with a newer year of production have a higher level of passive safety and therefore the incurred consequences of traffic accidents are lower than for older vehicles. For this reason, the authors of the paper kept the assumed HIGH RISK for the given exposure.
2. The hypothesis was confirmed, but only a minimal amount of data were found to test the assumption, as only one traffic accident was found, which is consistent with the predicted result of the hypothesis (Table 5).
3. The hypothesis was refuted (Table 6). A sufficient number of accidents were available to test the hypothesis, but a different risk was assumed than was actually confirmed.
4. The hypothesis was not confirmed (Table 7). There were insufficient accident events to test the hypothesis.
5. The hypothesis was not confirmed (Table 8). There were insufficient accident events to test the hypothesis.
Theoretically, it is possible that data falling into this category could be part of a previous evaluation where the hypothesis could have been refuted and no other risk could be determined due to insufficient data. However, this consideration seems highly improbable when evaluating the individual combinations.
The above procedure shows that of the 54 defined combinations corresponding to a specific exposure (see Table 1), at least 1 record was measured for 36 of these cases. If it was not possible to objectively decide on the risk on the basis of the measured data, this is recorded in the table using the value “NOT PROVEN”.
In the rest of combinations, the absence of measured data can be described as justified, as there are very few individual combinations of altitude or alignment lines, which are not protected by crash barriers. For example, combinations 5, 6, 24 and 42. In these cases, the fixed obstacles are located below the level of the road, with the road ditch significantly slowing down the deviating vehicle. These situations are generally not common on the entire road network of the Czech Republic, especially on roads of regional importance. If such a situation does occur, primarily because of the well-known risk of this road construction, restraint systems are usually placed on important roads to eliminate the impact with the obstacle.
Based on the analysis of the frequency of the individual severity levels of the verified risks, the most frequent severity level was “NO RISK”, found in 14 cases in total. The next most frequently represented risks were “HIGH RISK” (13 times) and “MEDIUM RISK” (6 times). “LOW RISK” was confirmed in three cases.
The Table 9 below, shows that the riskiest exposures are generally within three meters of the roadway and, in terms of the relative height of the roadway and the fixed barrier, are below the road level or within 0.5 m above the road level.
8. Discussion
It is true that when solving such a thematically focused task, it is necessary to take into account the uncertainty on the part of the evaluator, and at the same time, the nature of the used accident data can also be considered in the uncertainty of the work. In order to test the defined hypothesis, data from publicly available sources from the Police of the Czech Republic were used [23]. The format of these data does not contain a detailed description of the location or the course or occurrence of the accident and serves mainly for statistical purposes, and it is the need to know the pre-event agency that turns out to be essential for the verification of the defined hypothesis. In the absence of this information, the evaluator is not able to objectively assess, at the data collection stage, the circumstances under which the recorded consequences of the accident occurred. This fact is specifically reflected in the diametrically different severities of individual accident events recorded for the same exposure of the fixed obstacle and the surrounding infrastructure. This fact can be exactly demonstrated by the exposure of fixed obstacles, for which an identical dependence (1) was observed in the previous subsection (see Table 4). For most of these combinations, accidents occur at all severity intervals. The primary reason is precisely found in the difference of the pre-accident agency. Serious accidents could occur, for example, as a result of hitting a fixed obstacle at a speed corresponding to the local maximum permitted speed (90 km/h). In contrast, for accidents resulting in only material damage, the impact speed was significantly lower, with a high probability. For this reason, the situations in question were approached with a principle that has been termed the “Presumption of Higher Severity”. This assumption can be described by the fact that the occurrence of accidents with lower severity does not exclude the possibility of more serious traffic accidents. At the same time, if two other conditions were complied with—the level of severity agreed with the expert knowledge of the author of the thesis and the information from the measured data was identified as credible (the occurrence of two or more traffic accidents was recorded)—it was possible to verify the established hypothesis on the basis of the most serious accident events. The remaining accidents were considered as data noise or were not considered in the final evaluation.
9. Conclusions
The correctness and appropriateness of the chosen methodological procedure for testing the hypothesis were demonstrated by the obtained results. Using the above parameters, 54 individual combinations of fixed obstacles and surrounding infrastructures were defined. These exposures were assigned a risk level based on a priori information and tested by the hypothesis. A total of 280 measured records were worked with, allowing for the verification of 36 specific exposures. For the remaining 18 combinations, it was not possible to obtain data. At the same time, the year of manufacture of the vehicle was recorded for the accident events, which was introduced to eliminate the influence of the level of passive safety of the vehicle on the level of the consequences of accidents. It has been shown that similar problems can be solved efficiently by using appropriately chosen discretized measured data, conditional probability, the formation of a statistical discrete model, and comparison with a priori information.
The aim of this research was the exact determination and subsequent verification of the severity of fixed obstacles located in rural area sections along roads, from the perspective of passenger car crew. By applying this method, it was possible to clearly define the riskiness of fixed obstacles and thus help in the subsequent decision making of road safety auditors. The implementation of these results will also enable the responsible road managers to use the economic and human resources at their disposal more efficiently. The results, which apply a unified approach to the risk analysis of fixed obstacles, will systematically improve the level of traffic safety. This primarily means preventing accidents with fixed obstacles, saving lives and reducing economic losses.
The results clearly demonstrate the validity and relevance of the chosen methodological procedure in testing the hypothesis. The conclusions of the presented research are currently implemented in the framework of road safety inspections in the Czech Republic. However, given the nature of the research, where the issue of fixed obstacles along roads is a global topic, these conclusions are applicable not only across EU Member States but also globally, taking into account local specifics.
Author Contributions
Conceptualization, J.N. and K.K.; methodology, K.K.; software, K.K; validation, J.N.; formal analysis, K.K.; investigation, K.K.; resources, J.N.; data curation, J.N.; writing—original draft preparation, K.K.; writing—review and editing, K.K.; visualization, J.N.; supervision, K.K.; project administration, K.K. All authors have read and agreed to the published version of the manuscript.
Funding
This research received no external funding.
Institutional Review Board Statement
Not applicable.
Informed Consent Statement
Not applicable.
Data Availability Statement
The data was provided by the Police Presidium of the Czech Police.
Conflicts of Interest
The authors declare no conflict of interest.
References
- White Paper on Transport: Roadmap to A Single European Transport Area: Towards A Competitive and Resource Efficient Transport Systems. Office for Official Publications of the European Communities: Luxembourg. 2011. Available online: https://data.europa.eu/doi/10.2832/30955 (accessed on 10 April 2023).
- Vision Zero Network 2018–2021, What is Vision Zero. 2022. Available online: https://visionzeronetwork.org/about/what-is-vision-zero/ (accessed on 10 April 2023).
- Ministry of Transport. BESIP 2021–2030; Ministry of Transport: Prague, Czech Republic, 2020; Available online: https://besip.cz/Besip/media/Besip/data/web/Strategie-BESIP-2021-2030.pdf (accessed on 10 April 2023).
- Štikar, J.; Šmolíková, J.; Hokovec, J. Psychology in Transport 1; Karolinum: Prague, Czech Republic, 2003; ISBN 80–246–0606–2. [Google Scholar]
- PIARC. Human Factors in Road Design; PIARC: Paris, France, 2012; ISBN 2–84060–306–1. [Google Scholar]
- Nouzovský, L.; Vrtal, P.; Kohout, T.; Svatý, Z. Using the Eye Tracking Method to Determine the Risk of Advertising Devices on Drivers’ Cognitive Perception. Appl. Sci. 2022, 12, 6795. Available online: https://www.scopus.com/record/display.uri?eid=2-s2.0-85133827180&origin=resultslist&sort=plf-f (accessed on 10 April 2023). [CrossRef]
- Hála, P.; Sovják, R.; Mičunek, T.; Frydrýn, M.; Nouzovský, L. Fracture behaviour of ceramic blocks with thin-walled cellular structures under dynamic loadings. Thin-Walled Struct. 2018, 122, 597–605. Available online: https://www.scopus.com/inward/record.uri?eid=2-s2.0-85033230016&doi=10.1016%2fj.tws.2017.10.050&partnerID=40&md5=f8b9cbb18c775f298c4245012472877b (accessed on 10 April 2023). [CrossRef]
- Konrád, P.; Mára, M.; Fornůsek, J.; Nouzovský, L.; Zatloukal, J.; Kohout, T.; Vrtal, P.; Sovják, R.; Konvalinka, P. Mobile anti-vehicle barrier made of high-performance fibre-reinforced concrete. Adv. Struct. Eng. 2021, 24, 2364–2374. Available online: https://www.scopus.com/inward/record.uri?eid=2-s2.0-85102317489&doi=10.1177%2f1369433221997728&partnerID=40&md5=a929dab16499f6719403a533cd28c046 (accessed on 10 April 2023). [CrossRef]
- Radimský, M. ČSN 73 6101—Road and Highway Design. Silniční Obzor 2018, 78, 277–281. [Google Scholar]
- Nadler, B.; Nadler, F.; Strnad, B. Road Safety Inspection (RSI)—Manual for Conducting RSI; Reasearch of the Austrian Road Safety Fund: Vienna, Austria, 2014. [Google Scholar]
- Cairney, P.; Imberger, K.; Turner, B.; Austroads Limited. Guide to Road Safety; Austroads: Sydney, Australia, 2013; ISBN 978-1-921991-61-5. [Google Scholar]
- Road Safety Canada Consulting. Road Safety in Canada; Government of Canada: Ottawa, ON, Canada, 2011; ISBN 978-1-100-18621-4. [Google Scholar]
- PIARC. Road Safety Inspection Guideline; PIARC: Paris, France, 2007. [Google Scholar]
- Highways England. CS 450 Inspection of Highway Structures; The National Archives: London, UK, 2020. [Google Scholar]
- Budzynski, M.; Jamroz, K.; Jelinski, L.; Antoniuk, M. Why are Trees Still Such a Major Hazard to Drivers in Poland? Transp. Res. Procedia 2016, 14, 4150–4159. [Google Scholar] [CrossRef]
- Budzynski, M.; Radzikowskii, T.; Zalewski, R. Solid road environment and its hazards. MATEC Web Conf. 2017, 122, 02002. [Google Scholar] [CrossRef]
- Vrtal, P.; Kocián, K.; Nováček, J.; Svatý, Z.; Kohout, T. A Unified Approach for Risk Assessment of Road Crash Barriers Using Bayesian Statistics. Appl. Sci. 2023, 13, 1270. Available online: https://www.scopus.com/record/display.uri?eid=2-s2.0-85148044007&origin=resultslist&sort=plf-f (accessed on 10 April 2023). [CrossRef]
- Striegler, R. Methodology for Conducting Road Safety Inspection; UNECE: Brno, Czech Republic, 2013; ISBN 978-80-86502-49-6. [Google Scholar]
- World Road Association. Road Safety Manual, a Manual for Practitioners and Decision Makers on Implementing Safe System Infrastructure; PIARC: Paris, France, 2015. [Google Scholar]
- Mičunek, T. Possibilities of Reducing the Consequences of Traffic Accidents by Technical Measures and Post-Accident Measures. PhD Thesis, Faculty of Transport, CTU in Prague, Prague, Czech Republic, 2010. [Google Scholar]
- Kárný, M.; Böhm, J.; Guy, T.V.; Jirsa, L.; Nagy, I.; Nedoma, P.; Tesař, L. Optimized Bayesian Dynamic Advising: Theory and Algorithms; Springer: London, UK, 2006. [Google Scholar]
- Nagy, I.; Suzdaleva, E. Algorithms and Programs of Dynamic Mixture Estimation. In Unified Approach to Different Types of Components; Springer: Cham, Switzerland, 2017. [Google Scholar]
- CDV. Traffic Accidents in the Czech Republic. Transport Research Centre. 2020. Available online: https://nehody.cdv.cz (accessed on 10 April 2023).
- Association of the Automotive Industry. Composition of the Vehicle Fleet in the Czech Republic in 2015. Available online: www.autosap.cz/zakladni-prehledy-a-udaje/slozeni-vozoveho-parku-v-cr/ (accessed on 10 April 2023).
- Andres, J. Methodology for Identification and Solution of Places of Frequent Traffic Accidents; Centrum Dopravního Výzkumu: Brno, Czech Republic, 2001. [Google Scholar]
Figure 1.
The working process of the research.
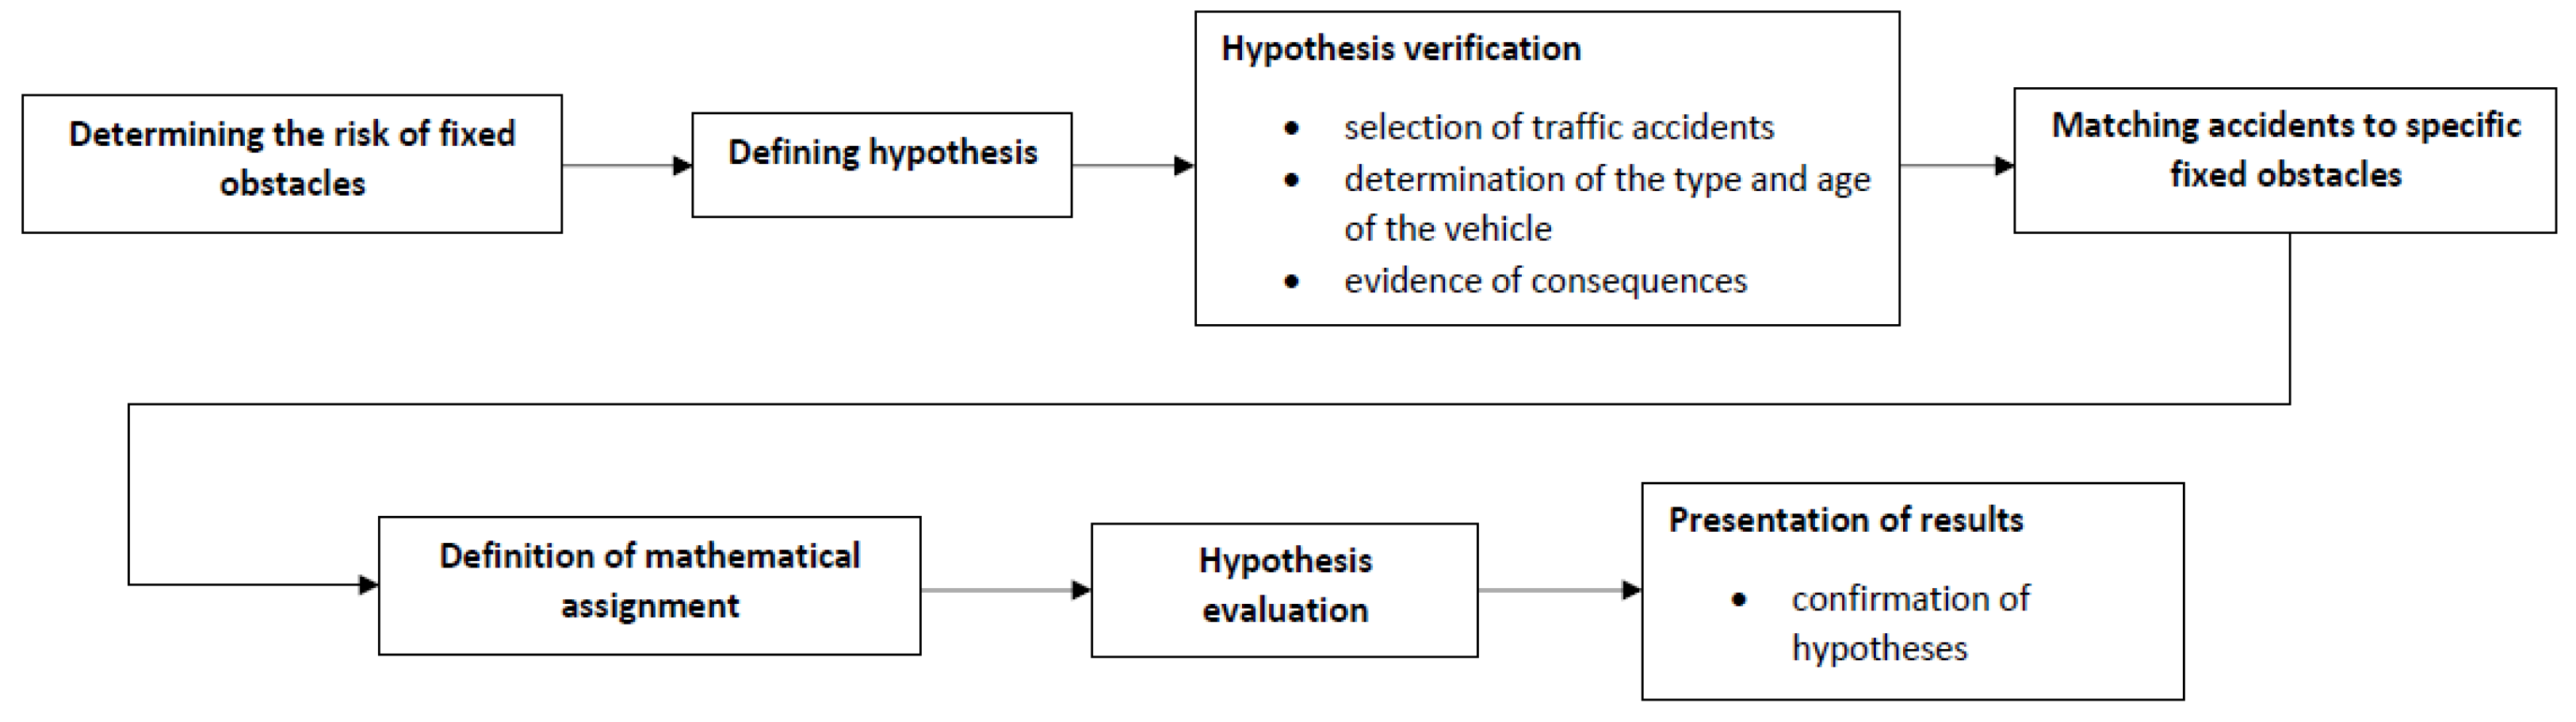
Figure 2.
Fixed obstacle located between 0 and 3 m from the edge of the lane.

Figure 3.
Fixed obstacle located between 3 and 6 m from the edge of the lane.

Figure 4.
Fixed obstacle located between 6 and 9 m from the edge of the lane.

Figure 5.
Graph of the probability and perpendicular distance of the vehicle going off the road at a speed of 90 km/h [19].
Figure 5.
Graph of the probability and perpendicular distance of the vehicle going off the road at a speed of 90 km/h [19].

Figure 6.
Fixed obstacle located below the road level.

Figure 7.
Fixed obstacle located above the road level up to a height of 0.5 m.

Figure 8.
Fixed obstacle located 0.5 m above the road level up to a height of 1.5 m.

Figure 9.
Example of a road ditch that does not slow down a vehicle running off the road.

Figure 10.
Example of a road ditch that partially slows down a vehicle running off the road.

Figure 11.
Example of a road ditch that significantly slows down a vehicle running off the road.


Table 1.
Assumed severity hypothesis for individual fixed-obstacle exposures at the location of rural area sections of Class I roads.
Table 1.
Assumed severity hypothesis for individual fixed-obstacle exposures at the location of rural area sections of Class I roads.
| Combination | Heigh above Ground Level | Impact of the Road Ditch | Spatial Guidance of the Road | Distance of Fixed Obstacle | ||
|---|---|---|---|---|---|---|
| (0–3 m> | (3–6 m> | (6–9m> | ||||
| 1., 19., 37. | (−∞–0.0 m) | doesn't slow down | straight or slight directional curve | High Risk | High Risk | Medium Risk |
| 2., 20., 38. | (−∞–0.0 m) | doesn't slow down | other combinations of spatial guidance | High Risk | High Risk | High Risk |
| 3., 21., 39. | (−∞–0.0 m) | partially slows down | straight or slight directional curve | High Risk | Medium Risk | Low Risk |
| 4., 22., 40. | (−∞–0.0 m) | partially slows down | other combinations of spatial guidance | High Risk | High Risk | Medium Risk |
| 5., 23., 41. | (−∞–0.0 m) | significantly slows down | straight or slight directional curve | Medium Risk | Low Risk | Without Risk |
| 6., 24., 42. | (−∞–0.0 m) | significantly slows down | other combinations of spatial guidance | High Risk | Medium Risk | Low Risk |
| 7., 25., 43. | <0.0–0.5 m> | doesn't slow down | straight or slight directional curve | High Risk | Medium Risk | Low Risk |
| 8., 26., 44. | <0.0–0.5 m> | doesn't slow down | other combinations of spatial guidance | High Risk | High Risk | Medium Risk |
| 9., 27., 45 | <0.0–0.5 m> | partially slows down | straight or slight directional curve | Medium Risk | Low Risk | Without Risk |
| 10., 28., 46. | <0.0–0.5 m> | partially slows down | other combinations of spatial guidance | High Risk | Medium Risk | Low Risk |
| 11., 29., 47. | <0.0–0.5 m> | significantly slows down | straight or slight directional curve | Low Risk | Without Risk | Without Risk |
| 12., 30., 48. | <0.0–0.5 m> | significantly slows down | other combinations of spatial guidance | Medium Risk | Low Risk | Without Risk |
| 13., 31., 49. | (0.5–1.5 m> | doesn't slow down | straight or slight directional curve | Medium Risk | Low Risk | Without Risk |
| 14., 32., 50. | (0.5–1.5 m> | doesn't slow down | other combinations of spatial guidance | High Risk | Medium Risk | Low Risk |
| 15., 33., 51. | (0.5–1.5 m> | partially slows down | straight or slight directional curve | Low Risk | Without Risk | Without Risk |
| 16., 34., 52. | (0.5–1.5 m> | partially slows down | other combinations of spatial guidance | Medium Risk | Low Risk | Without Risk |
| 17., 35., 53. | (0.5–1.5 m> | significantly slows down | straight or slight directional curve | Without Risk | Without Risk | Without Risk |
| 18., 36., 54. | (0.5–1.5 m> | significantly slows down | other combinations of spatial guidance | Low Risk | Without Risk | Without Risk |
Table 2.
Defined intervals Rz and their corresponding frequency and percentage of individual records.
Table 2.
Defined intervals Rz and their corresponding frequency and percentage of individual records.
| Rz | Number of Traffic Accidents | |
|---|---|---|
| [Consequence Index/10 000 Vehicles per Day] | ∑ | % |
| (0–5≥ | 71 | 25.36 |
| (5–10≥ | 64 | 22.86 |
| (10–25≥ | 77 | 27.50 |
| More than 25 | 68 | 24.29 |
Table 3.
Interrelations between the variables Rz and y.
| Rz | Level of Severity in Road Traffic | ||
|---|---|---|---|
| yt | Risk Level | Specification | |
| (0–5≥ | 1 | Without Risk | Only material damage will be caused |
| (5–10≥ | 2 | Low Risk | No more than a slight injury |
| (10–25≥ | 3 | Medium Risk | Always a slight injury, but no serious injuries are recorded |
| More than 25 | 4 | High Risk | Severe or fatal injuries |
Table 4.
Summary of individual combinations of fixed-obstacle exposure and surrounding infrastructure that satisfy dependency 1.
Table 4.
Summary of individual combinations of fixed-obstacle exposure and surrounding infrastructure that satisfy dependency 1.
| Combination | Expected Risk | y = 1 (Without Risk) | y = 2 (Low Risk) | y = 3 (Medium Risk) | y = 4 (High Risk) | Resulting Risk | ||||
|---|---|---|---|---|---|---|---|---|---|---|
| ∑ | ∅V | ∑ | ∅V | ∑ | ∅V | ∑ | ∅V | |||
| 1, | High Risk | 11 | 2003 | 7 | 2003 | 14 | 2003 | 17 | 2004 | High Risk |
| 2, | High Risk | 1 | 2007 | 4 | 2002 | 5 | 2002 | 7 | 2007 | High Risk |
| 4, | High Risk | 11 | 2003 | 7 | 2003 | 14 | 2003 | 17 | 2004 | High Risk |
| 7, | High Risk | 4 | 2003 | 2 | 2011 | 4 | 2004 | 6 | 2001 | High Risk |
| 8, | High Risk | 8 | 2006 | 7 | 2005 | 5 | 2000 | 3 | 2004 | High Risk |
| 19, | High Risk | 11 | 2005 | 8 | 2004 | 19 | 2003 | 19 | 2003 | High Risk |
| 20, | High Risk | 2 | 1999 | 5 | 2006 | 9 | 2002 | 6 | 2006 | High Risk |
| 21, | Medium Risk | 2 | 2008 | 5 | 2006 | 2 | 2004 | 0 | - | Medium Risk |
| 26, | High Risk | 2 | 2003 | 2 | 2006 | 3 | 2008 | 0 | - | High Risk |
| 29, | Without Risk | 2 | 2001 | 1 | 2000 | 0 | - | 0 | - | Without Risk |
| 28, | Medium Risk | 0 | - | 1 | 2011 | 2 | 2000 | 0 | - | Medium Risk |
| 37, | Medium Risk | 8 | 2001 | 7 | 2001 | 2 | 2009 | 0 | - | Medium Risk |
| 38, | High Risk | 1 | 2015 | 0 | - | 0 | - | 2 | 2008 | High Risk |
| 45, | Without Risk | 4 | 2004 | 0 | - | 0 | - | 0 | - | Without Risk |
| 51, | Low Risk | 1 | 2011 | 2 | 1999 | 0 | - | 0 | - | Low Risk |
Table 5.
Summary of individual combinations of fixed-obstacle exposure and surrounding infrastructure that satisfy dependency 2.
Table 5.
Summary of individual combinations of fixed-obstacle exposure and surrounding infrastructure that satisfy dependency 2.
| Combination | Expected Risk | y = 1 (Without Risk) | y = 2 (Low Risk) | y = 3 (Medium Risk) | y = 4 (High Risk) | Resulting Risk | ||||
|---|---|---|---|---|---|---|---|---|---|---|
| ∑ | ∅V | ∑ | ∅V | ∑ | ∅V | ∑ | ∅V | |||
| 3, | High Risk | 0 | - | 1 | 2000 | 3 | 2001 | 1 | 1992 | High Risk |
| 10, | High Risk | 0 | - | 0 | - | 1 | 1996 | 1 | 2000 | High Risk |
| 15, | Low Risk | 1 | 1990 | 1 | 1999 | 0 | - | 0 | - | Low Risk |
| 36, | Without Risk | 1 | 2000 | 0 | - | 0 | - | 0 | - | Without Risk |
| 43, | Low Risk | 2 | 2004 | 1 | 2000 | 0 | - | 0 | - | Undefined |
| 44, | Medium Risk | 0 | - | 0 | - | 1 | 2002 | 0 | - | Medium Risk |
| 47, | Without Risk | 1 | 2002 | 0 | - | 0 | - | 0 | - | Without Risk |
| 49, | Without Risk | 1 | 1993 | 0 | - | 0 | - | 0 | - | Without Risk |
| 51, | Without Risk | 1 | 2005 | 0 | - | 0 | - | 0 | - | Without Risk |
Table 6.
Summary of individual combinations of fixed-obstacle exposure and surrounding infrastructure that satisfy dependency 3.
Table 6.
Summary of individual combinations of fixed-obstacle exposure and surrounding infrastructure that satisfy dependency 3.
| Combination | Expected Risk | y = 1 (Without Risk) | y = 2 (Low Risk) | y = 3 (Medium Risk) | y = 4 (High Risk) | Resulting Risk | ||||
|---|---|---|---|---|---|---|---|---|---|---|
| ∑ | ∅V | ∑ | ∅V | ∑ | ∅V | ∑ | ∅V | |||
| 9, | Medium Risk | 0 | - | 0 | - | 3 | 2002 | 2 | 2005 | High Risk |
| 22, | High Risk | 1 | 2015 | 1 | 2012 | 4 | 2003 | 0 | - | Medium Risk |
| 25, | Medium Risk | 4 | 2001 | 2 | 2006 | 3 | 2004 | 2 | 2011 | High Risk |
| 27, | Low Risk | 0 | - | 6 | 2001 | 6 | 2002 | 0 | - | Medium Risk |
Table 7.
Summary of individual combinations of fixed-obstacle exposure and surrounding infrastructure that satisfy dependency 4.
Table 7.
Summary of individual combinations of fixed-obstacle exposure and surrounding infrastructure that satisfy dependency 4.
| Combination | Expected Risk | y = 1 (Without Risk) | y = 2 (Low Risk) | y = 3 (Medium Risk) | y = 4 (High Risk) | Resulting Risk | ||||
|---|---|---|---|---|---|---|---|---|---|---|
| ∑ | ∅V | ∑ | ∅V | ∑ | ∅V | ∑ | ∅V | |||
| 5, | Medium Risk | 0 | - | 0 | - | 0 | - | 0 | - | Undefined |
| 6, | High Risk | 0 | - | 0 | - | 0 | - | 0 | - | Undefined |
| 11, | Low Risk | 0 | - | 0 | - | 0 | - | 0 | - | Undefined |
| 12, | Medium Risk | 0 | - | 0 | - | 0 | - | 0 | - | Undefined |
| 13, | Medium Risk | 0 | - | 1 | 2008 | 0 | - | 0 | - | Undefined |
| 14, | High Risk | 0 | - | 0 | - | 0 | - | 0 | - | Undefined |
| 16, | Medium Risk | 0 | - | 0 | - | 0 | - | 0 | - | Undefined |
| 18, | Low Risk | 1 | 1999 | 0 | - | 0 | - | 0 | - | Undefined |
| 23, | Low Risk | 1 | 2003 | 0 | - | 0 | - | 0 | - | Undefined |
| 24, | Medium Risk | 0 | - | 0 | - | 0 | - | 0 | - | Undefined |
| 30, | Low Risk | 0 | - | 0 | - | 0 | - | 0 | - | Undefined |
| 31, | Low Risk | 0 | - | 0 | - | 0 | - | 0 | - | Undefined |
| 32, | Medium Risk | 0 | - | 0 | - | 0 | - | 0 | - | Undefined |
| 34, | Low Risk | 0 | - | 0 | - | 0 | - | 0 | - | Undefined |
| 40, | Medium Risk | 0 | - | 0 | - | 0 | - | 0 | - | Undefined |
| 42, | Low Risk | 0 | - | 0 | - | 0 | - | 0 | - | Undefined |
| 46, | Low Risk | 0 | - | 0 | - | 0 | - | 0 | - | Undefined |
| 50, | Low Risk | 0 | - | 0 | - | 0 | - | 0 | - | Undefined |
Table 8.
Summary of individual combinations of fixed-obstacle exposure and surrounding infrastructure that satisfy dependency 5.
Table 8.
Summary of individual combinations of fixed-obstacle exposure and surrounding infrastructure that satisfy dependency 5.
| Combination | Expected Risk | y = 1 (Without Risk) | y = 2 (Low Risk) | y = 3 (Medium Risk) | y = 4 (High Risk) | Resulting Risk | ||||
|---|---|---|---|---|---|---|---|---|---|---|
| ∑ | ∅V | ∑ | ∅V | ∑ | ∅V | ∑ | ∅V | |||
| 17, | Without Risk | 0 | - | 0 | - | 0 | - | 0 | - | Without Risk |
| 33, | Without Risk | 0 | - | 0 | - | 0 | - | 0 | - | Without Risk |
| 35, | Without Risk | 0 | - | 0 | - | 0 | - | 0 | - | Without Risk |
| 41, | Without Risk | 0 | - | 0 | - | 0 | - | 0 | - | Without Risk |
| 48, | Without Risk | 0 | - | 0 | - | 0 | - | 0 | - | Without Risk |
| 52, | Without Risk | 0 | - | 0 | - | 0 | - | 0 | - | Without Risk |
| 53, | Without Risk | 0 | - | 0 | - | 0 | - | 0 | - | Without Risk |
| 54, | Without Risk | 0 | - | 0 | - | 0 | - | 0 | - | Without Risk |
Table 9.
Summary of verified severities of individual fixed-obstacle exposures at the location of rural area sections of Class I roads.
Table 9.
Summary of verified severities of individual fixed-obstacle exposures at the location of rural area sections of Class I roads.
| Combination | Heigh above Ground Level | Impact of the Road Ditch | Spatial Guidance of the Road | Distance of Fixed obstacle | ||
|---|---|---|---|---|---|---|
| (0–3 m> | (3–6 m> | (6–9 m> | ||||
| 1., 19., 37. | (−∞–0.0 m) | doesn't slow down | straight or slight directional curve | High Risk | High Risk | Medium Risk |
| 2., 20., 38. | (−∞–0.0 m) | doesn't slow down | other combinations of spatial guidance | High Risk | High Risk | High Risk |
| 3., 21., 39. | (−∞–0.0 m) | partially slows down | straight or slight directional curve | High Risk | Medium Risk | Low Risk |
| 4., 22., 40. | (−∞–0.0 m) | partially slows down | other combinations of spatial guidance | High Risk | Medium Risk | Undefined |
| 5., 23., 41. | (−∞–0.0 m) | significantly slows down | straight or slight directional curve | Undefined | Undefined | Without Risk |
| 6., 24., 42. | (−∞–0.0 m) | significantly slows down | other combinations of spatial guidance | Undefined | Undefined | Undefined |
| 7., 25., 43. | <0.0–0.5 m> | doesn't slow down | straight or slight directional curve | High Risk | High Risk | Low Risk |
| 8., 26., 44. | <0.0–0.5 m> | doesn't slow down | other combinations of spatial guidance | High Risk | High Risk | Medium Risk |
| 9., 27., 45 | <0.0–0.5 m> | partially slows down | straight or slight directional curve | High Risk | Medium Risk | Without Risk |
| 10., 28., 46. | <0.0–0.5 m> | partially slows down | other combinations of spatial guidance | High Risk | Medium Risk | Undefined |
| 11., 29., 47. | <0.0–0.5 m> | significantly slows down | straight or slight directional curve | Undefined | Without Risk | Without Risk |
| 12., 30., 48. | <0.0–0.5 m> | significantly slows down | other combinations of spatial guidance | Undefined | Undefined | Without Risk |
| 13., 31., 49. | (0.5–1.5 m> | doesn't slow down | straight or slight directional curve | Undefined | Undefined | Without Risk |
| 14., 32., 50. | (0.5–1.5 m> | doesn't slow down | other combinations of spatial guidance | Undefined | Undefined | Undefined |
| 15., 33., 51. | (0.5–1.5 m> | partially slows down | straight or slight directional curve | Low Risk | Without Risk | Without Risk |
| 16., 34., 52. | (0.5–1.5 m> | partially slows down | other combinations of spatial guidance | Undefined | Undefined | Without Risk |
| 17., 35., 53. | (0.5–1.5 m> | significantly slows down | straight or slight directional curve | Without Risk | Without Risk | Without Risk |
| 18., 36., 54. | (0.5–1.5 m> | significantly slows down | other combinations of spatial guidance | Undefined | Without Risk | Without Risk |
Disclaimer/Publisher’s Note: The statements, opinions and data contained in all publications are solely those of the individual author(s) and contributor(s) and not of MDPI and/or the editor(s). MDPI and/or the editor(s) disclaim responsibility for any injury to people or property resulting from any ideas, methods, instructions or products referred to in the content. |
© 2023 by the authors. Licensee MDPI, Basel, Switzerland. This article is an open access article distributed under the terms and conditions of the Creative Commons Attribution (CC BY) license (https://creativecommons.org/licenses/by/4.0/).
Share and Cite
MDPI and ACS Style
Kocián, K.; Nováček, J. Risk Assessment of Fixed Obstacles along Roads. Appl. Sci. 2023, 13, 5366. https://doi.org/10.3390/app13095366
AMA Style
Kocián K, Nováček J. Risk Assessment of Fixed Obstacles along Roads. Applied Sciences. 2023; 13(9):5366. https://doi.org/10.3390/app13095366
Chicago/Turabian StyleKocián, Karel, and Jakub Nováček. 2023. "Risk Assessment of Fixed Obstacles along Roads" Applied Sciences 13, no. 9: 5366. https://doi.org/10.3390/app13095366
Note that from the first issue of 2016, this journal uses article numbers instead of page numbers. See further details here.