Review

Crystal-Based X-ray Interferometry and Its Application to Phase-Contrast X-ray Imaging, Zeff Imaging, and X-ray Thermography

1
SAGA Light Source, 8-7 Yayoigaoka, Tosu 841-0005, Japan
2
Center for Exploratory Research, Research & Development Group, Hitachi, Ltd., 1-280 Higashi-Koigakubo, Kokubunji 185-8401, Japan
3
Photon Factory, Institute of Materials Structure Science, High Energy Accelerator Research Organization, Tsukuba 305-0801, Japan
4
Center for Exploratory Research, Research & Development Group, Hitachi, Ltd., Hatoyama-machi, Hiki-gun 350-0395, Japan
5
School of Allied Health Sciences, Kitasato University, 1-15-1 Kitasato, Sagamihara 252-0373, Japan
6
Congenital Anomaly Research Center, Graduate School of Medicine, Kyoto University, Yoshida-Konoe-cho, Sakyo-ku, Kyoto 606-8501, Japan
7
Human Health Science, Graduate School of Medicine, Kyoto University, 53 Shogoin-Kawahara-cho, Sakyo-ku, Kyoto 606-8507, Japan
8
National Metrology Institute of Japan (NMIJ), National Institute of Advanced Industrial Science and Technology (AIST), Central 5, 1-1-1 Higashi, Tsukuba 305-8565, Japan
*
Author to whom correspondence should be addressed.
Appl. Sci. 2023, 13(9), 5424; https://doi.org/10.3390/app13095424
Submission received: 1 April 2023 / Revised: 23 April 2023 / Accepted: 24 April 2023 / Published: 26 April 2023

Abstract

:
Crystal-based X-ray interferometry (CXI) detects X-ray phase shifts by using the superposition of waves, and its sensitivity is the highest among the other X-ray phase-detecting methods. Therefore, phase-contrast X-ray imaging (PCXI) using CXI has the highest density resolution among the PCXI methods and enables fine, non-destructive observation with a density resolution below sub-mg/cm3. It has thus been applied in a wide range of fields, including biology, medicine, geology, and industry, such as visualization of the testis and brains of aged rats with tumors, human embryos at each Carnegie stage, air hydrates in old Antarctic ice, and ion distribution in electrolytes. Novel imaging methods have also been developed to take advantage of its high sensitivity, such as visualization of the effective atomic number (Zeff) and the three-dimensional temperature of samples. This article reviews the principles and history of PCXI and crystal-based X-ray interferometers, as well as a CXI system using synchrotron radiation and its potential applications from biomedical to industrial.

1. Introduction

Since the discovery of X-rays by Roentgen in 1885, they have been used for non-destructive observation in various fields, from medical diagnostics to airport security inspections, taking advantage of their high penetrating power. In the 1990s, phase-contrast X-ray imaging (PCXI) was developed, which is in principle 1000 times more sensitive than conventional absorption-contrast X-ray imaging, enabling non-destructive observation of biological soft tissues and organic materials without the use of contrast agents [1]. The crystal-based X-ray interferometer (XI) [2] can directly detect phase shifts caused by the sample by using the superposition of X-ray waves. Therefore, a PCXI system using a crystal-based XI, i.e., a crystal-based X-ray interferometry (CXI) system has, the highest density resolution (0.3 mg/cm3). This article introduces the principles of PCXI, crystal-based XI, and CXI systems and presents examples of their application to biomedical, environmental, and industrial sample observations. Furthermore, it briefly describes the principles and applications of coherence-contrast X-ray imaging, Zeff (effective atomic number equivalent to the atomic number used for compounds or mixtures of different materials) imaging, and X-ray thermography, which utilize the advantages of CXI.

2. Principle of Phase-Contrast X-ray Imaging

X-rays are electromagnetic waves with short wavelengths, and when an X-ray passes through a sample, its amplitude (intensity) decreases and its phase simultaneously changes (shifts), as shown in Figure 1a. In the hard X-ray region (X-ray energy > 10 keV), the cross-section of the phase shift for light elements (the real part of the complex refractive index) is more than 1000 times greater than the cross-section of the amplitude (the imaginary part of the complex refractive index) (Figure 1b). Therefore, PCXI, which visualizes phase shifts, is extremely sensitive compared with conventional absorption-contrast X-ray imaging, which visualizes intensity changes [1]. PCXI thus enables fine observation of biomedical soft tissues and organic materials such as polymers without the need to use a contrast agent and with low radiation exposure due to the short measurement time.
Since current X-ray detectors cannot directly detect the phase shift, it is necessary to convert the phase shift into detectable X-ray intensity changes. So far, four major PCXI methods have been developed for a large field of view.
  • Crystal-based X-ray interferometry (CXI), which uses a crystal-based XI to detect phase shifts by using the superposition of waves [1,3].
  • Diffraction-enhanced imaging (DEI), in which the refraction of X-rays generated by the sample (proportional to the spatial derivative of the phase shift) is detected on the basis of the X-ray diffraction (XRD) of an analyzer crystal placed downstream of the sample [4].
  • Grating-based (Talbot) interferometry (GXI), in which the refraction of X-rays produced by the sample is detected with a grating interferometer (i.e., a Talbot interferometer) [5].
  • Propagation-based imaging (PI), which detects phase shifts from the Fresnel fringes (a second-order derivative of the phase shifts) generated at a sufficient distance from the sample [6].
The density resolution, spatial resolution, and temporal resolution of each method are completely different due to differences in the detection principles and X-ray device used (Table 1) [7].
CXI detects the phase shift by using the superposition of waves, so its sensitivity is about ten times higher than that of the other methods, which detect the spatial deviation of the phase shift [8,9]. This method is thus suited for visualizing tiny density differences (<mg/cm3) in biological soft tissues caused by disease or aging, for example. DEI has a wide dynamic range of density and is thus suitable for observing biological samples with large density differences, including bone and calcification. The spatial resolution of PI is the highest because it does not require an X-ray device, which causes image blurring. Therefore, it is suitable for the microscopic observation of small samples. These three methods require monochromatic, high-intensity, and parallel X-rays, and in many cases, observations are performed at synchrotron radiation (SR) facilities. In contrast, GXI does not have the noteworthy sensitivity and spatial resolution of the other methods, but it can use quasi-monochromatic and divergent X-rays, and can achieve sufficient intensity with a classical X-ray tube. For this reason, a small PCXI system with X-ray tubes has been developed for laboratories, hospitals, and factories [10]. Furthermore, fast GXI combined with high-intensity quasi-monochromatic SR has also been developed [11,12], and observations requiring high temporal resolution, such as laser ablation [13], were performed. In addition, an edge illumination imaging method (in which the refraction angle due to the sample is detected by a grating (solar slit) installed downstream of the sample) that can use quasi-monochromatic and divergent X-rays, as well as GXI, has also been developed [14].

3. Crystal-Based X-ray Interferometer

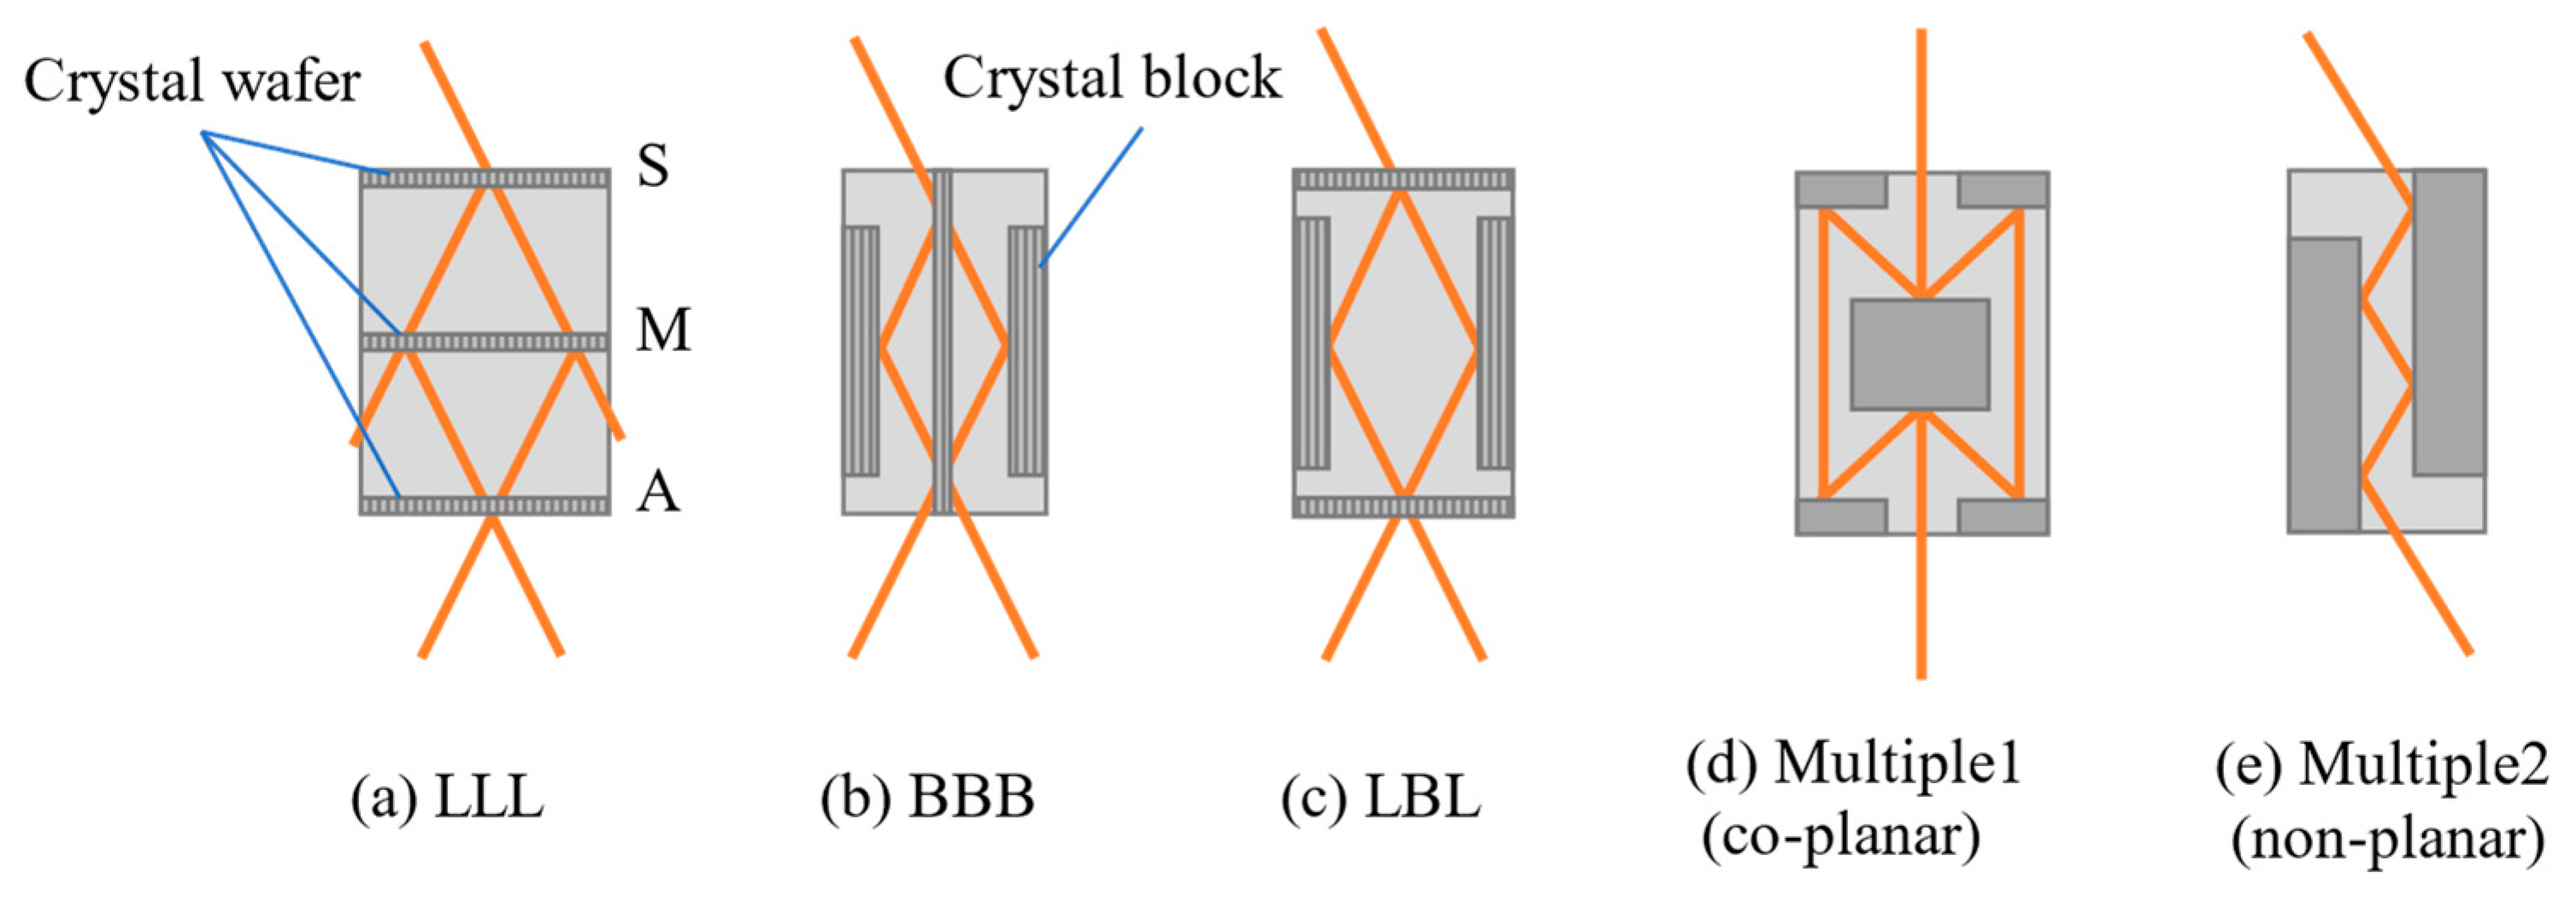
A crystal-based XI is an amplitude-division interferometer that uses the XRD of crystal wafers and/or blocks to divide, reflect, and recombine X-rays. Various crystal-based XIs with different optical configurations, such as the triple Laue (LLL) interferometer (Bonse-Hart type) using triple Laue-case XRD (Figure 2a) [2], the triple Bragg (BBB) interferometers using triple Bragg-case XRD (Figure 2b) [15,16], and crystal-based XIs combining the Laue- and Bragg-cases of XRD (Figure 2c) [17], have been devised, as shown in Figure 2. Furthermore, another type of crystal-based XI has been developed that uses simultaneous coplanar and non-planar X-ray diffractions for high-resolution imaging and suppresses beam blurring [18,19]. It diffracts X-rays simultaneously by satisfying multiple diffraction conditions on different lattice planes.
Among these interferometers, the LLL interferometer and its separated type [20] are currently used for practical PCXI. As shown in Figure 2a, the incident X-rays are divided into two beams (object and reference) split by the Laue-case XRD at the first wafer (S: splitter), and the two beams are reflected at the second wafer (M: mirror) and re-combined at the third wafer (A: analyzer), forming two interference beams. If a sample is placed in the object beam path, the interference beam intensities are changed by the wave superposition, so the phase shift caused by the sample can be detected on the basis of the intensity changes.
The optical configuration is the same as that of the Mach-Zehnder interferometer used in the visible light region. However, the XRD conditions of each wafer have to be satisfied simultaneously for crystal-based XI operation, so a crystal-based XI is generally fabricated from a silicon ingot monolithically. In addition, since the temporal and spatial coherence lengths of X-rays, including SR, are several micrometers, the displacement Δx of the object and reference beam paths on A must be less than several micrometers for high interference. In other words, it is important to fabricate a crystal-based XI so that the differences between A-M and M-S distances are less than a few micrometers by using an ultra-precision crystal-forming technique.
The intensity I of the interference X-rays emitted from the A wafer of the interferometer is given by
I = I 1 + I 2 + 2 γ I 1 I 2 cos ϕ
where I1 and I2 are the intensities of the object and reference beams, γ is the degree of coherence, and ϕ is the phase difference between the object and reference beams. If the sample is placed in the object beam path, Equation (1) can be rewritten as
I = ( I 1 Δ I 1 ) + I 2 + 2 γ ( I 1 Δ I 1 ) I 2 cos ( ϕ + Δ p )
by using intensity change ΔI, phase shift Δp by sample, and decreased γ′.
The absorption and phase shift are unknown and cannot be quantitatively obtained from a single interference pattern. Therefore, a method for quantitatively detecting the phase shift is needed. Two candidate methods are (1) the Fourier transform method [21], in which narrow-spaced interference fringes (carrier fringes) are generated and the phase shift is calculated from the spatial movement of the fringes, and (2) the fringe scanning method [22], in which a phase shifter is placed in the reference beam path and the phase shift is calculated from multiple interference images acquired for different phase shifts. The spatial resolution of the former method is limited by the spacing of the carrier fringes, so the latter method is used in most cases.
The Δp in the fringe scanning method with n-steps can be obtained from
Δ p = t a n 1 ( I r e I i m ) I r e = m = 0 n 1 I m cos 2 π m n I i m = m = 0 n 1 I m sin 2 π m n
by using intensities I m obtained for the m-th phase step.
In addition, γ′ can be obtained using I r e and I i m :
γ = I r e 2 + I i m 2
The decrease in γ is related to the disturbance of the wavefront due to the scattering caused by the sample’s microstructure and to the decrease in coherence due to the misalignment Δx of the object and reference beam paths on A. The scattering has been shown to correspond to small-angle scattering [23]. Hence, the resulting image is called the scattering or small-angle scattering image and is used as a third image in GXI and DEI. Both the scattering and the decrease in coherence cannot be separated in CXI, so γ-contrast imaging, i.e., coherence-contrast imaging, is used as qualitative imaging to compensate for the narrow dynamic range of CXI.
The absorption ( ( I 1 Δ I 1 ) + I 2 ) can be obtained by adding I m because the phase terms (oscillation terms) cancel each other out. Therefore, three types of images (absorption-, phase-, and coherence-contrast) can be obtained simultaneously with the fringe scanning method. The obtained Δ p is 2π wrapped, so the 2π must be recovered using a phase-unwrapping process. As shown above, CXI detects the Δp (not the spatial gradient of Δp) directly, so the sensitivity is about one order of magnitude higher than that of other PCXI methods [8,9].

4. History of CXI Development

The first crystal-based XIs, which were introduced in the 1960s, operated using an X-ray tube [2]. Subsequently, crystal-based XI operations were demonstrated in SR facilities. CXI was introduced as a phase shift detection method for PCXI [1]. Phase-contrast X-ray computed tomography (CT) [3,24], which enables highly sensitive three-dimensional non-destructive observation by combining CT with sample rotation, was devised in the 1990s and applied to the observation of biological soft tissues composed mainly of light elements [24,25]. However, the observation field of view of a CXI system using a monolithic crystal-based XI is limited by the diameter of the silicon ingot, which is the base material of the interferometer. Even with a 6-inch floating-zone (FZ) silicon ingot, it is not easy to enlarge the field of view to more than 30 mm2. Furthermore, since the distance between the sample and the second crystal wafer (M) is less than 10 mm, if the temperature of the sample is greater than that of M, the wafer is heated, causing deformation of the interference pattern, which makes measurement impossible. This problem was overcome by the development of a CXI system using a two-crystal XI composed of two crystal blocks in the late 1990s. Nevertheless, monolithic crystal-based XIs are still being used for PCXI due to their easy operation, and fine three-dimensional observations of small biological samples have been performed using one at the SAGA Light Source (SR facility of saga prefecture in Japan) [26].
The relative displacement (position) and/or rotation between the crystal blocks must be stabilized within the order of X-ray wavelengths, i.e., with an accuracy of 0.1 nm or sub-nano radians, to operate a two-crystal XI. Research has shown that the number of axes requiring such extremely high accuracy depends on the separation configuration of the crystal blocks. The screw symmetric type requires only one axis to be precisely controlled (~10 picoradians, or prad) [20,27]. Therefore, the screw symmetric two-crystal X-ray interferometer (STXI) was adopted for use in the CXI system.
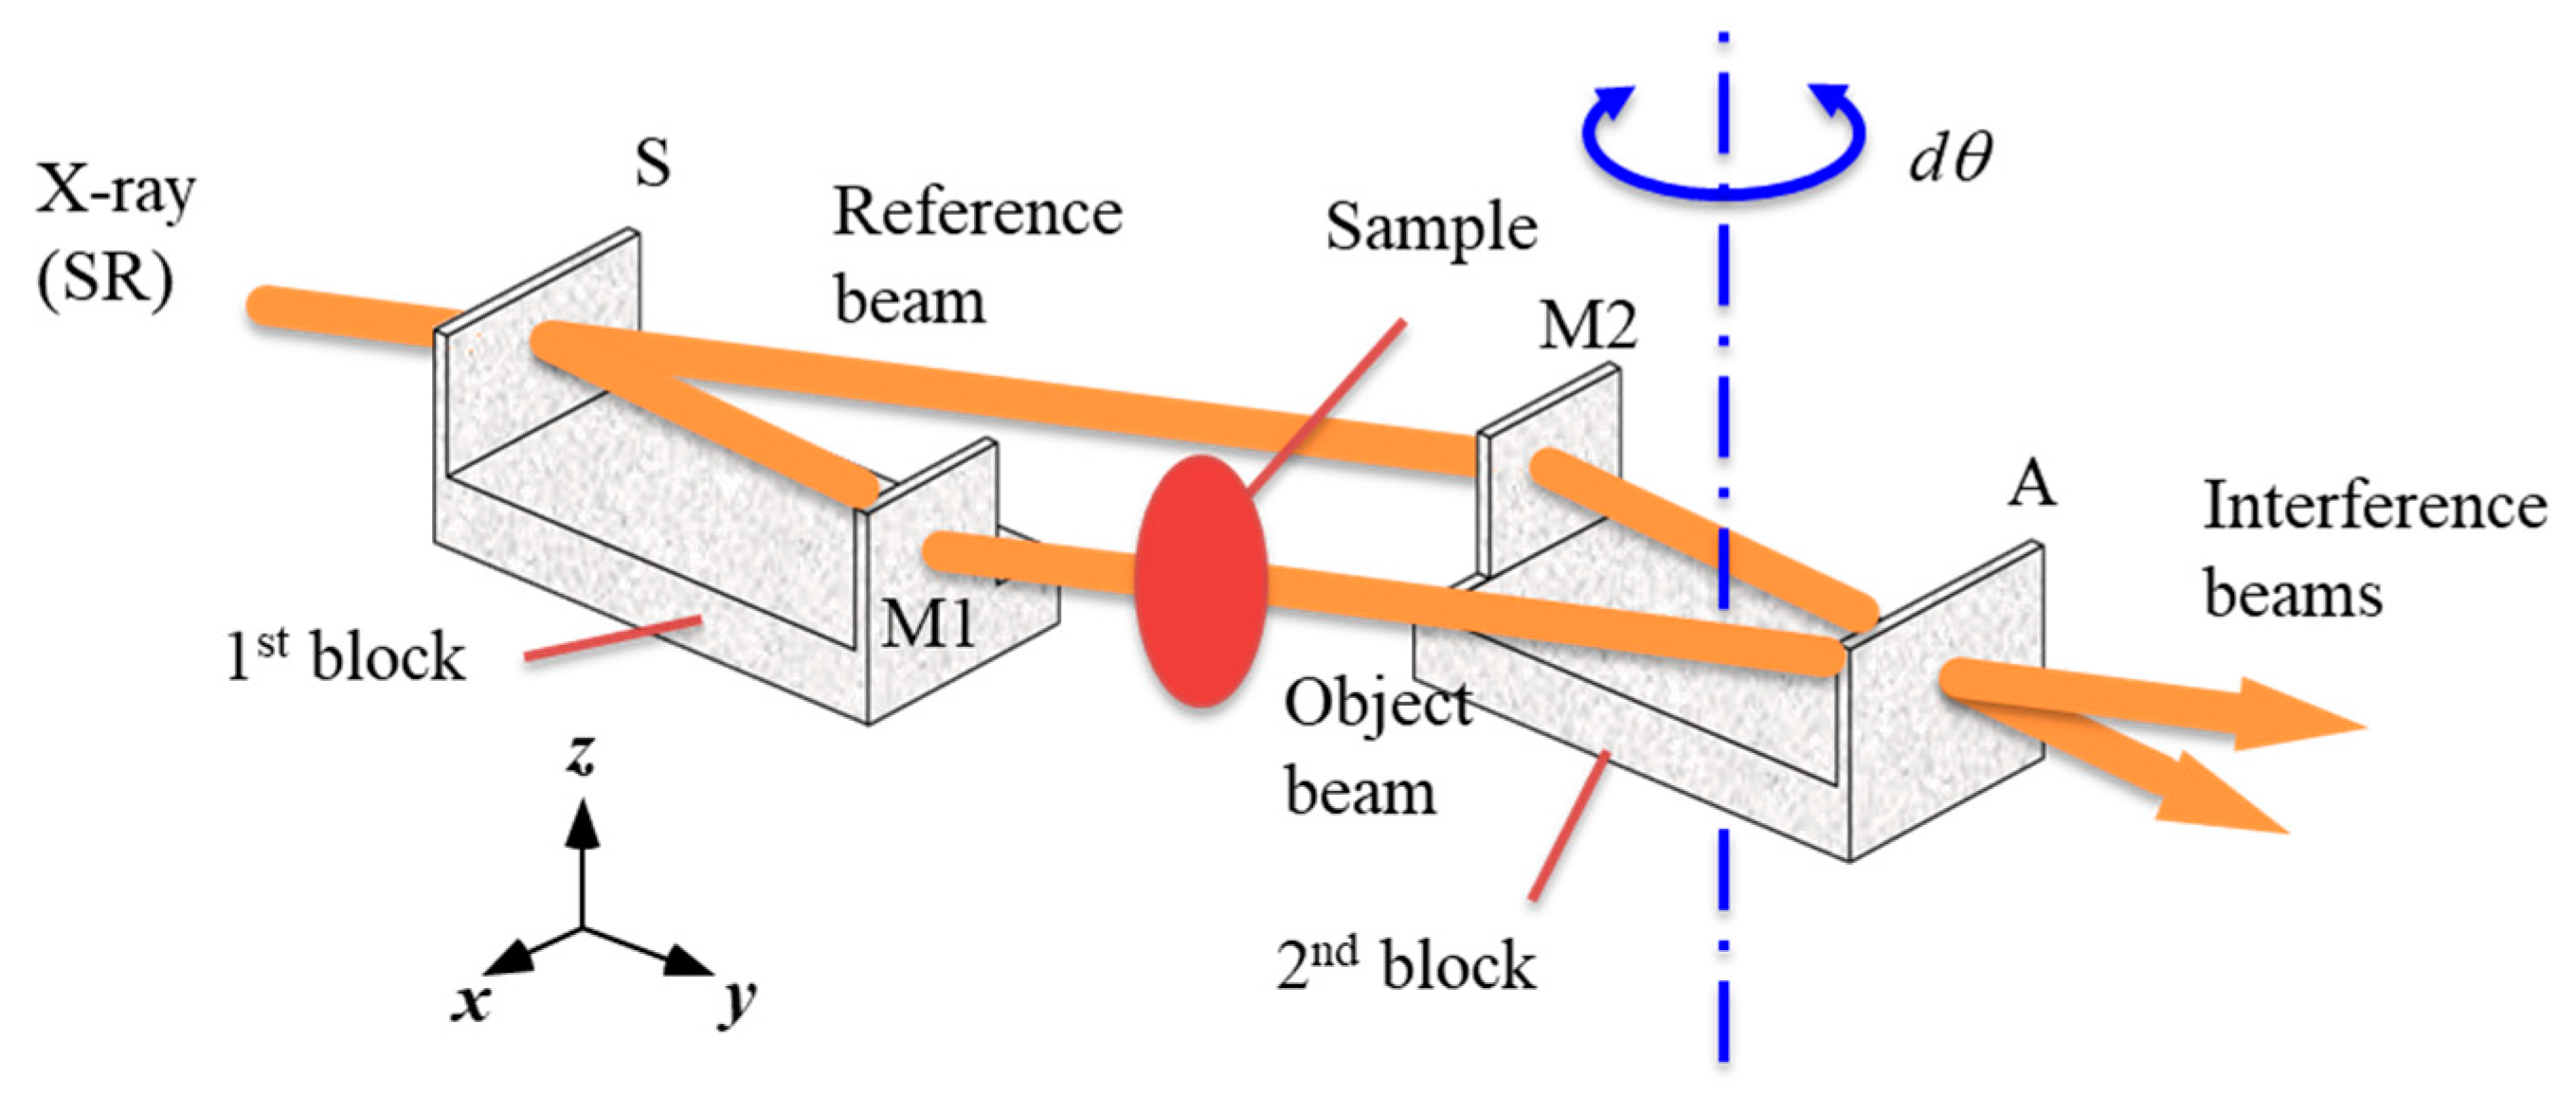
Figure 3 shows a schematic view of an STXI. The incident X-ray is divided into two beams at the first crystal wafer (S) of the first block by the Laue case of XRD. One beam is reflected by the second wafer (M1) of the first block, and the other is reflected by the first wafer (M2) of the second block. The two beams are superimposed on the second wafer (A) of the second block, generating two interference beams. Only one rotational movement between the crystal blocks is required to ensure sub-nano-radian accuracy for STXI operation. The relative rotation between the crystal blocks around the z-axis changes the path difference between the two beams, resulting in a phase difference Δ p :
Δ p = 2 π ( l + t ) d θ / d
where is the relative rotation between the blocks, d is the lattice spacing of the diffraction, l is the distance between the wafers on each block, and t is the thickness of each crystal wafer [20]. For example, for 17.8-keV X-rays and Si(220) diffraction (d = 0.192 nm), must be stabilized to within 20 prad to attain a phase fluctuation of π/20 for an interferometer with l = 200 mm and t = 1 mm.
STXI operation was first achieved using an X-ray tube in the 1970s [20]. Subsequently, STXI operation with a 5 × 5-mm field of view was demonstrated in an SR facility [28]. This led to the earnest development of a CXI system using an STXI (ST-CXI) with a large field of view in the 1990s, supported by a large national budget (Special Coordination Funds of the Ministry of Education, Culture, Sports, Science, and Technology of the Japanese Government). After the construction and testing of three prototypes (Table 2), an ST-CXI imaging system with a field of view of 60 × 40 mm2 and a density resolution of less than 1 mg/cm3 was finally implemented at beamline BL-14C at the Photon Factory of KEK in Japan [29,30]. The performance of the system has been continually enhanced by increasing the X-ray energy (35 keV) [31], improving the phase detection accuracy by installing a highly sensitive and fast X-ray imager in the feedback system, and introducing a highly sensitive X-ray image detector [32]. Note that the spatial resolution depends mainly on the broadening of the X-ray beam in the A-wafer. Since the thickness of the crystal wafer in the above developments was the same at 1 mm, the spatial resolution was the same value (~30 μm). As a next step, we plan to improve the resolution by making the wafer thinner.

5. ST-CXI System and Example Observations

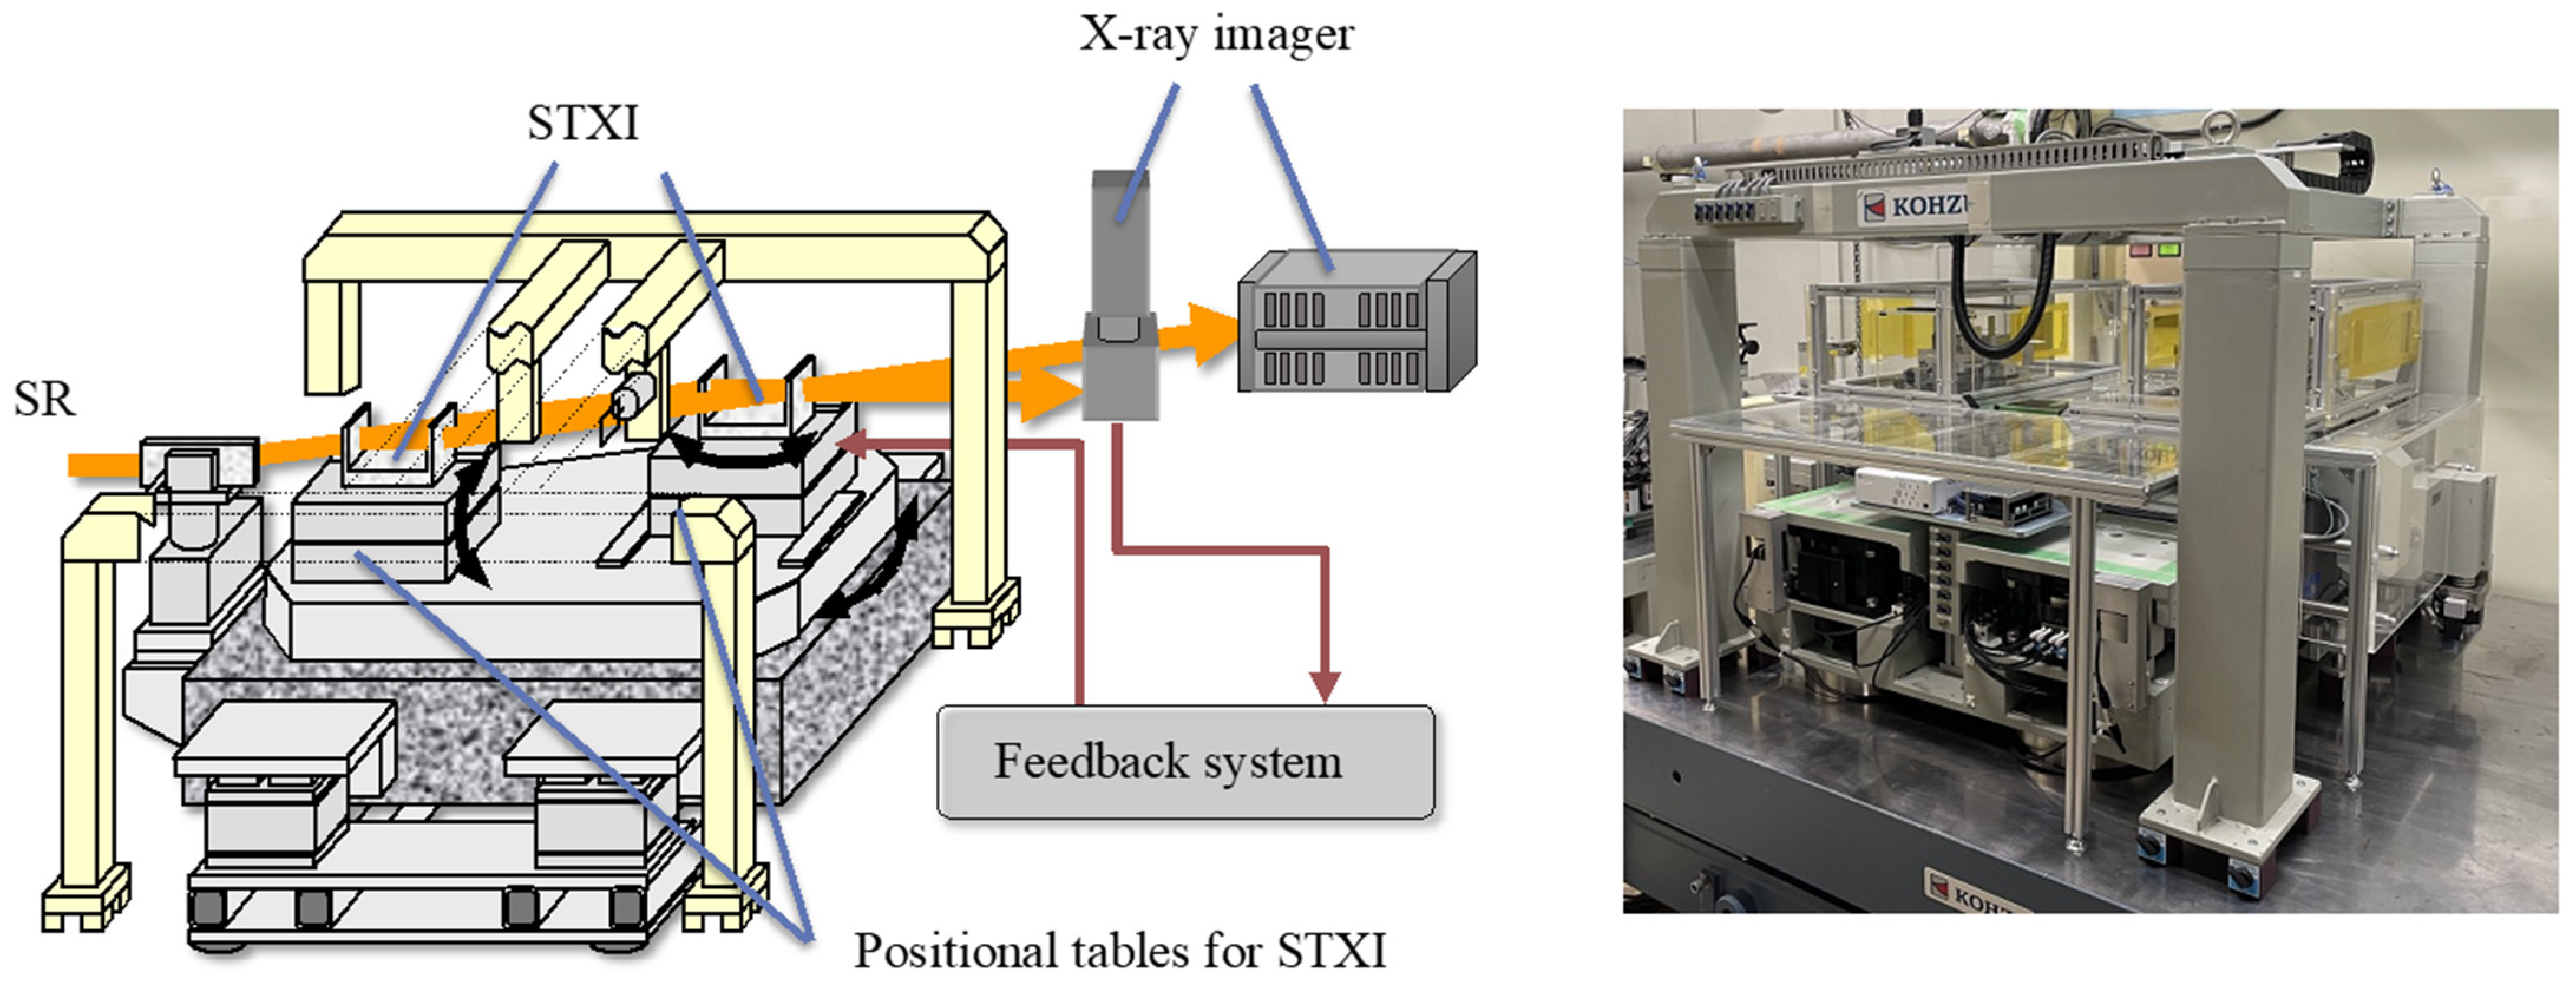
Figure 4 shows a schematic view and photograph of the implemented imaging system [32]. The system mainly consists of an STXI and its positioning tables, a sample holder and its positioning tables, a phase shifter and its positioning tables, an asymmetric crystal and its positioning table, an image feedback system, and an X-ray imager. Beamline BL-14C of the Photon Factory was dedicated to the imaging system. Vertical fan-shaped white SR emitted from the vertical wiggler of the beamline is first monochromatized by a double crystal monochromator using Si (220) diffraction (not shown in Figure 4) and introduced to the imaging system. The beam size of monochromatic SR is 70 mm in the vertical direction but only a few mm in the horizontal direction, so an asymmetric crystal is installed upstream of the STXI to expand the width of the beam by several times using asymmetric XRD. Although this enlargement reduces the SR intensity, uniform SR with a several-10-mm-width is generated for fine observation. One of the interference beams generated by the STXI is used for PCXI, while the other is used by the feedback system.
The positioning table for the STXI consists of three tables to increase mechanical rigidity during operation: (1) Table S1 for adjusting the STXI relative to the incident X-rays to satisfy the Bragg diffraction condition, (2) Table S2 for tuning the θ rotation between the crystal blocks, and (3) a tilt table for tuning the tilt rotation between the crystal blocks. Table S2, which requires 10-prad positioning control accuracy for fine imaging, has a sleeve bearing to attain high mechanical rigidity (mechanical resonance frequency of 300 Hz or higher) and a fine adjustment mechanism driven by a laminated piezoelectric actuator (PZT) with 10-picometer positioning precision. Extremely high rotational stability of 10 prad between crystal blocks can be achieved by avoiding deformation of the table caused by gravity and cutting floor mechanical vibration, so a horizontally rotating table is suitable. With this table configuration, X-rays are diffracted horizontally, so a large field of view can only be attained by using the world’s only vertical fan, SR, at BL-14 of the Photon Factory.
Since CT measurement takes more than one hour even using high-intensity SR, an image feedback system is needed to suppress the drift rotation of Table S2 within 10 prads for a few hours. The rotation of S2 causes fringe motion in the X-ray interference pattern, so the feedback system compares the position of the current interference fringes with that obtained beforehand and adjusts the voltage applied to the PZT to keep the fringe position the same. The latest feedback system can suppress phase drift within π/50 rad (5 prads in terms of the angle of Table S2) for more than 6 h [32]. The time constant of this feedback is 1 s, so this system suppresses the drift due to thermal fluctuations, etc. over a long period of time. Furthermore, the fast mechanical vibrations of less than 1 s are reduced by the high mechanical rigidity of the positioning tables, as mentioned above. In addition, an active vibration-isolation mechanism to cut floor vibration and a double acrylic cover to reduce the effect of surrounding sound are installed.
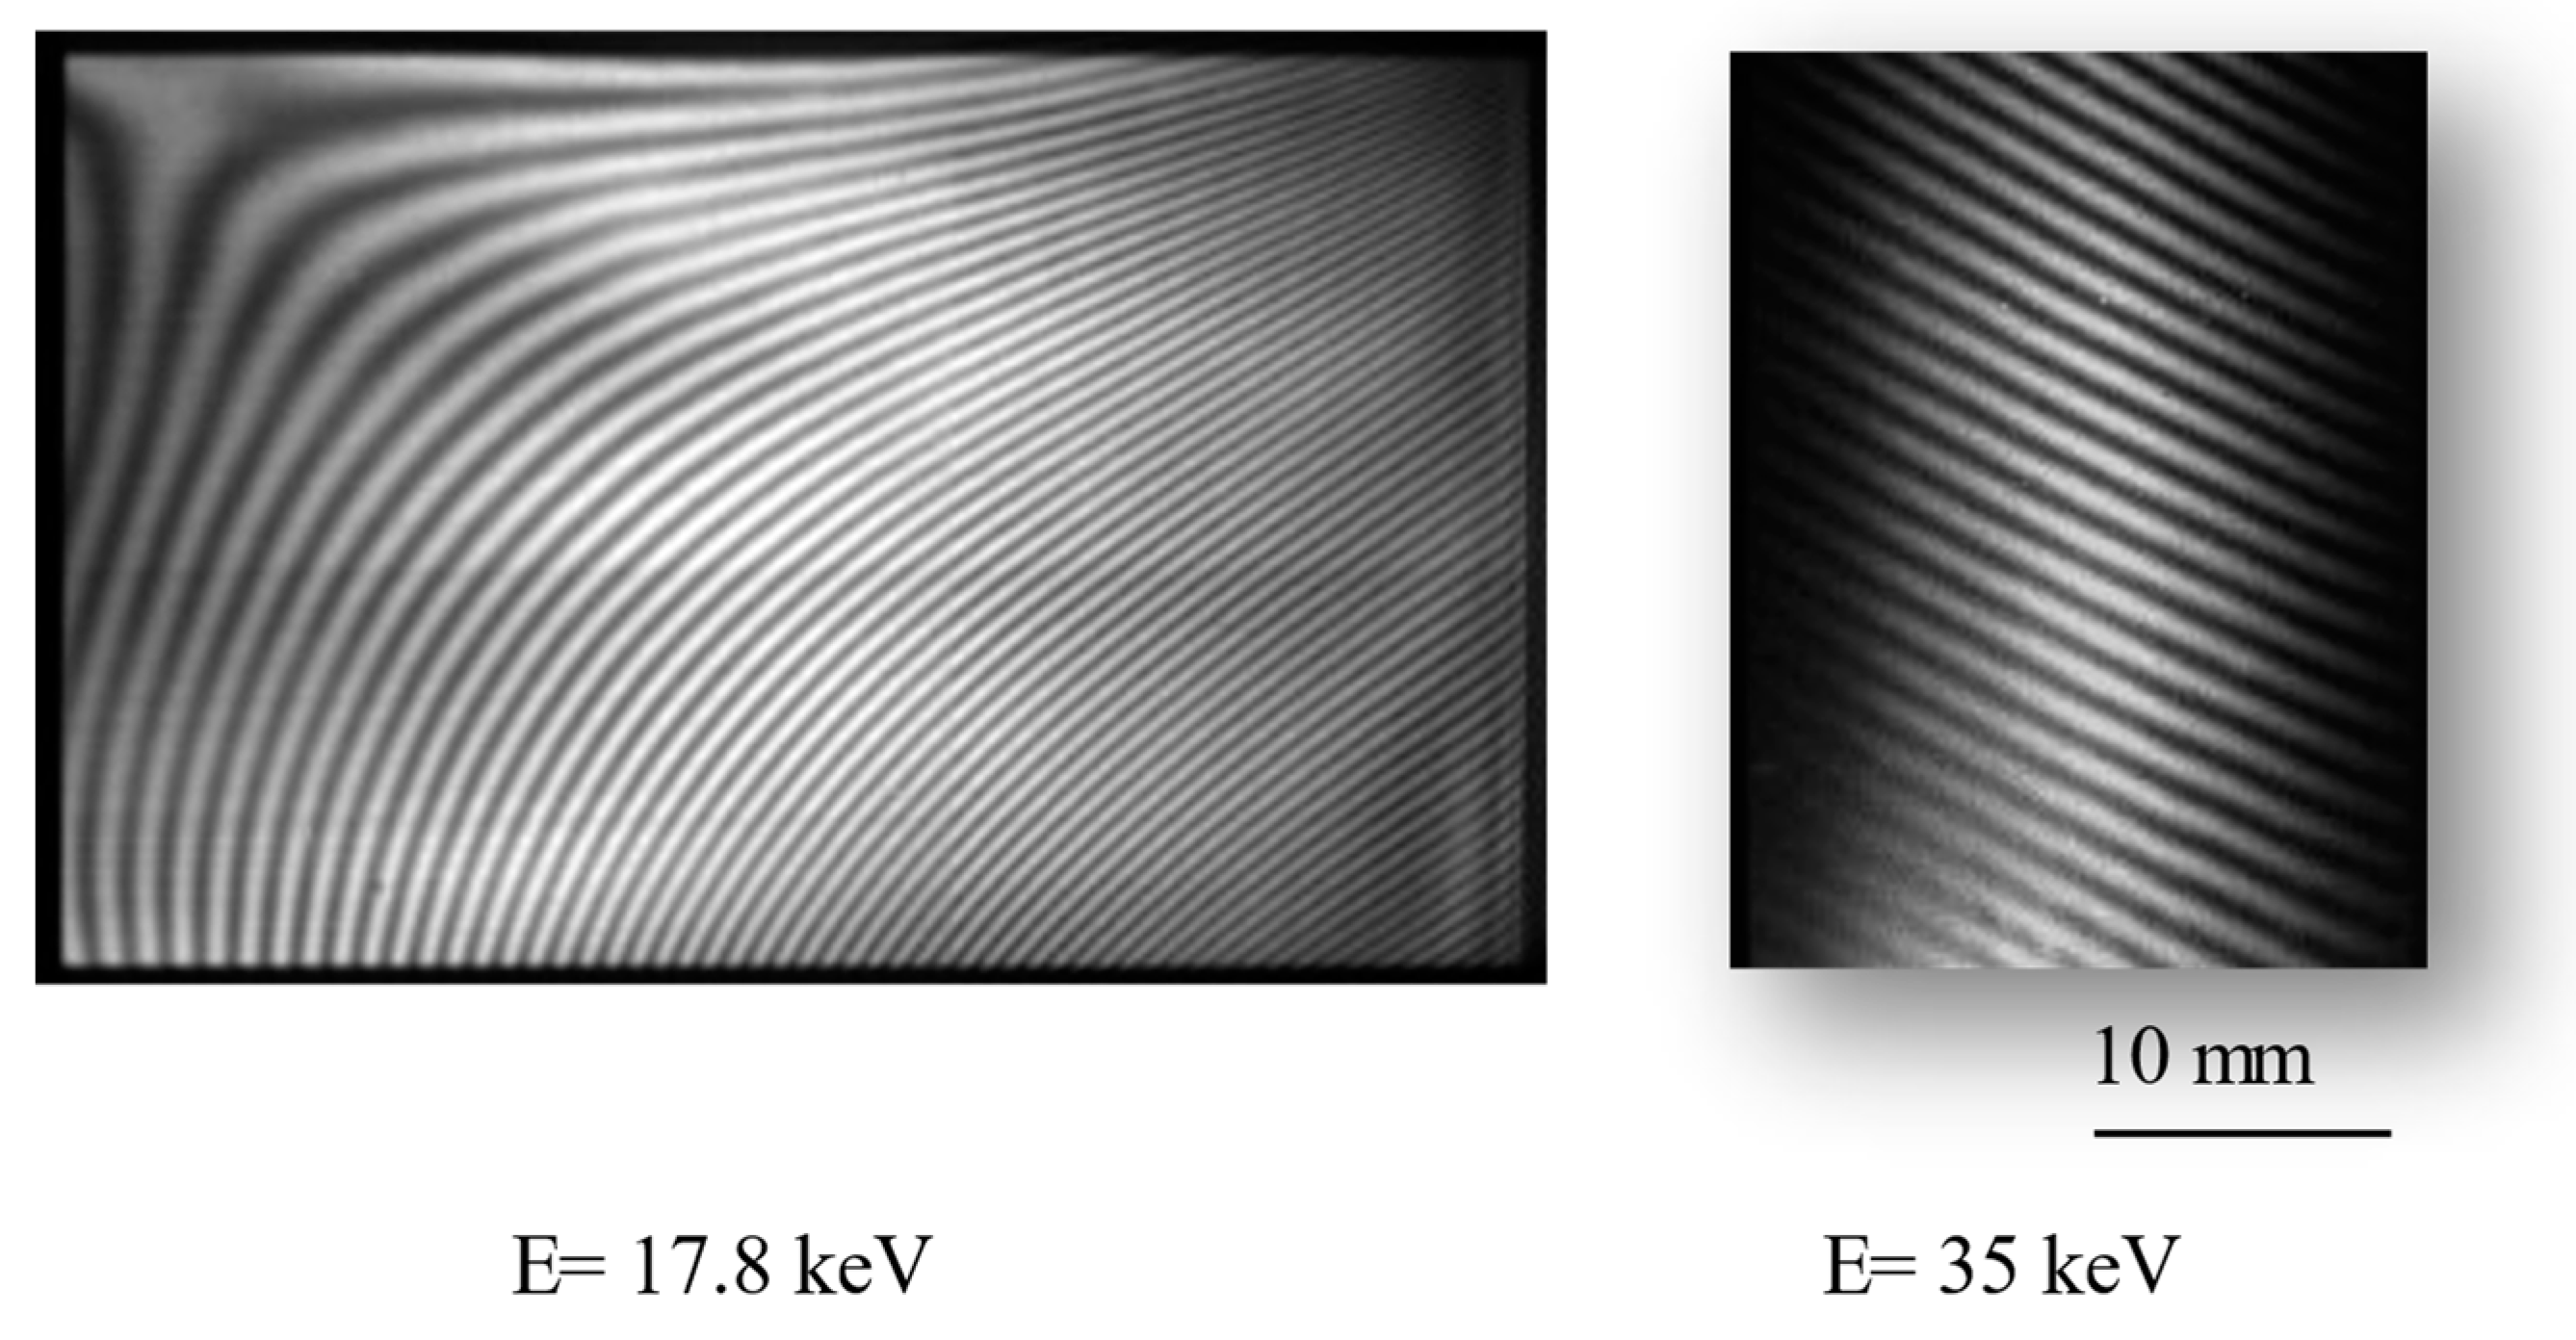
Table 3 shows the main specifications of the latest ST-CXI system. The X-ray energies mainly used are 17.8 keV and 35 keV, and the observation fields of view (interference pattern sizes) at each energy are 50 × 35 and 24 × 35 mm2, respectively, as shown in Figure 5. A fiber-coupled X-ray imager (Andor Zyla 5.5 HF), which converts the incident X-rays into visible light by using a phosphor (CsI) and transfers it to the sCMOS visible light camera through an optical fiber, is mainly used. The pixel size is 6.5 μm, and the number of pixels is 2560 × 2160. The field of view is 16 × 13 mm, so the X-ray imager currently limits the available field of view. The maximum frame rate is 50 fps, and the typical exposure time for obtaining an X-ray interference pattern is about 4 s. The fringe scanning method with the three steps described above is used for quantitative detection of the phase shift. A wedge-shaped acrylic plate is placed in the reference beam path and moved up and down to shift the phase. Movement of the phase plate, rotation of the sample, and acquisition of the interference images are controlled by a control program (CTRL7) compatible with the SAga light source data KArte System (SAKAS) charting system, which is under development at SAGA Light Source and published on GitHub (https://github.com/SAGALS-IMG/, accessed on 1 April 2023).
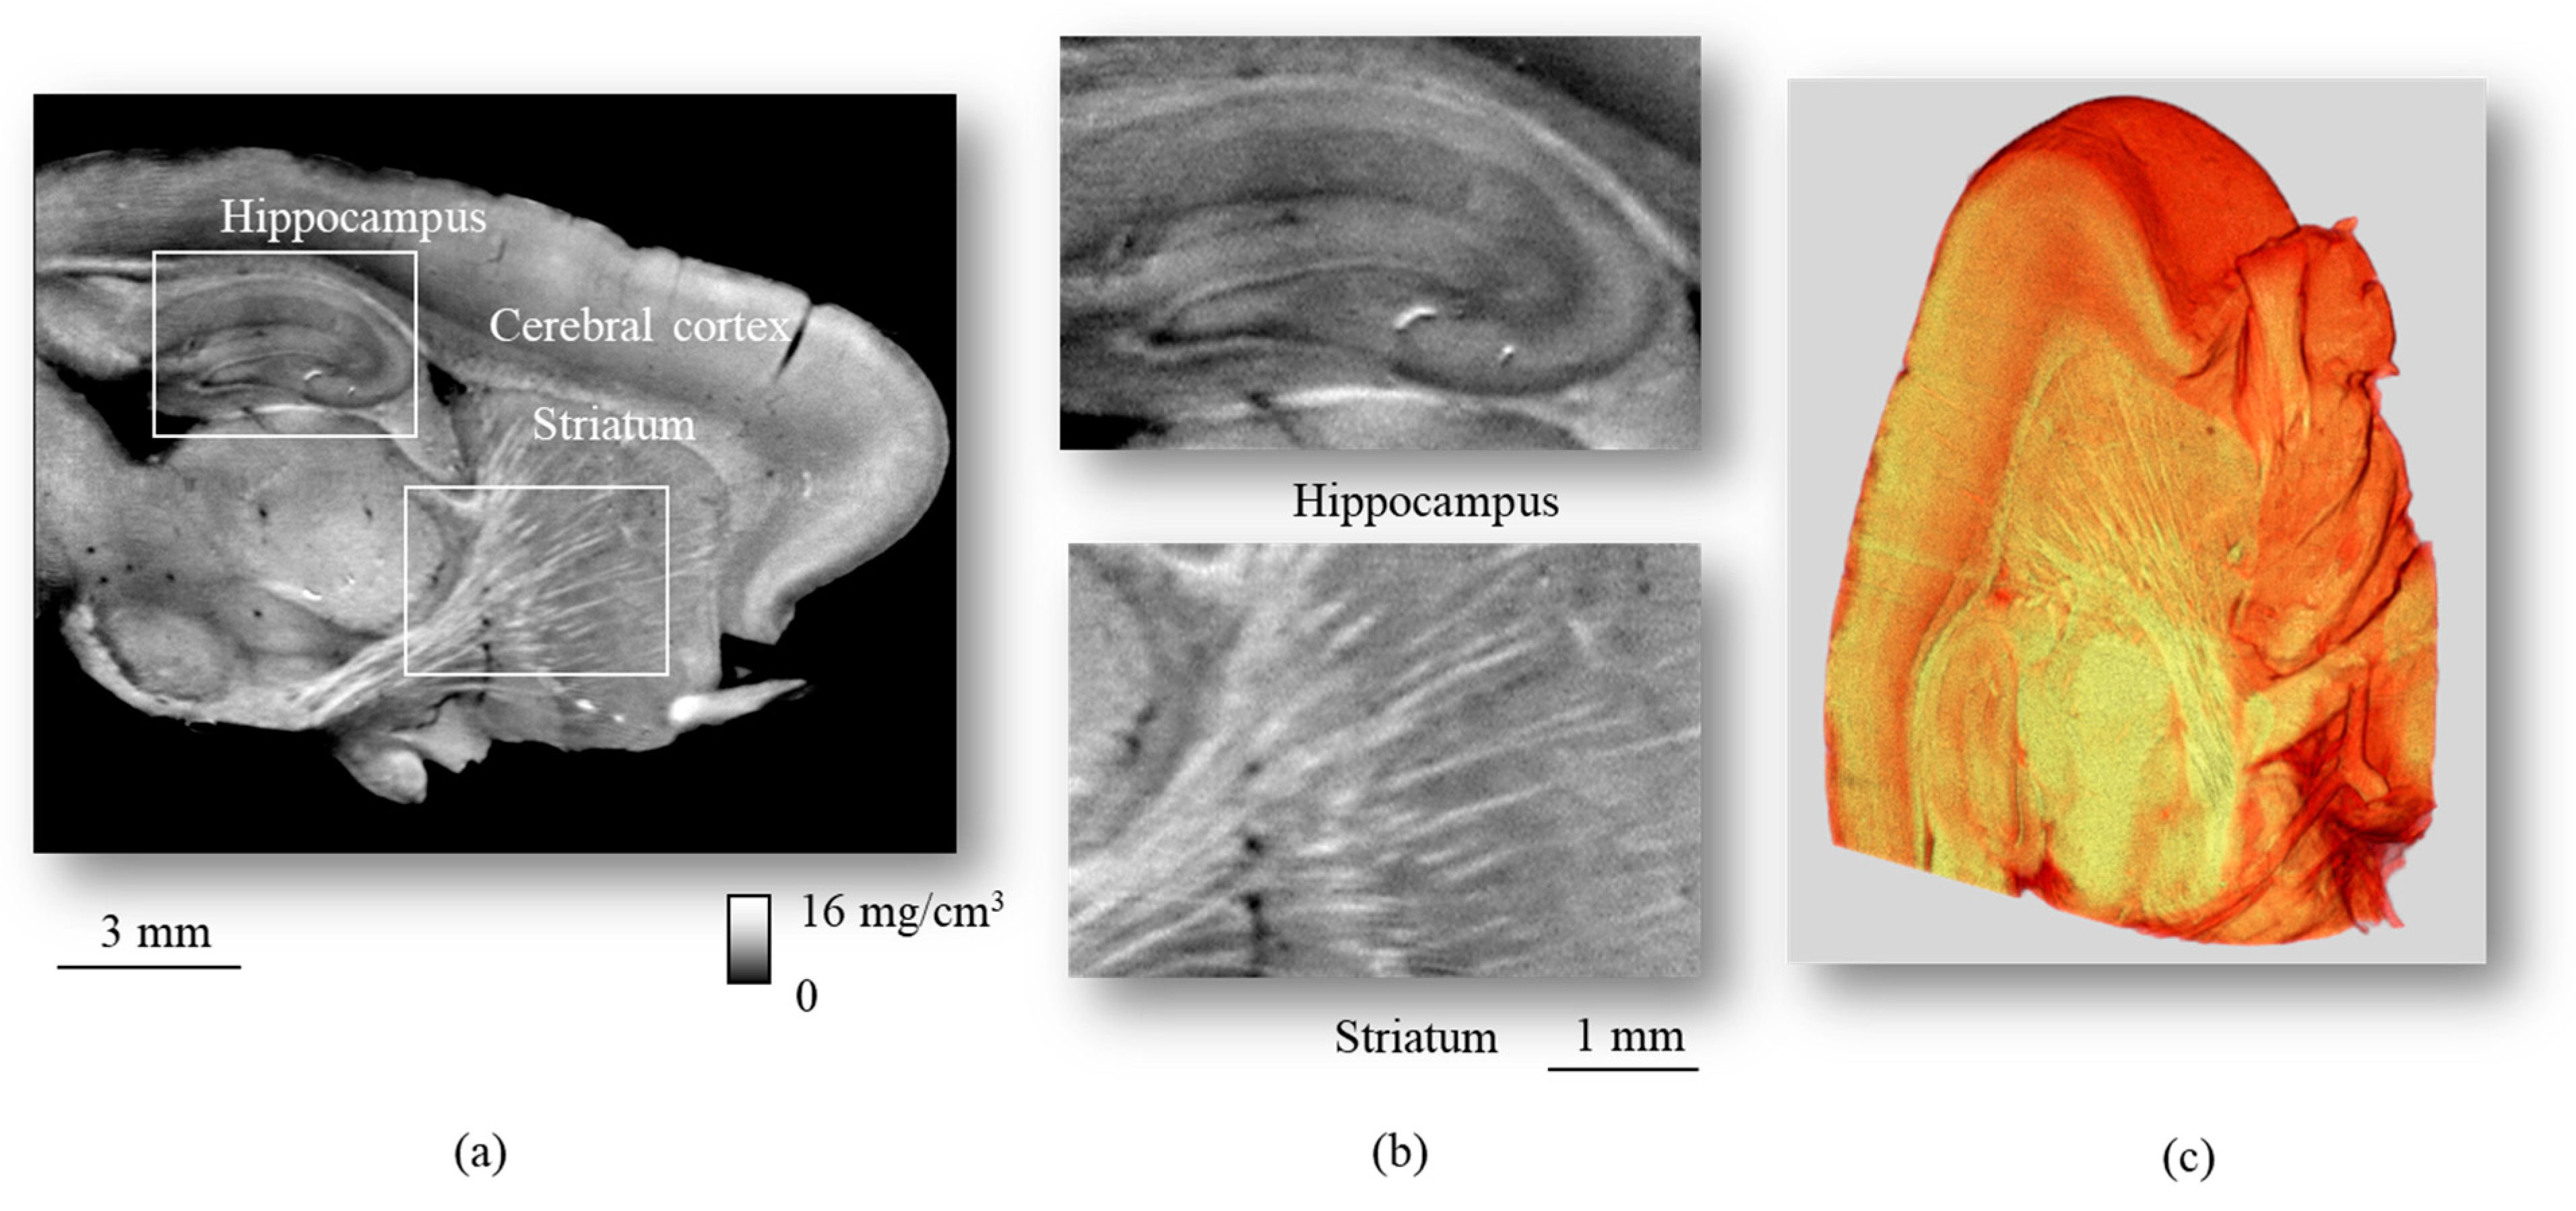
Figure 6 shows example images from a three-dimensional observation of a formalin-fixed mouse brain [32]. The X-ray energy was set to 17.8 keV, and the exposure time for each interference pattern was 4 s. Phase maps for each projection angle were obtained using the three-step fringe scanning method. The number of CT projections was 500 for a 360° rotation, and the total measurement time was about 3 h. Since the dynamic range of CXI is as narrow as ±0.1 g/cm3, the sample was placed and rotated in a 4%-formalin solution to keep the density difference between the sample and the surrounding area within the dynamic range.
The sectional (a,b) and three-dimensional volume rendering (c) images clearly show the cerebral cortex, hippocampus, and striatum and were obtained without the use of a supplemental agent. They also clearly show that the cerebral cortex and hippocampus density differ. Since the phase shift is approximately proportional to the mass density, the density resolution was estimated to be about 0.3 mg/cm3 from the standard deviation of the phase fluctuations (Δp~4 × 10⁻⁴ rad) in the outer area of the sample. The spatial resolution was estimated to be 20–30 μm from the line profile of the boundary between the blood vessels and soft tissue.

6. Application to Biomedical Research

Several imaging modalities, such as X-ray CT, magnetic resonance imaging (MRI), ultrasonography, optical imaging, and positron emission tomography, are widely used in biomedical studies. Imaging modalities with high spatial resolution on a micrometer scale are needed for biological research using small animals, a critical need in the field of pathology in particular. Conventional absorption-based micro-X-ray CT yields high contrast for strongly mineralized tissues such as bones and teeth [35], but it usually provides insufficient contrast for soft tissues composed of light elements. High-spatial-resolution phase-contrast X-ray CT imaging has the potential to overcome this problem [24,36,37,38]. Among the many PCXI methods developed for biomedical imaging, CXI has the greatest sensitivity for the observation of biological soft tissues. Phase-contrast X-ray CT using CXI enables visualization of the fine morphological structures of biological soft tissues such as cancerous lesions in humans [36], rabbits [24], mice [39], and rats [40,41,42] and noncancerous organs (e.g., hepatic vessels) of rats [43]. It also enables visualization of the micro-structures of the vessels and glomeruli in the kidneys [44], heart, and spleen [45]. In addition, CXI enables assessment of the pathological hallmarks of Alzheimer’s disease, namely, amyloid plaques, which are not visible with conventional absorption-based X-ray imaging because of their very small size and low density differences [46].
While MRI is widely used for accurate diagnosis and characterization of soft tissue tumors, CXI is more suitable for visualizing soft tissue tumors. A previous study of CXI compared with MRI using ex-vivo imaging of a formalin-fixed colon cancer implanted tumor demonstrated that CXI affords higher image quality than 4.74-T MRI (Table 4) [39]. Thus, for imaging at high spatial resolution, CXI is the most suitable method.
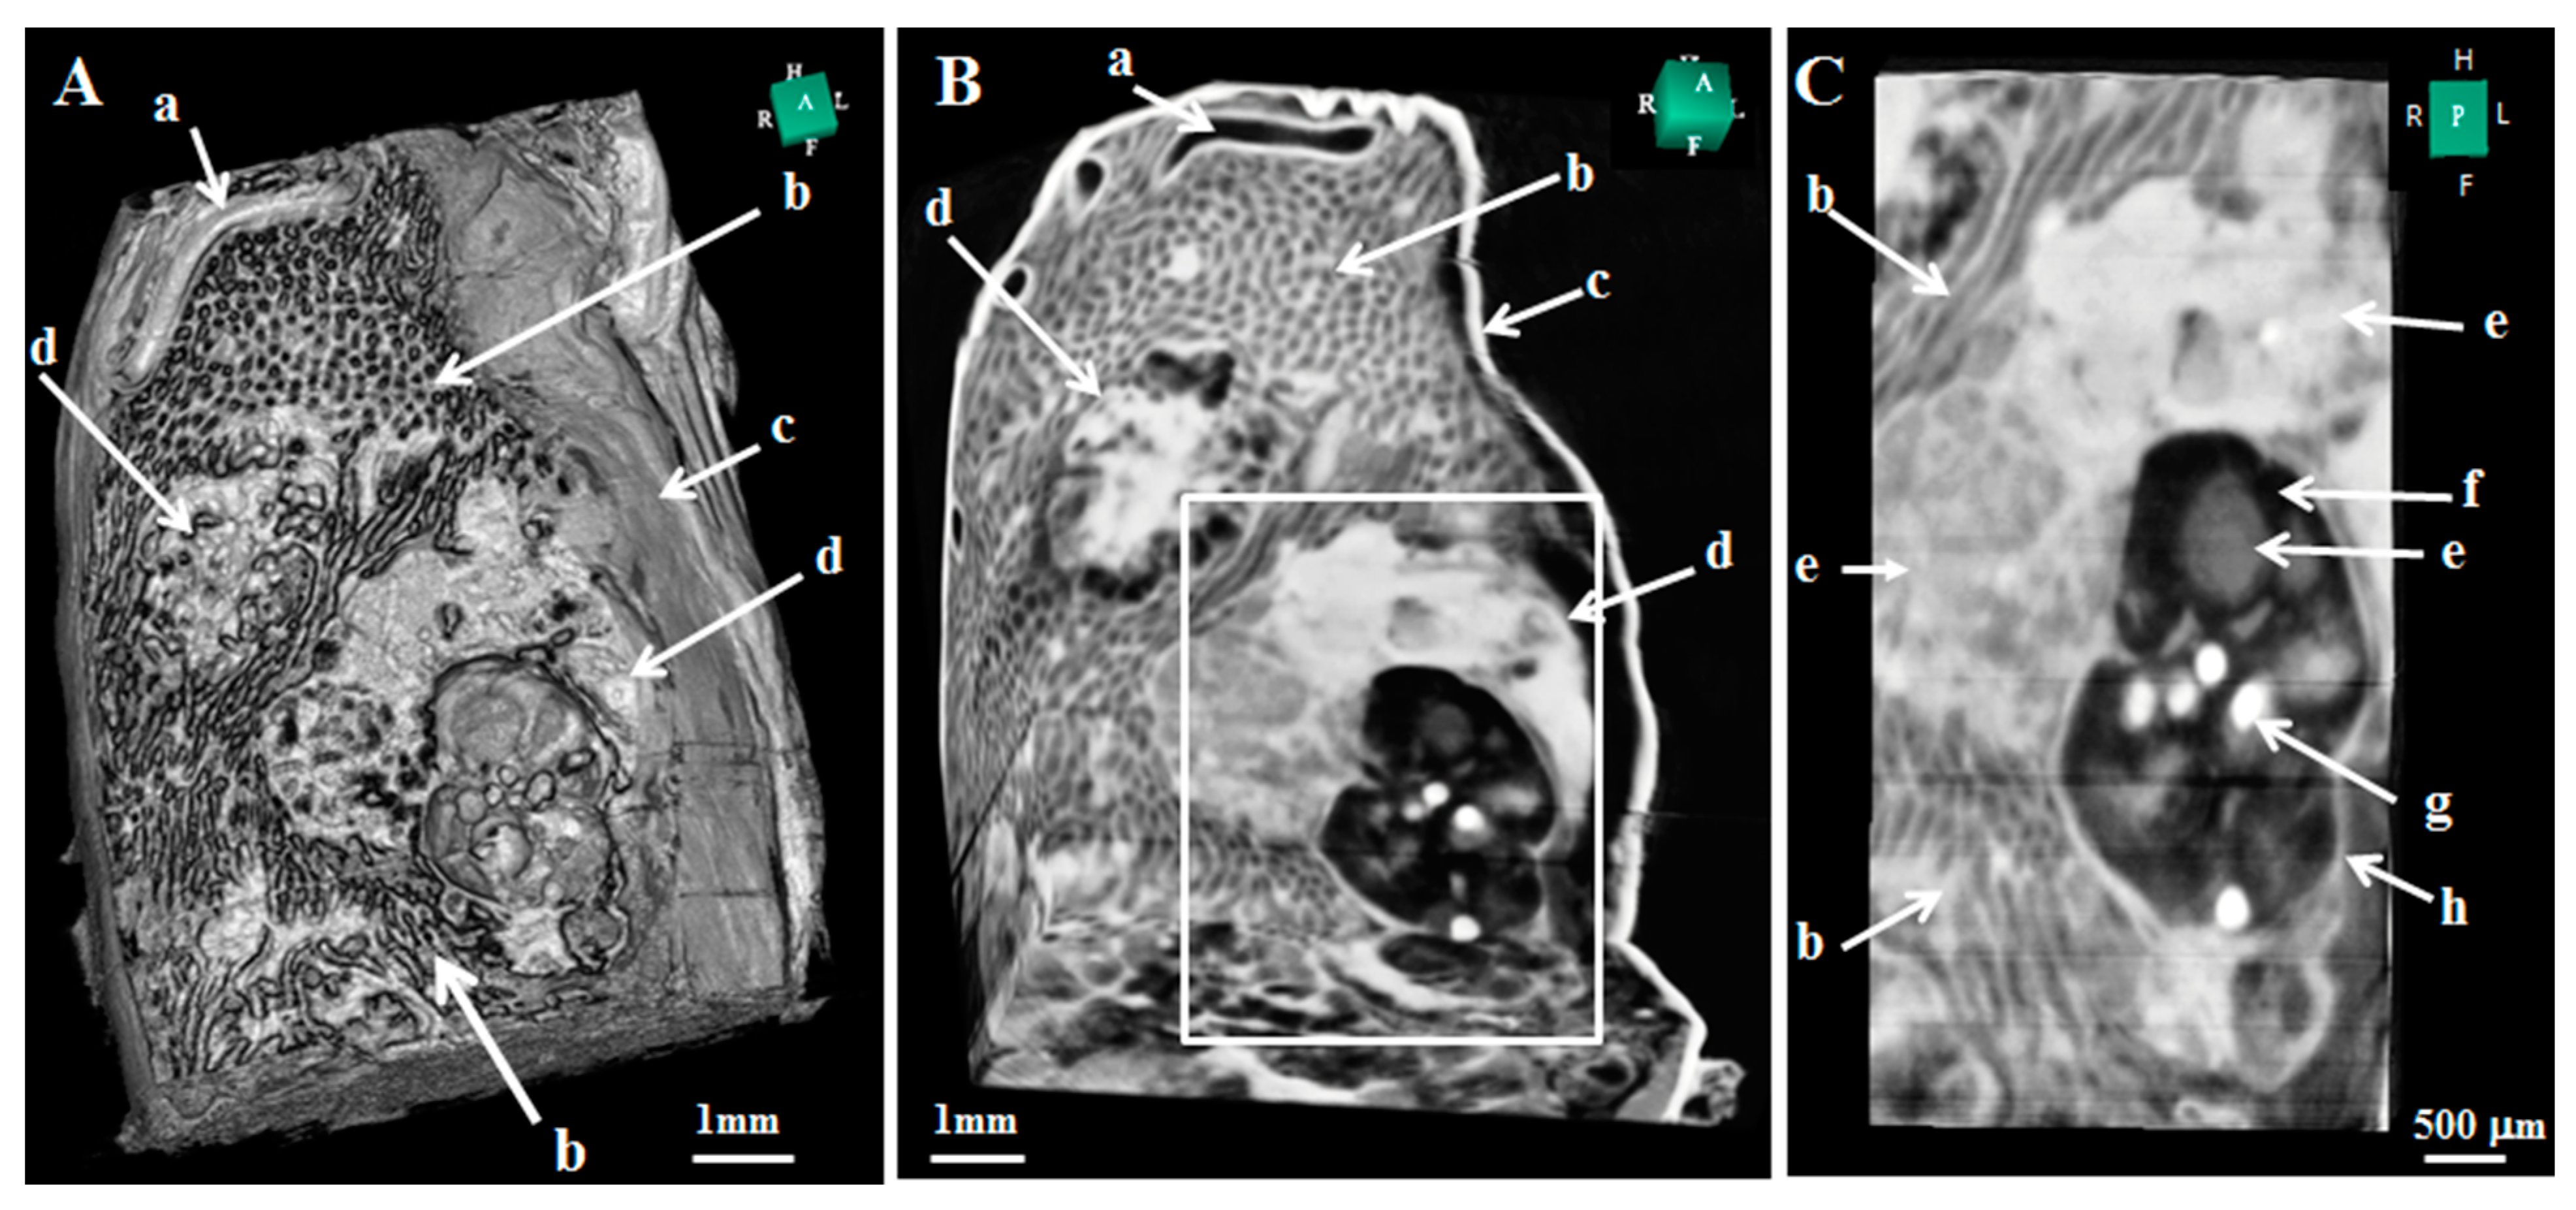
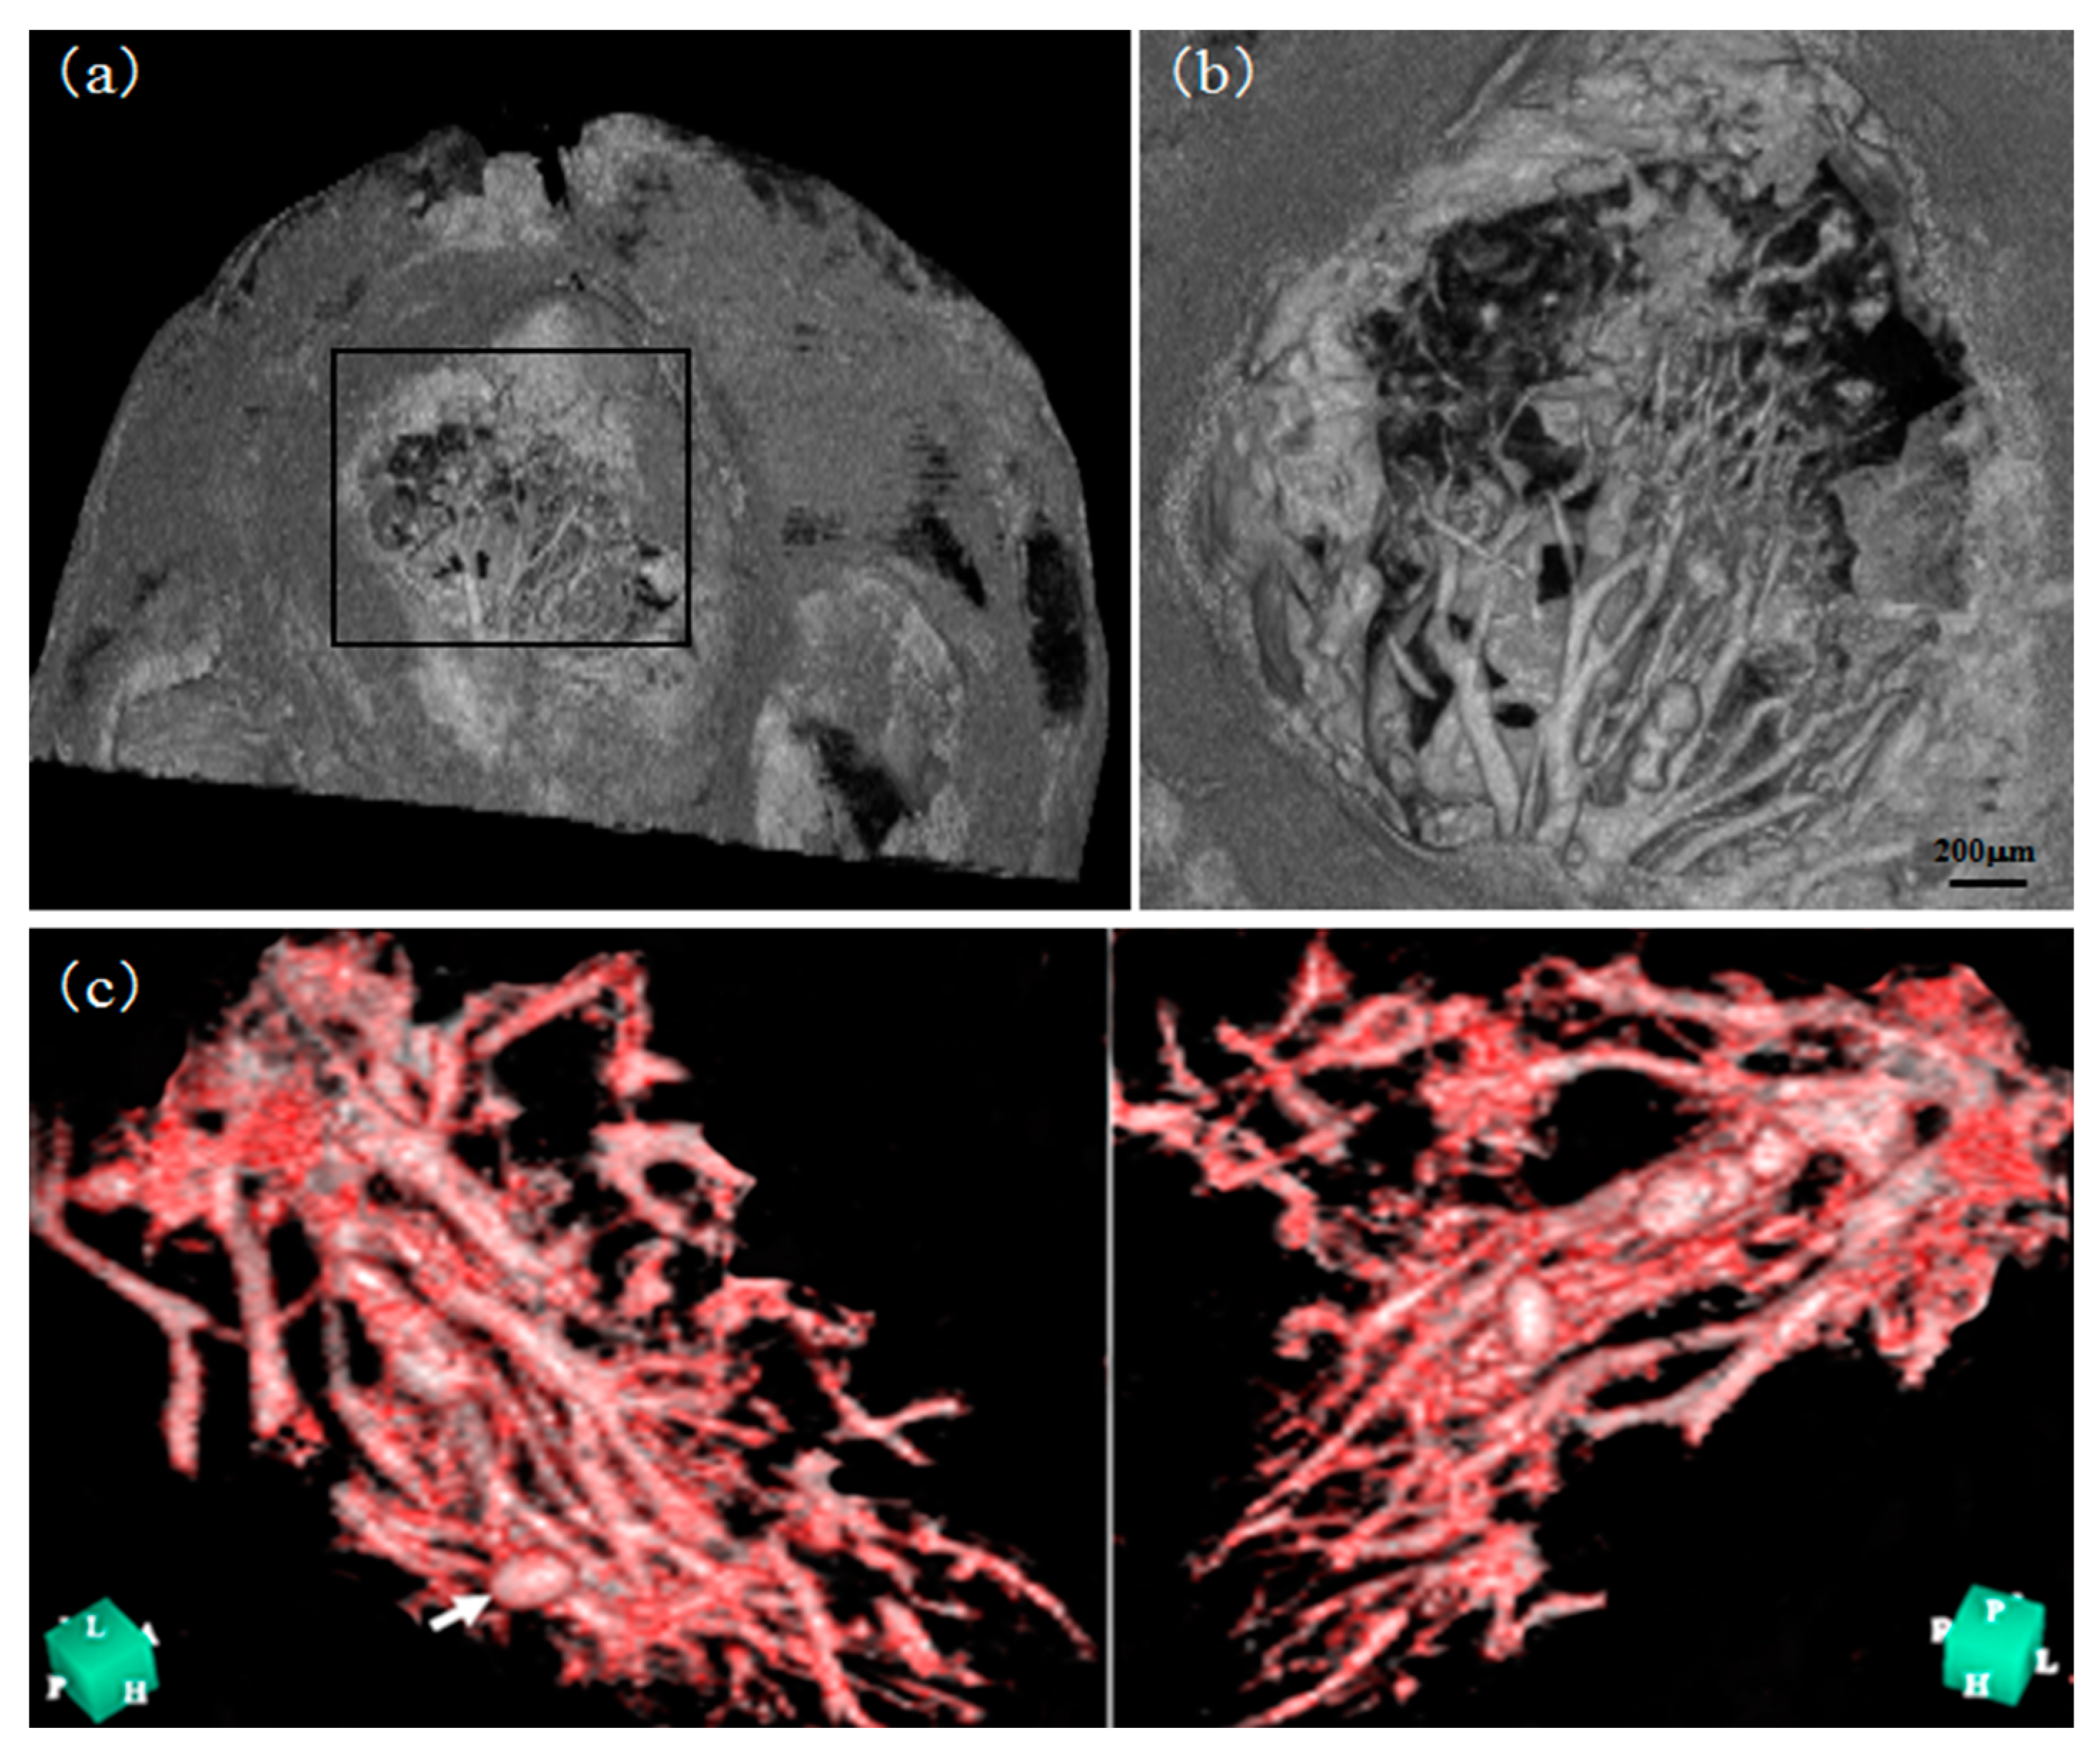
CXI shows minute density differences caused by various morphological structures within soft tissue tumors, such as solid cancerous masses, cystic and fibrous necrotic lesions, hemorrhages, and tumor vessels [39,40,41,42]. The resultant CT images resemble pathological pictures (magnification ×20) and clearly show the pathological features of tumors [42] (Figure 7). Minutely differing densities within tumors visualized using CXI correspond especially well to the different types of neoplastic cells in soft tissue tumors observed in pathological images [42]. Moreover, CXI provides three-dimensional (3D) information, yielding volume data with a density resolution of 0.3 mg/cm3. Furthermore, it is not labor-intensive and time-consuming such as histopathological staining. These 3D information capabilities enable the imaging of entire organs, which in turn enables the localization and size determination of various pathological lesions [42] (Figure 8). 3D images of tumor micro-vessels reconstructed from PX-CXI images without the use of contrast media enable evaluation of the vascular architecture (Figure 9) [40]. This ability to visualize pathological details and tumor vessels on the basis of density differences is an important breakthrough in the field of preclinical anticancer research.
CXI has provided in vivo images of cancers implanted in nude mice [47] and has enabled the sequential effects of anticancer treatment to be clearly observed [48]. In vivo observation of a small animal disease model is very important for understanding the mechanisms of disease and treatment strategies [40].

7. Embryonic Imaging by Phase-Contrast X-ray Imaging

CXI is suitable for high-resolution embryonic imaging, as shown in Table 5. Also, the sample size that can be imaged with CXI is suitable for whole human embryos. The human embryo samples used in this study were obtained from the Kyoto Collection, which is one of the largest collections of human embryo specimens in the world and one of the few human samples that are ethically permitted for use [49]. When we planned to take images of human embryos using CXI, samples other than human embryos were used to be fixed directly to acrylic pranks, and the samples were discarded after imaging. For the reason that human embryos are precious, the imaging of CXI must be nondestructive. Therefore, we first developed a method for embedding samples in agarose gels. The gel was poured into a PVC tube approximately 1 cm in diameter and length, and the sample was fed into the tube as it hardened, resulting in a cylindrical sample encased in the gel. This gel cylinder was removed from the PVC tube, fixed directly to an acrylic plate with instant adhesive (Figure 10a), and mounted on an acrylic cell (Figure 10b). Imaging was performed in these states, and the resultant images were acquired at a resolution suitable for analysis. The sample was rotated slightly during imaging. To further reduce the gel shaking that occurred during this process and improve the image quality, a cup-shaped part was made of Kapton polyimide film (Figure 10c), into which the gel was poured, and the sample was fixed (Figure 10d). This method is currently used for imaging purposes.
These innovations have made it possible to perform stable imaging of human embryos using CXI, and morphological analysis has been performed on the images obtained. Figure 11 shows images from representative studies [50,51,52,53,54,55,56].

8. Phase-Contrast X-ray Imaging in Various Thermal Environments

X-ray CT by means of absorption-contrast X-ray imaging has been used to image gas-filled pores within bio tissues and inorganic materials. However, there is a great demand for visualizing water and its phase changes in these materials. For instance, freezing food is one of the most effective methods for preserving food, but the formation of large ice crystals greatly damages the tissues of the food. Understanding the freeze-thaw process of water in materials, such as fuel cells and construction cement is crucial to facilitating their effective use. Unfortunately, the quality of the X-ray CT imaging dataset is not sufficient to visualize multi-phase materials without a contrast agent because of their low density and the small density differences, as shown in Table 6. A major difficulty is the detection of changes in the water phase using non-destructive observation techniques. This section introduces non-destructive 3D observations of various materials at low temperatures, which enables the observation of icy materials using CXI.
The thermal effect in a crystal-based XI is not negligible because the thermal drift of the deformations of crystal wafers in a crystal-based XI reduces the sensitivity of CXI. The cryochamber (Figure 12a), including the X-ray window, was insulated with a vacuum layer to maintain the temperature of the crystal-based XI. The X-ray windows were made of aluminum foil and were 60 × 30 mm. They were placed at each end of the sample chamber for CXI measurement so that the object and reference X-ray beams could pass through the crystal-based XI and recombine (Figure 12b). The temperature inside the cryochamber was controlled by blowing temperature-controlled dry N2 gas, supplied by a liquid N2 container, continuously for more than 24 h. During X-ray measurement, a sample is introduced into a container consisting of two X-ray windows 25 × 35 mm (Figure 12b): cylindrical samples with sizes up to a maximum diameter of 15 mm and 20 mm in length can be measured. The container is filled with a buffer liquid to keep the density difference between the sample and the surrounding area within the dynamic range, and to maintain the sample temperature between 190 and 370 K [57]. Two sheet heaters attached to the container maintain the temperature of the liquid within ±1 K. Accordingly, the liquid controls the sample temperature and prevents undesirable outline contrasts from the outer surface of the sample. For measurement of icy materials, methyl acetate was used as the buffer liquid to reduce the density differences between the sample and background area because the density of methyl acetate is 0.928 g/cm3 at 298 K, which is close to that of hexagonal ice (0.917 g/cm3 at 273 K), and methyl acetate remains in the liquid state even at low temperatures (>175 K). The type of liquid is selected on the basis of the density of the sample and the experimental temperature. For example, the type of liquid can be water, normal saline, or another solution.
Here, several observation results for icy materials and their phase changes are introduced. The visualization and identification of crystalline materials are useful for evaluating CXI performance since their density and temperature variations can be understood with high precision. These results demonstrate the advantage of CXI for investigating the phase change of materials because of its high sensitivity to density.
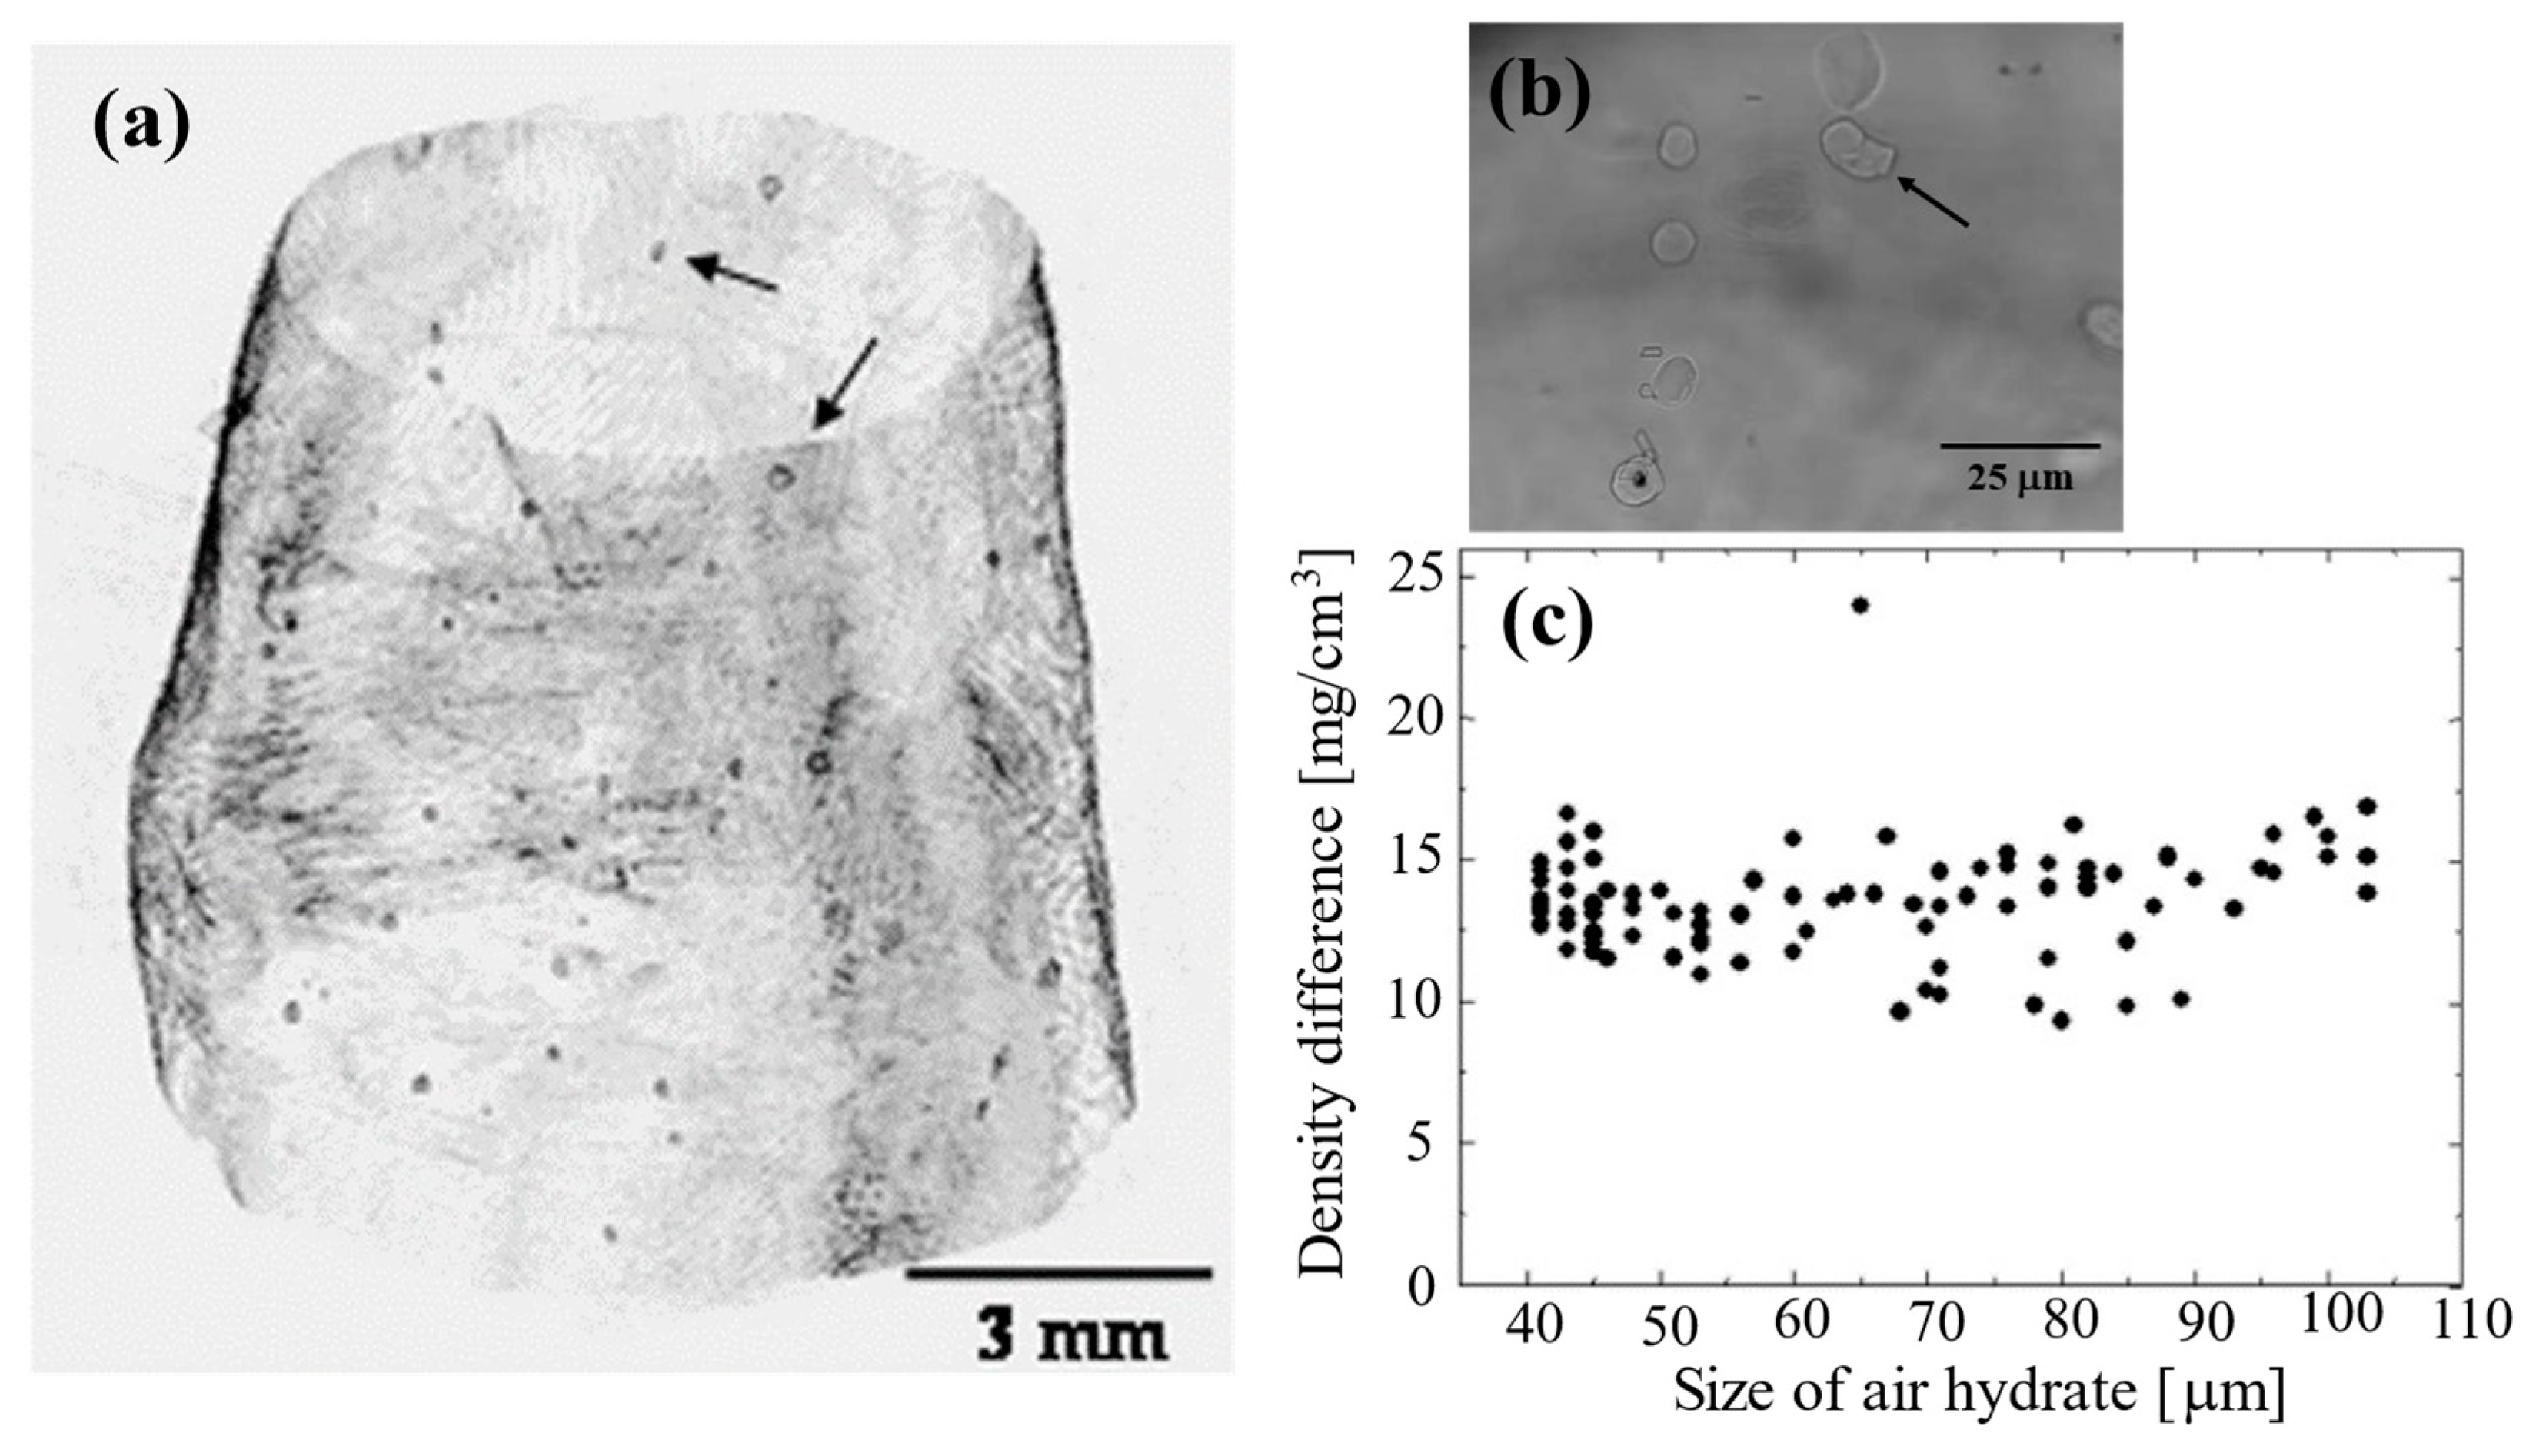
One icy material that has been investigated is air hydrate, one of the clathrate hydrates that contain air (N2, O2, and other small amounts of gas molecules) in a cage structure composed of water [58]. The analysis of air hydrates is essential for reconstructing the climate over the last several hundred thousand years because the air hydrate in deep ice cores is unique in that it keeps paleo-atmospheric gases in water cages [59]. Figure 13a shows an image of an ice core sample taken at a depth of 1975.8 m from underneath Dome Fuji in Antarctica. Air bubbles in an ice core transform into single crystals of air hydrate over thousands of years. The CXI results show that there are many particles in the ice core sample; they correspond to the areas where the densities are higher than those of the surrounding ice (~0.01 g/cm3). XRD analysis has shown that the density of air hydrates is slightly higher than that of hexagonal ice [60]. This means that the particles in the ice core sample are air hydrate crystals [61]. Figure 13b shows the density difference between the air hydrate crystals and the surrounding ice crystals, plotted against the size of the air hydrate crystals estimated by spherical approximation using a voxel size of 18 × 18 × 18 μm. The density difference is approximately 14 mg/cm3, and the density of ice under isothermal conditions (0.923 g/cm3) gives an air hydrate density of 0.937 g/cm3.
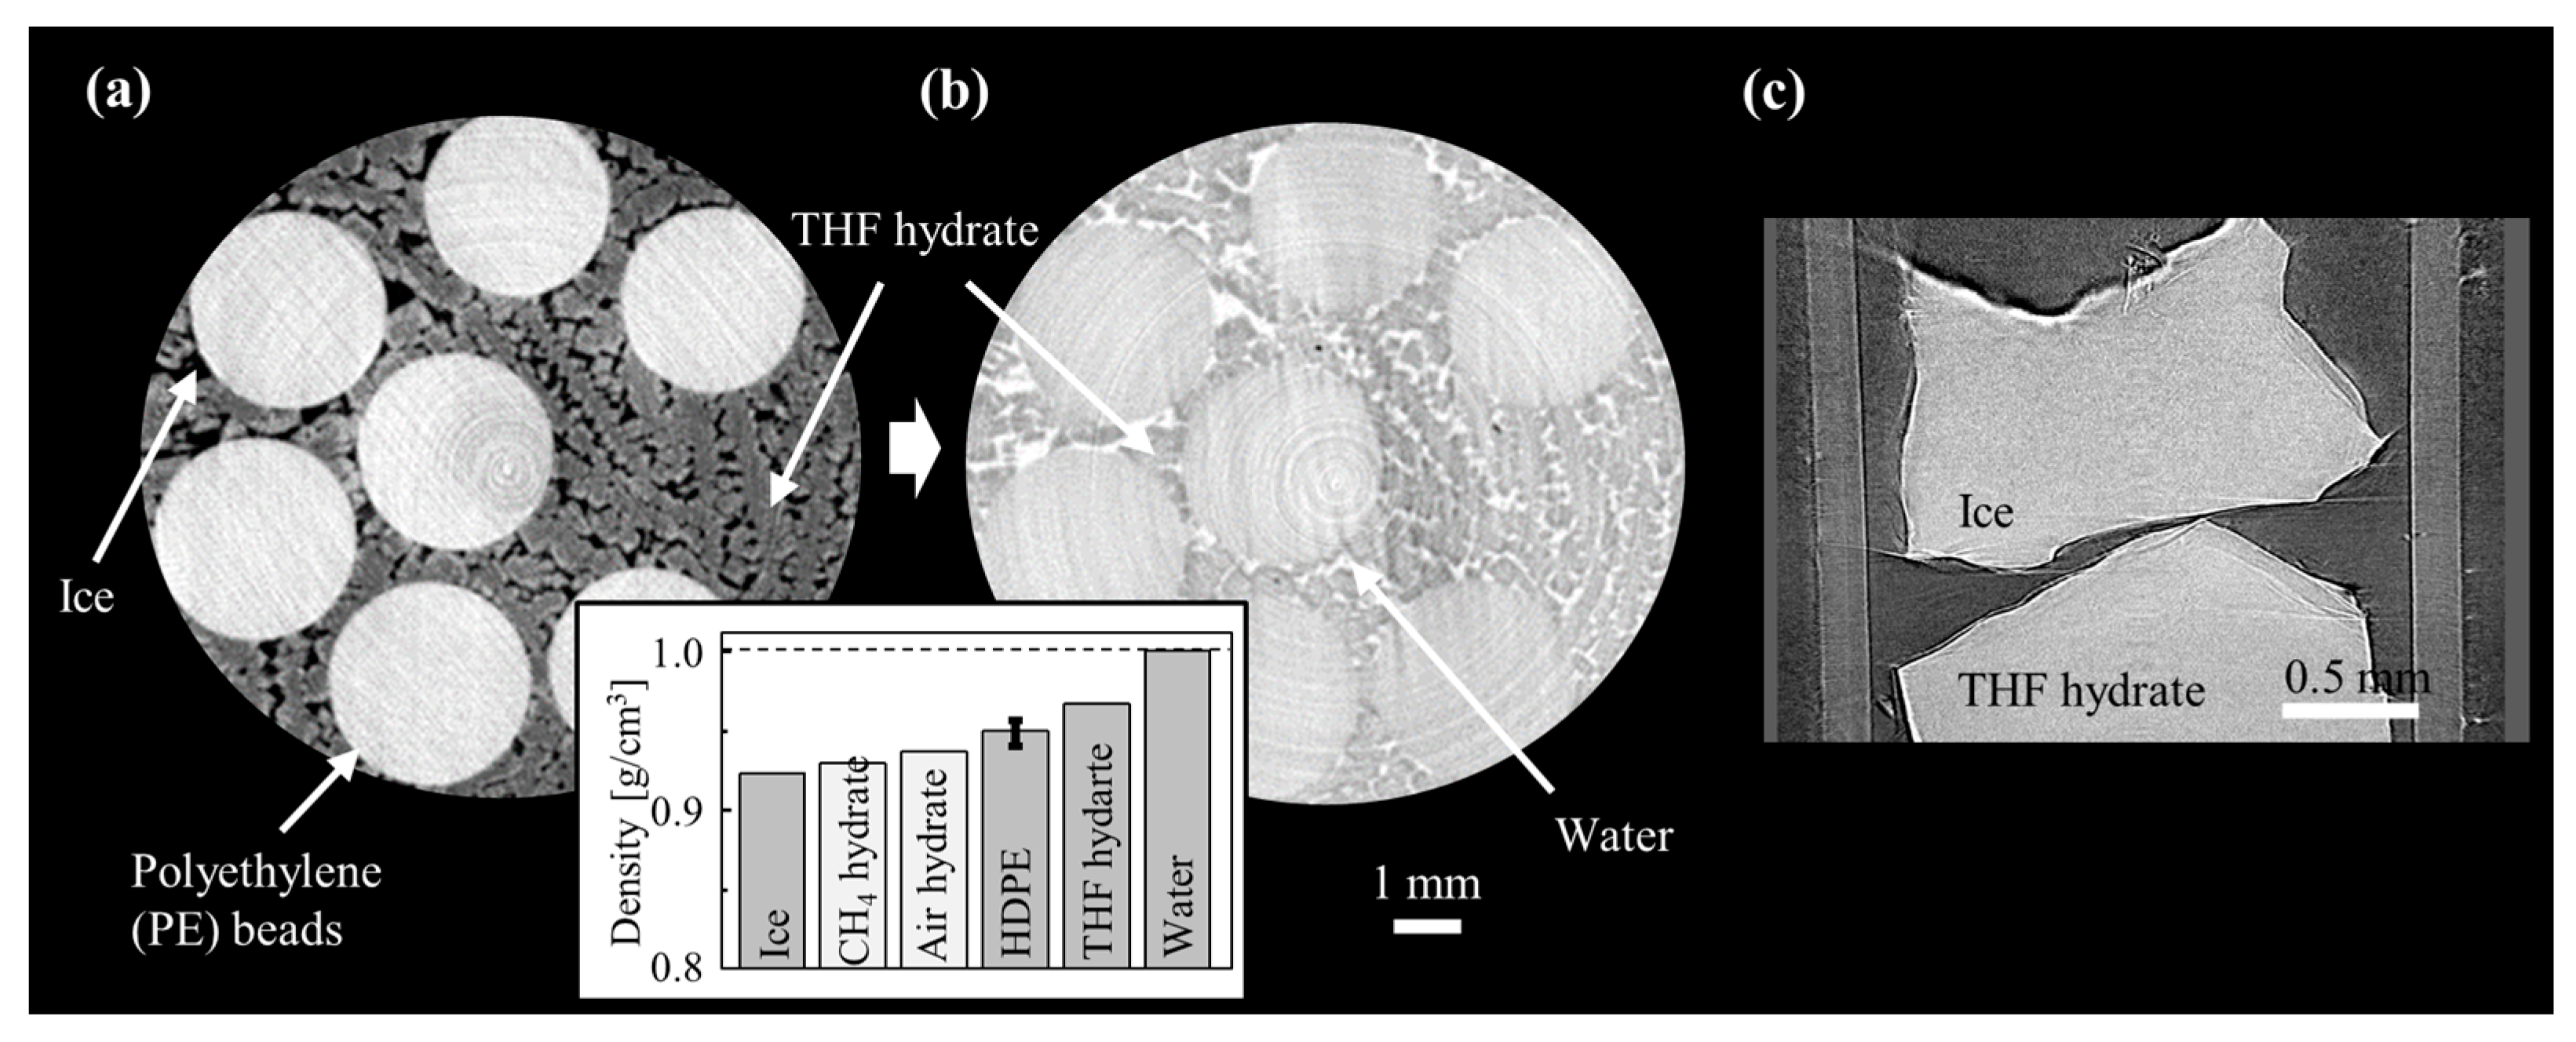
Tetrahydrofuran (THF) hydrates, which contain THF molecules as guests, form below 277 K even under atmospheric pressure. An in situ observation of THF hydrates using CXI clarified the inhomogeneous growth of THF hydrate crystals caused by the diffusion of THF solute [62]. Figure 14 shows temperature-dependent cross-sectional images of a THF hydrate sample in a cylindrical container, which enables in situ observation of THF growth and the water freeze-thaw process in the interparticle pore spaces using CXI [63]. The light gray circles correspond to the cross sections of polyethylene (density: ~0.95 g/cm3) beads. The black-spotted areas have the lowest density, indicating ice (density: 0.917 g/cm3 at 273 K), and the gray areas have a higher density, indicating THF hydrates (density: 0.967 g/cm3 at 273 K). THF hydrates co-existing with ice can be visualized even within the bead material. At 276 K, the white-spotted areas have a higher density, indicating liquid water (density: 1.00 g/cm3 at 273 K) formed by melting ice. The CXI methods are limited by sample outlining arising from a large phase shift caused by the difference in density between the samples (THF hydrate, water, and ice) and the beads. Polyethylene beads were used to perform the X-ray CT measurements because the small difference in density between the beads and THF hydrate results in good contrast. A comparison of the two images in Figure 14 shows that the multiple phases of the icy materials can be clearly visualized using in situ CXI. The high-energy CXI method enables fine observation of complex materials.
The final examples are a CH4 hydrate (Figure 15a) and a natural gas hydrate (Figure 15b). Both are icy crystals composed of water and natural gas, consisting primarily of CH4, which is considered an unconventional natural gas [58]. Comparison of the X-ray phase shift between the hexagonal ice and the CH4 hydrate revealed that the density of the CH4 hydrate was 0.007 ± 0.003 g/cm3 greater than that of hexagonal ice (0.927 g/cm3) at 193 K. The density of the CH4 hydrate was thus estimated to be 0.934 ± 0.003 g/cm3 at 193 K, which is equivalent to that obtained from powder diffraction structure analysis (0.936 g/cm3) at the same temperature [65]. For natural gas hydrates with a density of 0.944 g/cm3 at 193 K, obtained from powder diffraction structure analysis, identification with ice has been made [66].
Accordingly, the density resolution of the CXI method is approximately several mg/cm3, even under low temperature conditions. Thus, by using ice as a reference for density, CXI measurements can be used to analyze the three-dimensional distribution of density. High temperature stability during measurement is of great importance because the thermal expansion and contraction of materials arising from a temperature change are not negligible. For instance, the linear thermal expansion of hexagonal ice at 253 K is estimated to be 0.005%/K, which corresponds to an approximate deviation of 0.5 μm for a 10-mm sample. The estimated density of the sample will thus change by approximately 0.14 mg/cm3 owing to a temperature change of only 1 K. Controlling the sample temperature with high precision is also important for analyzing the three-dimensional distribution of density with high accuracy.
The sensitivity of CXI for light elements is more than several hundred times that of conventional absorption X-ray imaging in principle although the actual sensitivity greatly depends on the phase detection method. For example, the PI has been used to determine the microstructure of ice cream under negative temperature conditions [67]. However, neither PI nor absorption contrast methods were not successful for CH4 hydrate imaging [64] because they are less sensitive than CXI. In contrast, the air hydrates in the Antarctic ice core and CH4 hydrate were successfully visualized using CXI, not only by CXI but also by DEI [57,65]. The CXI method has a particular disadvantage: although it is very sensitive to density differences, it cannot measure large density differences in the object being measured. Moreover, the spatial resolution differs depending on the phase detection method, so it is necessary to select the method in accordance with the object to be measured.

9. Industrial Applications (Operando Observation of Electrolyte Distribution)

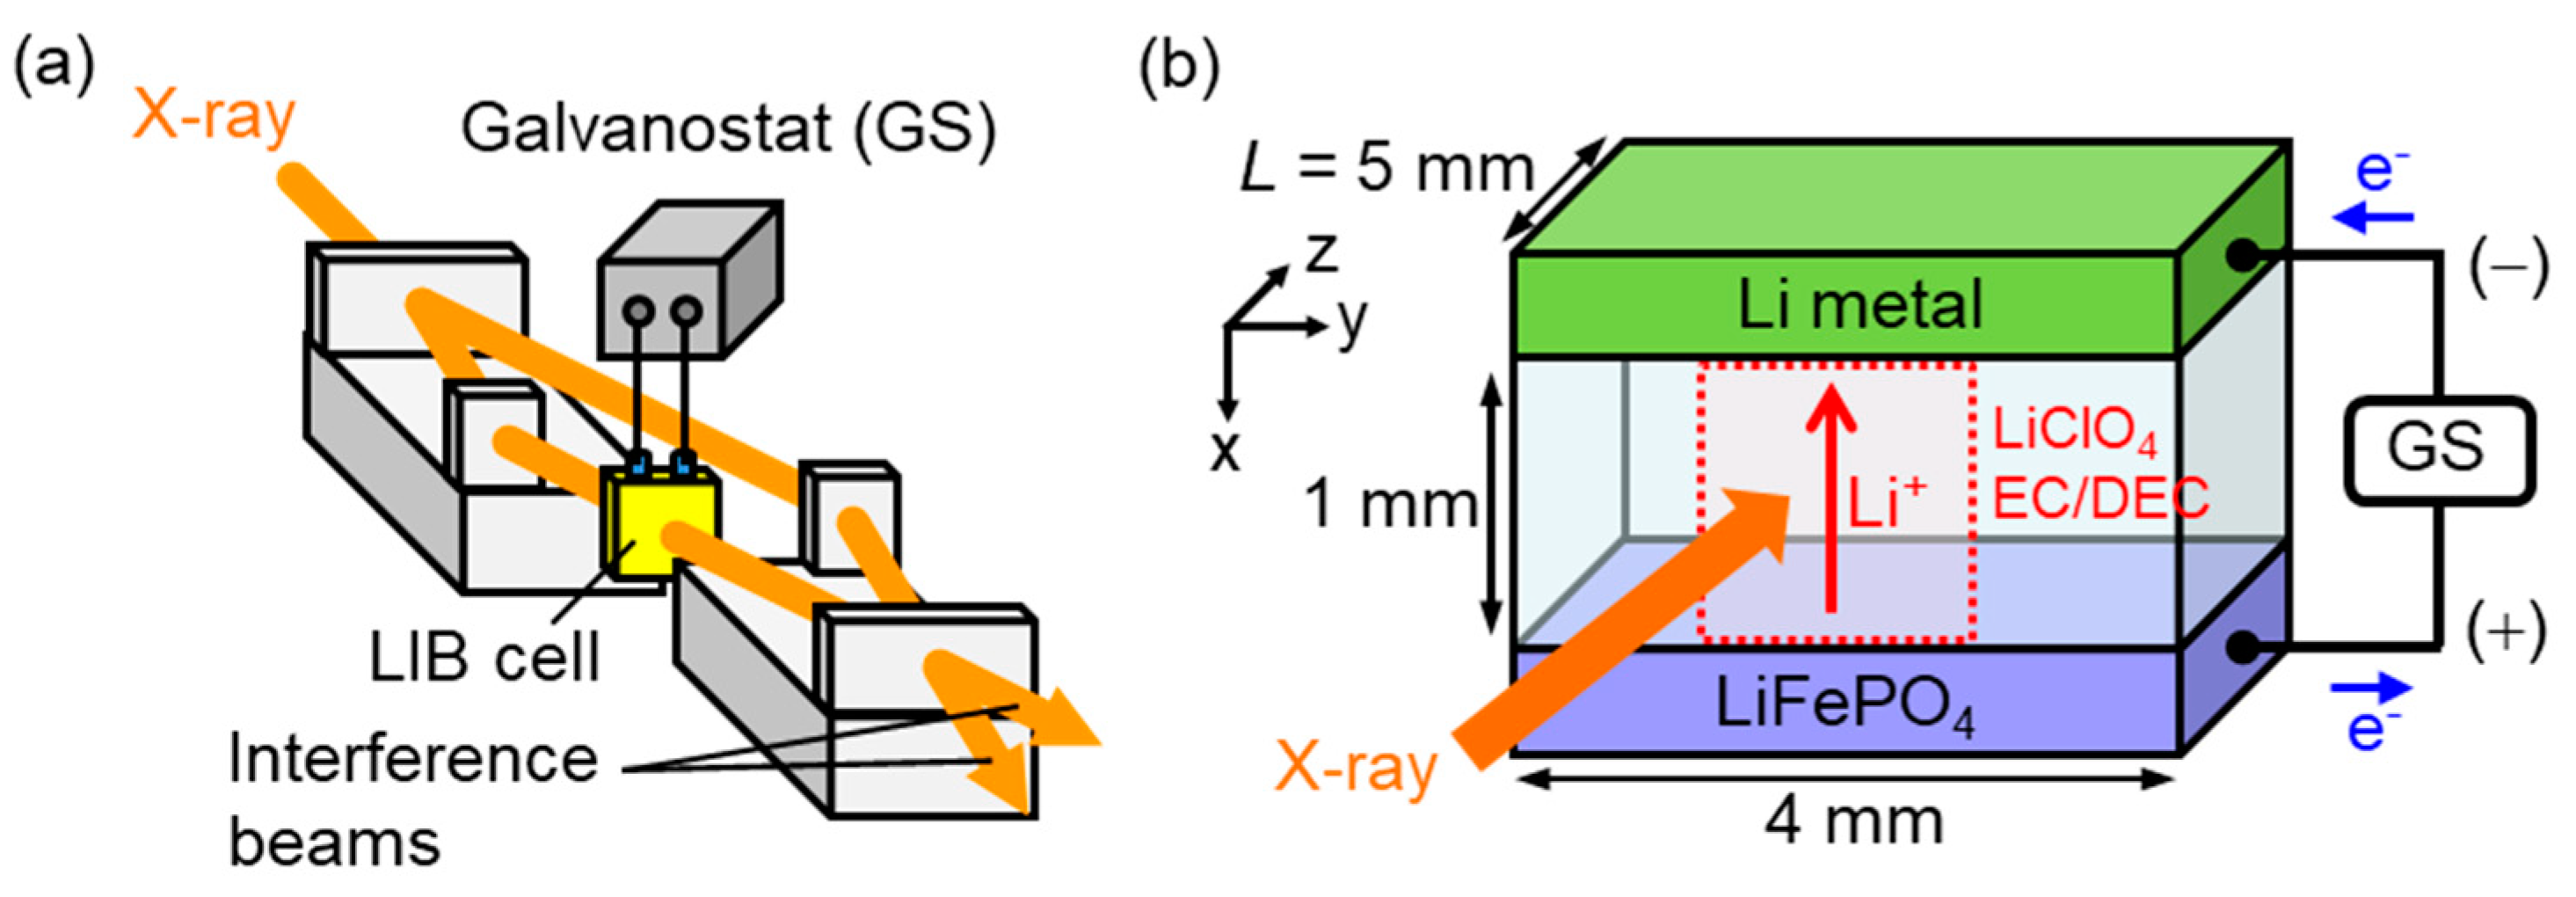
Understanding transport characteristics such as the electrolyte distribution during battery operation is essential for the optimization of the operating conditions of storage batteries, especially in automotive applications requiring high output performance and high-frequency charge-discharge durability. The dynamic behavior of the ion distribution (salt concentration) in the electrolyte during storage battery operation cannot be observed with any imaging method except for CXI due to its high sensitivity, as shown in Table 7. Experimental results have demonstrated that the salt concentration distribution in the electrolyte of a lithium-ion battery (LIB) and the electrolyte stratification behavior of a lead-acid battery (LAB) can be quantitatively visualized and analyzed with a CXI system.
A LIB model cell connected to a galvanostat (GS) was installed in the object beam path of a CXI system for in situ observation during charging and discharging (Figure 16a). A two-pole cell composed of a LiFePO4 composite electrode was used as the working electrode (WE), a lithium metal was used as the counter electrode (CE), and 1.0 M LiClO4 dissolved in carbonate solvent (EC:DEC = 1:2 v/v) was used as the electrolyte (Figure 16b). A continuous phase map of the electrolyte was obtained using 35-keV SR with an exposure time of 1 s during charging and discharging.
Figure 17a shows the voltage profile during constant-current charging at 0.4 mA/cm2 (C/2 rate) [71]. Phase shift Δp is defined as the change from the initial state and corresponds to the change in electrolyte density from the initial state due to charging. As charging progressed, Δp gradually shifted location (increasing near the WE side and decreasing near the CE side) and eventually reached to within the electrolyte (Figure 17b). In addition, the positive Δp on the WE side changed with charging, indicating that the electrolyte density on the WE side increased. Figure 17c shows line profiles of the Δp change along the x-axis between the WE and CE at state-of-charge (SOC) points A–F in Figure 17a. The profile slope gradually increases until point D (SOC = 20%); it then becomes linear and remains unchanged. These results mean that, at a low charge rate (C/2 rate), the Δp change in the electrolyte reached a steady state (balanced diffusion and migration) within 3000 s.
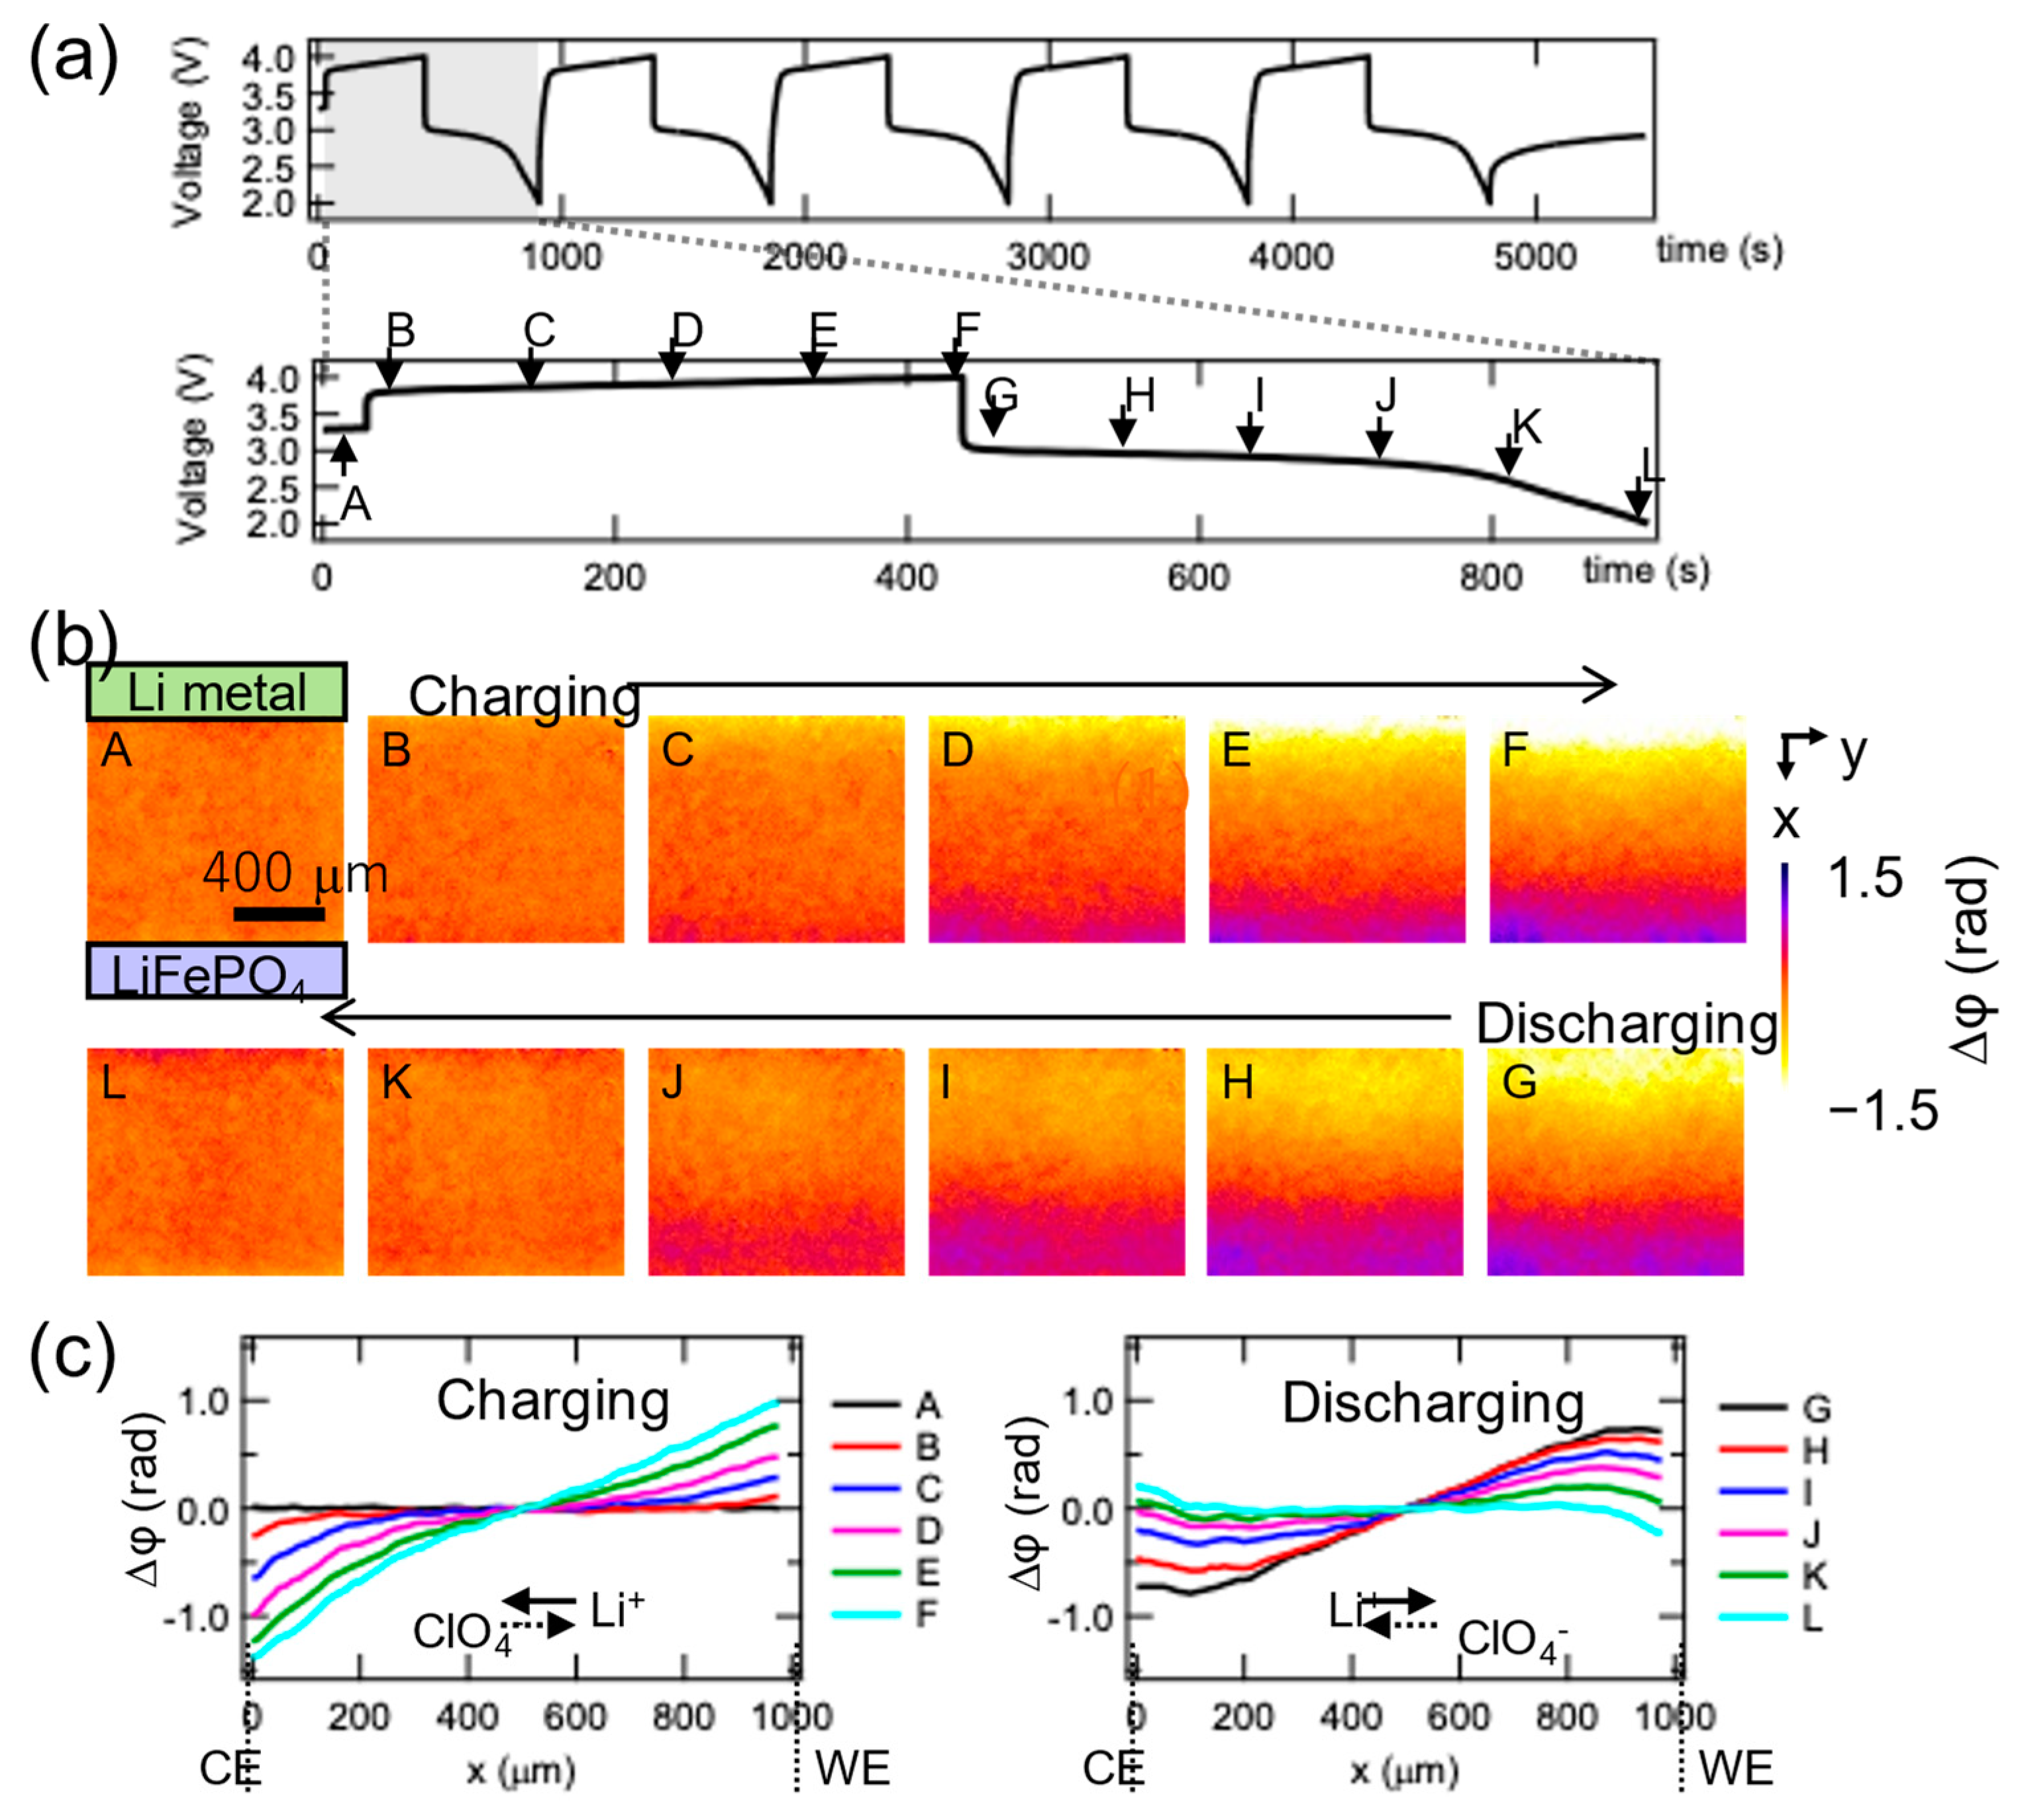
Figure 18 shows voltage profiles of the charge/discharge curve during five cycles of fast (2.4 mA/cm2, 3C rate) charge/discharge (Figure 18a), phase maps (Δp change images) of the electrolyte region during charging (points A to F) and discharging (points G to L) in the first cycle (Figure 18b), and line profiles along the x-axis during charging and discharging (Figure 18c). Δp changes reversibly with charging and discharging, and the dynamic change in the salt concentration distribution with charging and discharging can be visualized. Unlike with low-rate (C/2 rate) charging/discharging, with high-rate (3C rate) charging/discharging, the upper or lower voltage limit was reached before the line profile reached linearity. Moreover, Δp changed in the opposite direction in the vicinity of the electrode as the Li+ migration direction reversed while the Δp gradient was still present in the electrolyte bulk (with a growing concentration gradient in the electrolyte) (Figure 18c).
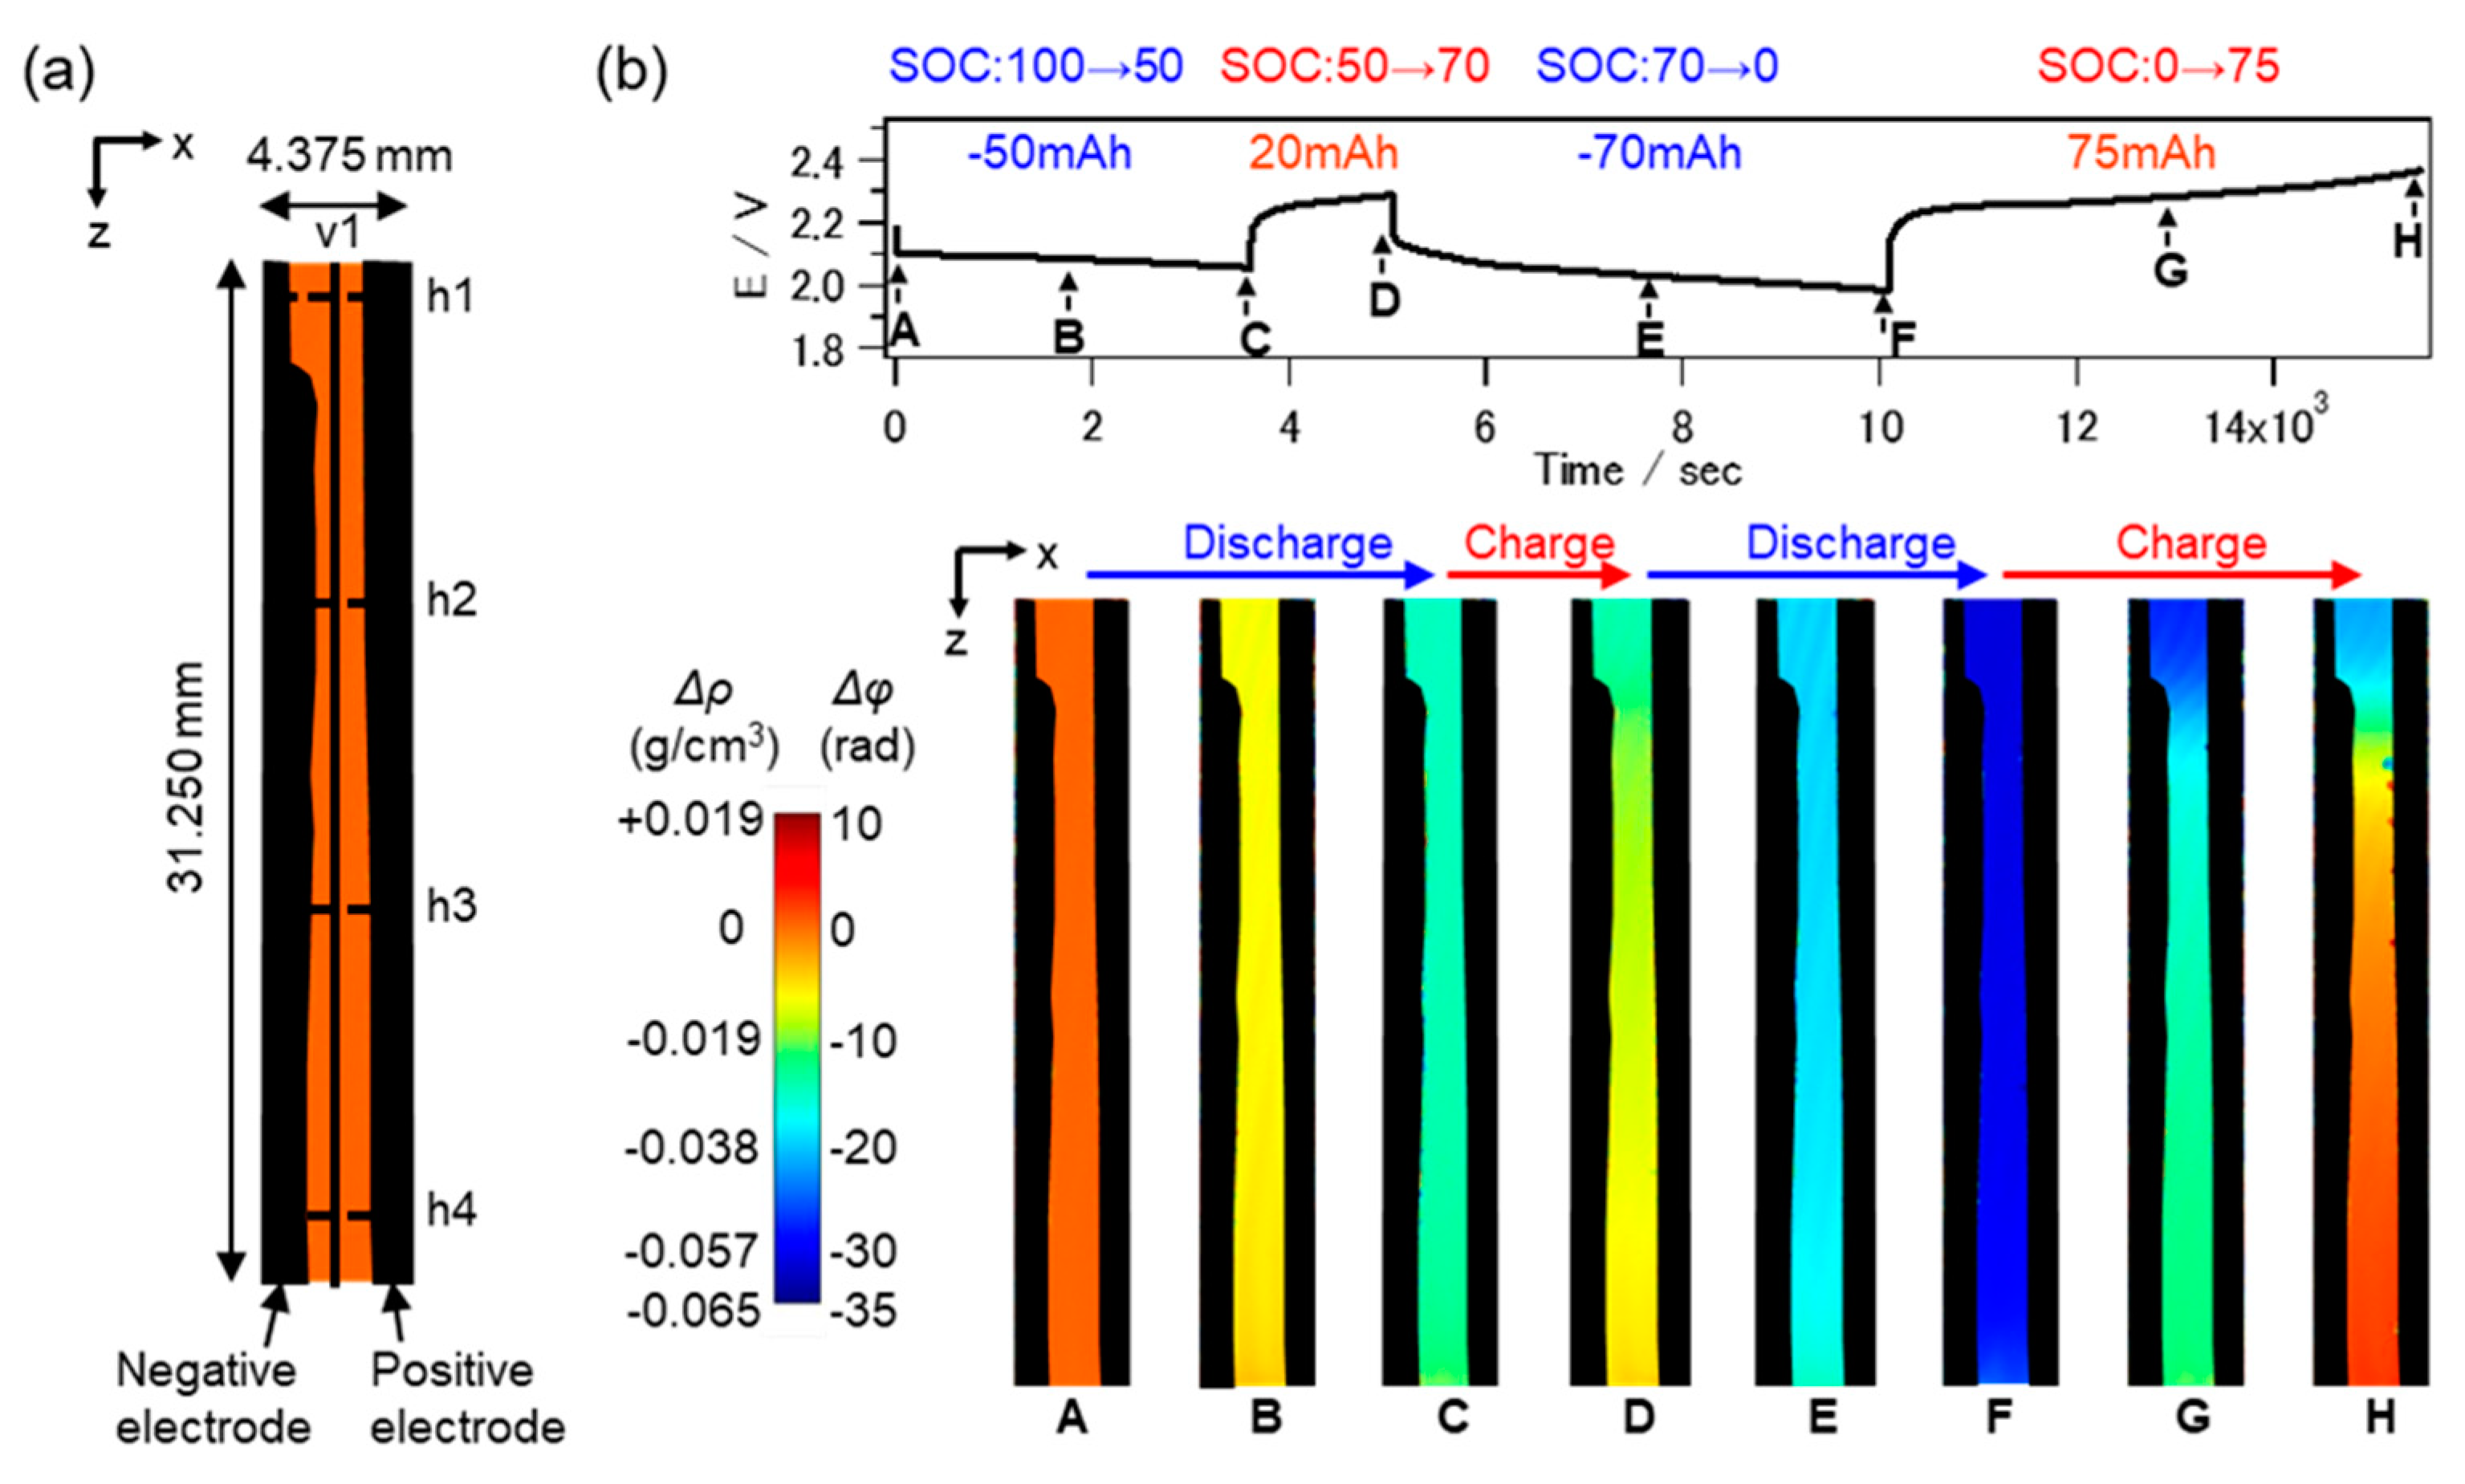
LAB observations have also been performed using a LAB model cell with a galvanostat (GS), using the same procedure as for LIB [72]. A lead-oxide (PbO2) cell was used as the positive electrode, a lead (Pb) cell was used as the negative electrode, and a 37 wt% dilute sulfuric acid solution (H2SO4 aq.) was used as the electrolyte. Observations were performed during charging and discharge using 17.8-keV SR. The exposure time was set to 5 s, and a phase map was obtained using the fringe scanning method with five steps. The phase shift is defined as the change from the initial state (before charging/discharging (t = 0, open circuit voltage).
Figure 19a shows a phase map of the LAB cell obtained before a current was applied; the two electrodes are blacked out because X-rays do not penetrate such electrodes. Before X-ray phase imaging measurement, the electrodes were fully charged, i.e., the SOC was set to 100%. Figure 19b shows the charge-discharge curve at 50 mA constant current (C/2 rate) and the corresponding phase maps obtained at points A to H (the corresponding SOC and actual capacitance are also shown). Δp decreased overall when discharge started (A to C), and it increased gradually when charging switched (C to D). When charging switched to deep discharging, Δp decreased substantially (D−F), and when deep discharging switched back to charging, Δp in the lower region of the electrolyte increased, whereas Δp in the upper region remained virtually unchanged (F–H). These results indicate that the difference in electrolyte density between the upper and lower regions increases during charging; i.e., electrolyte stratification becomes apparent. The horizontal Δp difference was very small, and the horizontal density distribution was negligible at low rates of charge and discharge (C/2 rate).
The high sensitivity temporal and spatial resolution of CXI enable visualization and quantification of not only vertical electrolyte stratification behavior during high-speed charge-discharge but also local differences in reaction rates in the horizontal direction.

10. Novel Imaging Using CXI

Several imaging methods have been developed utilizing the high sensitivity of CXI.

10.1. Coherence-Contrast Imaging

As shown in Equation (2), CXI can obtain three types of images with absorption contrast, phase contrast, and degree of coherence contrast. The third type has a limitation, though: quantitative analysis is not possible at present because it is related not only to the X-ray scattering by the small structure of the sample but also to the decrease in visibilty due to the interference X-ray optical path deviation. However, it can compensate for the narrow dynamic range of CXI.
Figure 20 shows an example observation of a mouse foot. From left to right are the projection images obtained using degrees of coherence contrast, phase contrast, and absorption contrast [73]. In Figure 20a, the outline of the soft tissue is visualized in addition to the bone, while in Figure 20b, the soft tissue is visualized but the bone (femur) region is not visualized due to an unwrapping failure. In Figure 20c, soft tissue with little absorption is not visualized at all. Thus, for morphological observation, coherence-contrast imaging, which images γ (the degree of coherence), is useful for expanding the dynamic range.

10.2. Effective Atomic Number (Zeff) Imaging

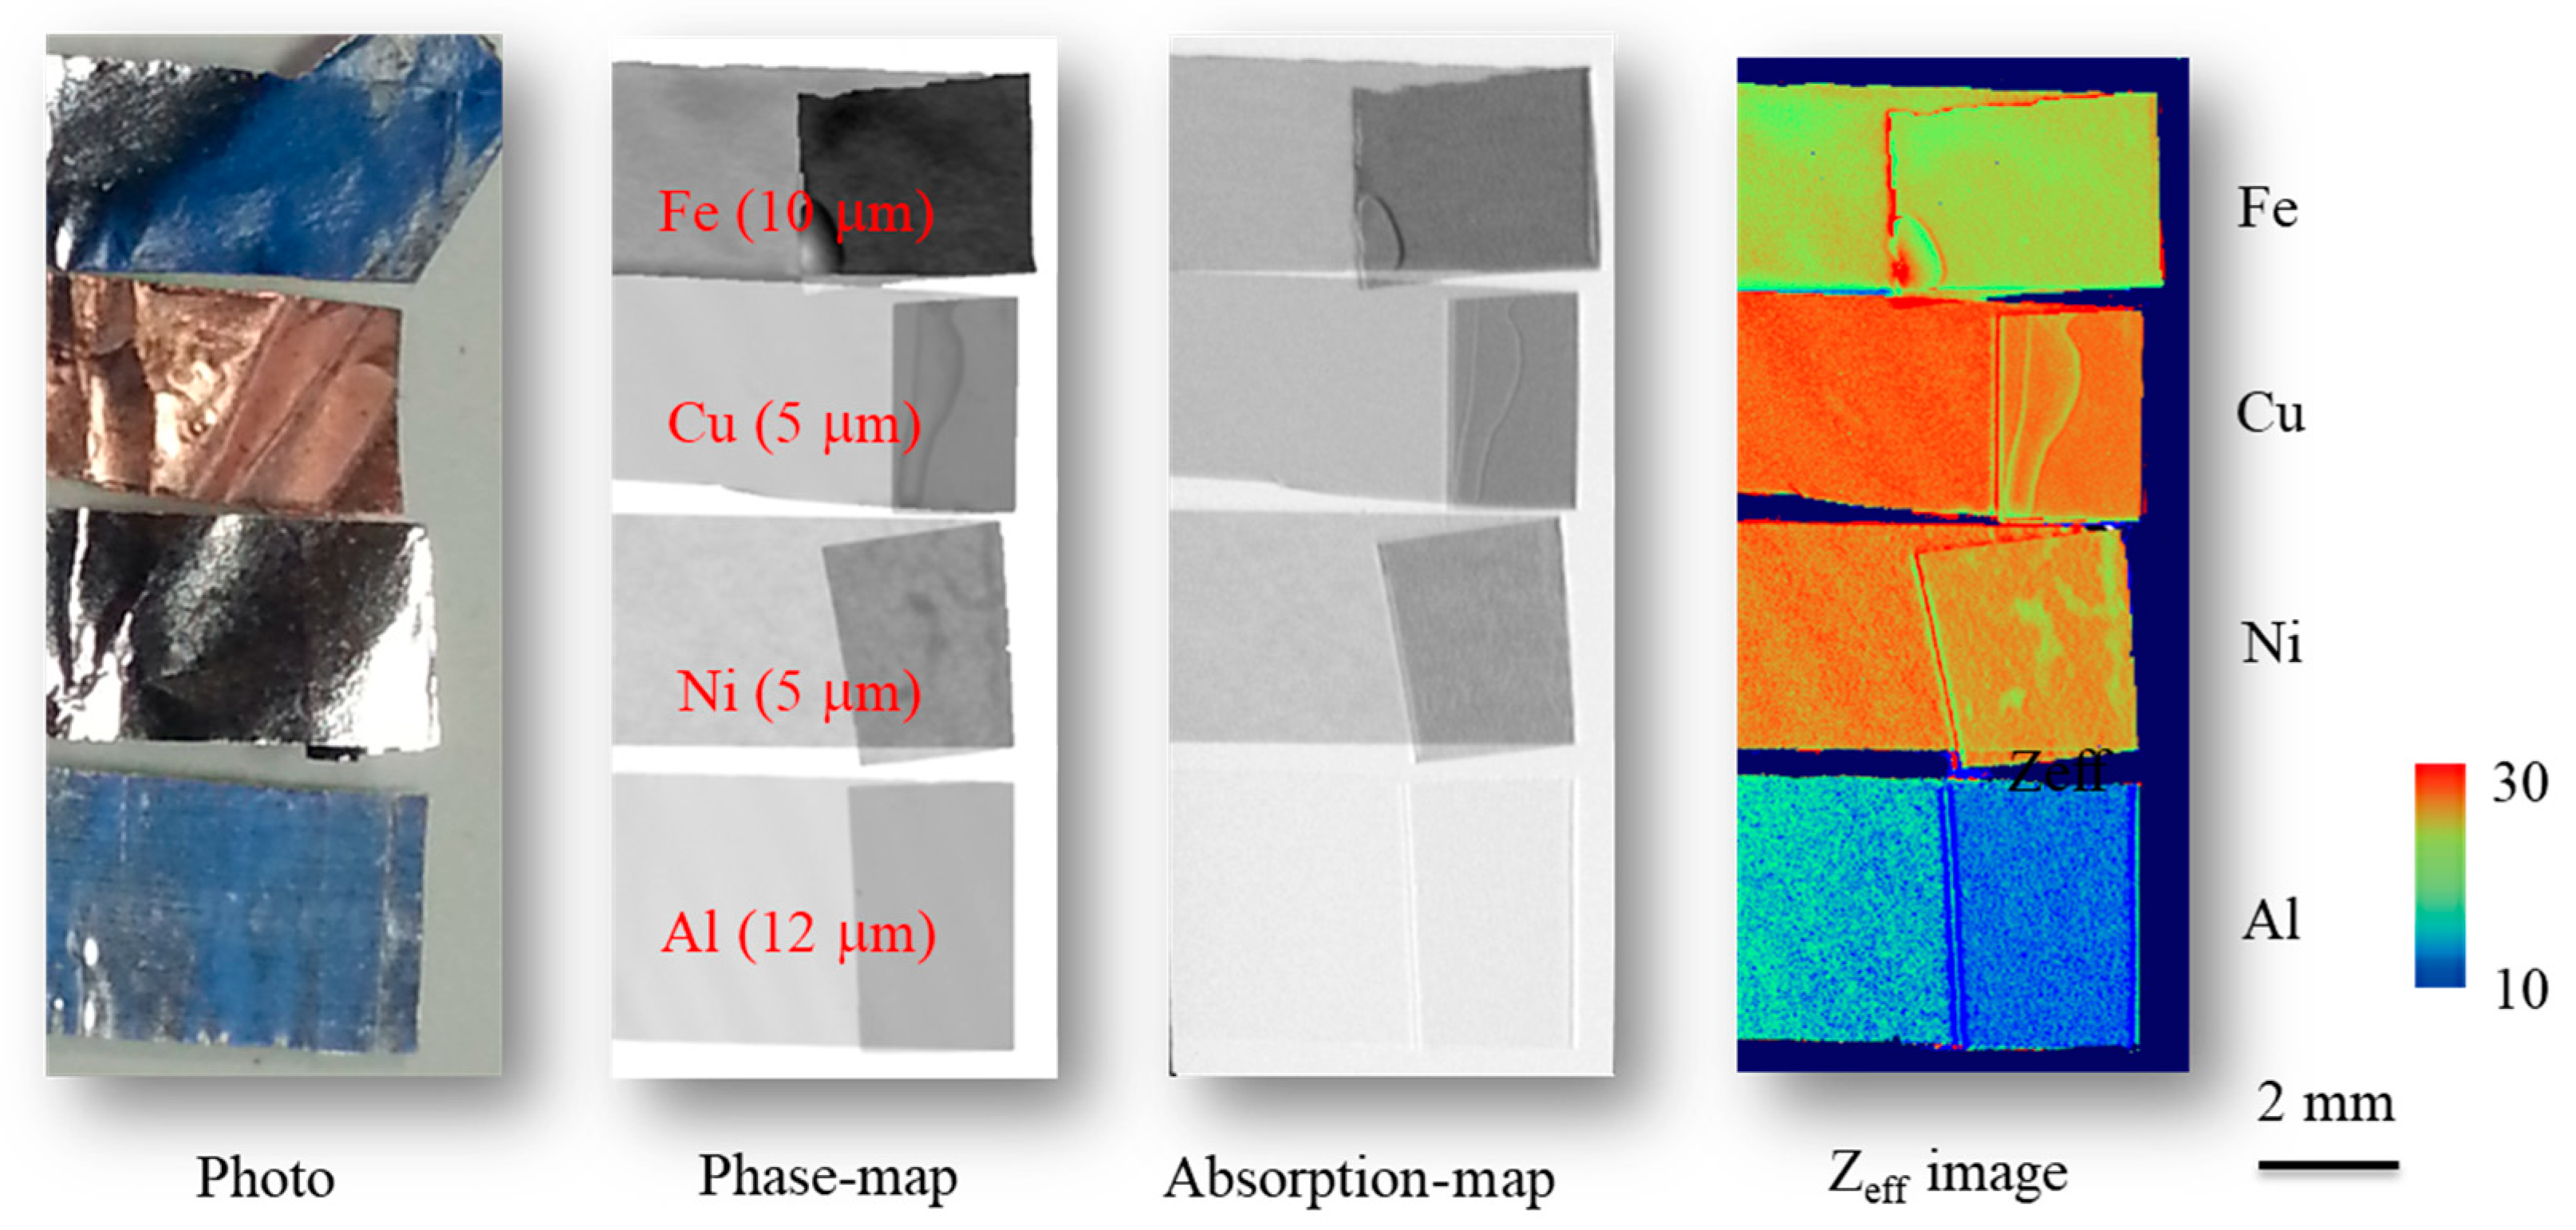
Figure 1b can be considered from another viewpoint: the sensitivity ratio (ratio of the phase shift to absorption) corresponds to the atomic number because the thickness of the sample cancels out if the absorption edge of the elements composing the sample is excluded. In other words, information about sample elements can be obtained from phase shift Δp and absorption (I/I0). Elemental mapping based on this principle is called Zeff (effective atomic number) imaging [74], and the Z-number (Zeff for complex material) can be calculated using an approximate equation for 17.8-keV X-rays:
Z e f f = 88.4 ( 2 Δ p ln ( I I 0 ) ) 0.347
Figure 21 shows photos, phase maps, and absorption maps of metal foils (Al, Fe, Ni, and Cu) obtained by CXI and the corresponding Zeff images calculated using Equation (6). While the error was larger for Al due to the small absorption, the Zeff values for Ni and Cu were 27.9 and 28.8, which are almost the same as the element numbers (28 and 29), indicating that the element type can be identified for a single element.
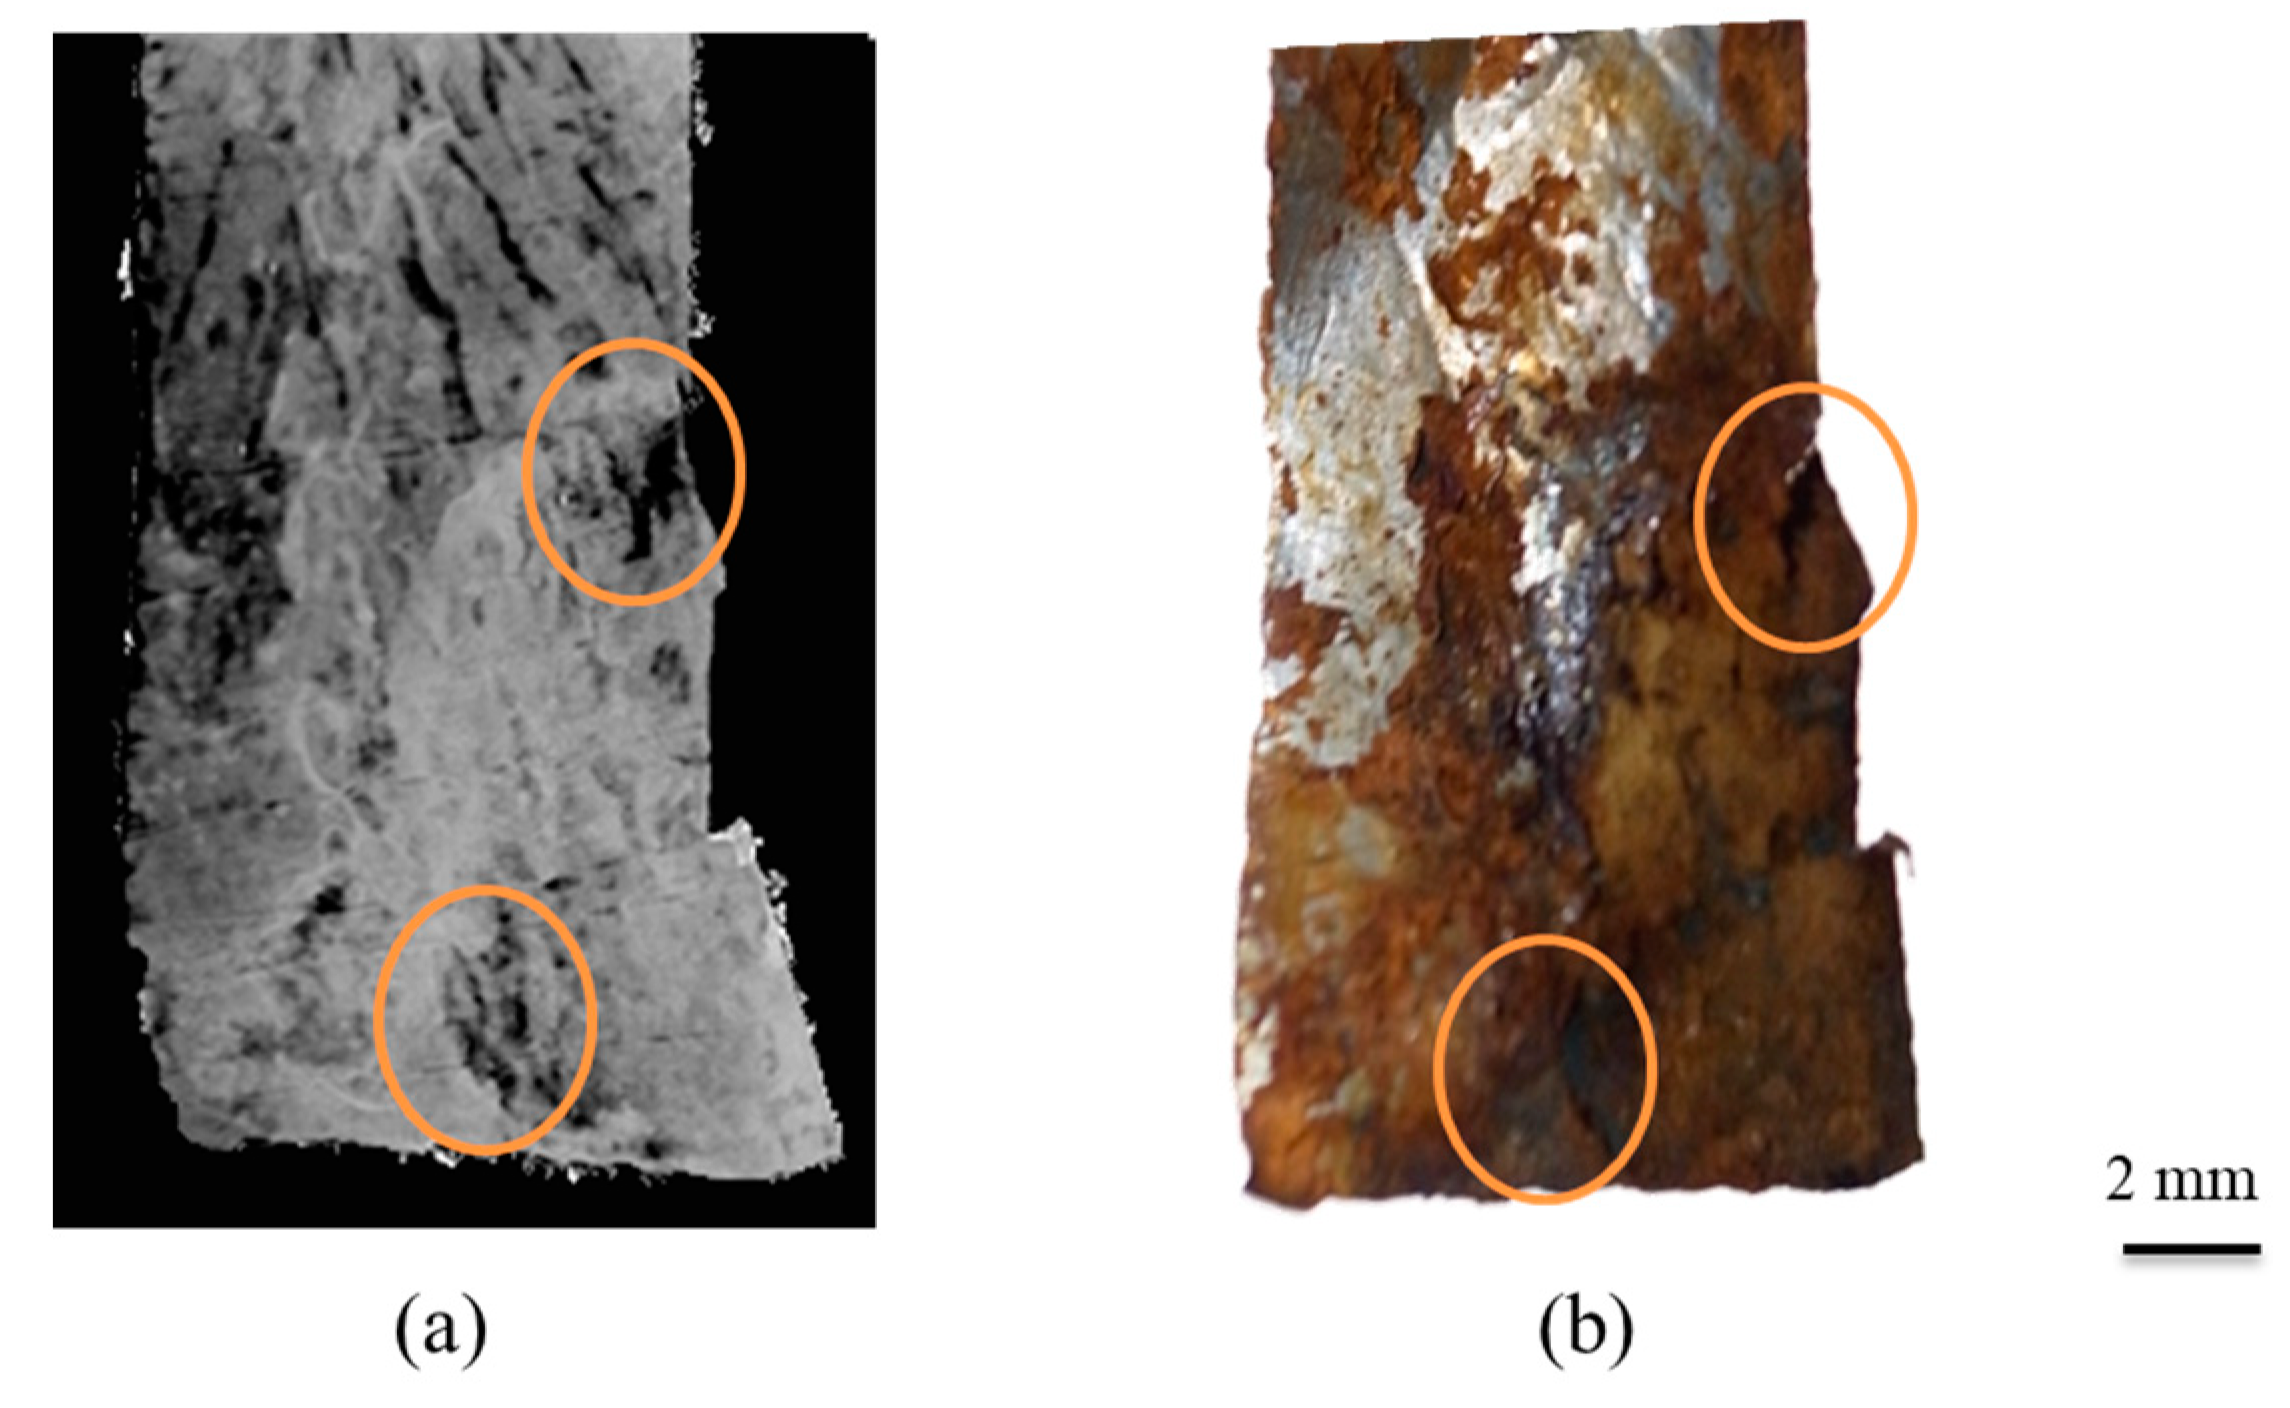
Figure 22 shows the results of applying this method to a rusted iron plate [75]. Figure 22a shows the Zeff image obtained in the same way as for Figure 21, and Figure 22b is a photograph of the sample. The Zeff values for the areas marked by the orange circles were smaller than those for the other areas, indicating that those areas were more rusted than evident in the photograph. Rusting (oxidation) increases the relative oxygen content, and the Zeff value seems to be conversely decreased. This imaging method cannot detect changes in valence quantitively, unlike XAFS (X-ray absorption fine structure) spectroscopy, but the X-ray energy can be set arbitrarily. Therefore, this method should enable observation of the internal state (rusting, oxidation, and degradation) of thick samples.

10.3. X-ray Thermography

X-ray thermography [76] is a non-destructive method for visualizing the thermal distribution inside an object on the basis of the slight density changes caused by thermal expansion. The thermal expansion coefficient α of solids and liquids at room temperature is very small and can be assumed constant regardless of temperature. Therefore, material volume V with changed temperature dT from original volume V0 can be approximated as
V = V 0 ( 1 + α d T )
The relationship between V and density ρ ( d ρ / d T = α ρ ) can be used to detect dT on the basis of the change in ρ (). Therefore, if α is known, dT can be detected from dρ. However, since α is very small (<10−5) and the sensitivity of conventional absorption-contrast CT is not so high, the temperature resolution is limited to several tens of degrees. In contrast, since the sensitivity of PCXI, especially when using CXI, is very high and the density resolution can exceed 1 mg/cm3, the temperature can be measured with an accuracy of a few degrees.
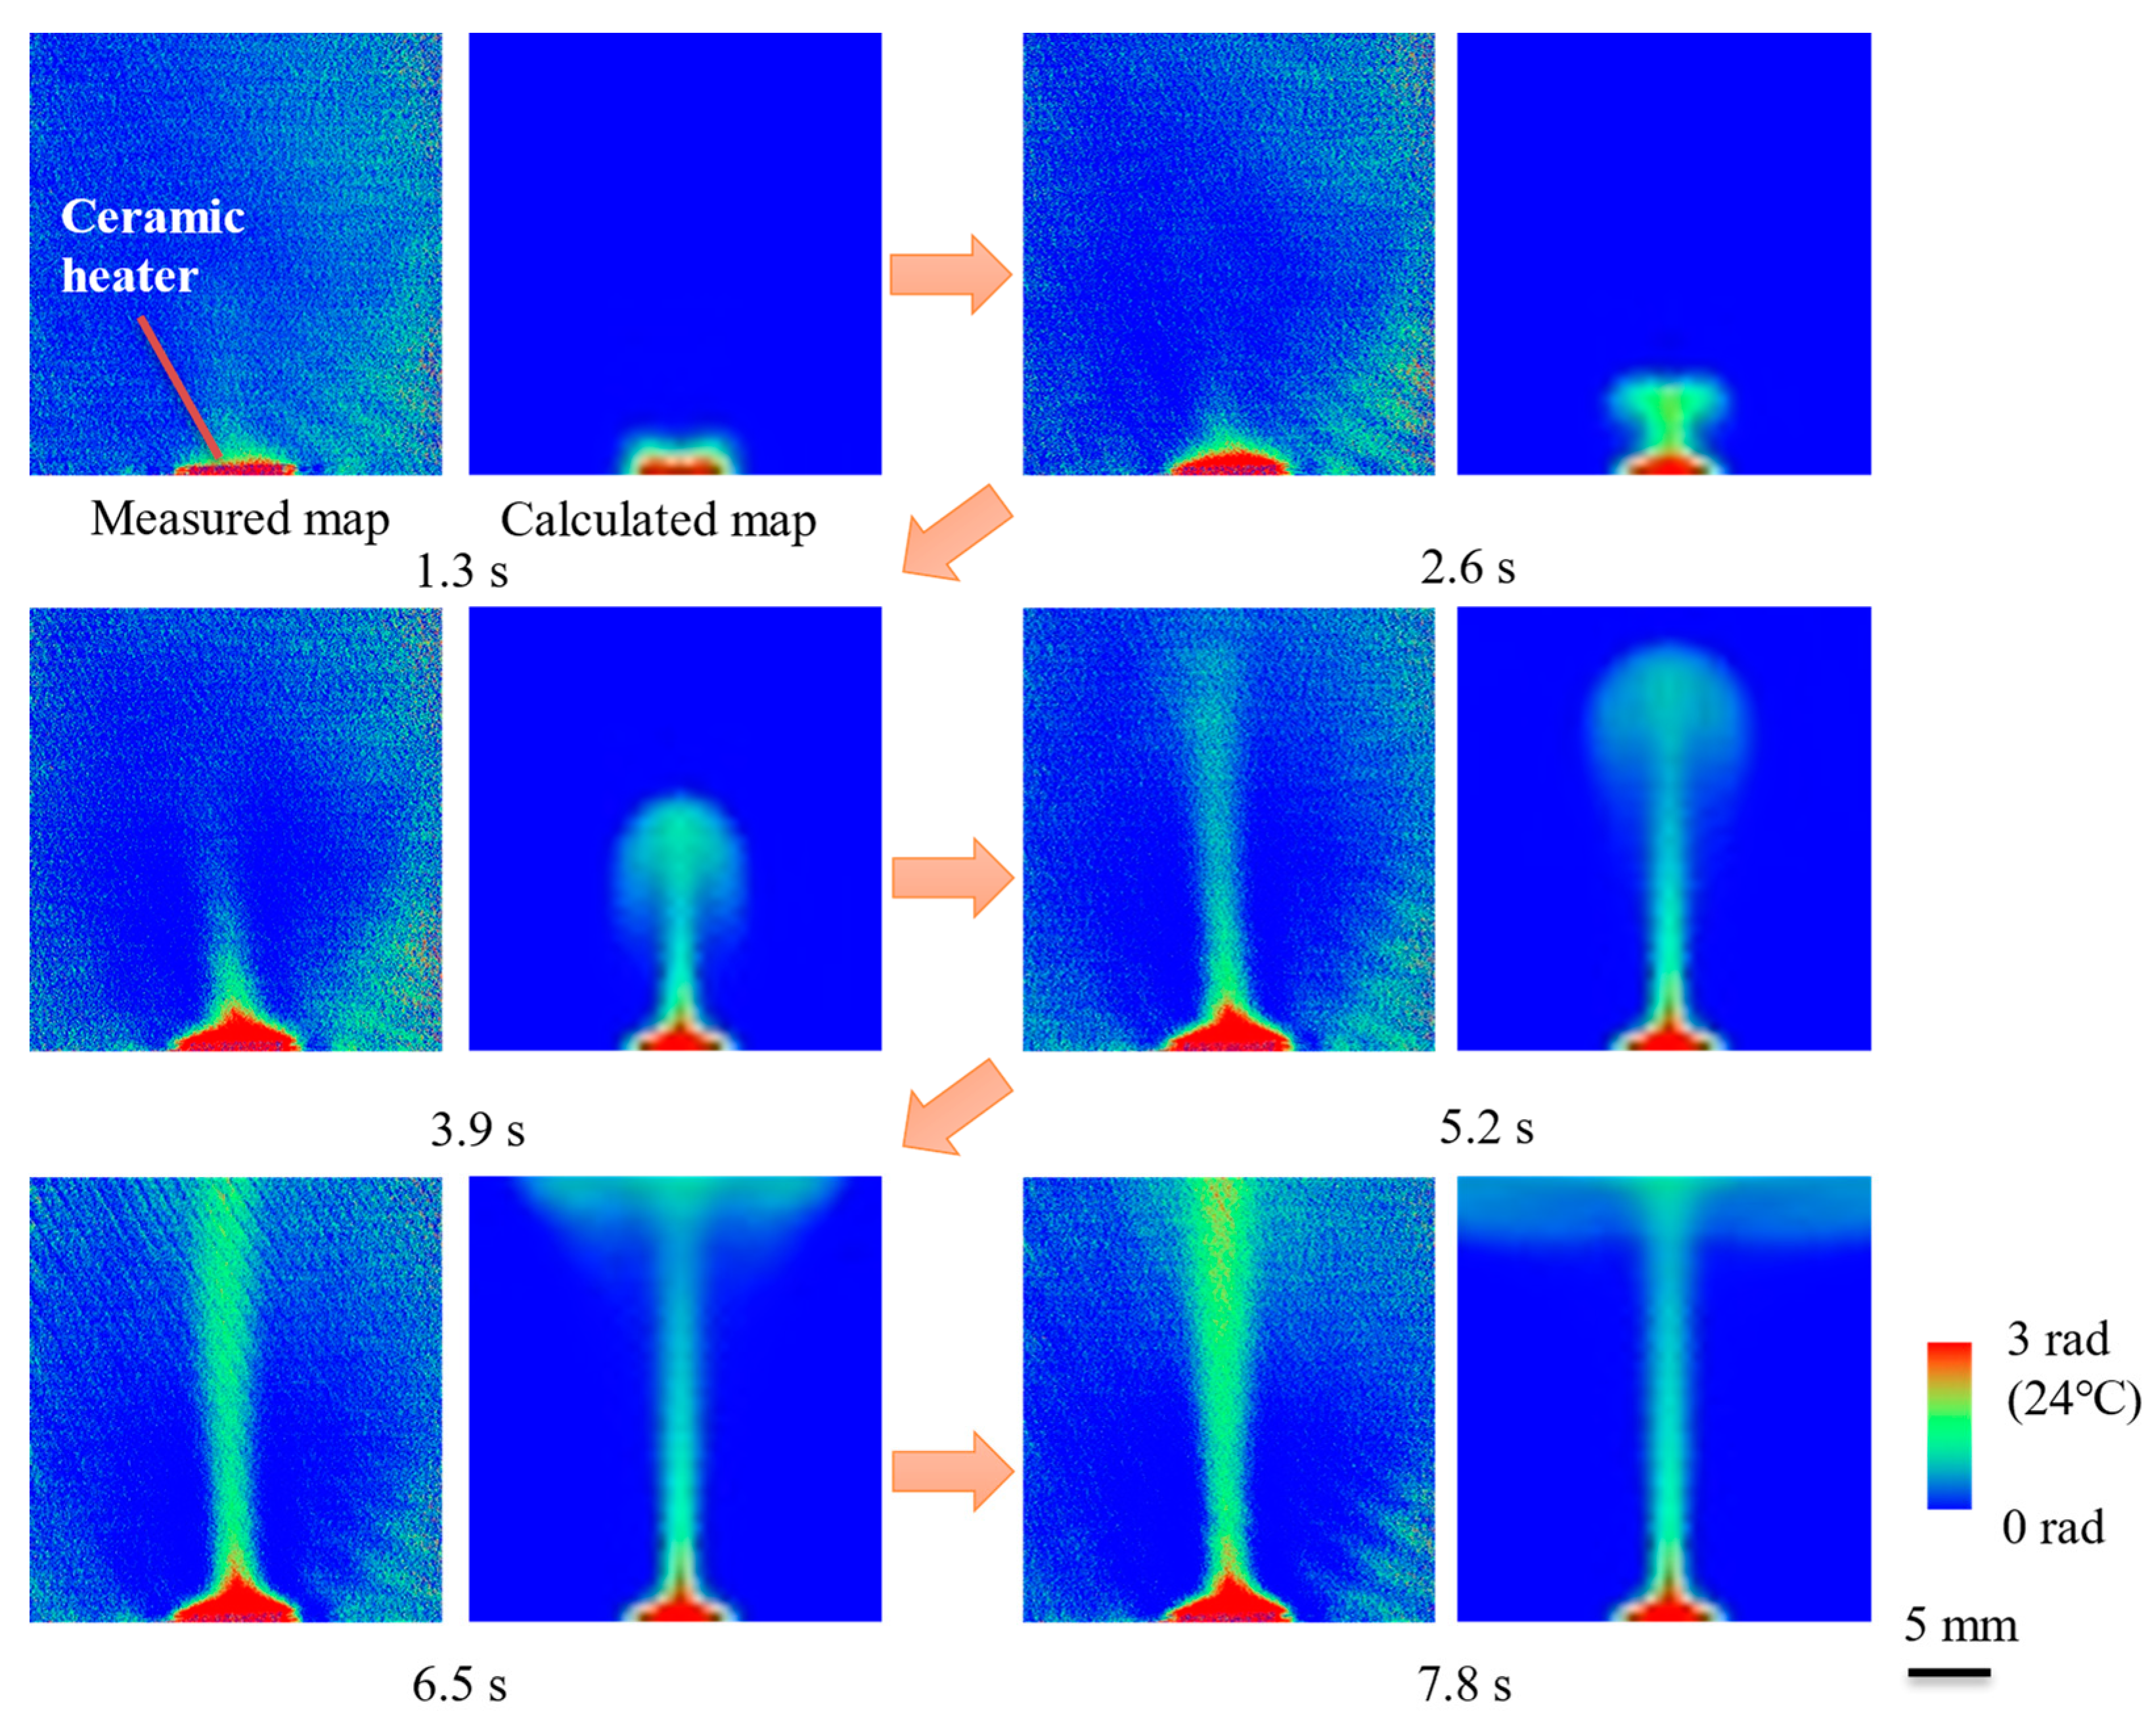
Figure 23 shows time-resolved projection images of thermal flow in heated water and the calculated images obtained using the finite element method under the same conditions [76]. The exposure time was 200 ms, and the fringe scanning method with three steps was used for quantitative phase-shift detection. Therefore, the time resolution (interval between image measurements) was 1.3 s, including the movement of the phase shifter.
The results indicate that the temperature around the heater gradually increased after the heater was turned on (1.3 s) and that the high-temperature region gradually propagated as a band (heating band) to the upper area of the water cell. In the fifth image (3.9–5.2 s) and later images, the high-temperature band that reached the top surface extended horizontally (6.5–7.8 s). The spatial distribution of temperature and the speed of thermal propagation were in good agreement with the calculated images (right), so the water temperature could be accurately detected non-destructively with X-ray thermography with 1.3-s resolution.
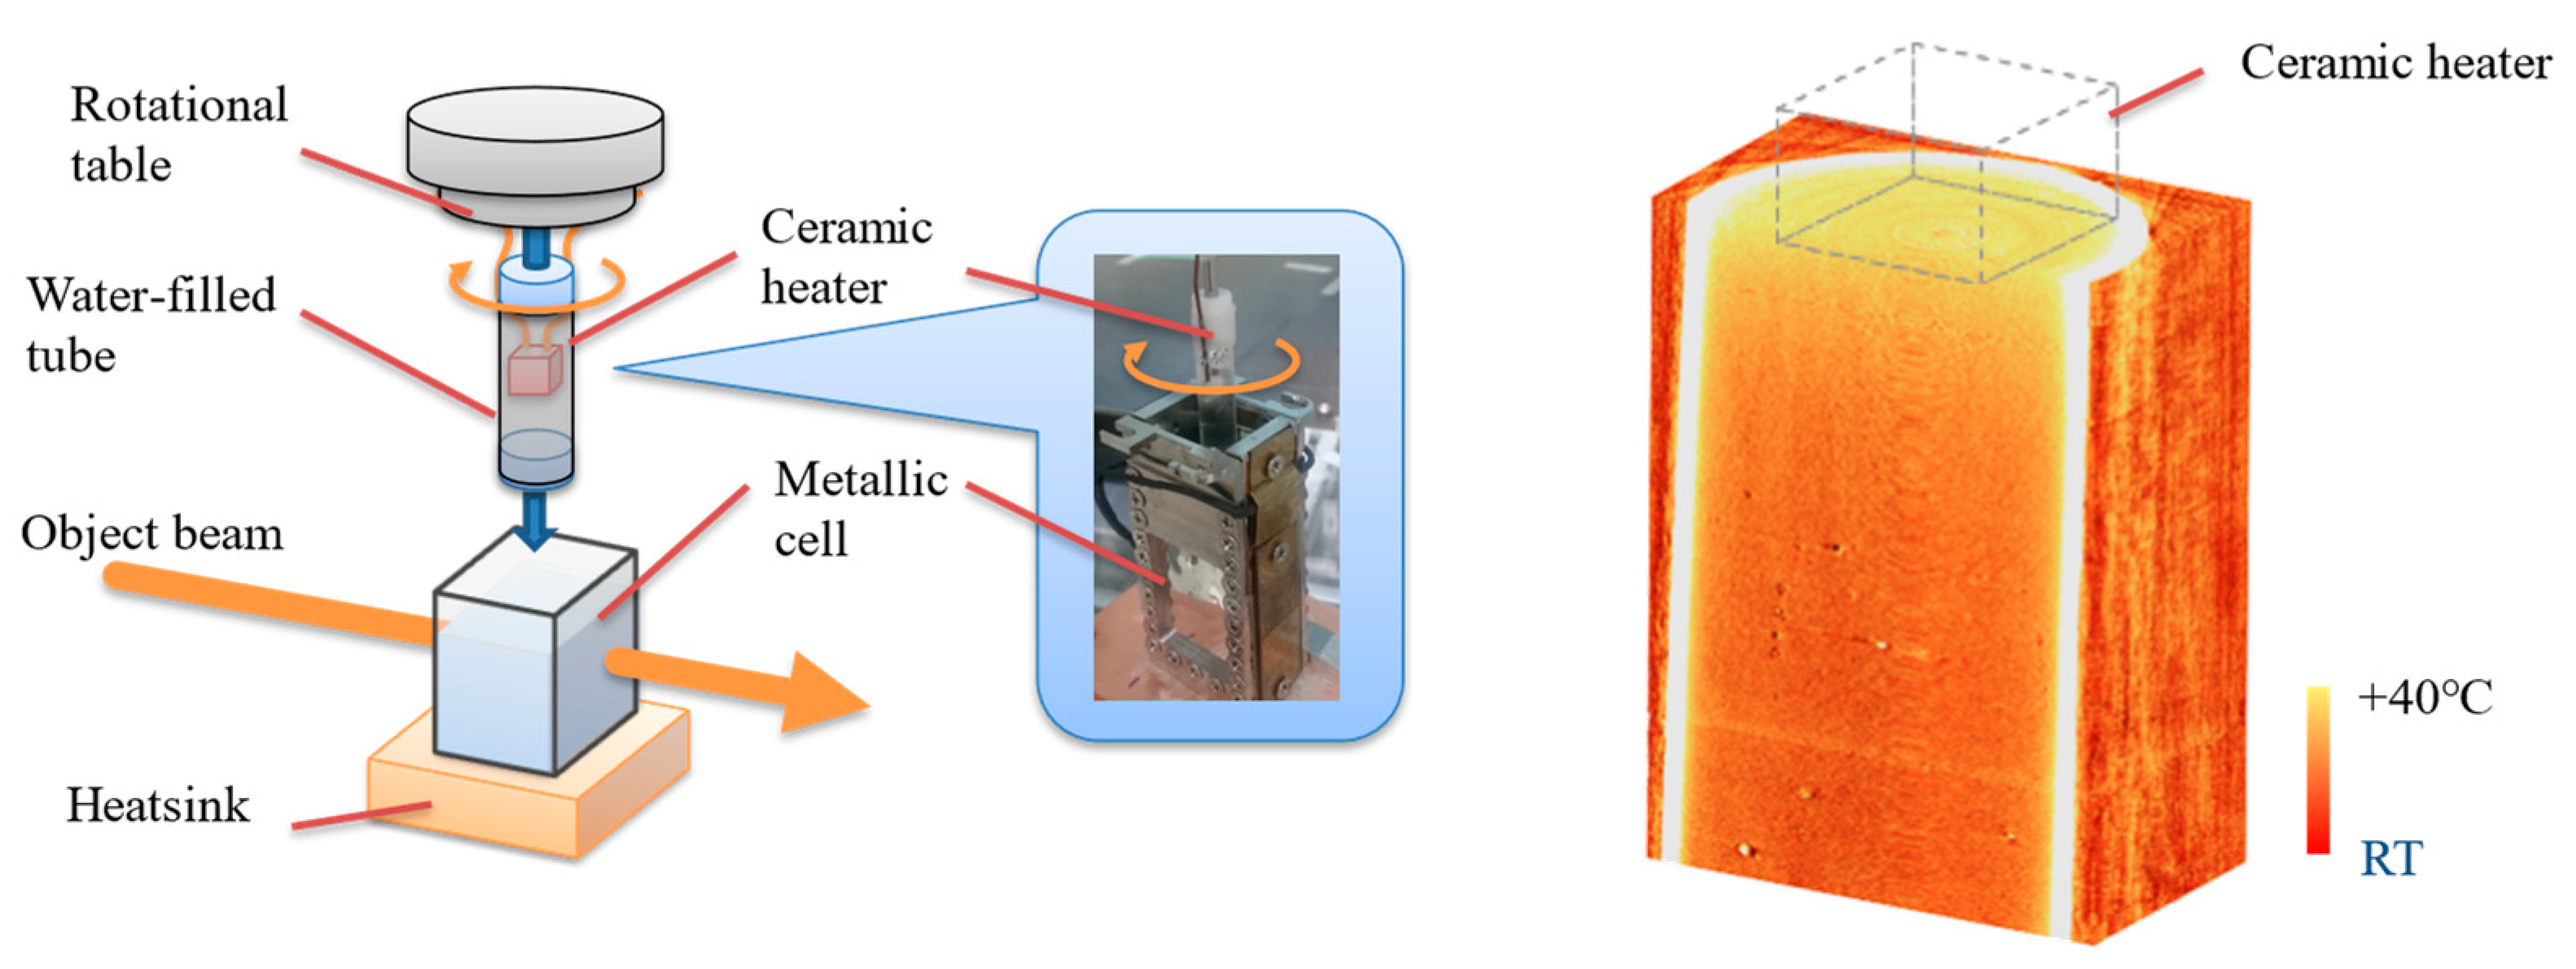
Figure 24 shows a schematic view of a sample cell and the three-dimensional (3D) temperature distribution of water heated using a heater [76]. A polypropylene tube (10-mm diameter) filled with water heated by a ceramic heater attached above the water was used as a demonstration sample. To measure the phase-contrast CT data, the tube was rotated inside an outer metal cell filled with water cooled by a heatsink. The exposure time and fringe scanning number were set to 1 s and 3, respectively. The projection number was 500 for a 180° rotation, and the total measurement time was 1 h and 15 min. The front half of the tube was digitally cut (making it transparent) to reveal the inside of the tube. The results indicate that the water in the upper region near the heater was hotter than that in other areas and that the temperature gradually decreased in accordance with the distance from the heater. Another example application is time-resolved visualization of heat propagation in aluminum plates and biological samples [77]. The results show that X-ray thermography should enable the development of novel ways to visualize thermal distribution and propagation inside objects non-destructively.

11. Conclusions and Future Prospects

CXI is the most sensitive of the PCXI methods and has been used for fine observation in a wide range of fields, from biomedical to industrial. Several technical improvements to the CXI system are currently in progress.
  • Increasing SR energy (to 50 keV or higher) to increase X-ray transparency and thereby enable observation of thick and heavy samples such as biomedical samples, including calcification area, and semiconductor devices.
  • Stabilization of phase detection by improvement of the image feedback system by installing a fast and sensitive X-ray imager to improve the density resolution below 0.1 mg/cm3. Improvement of the spatial resolution below 10 μm by thinning the crystal wafers to suppress the Borman fan effect (broaden X-ray beam in the wafer) [78].
These improvements are expected to lead to extremely fine observations and applications in various fields.
  • Biomedical: quantitative diagnosis based on absolute density changes with aging, disease, and drug administration, functional imaging using novel PCXI contrast agents, and quantitative evaluation of the effectiveness of thermotherapy by three-dimensional X-ray thermography.
  • Embryonic imaging: given that the resolution of optical microscopy in the serial section is a few micrometers, CXI functions as a 3D microscope when the resolution of CXI reaches 10 μm. The whole body of a human embryo can be imaged with CXI, and 3D dynamic analysis of morphological changes during the embryonic stage is possible.
  • Food: observation of the cooking process and evaluation of the relationship between heat and cooking conditions [79]. Quantitative analysis of the relationship between the density and elastic properties and food texture [80]. Evaluation of the freezing process and storage conditions [81].
  • Earth environment: observation of the decomposition process of clathrate hydrate, evaluation of the relationship between crystallinity and density combined with XRD, and three-dimensional observation of phase transitions due to temperature change.
  • Industrial: Operand (in situ) observation of ion distribution in an electrolyte of various types of batteries for the optimization of their operation and charging/discharging conditions. Visualization of the internal temperature of devices such as LEDs and power semiconductor devices for optimal operation.
  • Thermal engineering: visualization of dynamic thermal propagation (phonon propagation) in various materials such as thermoelectric conversion devices and laser ablation using a novel ps time-resolved pumps and probes method combining heating by pulsed laser irradiation and X-ray thermography using an X-ray free-electron laser [82].

Funding

This research received no external funding.

Institutional Review Board Statement

The animal experiments were approved by the Medical Committee for the Use of Animals in Research of the University of Tsukuba and the Animal Care and Use Committee of Kitasato University. They conformed to the guidelines of the American Physiological Society for animal experiments. The imaging and analyses using human embryos were approved by the Ethics Committee of Kyoto University.

Informed Consent Statement

Not applicable.

Data Availability Statement

Data sharing not applicable.

Acknowledgments

We thank T. Takeda of Kitasato University for his useful advice. We are grateful to C. Kamezawa for her technical assistance at the beam line. Some observations were carried out under Proposal Nos. 2009S2-006, 2020G032, 2021G070, 2021G086, 2021G574, 2022G604, and 2022G611, approved by the High Energy Accelerator Research Organization.

Conflicts of Interest

The authors declare no conflict of interest.

References

  1. Momose, A.; Fukuda, J. Phase-contrast radiographs of nonstained rat cerebellar specimen. Med. Phys. 1995, 22, 375–379. [Google Scholar] [CrossRef]
  2. Bonse, U.; Hart, M. An X-ray Interferometer. Appl. Phys. Lett. 1965, 6, 155–156. [Google Scholar] [CrossRef]
  3. Momose, A. Demonstration of phase-contrast X-ray computed tomography using an X-ray interferometer. Nucl. Instrum. Methods Phys. Res. Sect. A 1995, 352, 622–628. [Google Scholar] [CrossRef]
  4. Davis, T.J.; Gao, D.; Gureyev, T.E.; Stevenson, A.W.; Wilkins, S.W. Phase-contrast imaging of weakly absorbing materials using hard X-rays. Nature 1995, 373, 595–598. [Google Scholar] [CrossRef]
  5. Momose, A.; Kawamoto, S.; Koyama, I.; Hamaishi, Y.; Takai, K.; Suzuki, Y. Demonstration of X-ray Talbot Interferometry. Jpn. J. Appl. Phys. 2003, 42, L866–L868. [Google Scholar] [CrossRef]
  6. Snigirev, A.; Snigireva, I.; Kohn, V.; Kuznetsov, S.; Schelokov, I. On the possibilities high-energy synchrotron of X-ray phase contrast microimaging radiation. Rev. Sci. Instrum. 1995, 66, 5486–5492. [Google Scholar] [CrossRef]
  7. Yoneyama, A.; Baba, R.; Lwin, T.T.; Kawamoto, M. Four-type phase-contrast X-ray imaging at SAGA Light Source. J. Phys. Conf. Ser. 2020, 2380, 012117. [Google Scholar] [CrossRef]
  8. Yoneyama, A.; Baba, R.; Hyodo, K.; Takeda, T. Quantitative comparison of performance of absorption, Talbot interferometric, and crystal X-ray interferometric imaging. In Proceedings of the European Congress of Radiology 2015, Vienna, Austria, 4–8 March 2015. [Google Scholar]
  9. Yoneyama, A.; Wu, J.; Hyodo, K.; Takeda, T. Quantitative comparison of imaging performance of X-ray interferometric imaging and diffraction enhanced imaging. Med. Phys. 2008, 35, 4724–4734. [Google Scholar] [CrossRef] [Green Version]
  10. Momose, A. X-ray phase imaging reaching clinical uses. Phys. Med. 2020, 79, 93–102. [Google Scholar] [CrossRef]
  11. Momose, A.; Yashiro, W.; Maikusa, H.; Takeda, Y. High-speed X-ray phase imaging and X-ray phase tomography with Talbot interferometer and white synchrotron radiation. Opt. Express 2009, 17, 12540–12545. [Google Scholar] [CrossRef] [PubMed]
  12. Yashiro, W.; Kamezawa, C.; Noda, D.; Kajiwara, K. Millisecond-order X-ray phase tomography with a fringe-scanning method. Appl. Phys. Express 2018, 11, 122501. [Google Scholar] [CrossRef]
  13. Vegso, K.; Wu, Y.; Takano, H.; Hoshino, M.; Momose, A. Development of pink-beam 4D phase CT for in-situ observation of polymers under infrared laser irradiation. Sci. Rep. 2019, 9, 7404. [Google Scholar] [CrossRef] [PubMed] [Green Version]
  14. Hagen, C.K.; Diemoz, P.C.; Endrizzi, M.; Rigon, L.; Dreossi, D.; Arfelli, F.; Lopez, F.C.; Longo, R.; Olivo, A. Theory and preliminary experimental verification of quantitative edge illumination X-ray phase contrast tomography. Opt. Express 2014, 22, 7989–8000. [Google Scholar] [CrossRef]
  15. Bonse, U.; Hart, M. An X-ray interferometer with Bragg case beam splitting and beam recombination. Z. Phys. 1966, 194, 1–17. [Google Scholar] [CrossRef]
  16. Koyama, I.; Yoshikawa, H.; Momose, A. Phase-Contrast X-ray Imaging with a Triple-Bragg-Case Interferometer. Jpn. J. Appl. Phys. 2003, 42, L80–L82. [Google Scholar] [CrossRef]
  17. Bonse, U.; Hart, M. Combined Laue–Bragg-case X-ray interferometers. Acta Crystallogr. Sect. A 1968, 24, 240–245. [Google Scholar] [CrossRef]
  18. Fezzaa, K.; Lee, W.K. An X-ray interferometer with a large and variable path length difference. J. Appl. Crystallogr. 2001, 34, 166–171. [Google Scholar] [CrossRef] [Green Version]
  19. Yoneyama, A.; Momose, A.; Koyama, I. Feasibility Test of a Nonplanar Three-Beam Case X-ray Interferometer for High-Resolution Phase-Contrast X-ray Imaging. Jpn. J. Appl. Phys. 2002, 41, L161–L163. [Google Scholar] [CrossRef]
  20. Becker, P.; Bonse, U. The skew-symmetric two-crystal X-ray interferometer. J. Appl. Crystallogr. 1974, 7, 593–598. [Google Scholar] [CrossRef]
  21. Takeda, M.; Ina, H.; Kobayashi, S. Fourier-transform method of fringe-pattern analysis for computer-based topography and interferometry. J. Opt. Soc. Am. 1982, 72, 156. [Google Scholar] [CrossRef]
  22. Bruning, J.H.; Herriott, D.R.; Gallagher, J.E.; Rosenfeld, D.P.; White, A.D.; Brangaccio, D.J. Digital Wavefront Measuring Interferometer for Testing Optical Surfaces and Lenses. Appl. Opt. 1974, 13, 2693–2703. [Google Scholar] [CrossRef] [PubMed]
  23. Yashiro, W.; Terui, Y.; Kawabata, K.; Momose, A. On the origin of visibility contrast in X-ray Talbot interferometry. Opt. Express 2010, 18, 16890–16901. [Google Scholar] [CrossRef] [PubMed]
  24. Momose, A.; Takeda, T.; Itai, Y.; Hirano, K. Phase-contrast X-ray computed tomography for observing biological soft tissues. Nat. Med. 1996, 2, 473–475. [Google Scholar] [CrossRef]
  25. Takeda, T.; Momose, A.; Ueno, E.; Itai, Y. Phase-contrast X-ray CT image of breast tumor. J. Synchrotron Radiat. 1998, 5, 1133–1135. [Google Scholar] [CrossRef]
  26. Yoneyama, A.; Takeya, S.; Lwin, T.T.; Takamatsu, D.; Baba, R.; Konishi, K.; Fujita, R.; Kobayashi, K.; Shima, A.; Kawamoto, M.; et al. Advanced X-ray imaging at beamline 07 of the SAGA Light Source. J. Synchrotron Radiat. 2021, 28, 1966–1977. [Google Scholar] [CrossRef] [PubMed]
  27. Bonse, U.; Te Kaat, E. A two-crystal X-ray interferometer. Z. Phys. A Hadron. Nucl. 1968, 214, 16–21. [Google Scholar] [CrossRef]
  28. Momose, A.; Yoneyama, A.; Hirano, K. Operation of a Two-Crystal X-ray Interferometer at the Photon Factory. J. Synchrotron Radiat. 1997, 4, 311–312. [Google Scholar] [CrossRef]
  29. Yoneyama, A.; Takeda, T.; Tsuchiya, Y.; Wu, J.; Thet Thet, L.; Koizumi, A.; Hyodo, K.; Itai, Y. A phase-contrast X-ray imaging system—With a 60 × 30 mm field of view—Based on a skew-symmetric two-crystal X-ray interferometer. Nucl. Instrum. Methods Phys. Res. Sect. A Accel. Spectrometers Detect. Assoc. Equip. 2004, 523, 217–222. [Google Scholar] [CrossRef]
  30. Yoneyama, A.; Takeda, T.; Wu, J.; Lwin, T.T.; Hyodo, K.; Hirai, Y. 60 × 40-mm X-ray Interference Pattern Generated by Two-Crystal X-ray Interferometer. PF Activity Report 2004. 2005, Volume 262. Available online: http://pfwww.kek.jp/acr2004pdf/part_b/pf04b262.pdf (accessed on 1 April 2023).
  31. Yoneyama, A.; Takeda, T.; Tsuchiya, Y.; Wu, J.; Lwin, T.T.; Hyodo, K.; Hirai, Y. High-energy phase-contrast X-ray imaging using a two-crystal X-ray interferometer. J. Synchrotron Radiat. 2005, 12, 534–536. [Google Scholar] [CrossRef]
  32. Yoneyama, A.; Nambu, A.; Ueda, K.; Yamada, S.; Takeya, S.; Hyodo, K.; Takeda, T. Phase-contrast X-ray imaging system with sub-mg/cm3 density resolution. J. Phys. Conf. Ser. 2013, 425, 192007. [Google Scholar] [CrossRef]
  33. Yoneyama, A.; Momose, A.; Seya, E.; Hirano, K.; Takeda, T.; Itai, Y. Operation of a separated-type X-ray interferometer for phase-contrast X-ray imaging. Rev. Sci. Instrum. 1999, 70, 4582. [Google Scholar] [CrossRef]
  34. Yoneyama, A.; Momose, A.; Koyama, I.; Seya, E.; Takeda, T.; Itai, Y.; Hirano, K.; Hyodo, K. Large-area phase-contrast X-ray imaging using a two-crystal X-ray interferometer. J. Synchrotron Radiat. 2002, 8, 277. [Google Scholar] [CrossRef] [PubMed] [Green Version]
  35. Jud, C.; Schaff, F.; Zanette, I.; Wolf, J.; Fehringer, A.; Pfeiffer, F. Dentinal tubules revealed with X-ray tensor tomography. Dent. Mater. 2016, 32, 1189–1195. [Google Scholar] [CrossRef]
  36. Takeda, T.; Momose, A.; Hirano, K.; Haraoka, S.; Watanabe, T.; Ita, Y. Human Carcinoma: Early Experience with PhaseContrast X-ray CT with Synchrotron Radiation— Comparative Specimen Study with Optical Microscopy. Radiology 2000, 214, 298. [Google Scholar] [CrossRef]
  37. Stampanoni, M.; Groso, A.; Isenegger, A.; Mikuljan, G.; Chen, Q.; Bertrand, A.; Henein, S.; Betemps, R.; Frommherz, U.; Böhler, P.; et al. Trends in synchrotron-based tomographic imaging: The SLS experience. SPIE 2006, 6318, 193–206. [Google Scholar]
  38. Pfeiffer, F.; Weitkamp, T.; Bunk, O.; David, C. Phase retrieval and differential phase-contrast imaging with low-brilliance X-ray sources. Nat. Phys. 2006, 2, 258–261. [Google Scholar] [CrossRef] [Green Version]
  39. Takeda, T.; Wu, J.; Lwin, T.T.; Yoneyama, A.; Hyodo, K.; Matsuda, Y.; Kose, K. Interferometer-based phase-contrast X-ray computed tomography of colon cancer specimens: Comparative study with 4.74-T magnetic resonance imaging and optical microscopy. J. Comput. Assist. Tomogr. 2007, 31, 214–217. [Google Scholar] [CrossRef]
  40. Lwin, T.-T.; Yoneyama, A.; Hara, A.; Ohbu, M.; Maruyama, H.; Taguchi, M.; Esashi, S.; Matsushima, T.; Terazaki, K.; Hyodo, K.; et al. Spontaneous brain tumor imaging of aged rat by crystal X-ray interferometer-based phase-contrast X-ray CT. Acta Radiol. Open 2016, 5, 205846011562695. [Google Scholar] [CrossRef] [Green Version]
  41. Thet Thet, L.; Yoneyama, A.; Imai, M.; Maruyama, H.; Hyodo, K.; Takeda, T. Testicular seminoma in the aged rat visualized by phase-contrast X-ray computed tomography. Acta Radiol. Open 2018, 7, 205846011880665. [Google Scholar] [CrossRef] [Green Version]
  42. Lwin, T.T.; Yoneyama, A.; Maruyama, H.; Takeda, T. Visualization Ability of Phase-Contrast Synchrotron-Based X-ray Imaging Using an X-ray Interferometer in Soft Tissue Tumors. Technol. Cancer Res. Treat. 2021, 20, 15330338211010121. [Google Scholar] [CrossRef]
  43. Takeda, T.; Momose, A.; Wu, J.; Yu, Q.; Zeniya, T.; Lwin, T.-T.; Yoneyama, A.; Itai, Y. Vessel Imaging by Interferometric Phase-Contrast X-ray Technique. Circulation 2002, 105, 1708–1712. [Google Scholar] [CrossRef]
  44. Wu, J.; Takeda, T.; Lwin, T.T.; Momose, A.; Sunaguchi, N.; Fukami, T.; Yuasa, T.; Akatsuka, T. Imaging renal structures by X-ray phase-contrast microtomography. Kidney Int. 2009, 75, 945–951. [Google Scholar] [CrossRef] [Green Version]
  45. Esashi, S.; Yoneyama, A.; Thet-Thet-Lwin; Matsushima, T.; Maruyama, H.; Hyodo, K.; Takeda, T. Fine inner imaging of rat’s spleen by phase-contrast X-ray CT. Med. Imaging Technol. 2014, 32, 338–341. [Google Scholar] [CrossRef]
  46. Noda-Saita, K.; Yoneyama, A.; Shitaka, Y.; Hirai, Y.; Terai, K.; Wu, J.; Takeda, T.; Hyodo, K.; Osakabe, N.; Yamaguchi, T.; et al. Quantitative analysis of amyloid plaques in a mouse model of Alzheimer’s disease by phase-contrast X-ray computed tomography. Neuroscience 2006, 138, 1205–1213. [Google Scholar] [CrossRef]
  47. Takeda, T.; Yoneyama, A.; Wu, J.; Lwin, T.T.; Tsuchiya, Y.; Hyodo, K. In-Vivo Imaging of Cancer Implanted in Nude Mice by Two-Crystal Interferometer-Based Phase-Contrast X-ray Computed Tomography. Jpn. J. Appl. Phys. 2004, 43, L1144–L1146. [Google Scholar] [CrossRef]
  48. Yoneyama, A.; Amino, N.; Mori, M.; Kudoh, M.; Takeda, T.; Hyodo, K.; Hirai, Y. Non-invasive and Time-Resolved Observation of Tumors Implanted in Living Mice by Using Phase-Contrast X-ray Computed Tomography. Jpn. J. Appl. Phys. 2006, 45, 1864–1868. [Google Scholar] [CrossRef]
  49. Yamaguchi, Y.; Yamada, S. The Kyoto Collection of Human Embryos and Fetuses: History and Recent Advancements in Modern Methods. Cells Tissues Organs 2018, 205, 314–319. [Google Scholar] [CrossRef] [PubMed]
  50. Nohara, A.; Owaki, N.; Matsubayashi, J.; Katsube, M.; Imai, H.; Yoneyama, A.; Yamada, S.; Kanahashi, T.; Takakuwa, T. Morphometric analysis of secondary palate development in human embryos. J. Anat. 2022, 241, 1287–1302. [Google Scholar] [CrossRef] [PubMed]
  51. Osaka, M.; Ishikawa, A.; Yamada, S.; Uwabe, C.; Imai, H.; Matsuda, T.; Yoneyama, A.; Takeda, T.; Takakuwa, T. Positional Changes of the Ocular Organs During Craniofacial Development. Anat. Rec. 2017, 300, 2107–2114. [Google Scholar] [CrossRef] [Green Version]
  52. Toyoda, S.; Shiraki, N.; Yamada, S.; Uwabe, C.; Imai, H.; Matsuda, T.; Yoneyama, A.; Takeda, T.; Takakuwa, T. Morphogenesis of the Inner Ear at Different Stages of Normal Human Development. Anat. Rec. 2015, 298, 2081–2090. [Google Scholar] [CrossRef] [Green Version]
  53. Suzuki, Y.; Matsubayashi, J.; Ji, X.; Yamada, S.; Yoneyama, A.; Imai, H.; Matsuda, T.; Aoyama, T.; Takakuwa, T. Morphogenesis of the femur at different stages of normal human development. PLoS ONE 2019, 14, e0221569. [Google Scholar] [CrossRef] [PubMed] [Green Version]
  54. Fujii, S.; Muranaka, T.; Matsubayashi, J.; Yamada, S.; Yoneyama, A.; Takakuwa, T. Bronchial tree of the human embryo: Categorization of the branching mode as monopodial and dipodial. PLoS ONE 2021, 16, e0245558. [Google Scholar] [CrossRef] [PubMed]
  55. Okuno, K.; Ishizu, K.; Matsubayashi, J.; Fujii, S.; Sakamoto, R.; Ishikawa, A.; Yamada, S.; Yoneyama, A.; Takakuwa, T. Rib Cage Morphogenesis in the Human Embryo: A Detailed Three-Dimensional Analysis. Anat. Rec. 2019, 302, 2211–2223. [Google Scholar] [CrossRef] [PubMed]
  56. Kanahashi, T.; Yamada, S.; Tanaka, M.; Hirose, A.; Uwabe, C.; Kose, K.; Yoneyama, A.; Takeda, T.; Takakuwa, T. A Novel Strategy to Reveal the Latent Abnormalities in Human Embryonic Stages from a Large Embryo Collection. Anat. Rec. 2016, 299, 8–24. [Google Scholar] [CrossRef] [PubMed] [Green Version]
  57. Takeya, S.; Honda, K.; Gotoh, Y.; Yoneyama, A.; Ueda, K.; Miyamoto, A.; Hondoh, T.; Hori, A.; Sun, D.; Ohmura, R.; et al. Diffraction-enhanced X-ray imaging under low-temperature conditions: Non-destructive observations of clathrate gas hydrates. J. Synchrotron Radiat. 2012, 19, 1038–1042. [Google Scholar] [CrossRef] [PubMed]
  58. Hassanpouryouzband, A.; Joonaki, E.; Vasheghani Farahani, M.; Takeya, S.; Ruppel, C.; Yang, J.; English, N.J.; Schicks, J.M.; Edlmann, K.; Mehrabian, H.; et al. Gas hydrates in sustainable chemistry. Chem. Soc. Rev. 2020, 49, 5225–5309. [Google Scholar] [CrossRef]
  59. Bender, M.; Sowers, T.; Brook, E. Gases in ice cores. Proc. Natl. Acad. Sci. 1997, 94, 8343–8349. [Google Scholar] [CrossRef] [Green Version]
  60. Takeya, S.; Nagaya, H.; Matsuyama, T.; Hondoh, T.; Lipenkov, V.Y. Lattice Constants and Thermal Expansion Coefficient of Air Clathrate Hydrate in Deep Ice Cores from Vostok, Antarctica. J. Phys. Chem. B 2000, 104, 668–670. [Google Scholar] [CrossRef]
  61. Takeya, S.; Honda, K.; Yoneyama, A.; Hirai, Y.; Okuyama, J.; Hondoh, T.; Hyodo, K.; Takeda, T. Observation of low-temperature object by phase-contrast X-ray imaging: Nondestructive imaging of air clathrate hydrates at 233K. Rev. Sci. Instrum. 2006, 77, 053705. [Google Scholar] [CrossRef] [Green Version]
  62. Takeya, S.; Honda, K.; Kawamura, T.; Yamamoto, Y.; Yoneyama, A.; Hirai, Y.; Hyodo, K.; Takeda, T. Imaging and density mapping of tetrahydrofuran clathrate hydrates by phase-contrast X-ray computed tomography. Appl. Phys. Lett. 2007, 90, 081920. [Google Scholar] [CrossRef]
  63. Takeya, S.; Gotoh, Y.; Yoneyama, A.; Hyodo, K.; Takeda, T. Observation of the growth process of icy materials in interparticle spaces: Phase-contrast X-ray imaging of clathrate hydrate. Can. J. Chem. 2015, 93, 983–987. [Google Scholar] [CrossRef]
  64. Takeya, S.; Muromachi, S.; Yoneyama, A. X-ray Imaging of Clathrate Hydrates as Gas Storage Materials: Absorption Contrast of Low-Density and Low-Absorption Materials Using Energy-Dependent X-ray Computed Tomography. Energy Fuels 2022, 36, 10659–10666. [Google Scholar] [CrossRef]
  65. Takeya, S.; Yoneyama, A.; Ueda, K.; Hyodo, K.; Takeda, T.; Mimachi, H.; Takahashi, M.; Iwasaki, T.; Sano, K.; Yamawaki, H.; et al. Nondestructive Imaging of Anomalously Preserved Methane Clathrate Hydrate by Phase Contrast X-ray Imaging. J. Phys. Chem. C 2011, 115, 16193–16199. [Google Scholar] [CrossRef]
  66. Takeya, S.; Yoneyama, A.; Ueda, K.; Mimachi, H.; Takahashi, M.; Sano, K.; Hyodo, K.; Takeda, T.; Gotoh, Y. Anomalously Preserved Clathrate Hydrate of Natural Gas in Pellet Form at 253 K. J. Phys. Chem. C 2012, 116, 13842–13848. [Google Scholar] [CrossRef]
  67. Mo, J.; Guo, E.; McCartney, D.G.; Eastwood, D.S.; Bent, J.; Van Dalen, G.; Schuetz, P.; Rockett, P.; Lee, P.D. Time-Resolved Tomographic Quantification of the Microstructural Evolution of Ice Cream. Materials 2018, 11, 2031. [Google Scholar] [CrossRef] [Green Version]
  68. Takeichi, Y.; Inami, N.; Suga, H.; Miyamoto, C.; Ueno, T.; Mase, K.; Takahashi, Y.; Ono, K. Design and performance of a compact scanning transmission X-ray microscope at the Photon Factory. Rev. Sci. Instrum. 2016, 87, 013704. [Google Scholar] [CrossRef]
  69. Chang, H.J.; Ilott, A.J.; Trease, N.M.; Mohammadi, M.; Jerschow, A.; Grey, C.P. Correlating Microstructural Lithium Metal Growth with Electrolyte Salt Depletion in Lithium Batteries Using 7Li MRI. J. Am. Chem. Soc. 2015, 137, 15209–15216. [Google Scholar] [CrossRef]
  70. Takamatsu, D.; Yoneyama, A.; Yabuuchi, S.; Hayakawa, J.; Hirano, T. Quantitative visualization of ion and thermal distributions in electrolytes during operation of electrochemical devices by Operando phase-contrast X-ray imaging. J. Mater. Res. 2022, 37, 1576–1590. [Google Scholar] [CrossRef]
  71. Takamatsu, D.; Yoneyama, A.; Asari, Y.; Hirano, T. Quantitative Visualization of Salt Concentration Distributions in Lithium-Ion Battery Electrolytes during Battery Operation Using X-ray Phase Imaging. J. Am. Chem. Soc. 2018, 140, 1608–1611. [Google Scholar] [CrossRef]
  72. Takamatsu, D.; Hirano, T.; Yoneyama, A.; Kimura, T.; Harada, M.; Terada, M.; Okoshi, T. In operando visualization of electrolyte stratification dynamics in lead-acid battery using phase-contrast X-ray imaging. Chem. Commun. 2020, 56, 9553–9556. [Google Scholar] [CrossRef]
  73. Yoneyama, A.; Takeda, T.; Tsuchiya, Y.; Wu, J.; Lwin, T.-T.; Hyodo, K. Coherence-contrast X-ray imaging based on X-ray interferometry. Appl. Opt. 2006, 44, 3258. [Google Scholar] [CrossRef] [PubMed]
  74. Yoneyama, A.; Hyodo, K.; Takeda, T. Feasibility test of Zeff imaging using X-ray interferometry. Appl. Phys. Lett. 2013, 103, 204108. [Google Scholar] [CrossRef]
  75. Yoneyama, A. Phase-contrast X-ray Imaging and Its Applications. In Advances in X-ray Chemical Analysis; The Japan Society for Analytical Chemistry: Tokyo, Japan, 2018; Volume 49. [Google Scholar]
  76. Yoneyama, A.; Iizuka, A.; Fujii, T.; Hyodo, K.; Hayakawa, J. Three-dimensional X-ray thermography using phase-contrast imaging. Sci. Rep. 2018, 8, 12674. [Google Scholar] [CrossRef] [PubMed] [Green Version]
  77. Yoneyama, A.; Baba, R.; Hyodo, K. Visualization of thermal flow inside a biomedical sample using novel X-ray thermography. In Proceedings of the ECR 2020, Vienna, Austria, 11–15 March 2020. [Google Scholar] [CrossRef]
  78. Hirano, K.; Momose, A. Development of an X-ray Interferometer for High-Resolution Phase-Contrast X-ray Imaging. Jpn. J. Appl. Phys. 1999, 38, L1556. [Google Scholar] [CrossRef] [Green Version]
  79. Miki, H.; Yoneyama, A.; Hirano, K. Visualizing morphological structures of rice grains in precooked products using synchrotron radiation X-ray phase-contrast computed tomography. Food Funct. 2023, 14, 87–93. [Google Scholar] [CrossRef]
  80. Kamezawa, C.; Numano, T.; Kawabata, Y.; Kanetaka, H.; Furuya, M.; Yokota, K.; Kato, H.; Yoneyama, A.; Hyodo, K.; Yashiro, W. X-ray elastography by visualizing propagating shear waves. Appl. Phys. Express 2020, 13, 042004. [Google Scholar] [CrossRef]
  81. Takeya, S.; Nakano, K.; Thammawong, M.; Umeda, H.; Yoneyama, A.; Takeda, T.; Hyodo, K.; Matsuo, S. CO2 processing and hydration of fruit and vegetable tissues by clathrate hydrate formation. Food Chem. 2016, 205, 122–128. [Google Scholar] [CrossRef]
  82. Yoneyama, A.; Baba, R.; Takamatsu, D.; Kamezawa, C.; Inoue, I.; Osaka, T.; Owada, S.; Yabashi, M. Feasibility study of interferometric phase-contrast X-ray imaging using the hard-X-ray free-electron laser of the SPring-8 Angstrom Compact Free-Electron Laser. J. Synchrotron Radiat. 2020, 27, 1358–1361. [Google Scholar] [CrossRef]
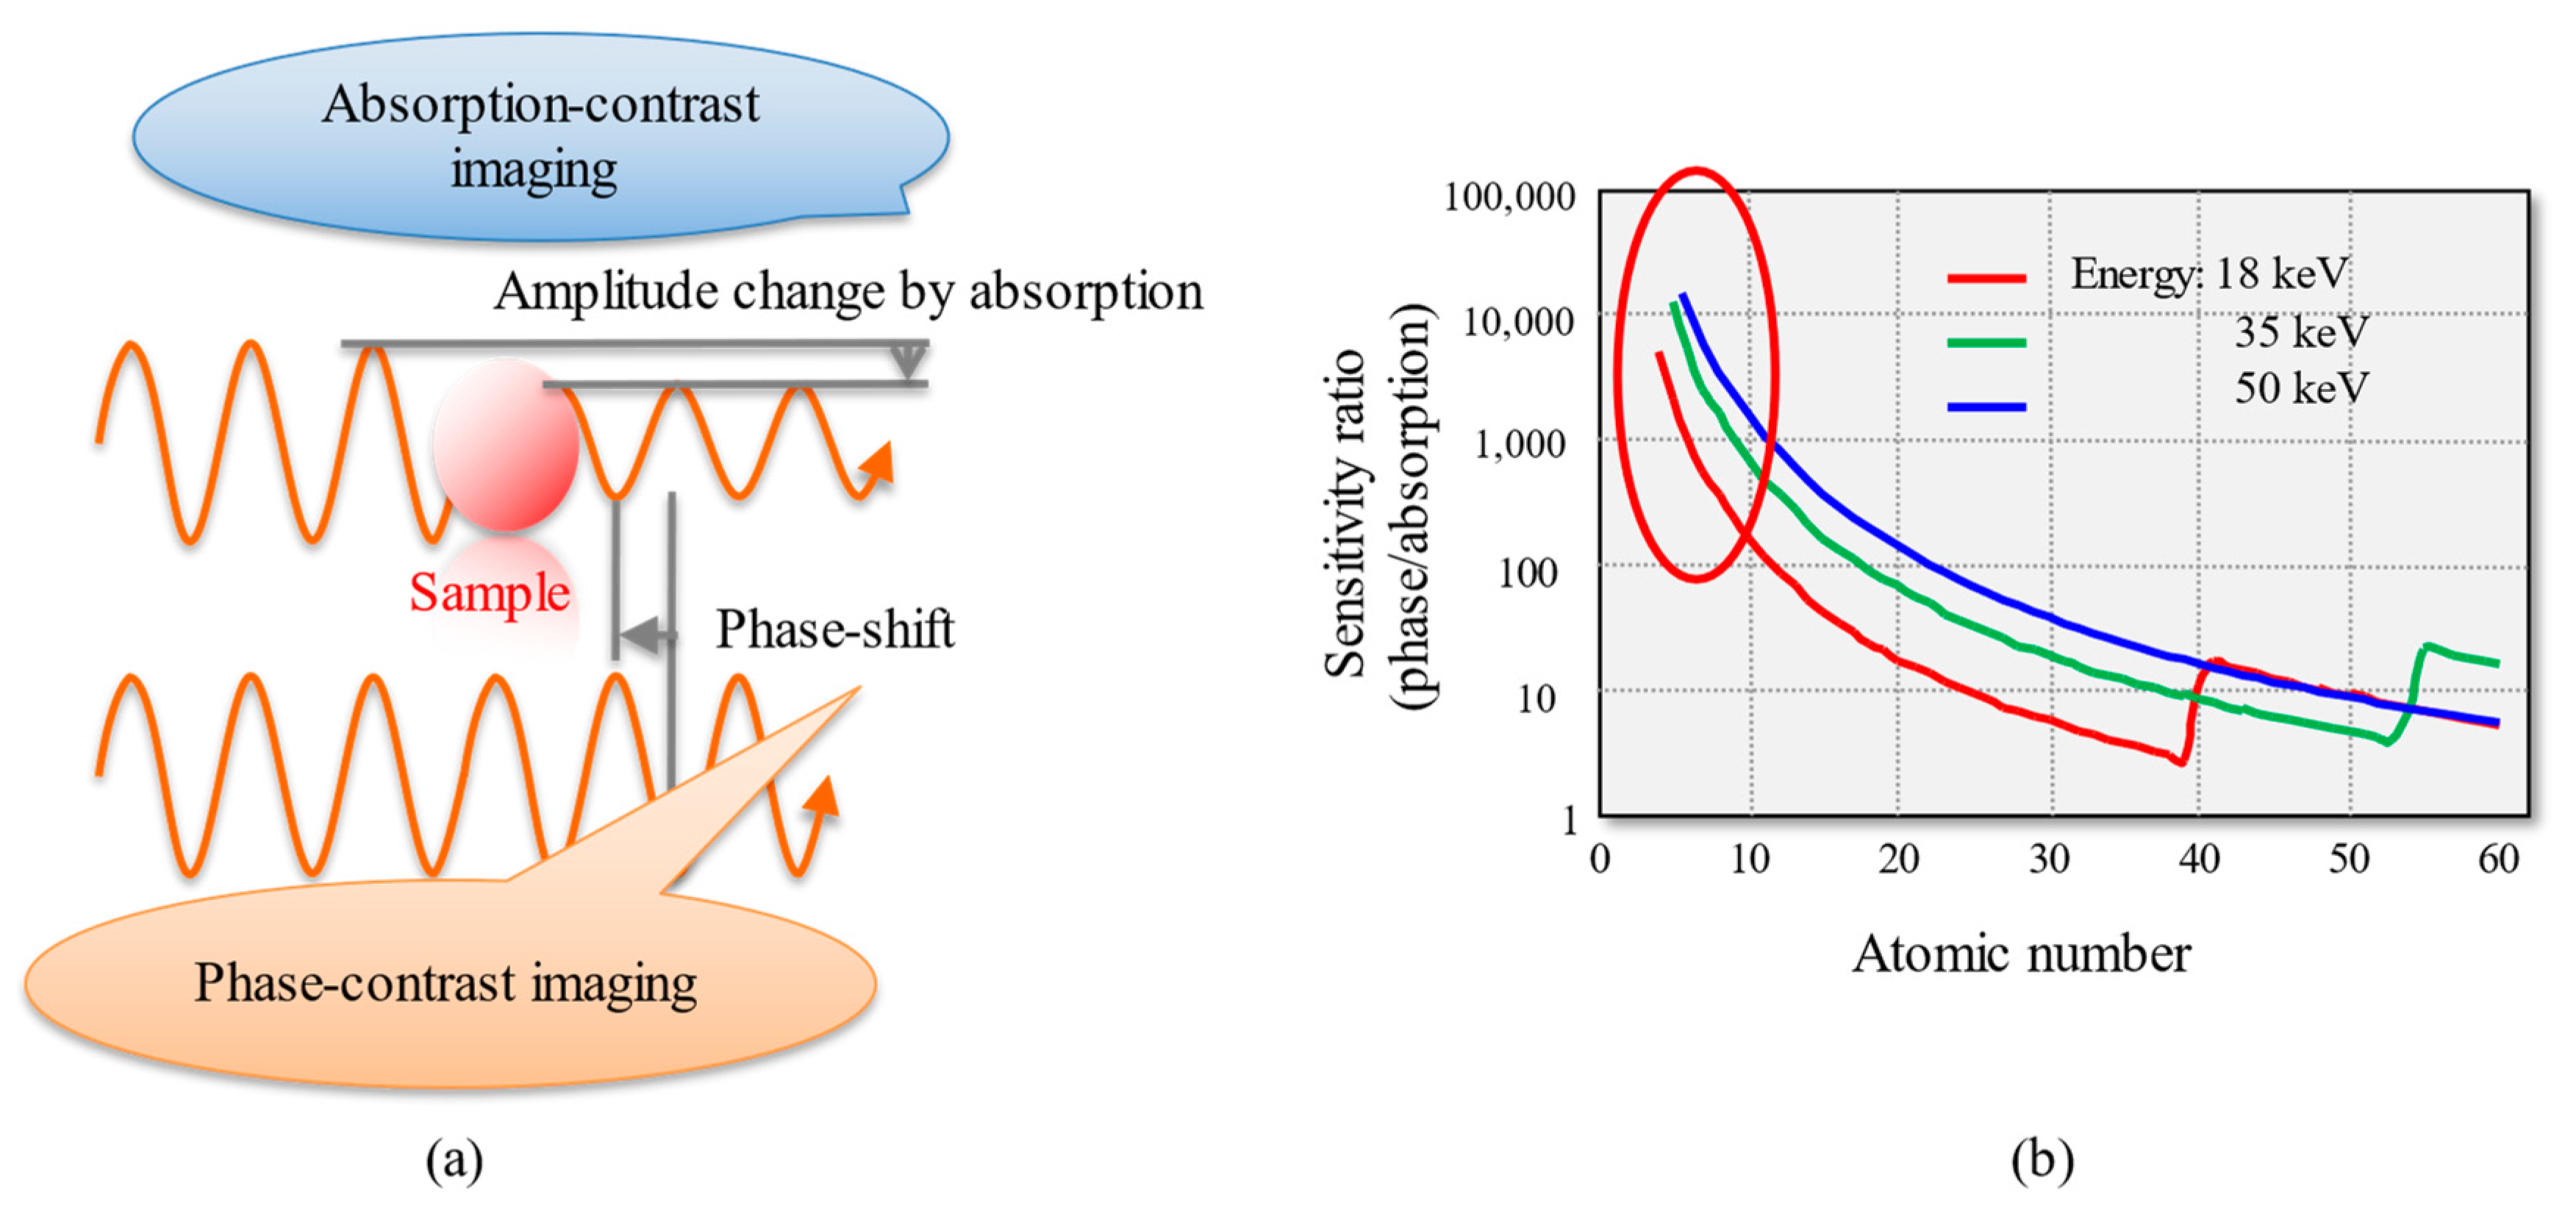
Figure 1. Principle of phase-contrast X-ray imaging: (a) schematic view of absorption and phase shift of X-rays and (b) sensitivity ratio of phase- and absorption-contrast imaging against atomic number.
Applsci 13 05424 g001
Figure 2. Various types of crystal-based X-ray interferometers.
Applsci 13 05424 g002
Figure 3. Schematic view of STXI; must be stabilized to within a few tens of prad for STXI operation.
Applsci 13 05424 g003
Figure 4. Schematic view (left) and photo (right) of ST-CXI system at beamline BL-14C of Photon Factory of KEK in Japan.
Applsci 13 05424 g004
Figure 5. Interference patterns obtained using 17.8-keV SR (left) and 35-keV SR (right).
Applsci 13 05424 g005
Figure 6. Sectional (a,b) and three-dimensional (c) volume rendering images of mouse brain. Reprinted with permission from Ref. [32]. Copyright 2013, IOP Publishing.
Applsci 13 05424 g006
Figure 7. Tumor-bearing rat testis: (A) sectional CT image obtained by CXI; (B) corresponding histopathological (HE-stained) gray-scale image and (C) color image. Periphery of testis (brown arrow); cystic areas (red arrow); solid areas (green arrows); fibrous septa (blue arrow); artificially torn region in HE images (black arrow) (1, 2, 3: solid tumor areas, 4: fibrous septa, 5: cyst) [42].
Applsci 13 05424 g007
Figure 8. Three-dimensional image of tumor-bearing rat testis obtained by CXI. Serial cut sections of tumor: (A) surface area, (B) internal area, (C) enlargement of boxed region in (B); a: blood vessel, b: seminiferous tubules, c: tunica albuginea, d: tumor, e: different densities apparent in solid area of tumor, f: cystic area of tumor, g: blood clot, h: fibrous septa [42].
Applsci 13 05424 g008
Figure 9. Three-dimensional reconstruction of tumor in rat brain: (a) overview of brain and tumor microvasculature; (b) magnified image of boxed region shown in (a); (c) tumor microvasculature viewed from different angle. Characteristics of tumor microvasculature are well depicted; e.g., tortuous, saccular (arrow), and dilated blood vessels are visible and exhibit haphazard interconnection patterns [40].
Applsci 13 05424 g009
Figure 10. Preparation for human embryo imaging. (a): A gel cylinder containing the human embryo sample is fixed to an acrylic plank; (b): the sample from (a) is placed in an acrylic cell ready for imaging. Samples mounted in the gel were different between photo (a) and photo (b); (c): the gel cylinder containing the human embryo sample is fixed to an acrylic plank. Kapton polyimide film is molded into a cup and fixed to an acrylic plank; (d): the gel and sample in (c) are placed in an acrylic cell and ready for imaging.
Applsci 13 05424 g010
Figure 11. Representative studies using CXI images acquired from the Kyoto collection. CT planes and reconstructed images were shown. (a): Coronal plane of the face and reconstruction of the secondary palate immediately before fusion (Carnegie stage (CS) 23) [50]. (b): Sagittal plane of the eyeball and reconstruction of the eyeball using the optic nerve (CS17 and CS19) [51]. (c): Transverse plane of the temporal bone and reconstruction of the inner ear with an enlarged brain and inner ear (CS21) [52]. (d): Sagittal plane of the thigh and reconstruction of the femur (CS19, CS21) [53]. (e): Transverse plane of the thorax, reconstruction, and median line of the bronchial tree (CS22) [54]. (f): Transverse plane of the thorax, reconstruction of the entire embryo and thoracic cage, and analysis of the reconstructed image (CS22) [55]. (g): Transverse plane of the thorax and abdomen and reconstruction of the thoracic and abdominal organs (CS21) [56]. In this sample, the liver is defective, and the positions of the stomach, pancreas, and heart have been changed.
Applsci 13 05424 g011
Figure 12. Schematic of experimental setup for CXI under temperature-controlled conditions: (a) top view of STXI and (b) schematics of experimental setup for cryochamber.
Applsci 13 05424 g012
Figure 13. (a) 3D image of cylindrical ice core sample including air hydrates visualized using a CXI system. The dark gray circles in the image correspond to air hydrate crystals [61]. (b) Air hydrates in an ice core sample were visualized using an optical microscope for comparison. (c) Density difference between air hydrate crystals and surrounding ice crystals plotted against size of air hydrate crystals. The point considerably higher than the others is possibly not an air hydrate but another type of hydrate, such as a sulphate hydrate, CO2 hydrate, or Ar hydrate. (Reprinted with permission from [57]. Copyright 2006, AIP Publishing).
Applsci 13 05424 g013
Figure 14. X-ray images of THF hydrates: (a) THF hydrate with ice at 253 K and (b) THF hydrate with water at 276 K at interparticle pore spaces obtained by CXI [63]. Densities of ice, CH4, and air hydrates are the values at 233 K, and those of THF hydrate and water are the values at 273 K. HDPE denotes high-density polyethylene. (c) Absorption contrast image of THF hydrate and ice in a polypropylene (PP) tube at 123 K measured by monochromatic X-rays of 8 keV using synchrotron radiation, where the two cannot be distinguished [64].
Applsci 13 05424 g014
Figure 15. Sectional images obtained by CXI of (a) CH4 hydrate and (b) natural gas hydrate with ice (white part) at 193 K. Reprinted with permission from [60,61]. Copyright 2011 and 2012, American Chemical Society.
Applsci 13 05424 g015
Figure 16. (a) Schematic of experimental setup of CXI system for in situ observation of LIB behavior. (b) Schematic of LIB cell, where WE is LiFePO4 composite electrode, CE is Li electrode, and electrolyte is 1 M LiClO4 dissolved in carbonate solvent (EC:DEC = 1:2 v/v). Continuous phase map of electrolyte in region indicated by red dashed line was analyzed [70]. Reproduced with permission from ref [70]. Copyright 2022 Springer Nature.
Applsci 13 05424 g016
Figure 17. (a) Constant-current (0.06 mA, C/2 rate) charging profile and (b) corresponding extracted phase maps of electrolyte. Since Δp is estimated as change from initial image of t = 0 s (without an applied current), change in Δp reflects change in electrolyte density from the initial state caused by charging. (c) Δp profiles of x-axis averaged over y-axis in (b) [71]. (Reproduced with permission from ref [71]. Copyright 2018 American Chemical Society.) SOC: state of charge.
Applsci 13 05424 g017
Figure 18. (a) Fast charge/discharge cycle (0.36 mA, 3C rate, five cycles) and potential profiles of first cycle, (b) corresponding extracted phase maps of electrolyte, and (c) Δp profile of x-axis direction charge (points A to F) and discharge (points G to L) [71]. Reproduced with permission from ref [71]. Copyright 2018 American Chemical Society.
Applsci 13 05424 g018
Figure 19. (a) Phase map of LAB cell obtained before current was applied. (b) Charge-discharge curve at C/2-rate (50 mA) and corresponding phase maps acquired at A–H [72]. (Reproduced with permission from ref [72]. Copyright 2020 Royal Society of Chemistry).
Applsci 13 05424 g019
Figure 20. Images of mouse leg obtained using (a) degree of coherence contrast, (b) phase contrast, and (c) absorption contrast. Reproduced from ref. [73] with the permission of AIP Publishing.
Applsci 13 05424 g020
Figure 21. Photos of metal foils and corresponding phase maps, absorption maps, and Zeff images. Average Zeff values were 16.4, 25.4, 27.9, and 28.8 for Al, Fe, Ni, and Cu foils, respectively [74]. Reproduced from ref. [74] with the permission of AIP Publishing.
Applsci 13 05424 g021
Figure 22. (a) Zeff image and (b) photo of rusted iron plate. Orange circles indicate rusted areas [75].
Applsci 13 05424 g022
Figure 23. Time-resolved projection images of thermal flow in heated water (left) and images calculated using finite element method (right) [76].
Applsci 13 05424 g023
Figure 24. Schematic of sample cell (left) and three-dimensional temperature distribution of water heated using ceramic heater (right) [76].
Applsci 13 05424 g024
Table 1. Main specifications of four major PCXI methods at SAGA Light Source (synchrotron radiation facility of Saga prefecture in Japan) [7].
MethodDetecting Physical ValueDensity ResolutionDynamic Range of DensitySpatial ResolutionTypical Measurement Time for CT
Crystal-based X-ray interferometry (CXI)cos (p)HighNarrow~30 μm~3 h
Diffraction-enhanced imaging (DEI) p x MiddleWide~10 μm<30 min
Grating-based X-ray interferometry (GXI) cos ( p x ) LowMiddle~10 μm<1 min for white synchrotron radiation
2 h for mono. synchrotron radiation
Propagation-based imaging (PI) 2 p LowWide~3 μm~1 h
Table 2. Prototypes in development of ST-CXI imaging system.
NoField of ViewImaging CapabilityR&D Target
125 × 15 mmInterference patternConfiguration and driving system of positional tables for prad rotational accuracy [33]
230 × 30 mmPhase mapFeedback system to suppress drift rotation and sample positioner [34]
340 × 60 mmPhase-contrast CTImage feedback system and sample manipulation for CT [29]
Table 3. Main specifications of ST-CXI system.
X-ray Energy15–35 keV
Field of view50 × 35 mm at 17.8 keV
24 × 35 mm at 35 keV
CT density resolution<0.5 mg/cm3 at 17.8 keV
Typical CT measurement time>2 h
X-ray imagerTypeFiber-coupled
Pixel size6.5 μm
Pixel number2560 × 2160
Frame rate50 fps for full image
Table 4. Comparative study with CXI and MRI using colon cancer specimen [39].
CXI4.74-T MRI
Volumetric resolution(0.018)3 mm3(0.075)3 mm3
Acquisition time2 h1.8 h
SNR * in nonnecrotic cancer lesions48.412.1
* SNR: Signal-to-noise ratio.
Table 5. Comparison of CXI and MRI for embryonic imaging.
CXI7-T MRI
Volumetric resolution(0.013)3 mm3(0.036)3 mm3
Acquisition time2 h69 h
Table 6. Comparison of CXI and conventional absorption-contrast CT for water and ice.
CXIAbsorption-Contrast CT
Photon energy [keV]3510
Volumetric resolution(0.013)3 mm3(0.0013)3 mm3
Acquisition time0.5 h0.3 h
Identification of water and icePossibleImpossible
Table 7. Comparison of CXI and other detecting methods for ion distribution in electrolyte.
CXIX-ray Microscope [68]7-T MRI [69]
Spatial resolution6.5 μm<40 nm0.1 mm
Acquisition time5 s/image A few min/image5 min/image
Sensitivity10001-
Disclaimer/Publisher’s Note: The statements, opinions and data contained in all publications are solely those of the individual author(s) and contributor(s) and not of MDPI and/or the editor(s). MDPI and/or the editor(s) disclaim responsibility for any injury to people or property resulting from any ideas, methods, instructions or products referred to in the content.