Article

Measuring the Centrality of DNS Infrastructure in the Wild

1
College of Electronic Engineering, National University of Defense Technology, Hefei 230037, China
2
Anhui Province Key Laboratory of Cyberspace Security Situation Awareness and Evaluation, Hefei 230037, China
*
Author to whom correspondence should be addressed.
Appl. Sci. 2023, 13(9), 5739; https://doi.org/10.3390/app13095739
Submission received: 10 April 2023 / Revised: 28 April 2023 / Accepted: 3 May 2023 / Published: 6 May 2023

Abstract

:
The centralization of the global DNS ecosystem may accelerate the creation of an oligopoly market, thereby, increasing the risk of a single point of failure and network traffic manipulation. Earlier studies have revealed the level of centralization in terms of the market share of public DNS services and DNS traffic seen by major CDN providers. However, the level of centralization in the infrastructure of the DNS Ecosystem is not well understood. In this paper, we present a novel and lightweight measurement approach that effectively discovers resolver pools from a single probing point. We conduct an Internet-wide active measurement on the client-side as well as the server-side DNS infrastructure to assess the level of DNS centralization in terms of the supporting infrastructure. Our measurement results show that the DNS infrastructure is much more centralized than previously believed. Over 90% of forwarding resolvers are backed by less than 5% (4071) of indirect resolvers. Merely 0.45% (12,679) of all name servers across 1138 gTLDs, operated by just 10 DNS providers, provide authoritative domain resolution service for 48.5% (more than 100 million) of domain names. We also investigated several leading DNS providers in IP infrastructure, load distribution, and service geo-distribution. The findings of our measurements provide novel insights into the centrality of the DNS infrastructure, which will help the Internet community promote the understanding of the DNS ecosystem.

1. Introduction

The Domain Name System (DNS) is designed to be a distributed system, despite the fact that the domain name space has a tree structure. However, due to the evolving Internet business model, centralization has emerged in various aspects of DNS [1], including the market share of the public DNS services [2,3] and DNS traffic [4]. This arouses much concern since DNS is a critical component of the Internet infrastructure. The consequences caused by DNS centralization can be multifaceted [5]. Firstly, centralized DNS services often lead to an awkward situation where the failure of one primary provider can render the domain resolution process vulnerable. On 17 June 2021, the Akamai DNS outage left numerous top websites and online services inaccessible, including Google, Amazon, Steam, Cloudflare, and FedEx [6]. Secondly, the likelihood of accidental enterprise failures may increase due to centralized services, and the challenge of recovery may also escalate. Facebook experienced the most influential outage in the entire history of the Internet on 4 October 2021 [7], which was caused by a mistake in BGP updating that resulted in the authoritative DNS service outage. These cases serve as a reminder that centralized DNS services can potentially drag enterprises into a service black hole that increases the risk of a single-point failure and eavesdropping, increasing the concern of violating users’ privacy. In light of the aforementioned threats, the European Union is planning to launch the DNS4EU Infrastructure Project, which aims to build DNS infrastructure of its own to mitigate the consolidation of DNS [8].
Previous studies have explored the concentration of DNS resolution traffic or DNS name servers. Moura et al. [4,9] analyzed the passive traffic of several public DNS providers, DNS root servers, and country-code top-level domains (ccTLDs). Moreover, Allman et al. [10] studied the centralization of name servers using TLD zone files. However, the level of centralization within the DNS infrastructure itself remains largely unknown. In addition, most previous studies have relied on passive analysis methods, such as traffic analysis and zone file analysis. Researchers appear to be hindered by the complex architecture and the puzzling behaviors of DNS resolvers [11]. To meet the access demands of a large number of Internet end-users, public DNS providers deploy the multiple-layer resolver pool for load balancing, which is transparent to clients. Consequently, there exists an implicit collaborative relationship between resolvers located within the same resolver pool. Schomp et al. [12] proposed a taxonomy for the client-side DNS infrastructure, which includes FDNS (forwarding resolver), RDNS (recursive resolver), iRDNS (indirect RDNS), and dRDNS (direct RDNS). Since resolvers are generally hidden from Internet end-users, identifying the resolver pool structure poses a critical challenge in measuring the centrality of the client-side DNS infrastructure.
To overcome the challenge and systematically evaluate the centrality of the DNS infrastructure, we propose a novel resolver pool measurement approach that can identify the implicit resolver pool structure of the client-side DNS infrastructure by a single probing point and can be implemented at a low cost. Furthermore, we conducted Internet-wide scanning on all routable IPv4 addresses using our approach. Our measurement results reveal that over 90% of forwarding resolvers are supported by less than 5% of indirect resolvers. In addition, to comprehensively explore the centrality of name servers, we analyzed zone files of 1138 generic Top-Level Domains (gTLDs). Our analysis shows that more than 98% of all domain names rely on a single name server provider, and the top 10 leading name server providers serve 48.5% of all domain names. Furthermore, we found that 60% combinations of name server providers share their infrastructure directly or indirectly, which suggests that enterprises may implicitly rely on the same infrastructure even if they outsource their DNS service to multiple DNS providers.
In summary, our key contributions are as follows:
  • We propose a novel and lightweight resolver pool measurement approach based on NS chain reflecting, which is capable of discovering the implicit resolver pool structure of the DNS service in a fast and low-cost manner.
  • We conducted a comprehensive quantitative analysis of DNS centrality from the client-side and server-side in terms of the infrastructure on various dimensions, including IP address, domain name, DNS service provider, and IP provider, providing a multi-faceted view of DNS infrastructure centralization.
  • We uncovered several previously unknown insights about the centrality of DNS infrastructure. On the client side, more than 90% of FDNSes are actually backed by less than 5% of iRDNSes. On the server side, more than 98% of all domain names rely on a single name server provider, with the top 10 leading name server providers serving 48.5% of all domain names.
The remainder of this paper is organized as follows. Section 2 introduces related work and Section 3 discusses the basic concepts of DNS. Section 4 describes our methodology to measure the centrality of DNS infrastructure. In Section 5, we measure the centrality of the client-side DNS infrastructure, and we analyze the centrality of the server-side DNS infrastructure in Section 6. Finally, we conclude the paper in Section 7.

2. Related Work

2.1. DNS Measurement

A large body of work exists on measuring and analyzing the client-side DNS infrastructure. Several researchers measured the population of open resolvers using an Internet-wide active measurement method over the past decades and discussed the malicious behavior of open resolvers and the structure of the client-side DNS infrastructure [11,12,13,14,15,16,17]. For example, Alzoubi et al. [14] proposed the LDNS by presenting a large-scale measurement of hosts sharing the same local DNS servers. Nevertheless, the author measured resolver pools utilizing a CNAME chain-based approach, which is ineffective for current DNS, as we prove later in this paper. Some researchers measured the client-side DNS infrastructure using passive data such as log data collected from specific DNS servers (and web servers in some cases) [9,18,19,20]. For example, Al-Dalky et al. [20] characterized and classified resolver pools using log data from the authoritative DNS of a mainstream CDN provider. Though DNS traffic collected from different sources provides a feasible resolution, passive measurement results may be biased or limited by its traffic and network location, and thereby this would influence the understanding of the client-side DNS infrastructure. We complement existing studies by quantifying the degree of centralization of the client-side DNS infrastructure using a novel active measurement approach.
Another research branch in DNS measurement focuses on measuring and analyzing the server-side DNS infrastructure, authoritative nameservers (ADNS), specifically. Hao et al. [21] presented a large-scale measurement of the ADNS deployment patterns of modern web services and examined the characteristics of different deployment patterns, such as performance, life-cycle of servers, and availability. Akiwate et al. [22] explored the sacrificial nameserver renaming practices and quantified its scope and scale. We extend existing studies in terms of involving dataset and analysis perspectives by analyzing the supporting infrastructure of 210,446,494 domain names from 1138 gTLD zone files from various dimensions.

2.2. Internet Centrality

The Internet community has expressed growing concerns about the centrality of critical Internet infrastructure services, such as DNS and CDN. Researchers have performed a lot of research to understand the situation of the centrality issue and its potential impact. The well-known consolidation trend of the Internet has attracted much interest [23].
As far as we know, we are the first to quantitatively explore the centrality of DNS in terms of its backing infrastructure from both the client side and the server side. Moura et al. [4] measured Internet centralization by analyzing DNS traffic from five leading cloud providers. Huston [2,24] measured DNS resolver centrality from the market share perspective by embedding domain resolution scripts in Google Ads to gain insights into most mid-to-large ISPs. Radu et al. [3] performed a timely analysis of the evolution of consolidation in the public DNS market. They discussed potential threats that Internet centrality might pose in [25,26]. Shue et al. [27] investigated the degree of shared infrastructure in web servers and authoritative DNS using DMOZ data and DNS zone files from .net and .com TLDs. In this paper, we introduce more DNS zone files providing a comprehensive perspective. Zembruzki et al. [28] measured the concentration and shared infrastructure by analyzing authoritative name servers of all domains of the Alexa Top 1 Million. Allman et al. [10] covered infrastructure centralization of authoritative name servers from three TLD zone files. Dell’Amic et al. [29] researched the dependency issues caused by Internet consolidation. Kashaf et al. [30] analyzed the prevalence and impact of direct and indirect third-party dependencies in DNS, CDN, and CA, and discussed the concentration of third-party services. In this paper, we focus on the centrality of infrastructure, which provides the foundational support for the Internet and has a broader and more lasting impact.

3. Preliminaries

Name servers and resolvers are two core components of the DNS ecosystem. The name server is the maintainer of DNS records, which ensures the validity and correctness of DNS records. Depending on the content of DNS records they hold, name servers can be classified as root name servers, top-level name servers, and authoritative name servers. In general, the ADNS maintains all records for a domain name. For example, if we want to query the A record of a1.example.com to obtain the IP of the domain, the response will eventually be given by the ADNS of example.com. The resolver is the executor of the resolution service, which acts as a bridge between users and name servers.
With the development of the Internet and the rise of market-oriented domain name services, public DNS providers have upgraded the traditional DNS. Figure 1 illustrates the typical domain name resolution model of public DNSes. They introduce function-specific subsystems to decompose the resolution process to provide efficient and accurate domain name resolution services to users in different regions. For example, the FDNS does not perform any query to the ADNS but rather forwards the lookups along to RDNSes. RDNSes are the final executors of domain name resolution tasks, communicating directly with ADNSes. These behaviors result in the implicit cooperative resolution relationship between different RDNSes which constitute the resolver pool.
From the user’s point of view, the domain name resolution process is transparent, and it is only to observe the service IP that public DNS providers provide. Usually, public DNS providers will choose an identifiable IP as the service IP, such as the 8.8.8.8 of Google Public DNS. The FDNS closest to the user receives the lookup from user devices and forwards it to the public DNS at the service IP. If the querying domain name is absent from the cache system of the public DNS, one or more optimal RDNSes are selected to communicate with the ADNS to obtain domain records. Because of the transparent nature of the public DNS service, the implicit relationship among resolvers is an unreachable area in traditional DNS measurement studies. To expose the resolver pool, Schomp et al. [12] proposed a resolver pool discovery method based on CNAME chains, which exploited the resolution strategy of CNAME records. In theory, providers will apply different resolvers to resolve CNAME records to improve the efficiency of domain name resolution. However, the resolution strategy providers use is uncertain in the wild, which becomes the biggest obstacle to the method. In the subsequent section, we explore the effectiveness of this approach.

4. Methodology

The primary goal of our work is to explore the centrality of DNS infrastructure. It is challenging to understand the complex internal structure of DNS due to the implicit resolver pool. In order to achieve this goal, we first evaluate the efficacy of the CNAME chain-based resolver pool discovery method and demonstrate its limitations. To address these limitations, we propose a novel and lightweight resolver pool discovery approach based on NS chain reflection. Finally, this section introduces our name server measurement approach.

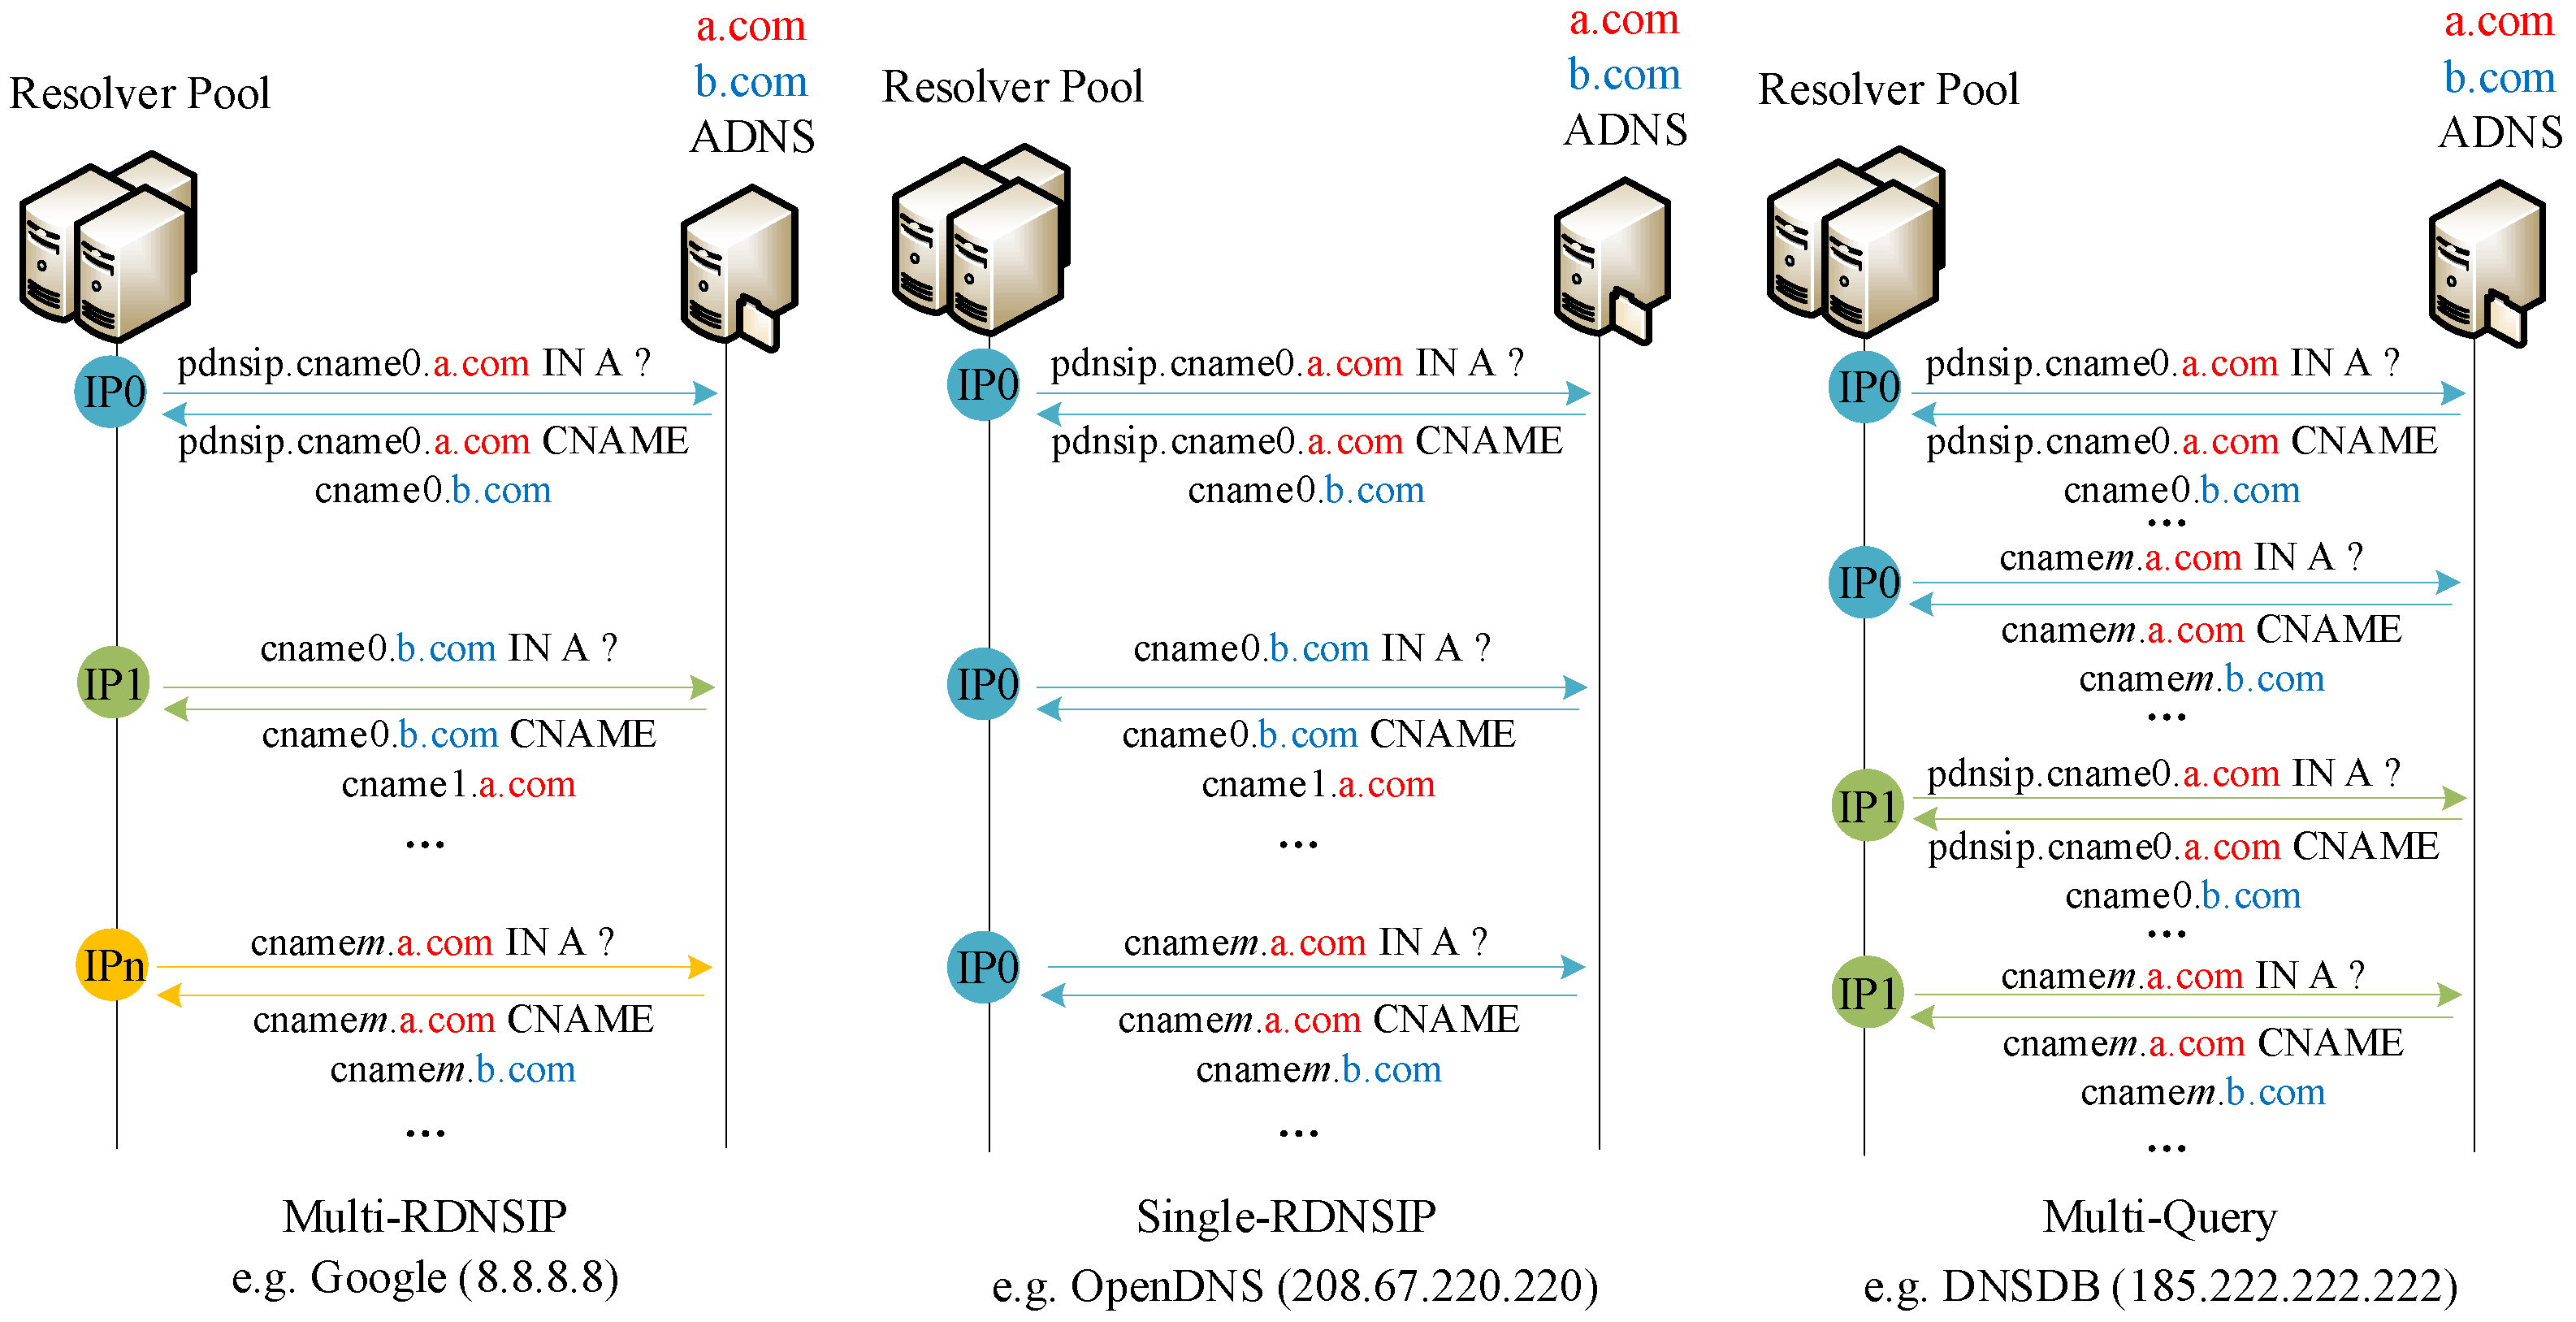
4.1. CNAME Chain-Based Method

The CNAME chain-based resolver discovery method is based on the idea that “the RDNS that sends a DNS request is often not the same RDNS that resolves the CNAME redirections” [12]. However, our latest observation shows that the CNAME resolution patterns, which this method relies on, vary among different DNS providers and thus invalidate the method. This subsection aims to answer the following questions: (1) How do different public DNS services handle CNAME queries? (2) What is the performance of the CNAME chain-based method in discovering resolver pools?

4.1.1. Experiment Setup

To investigate these questions, we conducted a study on 20 well-known public DNS providers, including Google, Cloudflare, OpenDNS, Quad9, Yandex, Level3, among others, as shown in Table 1. We created 40 CNAME records using two research domain names owned by us, as illustrated in Figure 2. The name server of both domains was configured on the same machine with a publicly routable IP. Then, we initiated the CNAME lookup process by sending a query to the service IPs of targeted public DNS, with the service IP embedded in the query name. This allowed us to collect DNS query logs at the ADNS and easily differentiate the CNAME behaviors of different public DNSes.

4.1.2. Results

For each public DNS, we group IPs interacting with our ADNS among multiple CNAME redirections. The CNAME chain resolution process of public DNS can be categorized into three patterns: multi-RDNSIP, single-RDNSIP, and multi-Query, as shown in Figure 3. Only Google and Level3 followed the multi-RDNSIP pattern, which uses different RDNSes to resolve CNAME records recursively. The single-RDNSIP pattern, which includes OpenDNS, Cloudflare, Dyn, Verisign, Norton, 114DNS, DNS Watch, SafeDNS, Comodo, Clearbrowsing, Freenom World, and DNS Advantage, does not change the RDNS IP when recursively resolving CNAME redirections. The multi-Query pattern, mainly adopted by Quad9, Tencent, AliDNS, Yandex, AdGuard DNS, and DNSDB, re-initiates the lookup with a different IP (e.g., IP1) when the current one (e.g., IP0) fails to walk through the CNAME chain. Note that the length of CNAME chain tracked by different public DNS varies, regardless of their resolution pattern. Our observation reveals that Google Public DNS typically terminates the resolution process after tracking ten CNAME redirections. In comparison, Level3 stops after nine, OpenDNS stops after seven, and DNSDB stops after five.
Apparently, The effectiveness of the CNAME chain-based resolver pool discovery approach is limited to the multi-RDNSIP and multi-Query pattern, which will uncover multiple resolvers in the same pool. In order to evaluate the efficiency of the CNAME chain-based method in the wild, we examined the public DNS list provided in [31]. Out of the 2441 responsive public DNS, only 270 were found to use multiple resolvers to track CNAME redirections, in either multi-RDNSIP pattern or multi-Query pattern, yielding an unsatisfying coverage of only 11.06%. The experimental results prove that the CNAME chain-based method has limited efficacy in identifying resolver pools on the modern Internet. Therefore, we propose a new approach to comprehensively measure the resolver pool.

4.2. Client-Side DNS Infrastructure Measurement

To explore the centrality of client DNS infrastructure, we begin by distinguishing the various components of client DNS infrastructure. Next, we identify the internal relationships between them and construct the client’s resolution dependencies.

4.2.1. Measurement Scheme

Typically, researchers deploy an authoritative name server for a research domain and then query the A record of the particular domain, which embeds the target IP in the subdomain of the research domain. There are two primary ways of collecting data: (1) gathering query log data from authoritative name servers [11,14,18] or (2) collecting responses from vantage points (VPs) that contain a constant IP or a dynamic IP encoded by specific information [11,12,13,15]. Given the complex structure and behavior of the client-side DNS infrastructure, both methods may miss some critical insights on the client-side DNS infrastructure [11]. Furthermore, as researchers observed, A records may be manipulated or polluted by malicious resolvers or middleboxes [16], making the correlation of various client-side DNS components inaccurate.
To address these issues, we extend existing methods [13] by implementing a TXT records-based measurement scheme. TXT record accepts texts of variable length so that it allows us to embed carefully designed responses in it. As shown in Figure 4, we register a research domain and deploy an authoritative name server for the domain as previous work did, where R1 is the response from our authoritative server, and R2 is the response data that we received at the vantage point. To fulfill the requirements of the measurement task, we customized BIND9 by modifying its source code, enabling it to respond to TXT lookups with a specially designed TXT resource record. This record embeds information such as timestamp, source IP, and source port, which are used in our subsequent analysis. At the measurement point, we modified Zmap [32] to enable it to send targeted query packets, specifically querying TXT records with embedded target IP signature subdomains. By doing so, we are able to tell FDNSes and iRDNSes apart in a single lookup, based on the response received by the vantage point, which is free from malformed results.
Finally, we collect Zmap results at the vantage point side as well as BIND9 log files on our authoritative name server. On the vantage point, we extract the timestamp, IP2, and source port from the answer section, and associate IP2 with IP1. We comprehensively utilize data from both aspects to analyze client DNS infrastructure, including FDNS, dRDNS, and iRDNS. The determination rules are as follows:
I P 1 o r I P 2 i s d R D N S , I P 1 = I P 2 ; I P 1 i s F D N S a n d I P 2 i s i R D N S , I P 1 ! = I P 2 ;

4.2.2. Resolver Pool Discovery

One evidence of the centrality of the client-side DNS infrastructure is the prevalence of resolver pool, which implies that a large number of FDNS will be dependent on a small number of iRDNS. To clarify the relationship between FDNS and iRDNS and uncover hidden resolver pools, previous researchers have relied on large-scale measurement platforms, such as RIPE [2] or PlanetLab [24], or specific DNS software implementation mechanisms, i.e., the CNAME chain [12,14,20]. While the former might be costly, the latter yield unsatisfactory performance, as we have already proved. We propose a novel and lightweight resolver pool discovery approach based on NS chain reflecting. The core idea of our method lies in that we turn some featured resolvers into distributed probes by carefully designing the domain resolution process, as illustrated in Figure 5. These featured resolvers interact with the authoritative name server with the recursion desired (RD) flag like a client. The main steps of our approach are as follows:
Step 1: Collecting featured resolver list. We conducted Internet-wide scanning to collect the featured resolvers from the DNS log files of our ADNS generated. Filtering resolvers that send queries with RD flag from the logs, we obtain 1561 IPs and then verify the validity of these IPs. Finally, we compile 1500 featured resolvers distributed in 18 countries or regions that can be used in our measurements.
Step 2: Setting up customed name server. We deployed the authoritative name server of our registered domain as a bridge name server by configuring a special NS record to make it possible for targeted public DNS service IP receiving queries with RD flag. These NS records delegate a couple of a subdomain to targeted public DNS service IP. In addition, to make sure that the resolution process is completed successfully, we also delegate one NS record of that subdomain to the real name server, which provides the answer record by modified BIND9. Similar to the Internet-wide measurement setup, we choose TXT records and encapsulate resolver IP in responses.
Step 3: Sending queries to featured resolvers. We sent lookups to featured resolvers obtained in step 1 and then collected the resolution data. Due to the load-balancing nature of public DNS and ISP DNS, we improve our coverage by repeating step 3 several times.
As shown in Figure 5, we send a resolution request (Q1) from the vantage point to featured resolvers. Then, featured resolvers send a resolution request (Q2) to the bridging name server we have deployed. By utilizing the customized response (R1), we redirect the featured resolvers to the target DNS (Q3). Subsequently, the target DNS initiates a resolution request (Q4) to the real authoritative name server. Ultimately, at the vantage point, we receive a response record (R4) embedded with the target DNS resolver pool IP.

4.2.3. Advantage and Disadvantage

Table 2 lists the comparison of resolver pool discovery methods, including our proposed approach. As described in Section 4.1, we have demonstrated the limitations of the CNAME chain-based approach through empirical experiments. Our experiments reveal that merely 270 out of 2441 public DNSes utilize multiple resolvers to trace CNAME redirections, resulting in a disappointing coverage of 11.06%. The experimental findings indicate that the CNAME chain-based approach has limited performance on the modern internet. Although there are already some measurement platforms such as RIPE or PlanetLab [2,24], their abilities and applications are still constrained. For instance, the limited scale of the platform can impact the effectiveness of measurements, and acquiring platform authorization can be challenging. Our resolver pool measurement approach can find the implicit resolver pool structure of the client-side DNS infrastructure by a single probing point. It turns the featured resolvers into distributed probes by carefully designing the domain resolution process. Owing to implementation shortcomings, these featured resolvers issue requests with the RD flag set, just as clients do. On the other hand, unlike the CNAME chain method that relies on public DNS implementation features, our approach does not depend on public DNS implementation and can discover resolver pools for any public DNS.
Limitations. Previous research shows that the location of measurement points on the internet can have an impact on measurement accuracy [33]. Therefore, our measurement results might also be subject to such bias due to single-point measurements. However, we argue that our single-point measurement scheme can largely meet the goal of revealing the forwarding relations between the client-side DNS infrastructure, as most FDNSes are Open resolvers that can be accessed from anywhere on the Internet [12]. Additionally, we can mitigate the bias by choosing various measurement points and merging their measurement results.

4.3. Name Server Measurement

We analyze the name server via three steps.
Step 1: Collecting NS record. We applied zone files as our basic data and gather NS records to construct the relation between domain names and name servers.
Step 2: Mining information of NS records. We resolved collected NS records to IP addresses leveraging an open-source project ZDNS [34]. In addition, to expose IP providers that hide behind NS providers, we use MaxMind IPGeoLite2 [35] to collect the Autonomous System Organization (ASO) and Autonomous System Number (ASN) of IPs.
Step 3: Exploring centrality. We performed a comprehensive analysis of the centrality of name servers from the distribution and configuration of name servers.

5. Resolver Centrality Analysis

5.1. Summary of Measurement

We control our Internet-wide probing at a relatively moderate speed of 23,000 packets/s, which occupies 15 Mbps of local Internet bandwidth and takes 45 h to complete one measurement. We repeat this measurement ten times over the course of one month to comprehensively reveal the resolver pools behind forwarding resolvers. While the numbers of R1 and R2 vary with each round, the overall populations of R1 and R2 remain stable across our measurements, with average values of 718 million and 567 million, respectively. Compared with the previous study in 2019 [11], the number of R2 decreases slightly, showing that the population of responsive open resolvers keeps dropping over time.
For each measurement, we collect response packets from the vantage point and BIND9 log files. We then extract FDNSes, dRDNSes, and iRDNSes from collected data using the method described in Section 4. Finally, we examine the centrality of the client-side infrastructure by analyzing the interaction of FDNSes and iRDNSes.

5.2. Centrality of iRDNS

Finding 1: More than 90% of forwarding resolvers are ultimately backed by fewer than 5% (4071) of indirect resolvers, which are operated by about 300 IP providers. Previous studies have revealed that the imbalance between the numbers of FDNSes and iRDNSes [12,13], where 90% of Internet users are served by 10 K resolvers from the users’ perspective [2]. Compared with previous studies, our finding uncovers the client-side DNS infrastructure is much more centralized in terms of forwarding relationships between different types of resolvers. From Table 3, we observe that the number of the FDNSes is substantially larger than that of the iRDNSes by a wide margin, approximately 50 times greater than the number of iRDNSes. Despite the vast numbers of FDNSes on the Internet, all DNS queries will be forwarded to and processed by 50 K iRDNSes. Given the dynamics of iRDNSes, we obtain the union of all the iRDNSes among the ten measurement rounds in Table 3 and obtain a total of 80 K iRDNSes. Figure 6 shows a CDF of the number of resolvers that serve the most FDNSes. More than 90% of all FDNSes are ultimately backed by less than 5% (4071) of indirect resolvers, where more than 70% of all FDNSes end up being served by only 1.2% (1K) iRDNSes. The 4071 iRDNSes are operated by about 300 IP providers, with the top 10 providers operating 72.3% of these iRDNSes. This indicates that indirect resolvers are highly concentrated among a small number of IP providers. They can be classified into two types: public DNS providers and localized Internet service providers. Google is the largest provider owing to the prevalence of Google Public DNS. Apart from public DNS providers such as Google, Cloudflare, and OpenDNS, Internet service providers, such as PT Telekomunikasi Indonesia, CHINA UNICOM, Turk Telekom, and Chinanet, also operate considerable top indirect resolvers. Surprisingly, the top 1 iRDNS is an iRDNS of Iran Telecommunication Company, serving more than 1.04 million FDNSes. This does not necessarily suggest that it is the most widely used iRDNS, but it might be aligned with the censorship policy in Iran [36].

5.3. Resolver Pool

Finding 2: The top 5 public DNS providers serve approximately 40% of all FDNSes, with the resolver pool operated by Google Public DNS serving more than 22.22% of the total FDNSes. In order to assess the impact of centralization arising from the widespread adoption of resolver pooling techniques, we analyzed the resolver pools of major public DNS providers. Owing to the lack of ground truth data, it is challenging to evaluate the efficiency of the resolver pool discovery method. Therefore, we assess the effectiveness of our method by verifying with Google Public DNS official data [37]. Specifically, we found that 2274 indirect resolvers, distributed cross 119/24 prefixes, accounted for 75.8% of that published by Google. The measurement outcomes validate the efficacy of our methodology. Furthermore, it is salient to note that the scope of our approach is in fact broader than the recorded figure, given that we ascertained some IP ranges cited in the official data were entirely inactive.
We correlate our Internet-wide measuring data with discovered resolver pool of public DNS to assess the usage of these pools by FDNSes. Table 4 lists the top five public DNS providers in regard to their pool size and the number of FDNS. Note that the count of FDNSes in Table 4 corresponds to the scale of the union of FDNSes discovered during our ten rounds of Internet-wide measurement. Cloudflare operates the largest resolver pool, comprising of 8593 resolvers distributed in 263/24 prefixes, with more than 32 resolvers per/24 on average. While the number of FDNS served by it is relatively small, just ranking four in the top five public DNS providers. Although Google operates a smaller number of resolvers, they serve 4.27 M FDNSes, accounting for 22.22% of the total population of FDNS. Our results provide another evidence of the central position that Google holds in the global resolver market. Interestingly, despite employing different measurement methods, our findings closely align with previous studies [2], which observed that 22.36% of Internet users directed queries to Google Public DNS. This could indicate that the quantity of Internet end-users is generally proportional to the number of FDNSes, considering the multifarious usage scenarios of FDNSes.
Finding 3: Load distribution varies substantially across resolvers within a resolver pool, which reinforces the centrality of a limited subset of resolvers in that pool. Although the number of FDNSes largely corresponds with the quantity of Internet end-users, upon aggregating FDNSes that are served by Google’s iRDNSes in each/24 prefix, we discovered that the number of FDNSes is not strictly proportional to the number of the iRDNS in a/24 prefix, as shown in Figure 7. This could signify an uneven allocation of loads across the diverse resolvers within the same pool. Among the 119/24 prefixes of Google’s resolver pool, we discover 172.217.33.0/24 contains 20 resolvers servicing 906 K FDNSes, whereas 74.125.44.0/24 encompasses 45 resolvers supporting merely 89 FDNSes, as marked in the two green lines in Figure 7. Only 802 in 2274 discovered resolvers in Google’s resolver pool fall in the most centralized indirect resolvers.
To explore the internal structure of resolver pools, we partition the resolver pool of Google into 17 sub-pools predicated upon the intersection of shared FDNSes among different sub-pools. Different sub-pools signify that they serve a different set of FDNSes. Figure 8 shows the Sankey diagram of these sub-pools and the geographic location of resolvers in each sub-pool. We discerned that sub-pool 1 possesses the most expansive scope and span, encompassing resolvers situated across 8 regions, including Australia, Belgium, Germany, Japan, and the United States. It serves more than 2.8 M FDNSes, reaching 65.6% of all 4.27 M FDNSes served by Google Public DNS. It may be the core infrastructure of Google Public DNS and thus accordingly exhibits evident centrality. Interestingly, 6 discrete sub-pools (sub-pools 5, 6, 10, 14, 16, and 17) reside exclusively within the US; nevertheless, the FDNSes they service reveal negligible intersections. This could be attributable to Google implementing a more granular access policy for domestic users within the US.

5.4. Service Geo-Distribution

In this section, we have endeavored to depict the geographical distribution of DNS services for public DNS providers and ISP DNS providers. We investigated Google Public DNS, OpenDNS, and Cloudflare DNS as public DNS providers and Iran Telecommunication DNS as the ISP DNS provider, respectively. We first identified the resolver pool for each DNS provider using the method described in the previous section (Section 4). Resolvers in the same pool serve the same set of FDNSes. So, we correlated FDNSes and iRDNSes, inferring the usage of certain public DNS services. We located matched FDNSes using MaxMind’s IPGeoLite2 database and mapped it into OpenStreetMap to visualize their geo-distribution.
We correlated with 4.22 million FDNSes forward DNS lookup to Google Public DNS (8.8.8.8 or 8.8.4.4), which distributed in 221 countries or or regions. Figure 9 shows the geo-distribution of these FDNSes in the form of heat map, where the density of FDNSes is represented by the darkness of color. From the figure, we observe that Google Public DNS is popular with Internet users globally, yet its distribution is uneven. For example, in Africa and Australia, it has less usage probably due to the less-developed economy, Internet access, or the dominant status of local DNS providers. Another two public DNS providers, OpenDNS and Cloudflare, showed similar global distribution, but they were apparently less popular than Google Public DNS. OpenDNS was more prevalent in US and Brazil, while Cloudflare was more popular in Europe and China.
Now we turn our attention to ISP DNS. As a case study, we analyzed DNS operated by Iran Telecommunication. As mentioned in the previous section, we first identified the resolvers by discovering all the iRDNSes operated by Iran Telecommunication. Then we correlated the FDNSes that exist forwarding relationship with the resolver pool, which matches 1.04 million FDNSes. Different from Google Public DNS, whose customers are highly distributed across the world, although these FDNSes locate in 13 countries, 99.8% of these FDNSes are located in Iran, as shown in Figure 10. This indicates that the resolver pool’s major customers are located in Iran, as well.
Summary: In this section, we quantify the centrality of the client-side DNS infrastructure in terms of the forwarding relationship among different types of resolvers. We extend previous Internet-wide DNS studies and propose a novel and lightweight resolver pool discovery method. We gain new insights into the centrality of client-side DNS infrastructure through uncovering the consolidation situation among FDNSes, iRDNSes, and DNS providers. From the perspective of forwarders, we were surprised to find that 5% of indirect resolvers support 90% of forwarders. This implies that internet traffic is concentrated on a small portion of resolvers, significantly increasing the likelihood of resolution failures. From the service provider’s perspective, 40% of forwarders belong to five service providers, with Google alone serving more than 22% of forwarders. This indicates that the rise of the domain name market has led to an oligopoly of DNS service providers, which also contradicts the original design principles of DNS. We recommend that the internet community focuses on the centralization tendencies within DNS infrastructure and takes steps to alleviate the influence of service provider oligopolies on resolution services, such as promoting the community-driven deployment of public DNS.

6. Name Server Centrality Analysis

We begin our analysis of name servers and measure the level of their centrality. We perform an analysis of nearly 200 million domain names from 1138 gTLDs to answer questions, including: (1) how many domain names are served by leading name server providers? (2) Do leading NS providers share the IP infrastructure? Next, we first describe the dataset, then answer the above questions with the measurement results.

6.1. Dataset

TLD zone file . Our goal in this section is to conduct a large-scale study of the name server usage. To ensure the coverage of domain names, we collected 210,446,494 domain names from 1138 gTLD zone files by the Centralized Zone Data Service (CZDS) [38] on October 19, 2021. While the zone file is dynamic, our goal is to measure the overall usage of name servers, so the zone files we used are enough to answer the above questions. Taken together, as far as we know, our dataset represents the most comprehensive dataset for centrality studies of authoritative name servers.

6.2. Service Provider

To answer the first question, we extracted 210,446,494 domain names and 2,786,562 name servers from 1138 gTLDs. Then, we applied ZDNS [3] to collect the IP addresses of name servers. The detail is shown in Table 5.
Finding 1: More than 48.5% (102,245,486) of domain names depend on the top 10 NS providers. The leading providers maintain an absolute advantage in the DNS market.
As shown in Figure 11, the top 10 NS providers offer service for more than 48.5% of all domain names, with GoDaddy alone serving 24.1% of domain names. Table 6 displays the information of the top 10 NS providers. We defined the i n v a l i d r a t e for calculating the rate of invalid name servers for specific NS providers:
i n v a l i d r a t e = | C 1 | | C |
where C is the set of name servers for NS provider, and C 1 , a subset of C, is the invalid name servers.
Surprisingly, as shown in Table 6, none of the top 10 providers are free from invalid name servers, which means that some name servers cannot provide services. There are possibly two reasons: (1) some name servers whose IP addresses we cannot find are dynamic; (2) NS providers fail to clear the invalid name servers in time. When a name server outages, providers should update the zone file, otherwise may cause other security risks [39].
Finding 2: 21.6% of name server providers rely on just 10 IP providers. Filtering out the invalid IPs from 754,404 IPs of name servers, including 771 private addresses and 29 anycast addresses, we collect the owner information of IPs using MaxMind IPGeoLite2 [35] and finally discover 24,235 IP providers. Table 7 shows the top 10 IP providers. On the one hand, the top 10 IP providers account for 20% of all name server IP addresses we collected. On the other hand, the top 10 IP providers support 21.6% of name server providers.
Finding 3: Name server providers are not independent but interdependent. The A S O column of Table 6 shows the IP provider of each NS provider. As we can see, NS provider Wix relies entirely on Google, and NameBright uses both Google and Amazon. It means that whatever you choose, Wix or NameBright, Google may provide ultimate services for you, which may in turn degrade the redundant configuration of authoritative servers. Moreover, this will produce the implicit dependencies between domain names and IP infrastructure, while unbeknownst to domain owners.

6.3. The Configuration and Behavior of Name Server

Distinguishing the relationship of name servers accurately is a challenging task. After filtering the name servers with the same second-level domain, we sort through the combinations of NS providers manually.
Finding 4: More than 98% of all domain names apply a single name server provider, and even when multiple providers are used, the combination of providers is limited. Compared to 75% revealed by previous studies [21], the rate of domain names that depend on a single name server provider has grown significantly, which shows an increase in the centrality of domain name delegation. We only discovered less than 3 million domain names that configure multiple NS providers. In addition, we found the combination of NS providers is limited, and the top 10 combinations cover more than 50% of domain names that apply multiple NS providers. That is to say that most domain owners tend to choose the same combination of providers. Even if multiple NS providers are selected, it does not mean that they are free from security risks caused by centrality. Table 8 demonstrates the hidden relation of NS providers in the IP infrastructure they rely on, even 6 out of the top 10 combinations share their IP infrastructure.
Finding 5: Invalid NS influences the availability of domain names. Due to 98% of domain names only using one provider, when the i n v a l i d r a t e of NS providers equals 1, we can judge that the domain names cannot be resolved. We found 382,995 NS providers whose i n v a l i d r a t e equals 1, which affects 2,018,181 domain names.
We summarized the possible reasons for the invalid NS:
(1)
Placeholder. Special setting by providers is for certain purposes, such as domain parking and expired domain.
(2)
TLD typo. A typo unintentionally in TLD is caused by the owner of domain names, such as c h u c k . n s . c l o u d f l a r e . c o m m and c r y s t a l v p n . x y z 2 .
(3)
Nonexistent TLD. The owners configure a nonexistent TLD, such as c o r e y . n s . c l o u d f l a r e .
(4)
IP address. The owners configure an IP address as NS records, including normal IP, private IP, and invalid IP.
(5)
Public DNS. The owners apply public DNS as NS records, which may fail to resolve the domain name.
(6)
Replaced or disabled NS. The owners of domain names replace or stop the original NS, but forget to clean the zone file, which may lead to potential security risks [39].

6.4. The Response of Name Server

Typically, the authoritative name servers should not respond to any lookup from domains that are not served by them. We measured the collected authoritative name servers. Table 9 shows the response rcode section of measurement results. As expected, most authoritative name servers REFUSE our lookups, but 51,216 name servers respond with NOERROR. Furthermore, we filtered the empty and resolver doctored responses and obtained 17,628 name servers that respond to correct records, posing potential security risks.
In analyzing the 17,628 authoritative name servers, we found 9,739 servers perform recursive resolution; and 7,889 servers simply forward queries to public DNS or other private iRDNSes. What worries us is that 23 servers belonging to OVH SAS, which is a leading IP infrastructure provider, answer correct responses.
Summary: The results of our analysis are summarized in Figure 12. Nearly half (49%) of all domain names are supported by a few name server providers (Top 10), whose infrastructure is centralized into a small number of IP providers, posing quiet yet fatal threats. It is worrying that the multiple NS providers configuration is rare, and 98% of domain names apply to a single NS provider. The centralization of domain authoritative servers could cause disruptions in domain resolution services. The lesson of Facebook tells us that just relying on a single NS provider is dangerous. We recommend that domain owners employ a more diverse set of authoritative server configurations to reduce the probability of single-point failures, while also preventing the concentration of resolution traffic on a specific service provider.

7. Conclusions

In this paper, we perform a comprehensive and systematic measurement to explore the centrality of DNS infrastructure from both the client-side and server-side. We propose a novel and lightweight resolver pool measurement approach, which is capable of discovering the implicit resolver pool structure in a fast and low-cost manner, after demonstrating the limitation of the CNAME chain-based resolver pool discovery approach. Our measurement results reveal several previously unexplored findings on the centrality of DNS, including the fact that more than 90% of FDNSes forward their queries to 5% of indirect resolvers, and that 48.5% of domain names across 1138 gTLDs are resolved by 0.45% of all name servers, which are operated by only 10 DNS providers. Our findings indicate that DNS infrastructure is much more centralized than previously believed. Furthermore, we investigate the client-side and server-side DNS infrastructure from multi-dimensional perspectives, which helps researchers understand the current DNS ecosystem. As DNS is a core infrastructure of the internet, the trend towards centralization trend requires ongoing attention. We leave Long-term tracking and measurement as future work to reveal the evolution of centralization in the DNS system. Additionally, it is also worth examining how the implementation of new DNS features, such as DoH (DNS over HTTP) and DoT (DNS over TLS), affects the centralization of DNS.

Author Contributions

Conceptualization, C.X. and H.S.; methodology, C.X. and Y.Z.; software, C.X., B.G. and Y.Z.; validation, C.X., Y.Z. and F.S.; formal analysis, H.S.; investigation, Y.L., P.X. and F.S.; resources, H.S., F.S. and Y.L.; data curation, Y.Z., B.G. and F.S.; writing—original draft preparation, C.X. and Y.Z.; writing—review and editing, C.X., H.S., P.X. and Y.L.; supervision, H.S.; project administration, H.S. All authors read and agreed to the published version of the manuscript.

Funding

This research was supported by the National Key Research and Development Program of China (Grant No. 2021YFB3100500).

Institutional Review Board Statement

Not applicable.

Informed Consent Statement

Not applicable.

Data Availability Statement

Not applicable.

Acknowledgments

We thank the anonymous reviewers for their helpful suggestions.

Conflicts of Interest

The authors declare no conflict of interest.

References

  1. Arkko, J.; Trammell, B.; Nottingham, M.; Huitema, C.; Thomson, M.; Tantsura, J.; Ten Oever, N. Considerations on Internet Consolidation and the Internet Architecture. Technical Report, Internet Draft. 2019. Available online: https://tools.ietf.org/html/draft-arkko-iab-internet (accessed on 10 March 2023).
  2. DNS Resolver Centrality. 2019. Available online: https://blog.apnic.net/2019/09/23/dns-resolver-centrality/ (accessed on 9 April 2023).
  3. Radu, R.; Hausding, M. Consolidation in the DNS resolver market–how much, how fast, how dangerous? J. Cyber Policy 2020, 5, 46–64. [Google Scholar] [CrossRef]
  4. Moura, G.C.; Castro, S.; Hardaker, W.; Wullink, M.; Hesselman, C. Clouding up the Internet: How centralized is DNS traffic becoming? In Proceedings of the ACM Internet Measurement Conference, Virtual Event, 27–29 October 2020; pp. 42–49. [Google Scholar]
  5. Consolidation in the Internet Economy. 2021. Available online: https://future.internetsociety.org/2019/ (accessed on 11 December 2021).
  6. Akamai Edge DNS Causes Massive Outage 2021. 2021. Available online: https://constellix.com/news/akamai-edge-dns-causes-massive-outage-2021 (accessed on 11 December 2021).
  7. Numerous Lessons We Can Learn from the Facebook Outage and Its Mistakes. 2021. Available online: https://circleid.com/posts/20211007-numerous-lessons-we-can-learn-from-the-facebook-outage-and-its-mistakes (accessed on 11 December 2021).
  8. EU Wants to Build Its Own DNS Infrastructure with Built-In Filtering Capabilities. 2022. Available online: https://therecord.media/eu-wants-to-build-its-own-dns-infrastructure-with-built-in-filtering-capabilities/ (accessed on 11 May 2022).
  9. De Vries, W.B.; van Rijswijk-Deij, R.; de Boer, P.T.; Pras, A. Passive observations of a large DNS service: 2.5 years in the life of Google. IEEE Trans. Netw. Serv. Manag. 2019, 17, 190–200. [Google Scholar] [CrossRef]
  10. Allman, M. Comments on dns robustness. In Proceedings of the Internet Measurement Conference 2018, Boston, MA, USA, 31 October–2 November 2018; pp. 84–90. [Google Scholar]
  11. Park, J.; Khormali, A.; Mohaisen, M.; Mohaisen, A. Where are you taking me? Behavioral analysis of open dns resolvers. In Proceedings of the 2019 49th Annual IEEE/IFIP International Conference on Dependable Systems and Networks (DSN), IEEE, Portland, OR, USA, 24–27 June 2019; pp. 493–504. [Google Scholar]
  12. Schomp, K.; Callahan, T.; Rabinovich, M.; Allman, M. On measuring the client-side DNS infrastructure. In Proceedings of the 2013 Internet Measurement Conference, IMC 2013, Barcelona, Spain, 23–25 October 2013; Papagiannaki, K., Gummadi, P.K., Partridge, C., Eds.; ACM: New York, NY, USA, 2013; pp. 77–90. [Google Scholar]
  13. Dagon, D.; Lee, C.; Lee, W.; Provos, N. Corrupted DNS resolution paths: The rise of a malicious resolution authority. In Proceedings of the Network and Distributed System Security Symposium, NDSS 2008, San Diego, CA, USA, 10–13 February 2008. [Google Scholar]
  14. Alzoubi, H.A.; Rabinovich, M.; Spatscheck, O. The anatomy of LDNS clusters: Findings and implications for web content delivery. In Proceedings of the 22nd International Conference on World Wide Web, Rio de Janeiro, Brazil, 13–17 May 2013; pp. 83–94. [Google Scholar]
  15. Kührer, M.; Hupperich, T.; Bushart, J.; Rossow, C.; Holz, T. Going wild: Large-scale classification of open DNS resolvers. In Proceedings of the 2015 Internet Measurement Conference, Tokyo, Japan, 28–30 October 2015; pp. 355–368. [Google Scholar]
  16. Pearce, P.; Jones, B.; Li, F.; Ensafi, R.; Feamster, N.; Weaver, N.; Paxson, V. Global measurement of DNS manipulation. In Proceedings of the 26th USENIX Security Symposium (USENIX Security 17), Vancouver, BC, Canada, 16–18 August 2017; pp. 307–323. [Google Scholar]
  17. Liu, B.; Lu, C.; Duan, H.; Liu, Y.; Li, Z.; Hao, S.; Yang, M. Who is answering my queries: Understanding and characterizing interception of the DNS resolution path. In Proceedings of the 27th USENIX Security Symposium (USENIX Security 18), Baltimore, MD, USA, 15–17 August 2018; pp. 1113–1128. [Google Scholar]
  18. Mao, Z.M.; Cranor, C.D.; Douglis, F.; Rabinovich, M.; Spatscheck, O.; Wang, J. A Precise and Efficient Evaluation of the Proximity Between Web Clients and Their Local DNS Servers. In Proceedings of the USENIX Annual Technical Conference, General Track, Berkeley, CA, USA, 10–15 June 2002; pp. 229–242. [Google Scholar]
  19. Gao, H.; Yegneswaran, V.; Jiang, J.; Chen, Y.; Porras, P.; Ghosh, S.; Duan, H. Reexamining DNS from a global recursive resolver perspective. IEEE/ACM Trans. Netw. 2014, 24, 43–57. [Google Scholar] [CrossRef]
  20. Al-Dalky, R.; Schomp, K. Characterization of collaborative resolution in recursive DNS resolvers. In Proceedings of the International Conference on Passive and Active Network Measurement, Berlin, Germany, 26–27 March 2018; Springer: Berlin/Heidelberg, Germany, 2018; pp. 146–157. [Google Scholar]
  21. Hao, S.; Wang, H.; Stavrou, A.; Smirni, E. On the DNS deployment of modern web services. In Proceedings of the 2015 IEEE 23rd International Conference on Network Protocols (ICNP), IEEE, San Francisco, CA, USA, 10–13 November 2015; pp. 100–110. [Google Scholar]
  22. Akiwate, G.; Savage, S.; Voelker, G.M.; Claffy, K.C. Risky BIZness: Risks Derived from Registrar Name Management. In Proceedings of the 21st ACM Internet Measurement Conference, Virtual Event, 2–4 November 2021; pp. 673–686. [Google Scholar]
  23. Arkko, J. Centralised Architectures in Internet Infrastructure. IETF Internet Draft 2019. Available online: https://datatracker.ietf.org/doc/html/draft-arkko-arch-infrastructure-centralisation-00 (accessed on 11 March 2023).
  24. DNS Resolver Centrality. 2021. Available online: https://labs.apnic.net/presentations/store/2021-09-10-hknog-resolver-centrality.pdf (accessed on 11 May 2022).
  25. Internet Centrality. 2021. Available online: https://labs.apnic.net/presentations/store/2021-07-19-centrality.pdf (accessed on 11 May 2022).
  26. Opinion: CDNs and Centrality. 2021. Available online: https://blog.apnic.net/2021/07/02/opinion-cdns-and-centrality/ (accessed on 11 May 2022).
  27. Shue, C.A.; Kalafut, A.J.; Gupta, M. The web is smaller than it seems. In Proceedings of the 7th ACM SIGCOMM Conference on Internet Measurement, San Diego, CA, USA, 24–26 October 2007; pp. 123–128. [Google Scholar]
  28. Zembruzki, L.; Jacobs, A.S.; Landtreter, G.S.; Granville, L.Z.; Moura, G.C. Measuring Centralization of DNS Infrastructure in the Wild. In Proceedings of the International Conference on Advanced Information Networking and Applications, Caserta, Italy, 15–17 April 2020; Springer: Berlin/Heidelberg, Germany, 2020; pp. 871–882. [Google Scholar]
  29. Dell’Amico, M.; Bilge, L.; Kayyoor, A.; Efstathopoulos, P.; Vervier, P.A. Lean on me: Mining internet service dependencies from large-scale dns data. In Proceedings of the 33rd Annual Computer Security Applications Conference, Orlando, FL, USA, 4–8 December 2017; pp. 449–460. [Google Scholar]
  30. Kashaf, A.; Sekar, V.; Agarwal, Y. Analyzing third party service dependencies in modern web services: Have we learned from the mirai-dyn incident? In Proceedings of the ACM Internet Measurement Conference, Virtual Event, 27–29 October 2020; pp. 634–647. [Google Scholar]
  31. Public DNS Server List. 2022. Available online: https://public-dns.info/ (accessed on 11 May 2022).
  32. Durumeric, Z.; Wustrow, E.; Halderman, J.A. ZMap: Fast Internet-wide Scanning and Its Security Applications. In Proceedings of the 22nd USENIX Security Symposium (USENIX Security 13), Washington, DC, USA, 14–16 August 2013; pp. 605–620. [Google Scholar]
  33. Wan, G.; Izhikevich, L.; Adrian, D.; Yoshioka, K.; Holz, R.; Rossow, C.; Durumeric, Z. On the Origin of Scanning: The Impact of Location on Internet-Wide Scans. In Proceedings of the IMC ’20: ACM Internet Measurement Conference, Virtual Event, 27–29 October 2020; ACM: New York, NY, USA, 2020; pp. 662–679. [Google Scholar] [CrossRef]
  34. ZDNS. 2021. Available online: https://github.com/zmap/zdns (accessed on 11 December 2021).
  35. Maxmind. 2021. Available online: https://www.maxmind.com/en/home (accessed on 11 December 2021).
  36. Warf, B. Geographies of global Internet censorship. GeoJournal 2011, 76, 1–23. [Google Scholar] [CrossRef]
  37. Google Public Dns Resolver Pool. 2022. Available online: https://www.gstatic.com/ipranges/publicdns.json (accessed on 11 May 2022).
  38. Centralized Zone Data Service. 2021. Available online: https://czds.icann.org/home (accessed on 11 December 2021).
  39. The International Incident—Gaining Control of a .int Domain Name with DNS Trickery. 2021. Available online: https://thehackerblog.com/the-international-incident-gaining-control-of-a-int-domain-name-with-dns-trickery/index.html (accessed on 11 December 2021).
Figure 1. Basic model of the public DNS.
Applsci 13 05739 g001
Figure 2. Excerption of CNAME configuration. The direction of the arrow indicates the chain of different CNAMEs. The red arrows represent CNAME chains from a.com to b.com, while the blue arrows represent CNAME chains from b.com to a.com.
Applsci 13 05739 g002
Figure 3. CNAME chain resolution patterns. IP0, IP1, …, and IPn represent different resolvers in a resolver pool. The interaction processes between different resolvers and ADNS are depicted in different colors.
Applsci 13 05739 g003
Figure 4. Client-side DNS infrastructure measurement architecture.
Applsci 13 05739 g004
Figure 5. Resolver pool measurement method.
Applsci 13 05739 g005
Figure 6. Cumulative distribution of iRDNSes and FDNSes. The x-axis is descendingly sorted by the number of served FDNSes.
Applsci 13 05739 g006
Figure 7. iRDNS distribution and backed FDNS of Google Public DNS.
Applsci 13 05739 g007
Figure 8. Sankey diagram of resolver pool and its geographic location for Google Public DNS.
Applsci 13 05739 g008
Figure 9. Geographic distribution of FDNS backed by Google Public DNS.
Applsci 13 05739 g009
Figure 10. Geographic Distribution of FDNS backed by Iran Telecommunication.
Applsci 13 05739 g010
Figure 11. Distribution of NS provider service coverage.
Applsci 13 05739 g011
Figure 12. Centrality of domain name, NS, and IP provider.
Applsci 13 05739 g012
Table 1. CNAME chain resolution patterns of public DNSes.
PatternPublic DNS
Multi-RDNSIPGoogle, Level3
Single-RDNSOpenDNS, Cloudflare, Dyn, Verisign, Norton,
114DNS, DNS Watch, SafeDNS, Comodo,
Clearbrowsing, Freenom World, DNS Advantage
Multi-QueryQuad9, Tencent, AliDNS, Yandex, AdGuard DNS, DNSDB
Table 2. Comparison of resolver pool discovery methods.
MethodologyDistributed Measurement PlatformCNAME ChainOur Method
MechanismsPublic DNS assigns various backend resolvers to users based on their geographical locations.Public DNS initiates CNAME record queries using different backend resolvers.Open forwarders carry the RD flag when forwarding requests.
ConditionResearchers need authorization from the measurement platform.Researchers need to control authoritative name servers to construct CNAME chains.Researchers need to control authoritative servers to build NS chains.
Measurement ScopePublic DNS.Public DNS that meets specific conditions.Public DNS.
Table 3. Overview of measurement results.
RoundFDNSdRDNSiRDNS
R2 #R1 #R2 #R1 #R2 #R1 #
12,422,6185,582,38351,22358,02855,10964,136
22,045,2575,309,41842,47155,11651,97863,410
32,327,2875,217,28548,32454,71254,69863,988
42,331,8085,250,10147,49854,96954,00763,535
52,370,0495,266,89849,22455,80554,64063,692
62,256,6635,205,24344,93555,00953,25064,128
72,288,8125,129,97547,15654,13954,01763,185
82,376,1065,293,39646,32755,38753,73263,917
92,350,6995,117,81544,91452,88153,15063,071
102,339,0425,179,78348,87355,07154,53563,376
Table 4. Top five resolver pools.
DNS SPResolver/24 #Resolver #Resolver per/24 #FDNS #
Google110227420.674,272,808
114DNS1556254.032,877,600
Level37493712.66306,539
Cloudflare263859332.67284,188
OpenDNS424199.98257,962
Total64412,84819.957,646,226
Table 5. The domain name information.
Data Type#
domain name210,446,494
name server2,786,562
name server zone1,123,511
name server IP754,404
Table 6. Top 10 name server providers.
Name Server ProviderNS #IP #Domain Name #Invalid RateASO
GoDaddy1809750,807,8910.44Host Europe GmbH; GO-DADDY
Cloudflare150028219,420,3400.32CLOUDFLARENET
DNS.COM94746,826,2900.39 S 1 a
Google95366,716,2540.58Google
Namecheap3071326,713,3150.26 S 2 b
HiChina701135,700,1300.40Hangzhou Alibaba Advertising Co., Ltd.
Wix139125,463,0900.03Google
IONOS6075684,067,6550.08IONOS SE; Fasthosts Internet Limited
NameBright20464,057,9600.10Google; AMAZON-AES
Network Solutions108242,472,5610.07CLOUDFLARENET;
NETWORK-SOLUTIONS-HOSTING
S 1 a : NAMECHEAP-NET; ULTRADNS; Online S.a.s.; OVH SAS; AMAZON-02; RELIABLESITE; AS40676; Seflow S.N.C. Di Marco Brame & C. S 2 b : ZEN-ECN; China Mobile Communications Group Co., Ltd.; CHINA UNICOM China169 Backbone; WeiYi Network Technology Co., Ltd.; Xiamen; CHINANET SHAANXI province Cloud Base network; AS Number for CHINANET Jiangsu province backbone; China Unicom Beijing Province Network; CHINANET Guangdong province network.
Table 7. Top 10 IP infrastructure providers.
IP ProviderIP #NS Provider #
OVH SAS55,69370,097
UNIFIEDLAYER-AS-145,62940,423
Hetzner Online GmbH28,44132,507
AMAZON-0214,01325,847
DIGITALOCEAN-ASN13,46818,649
LIQUIDWEB12,29812,751
PRIVATESYSTEMS11,3438036
IONOS SE10,1309874
CLOUDFLARENET10,07113,127
Linode, LLC932911,199
Table 8. Top 10 combinations of NS providers.
Combination of NS ProvidersDomain Name #Shared Name ServerShared IP Provider
nsone.net; squarespacedns.com1,393,701--
dnsnw.com; nagor.cn; nagor.com.cn53,756DNSPOD.NET-
dan.com; undeveloped.com29,444CLOUDFLARE.COMAMAZON-02
worldnic.com; register.com19,346-NETWORK SOLUTIONS HOSTING
72dns.com; idc1.cn15,88272DNS.COMWeiYi Network Technology Co.,Ltd
beonintermedia.com; jagoanweb.com;
jagoanhosting.com
14,258-PT. Beon Intermedia
cdnhost.cn; dnsfamily.com12,246DNSFAMILY.COMChinanet
ultradns.{org; com; net; biz}; nsone.net12,023--
nsone.net; cloudflare.com11,798--
babies-fluffy.com; form-potato.com8818DNSV.JPARTERIA Networks Corporation
Table 9. Response rcode distribution.
Rcode#
5 (REFUSED)545,941
0 (NOERROR)51,216
2 (SERVFAIL)12,095
3 (NXDOMAIN)3517
9 (NOTAUTH)481
4 (NOTIMP)42
10 (NotZone)4
1 (FORMERR)1
Disclaimer/Publisher’s Note: The statements, opinions and data contained in all publications are solely those of the individual author(s) and contributor(s) and not of MDPI and/or the editor(s). MDPI and/or the editor(s) disclaim responsibility for any injury to people or property resulting from any ideas, methods, instructions or products referred to in the content.

