Article

Physiological Study of Visual and Non-Visual Effects of Light Exposure

1
Graduate School of Science and Technology, Keio University, Yokohama 223-8522, Japan
2
Department of Mechanical Engineering, Keio University, Yokohama 223-8522, Japan
*
Author to whom correspondence should be addressed.
Appl. Sci. 2023, 13(9), 5785; https://doi.org/10.3390/app13095785
Submission received: 10 February 2023 / Revised: 19 April 2023 / Accepted: 5 May 2023 / Published: 8 May 2023
(This article belongs to the Section Applied Neuroscience and Neural Engineering)

Abstract

:
Light simultaneously induces visual and non-visual effects. Although the differences in the spectral sensitivity of intrinsic photosensitive retinal ganglion cells induce opposing influences on physiological responses, it is difficult to independently measure only non-visual effects. Therefore, the reported effects of light color on physiological responses are inconsistent. This study aimed to clarify the visual and non-visual effects of light color on physiological responses. Three different conditions were employed to construct a lighting environment in which light colors were difficult to perceive due to chromatic adaptation and change blindness: constant white light (baseline condition), a gradual transition from white to blue light, and a gradual transition from white to red light. The physiological responses (brain activity, heart rate variability, and electrodermal activity) of 21 participants were measured with and without light color perception. The results suggested that blue light causes more non-visual effects compared to red light as blue light induces brain activation in some regions of the PFC (p < 0.05) and increases sweating, although the differences were not statistically significant. A mean comparison suggested that the visual effects of blue light showed tendencies toward a calming role for the prefrontal cortex and inhibition of sweating, but the differences were not statistically significant. Another mean comparison suggested that the visual effects of red light tended to enhance sweating, but the differences were not statistically significant. Visual and non-visual effects did not cause significant differences in heart rate variability. Additionally, a mean comparison did not reveal any significant tendencies.

1. Introduction

Light induces both visual and non-visual effects on humans [1]. Visual effects are processed in the visual cortex of the brain via the lateral pallidum. These are accompanied by the perception of light color and a subjective impression of light, directly affecting emotion [2]. In fact, humans perceive physical characteristics such as the size, shape, and motion direction of objects through light. Such visual perception not only changes emotions but also influences human psychology and physiology [2,3]. Red light is reported to have a more arousing effect than blue light [2,4,5]. In contrast, non-visual effects are processed in the hypothalamus via the suprachiasmatic nucleus and the preoptic area. These effects do not involve the perception of light colors. Physical characteristics such as light intensity and wavelength affect physiology [6]. In fact, humans regulate circadian rhythms by detecting the physical characteristics of light, impacting self-reported arousal [6,7], heart rate [8], body temperature [8,9], brain activity [7], hormone secretion [10], and performance in cognitive tasks [11,12]. Unlike visual effects, the non-visual effects of blue light are reported to have a more arousing impact than those of red light due to the intrinsic photosensitive retinal ganglion cells (ipRGCs), which respond strongly to blue light [7,12,13]. Previous studies [3,7,8,12] have suggested that blue light impacts the human arousal level (arousal/sedation). However, some studies [14,15,16] have shown the opposite results (arousal effects from red light). The difference may be due to the perceived color of light.
In general, human emotions are quantified using sensory evaluations and physiological responses. Although subjective, sensory evaluations directly measure the psychological state. However, individual differences between participants are influenced by their personal preferences [17]. In contrast, physiological responses indirectly but objectively measure the psychological state. Previous studies on the emotions generated by light have measured physiological responses (e.g., brain activity [18,19], heart rate [5,20], and electrodermal activity [5,21]).
This study aimed to distinguish and clarify visual and non-visual effects. To compare physiological responses with and without light color perception, a lighting environment where it was difficult to perceive light colors due to chromatic adaptation and change blindness was constructed. Knowledge about these effects can be applied to the development of lighting devices to control users’ arousal without considering their color preference (e.g., lighting devices used in space stations for controlling circadian rhythms and in working offices for improving work efficiency).
The rest of this paper is organized as follows. Section 2 details the method used to measure and analyze the physiological responses. Section 3 describes the experiment on the visual and non-visual effects of light exposure, while Section 4 provides conclusions.

2. Measurements of Physiological Responses

2.1. Brain Activity

Detecting the electrical and temporal changes associated with the electrical activity of neurons in the brain and the changes in blood in the cerebral blood vessels associated with the same activity can be used to evaluate brain activity. The former method includes electroencephalograms (EEGs) and magnetoencephalogram (MEGs). The latter method includes functional magnetic resonance imaging (fMRI) and near-infrared spectroscopy (NIRS) [22]. Compared to other brain activity devices, NIRS has three advantages. First, it has fewer physical restraints. Second, its relatively high temporal and spatial resolutions allow measurements focused on the prefrontal cortex activity that reflects arousal. Third, electromagnetic fields do not need to be managed, and the surrounding environment does not need to be limited. NIRS, which measures changes in oxygenated hemoglobin (ΔoxyHb) concentration, has been used in many studies regarding light and color [18,19,23,24].
This study employed NIRS to measure brain activity. The NIRS device was an OEG-SpO2 (Spectratech, Tokyo, Japan) (Figure 1a). The sampling frequency of the device was 6.1 Hz. The device has six light emitters and six photodetectors. It can measure a total of 16 channels (Chs) corresponding to the prefrontal cortex (Figure 1b,c). The measured ΔoxyHb signals were analyzed using four methods: (ⅰ) a digital filter, ≤0.1 Hz passband [25]; (ii) baseline correction [26]; (iii) the hemodynamic isolation method [27]; and (iv) standardization (calculating z-scores) [28].

2.2. Heart Rate Variability

The fluctuation of the R wave interval (R–R interval (RRI)) can be used to calculate heart rate variability. The RRI is divided into a low-frequency component (LF) of 0.05–0.15 Hz and a high-frequency component (HF) of 0.15–0.40 Hz. LFs and HFs are derived from sympathetic and parasympathetic activities and from parasympathetic activity only, respectively. Therefore, the ratio of LF to HF (LF/HF) components can be used to quantify the balance between sympathetic and parasympathetic activities [29].
This study used the LF/HF ratio to evaluate the arousal level (the sympathetic nerve was dominant). Participants wore a wearable heart rate sensor (my Beat; UNION TOOL, Tokyo, Japan). The sampling frequency of the device was set to 1000 Hz. For participants who were less than or more than 170 cm tall, the positions of the attachment were 80 mm and 100 mm below the center of the clavicle on the left chest, respectively. The measured LF/HF ratio was standardized (z-scores) for each participant [30].

2.3. Electrodermal Activity

Electrodermal activity (EDA) is the change in the conductivity and resistivity of the skin surface associated with sweating. Generally, sweating due to the activity of eccrine sweat glands increases electrical conductivity and decreases resistivity [31]. The skin conductance level (SCL) shows long-term variations in skin conductance. The SCL increases due to sympathetic activation with increased stress and arousal [32].
This study used the SCL to evaluate arousal level (sympathetic activity). The EDA sensor was a BiTalino (PLUX, Tokyo, Japan). The sampling frequency of the device was set to 100 Hz, and the position of the attachment was on the palm [31]. The measured SCL was standardized (z-scores) for each participant [33].

3. Experiment on Visual and Non-Visual Effects of Light Exposure

3.1. Methods

The participants were 21 undergraduate and graduate students in their 20s (20 males and 1 female, mean age = 22.0, SD = 0.93). We removed the data for one participant due to a measurement problem (the adhesive failure of a probe) and analyzed the data for 20 participants (19 males and 1 female, mean age = 22.1, SD = 0.92). The number of the participants was chosen to be equal to or more than those of conventional studies [4,7,11,12,14]. The Ishihara color vision test chart [7,34] was used to verify the absence of color blindness. In addition, the Edinburgh dominant hand experiment [35] was used to confirm that the participants were right-hand dominant. To verify that the participants had similar habits, we confirmed that they did not smoke, had not taken any medications within 2 weeks, had not traveled to a location with a time difference within 3 months, had not worked night shifts, and had slept 7–8 h on a habitual schedule for 1 week before the experiment [7,8,9,36]. The participants were instructed not to eat for 2 h prior to the experiment and not to consume alcohol, caffeine, or supplements for 12 h prior to the experiment as these can affect physiological responses [6,7,11]. Before the experiment, we explained the purpose and method of the experiment and related safety issues. Then, each participant provided informed consent. After the experiment, each participant was paid JPY 1050 per hour for their time.
We used red and blue light with visual and non-visual effects that have been confirmed to be contrastive in conventional studies [2,4,5,14,16] and white light as a control condition. The illumination conditions were selected based on six lighting characteristics that caused non-visual effects in previous studies:
(I)
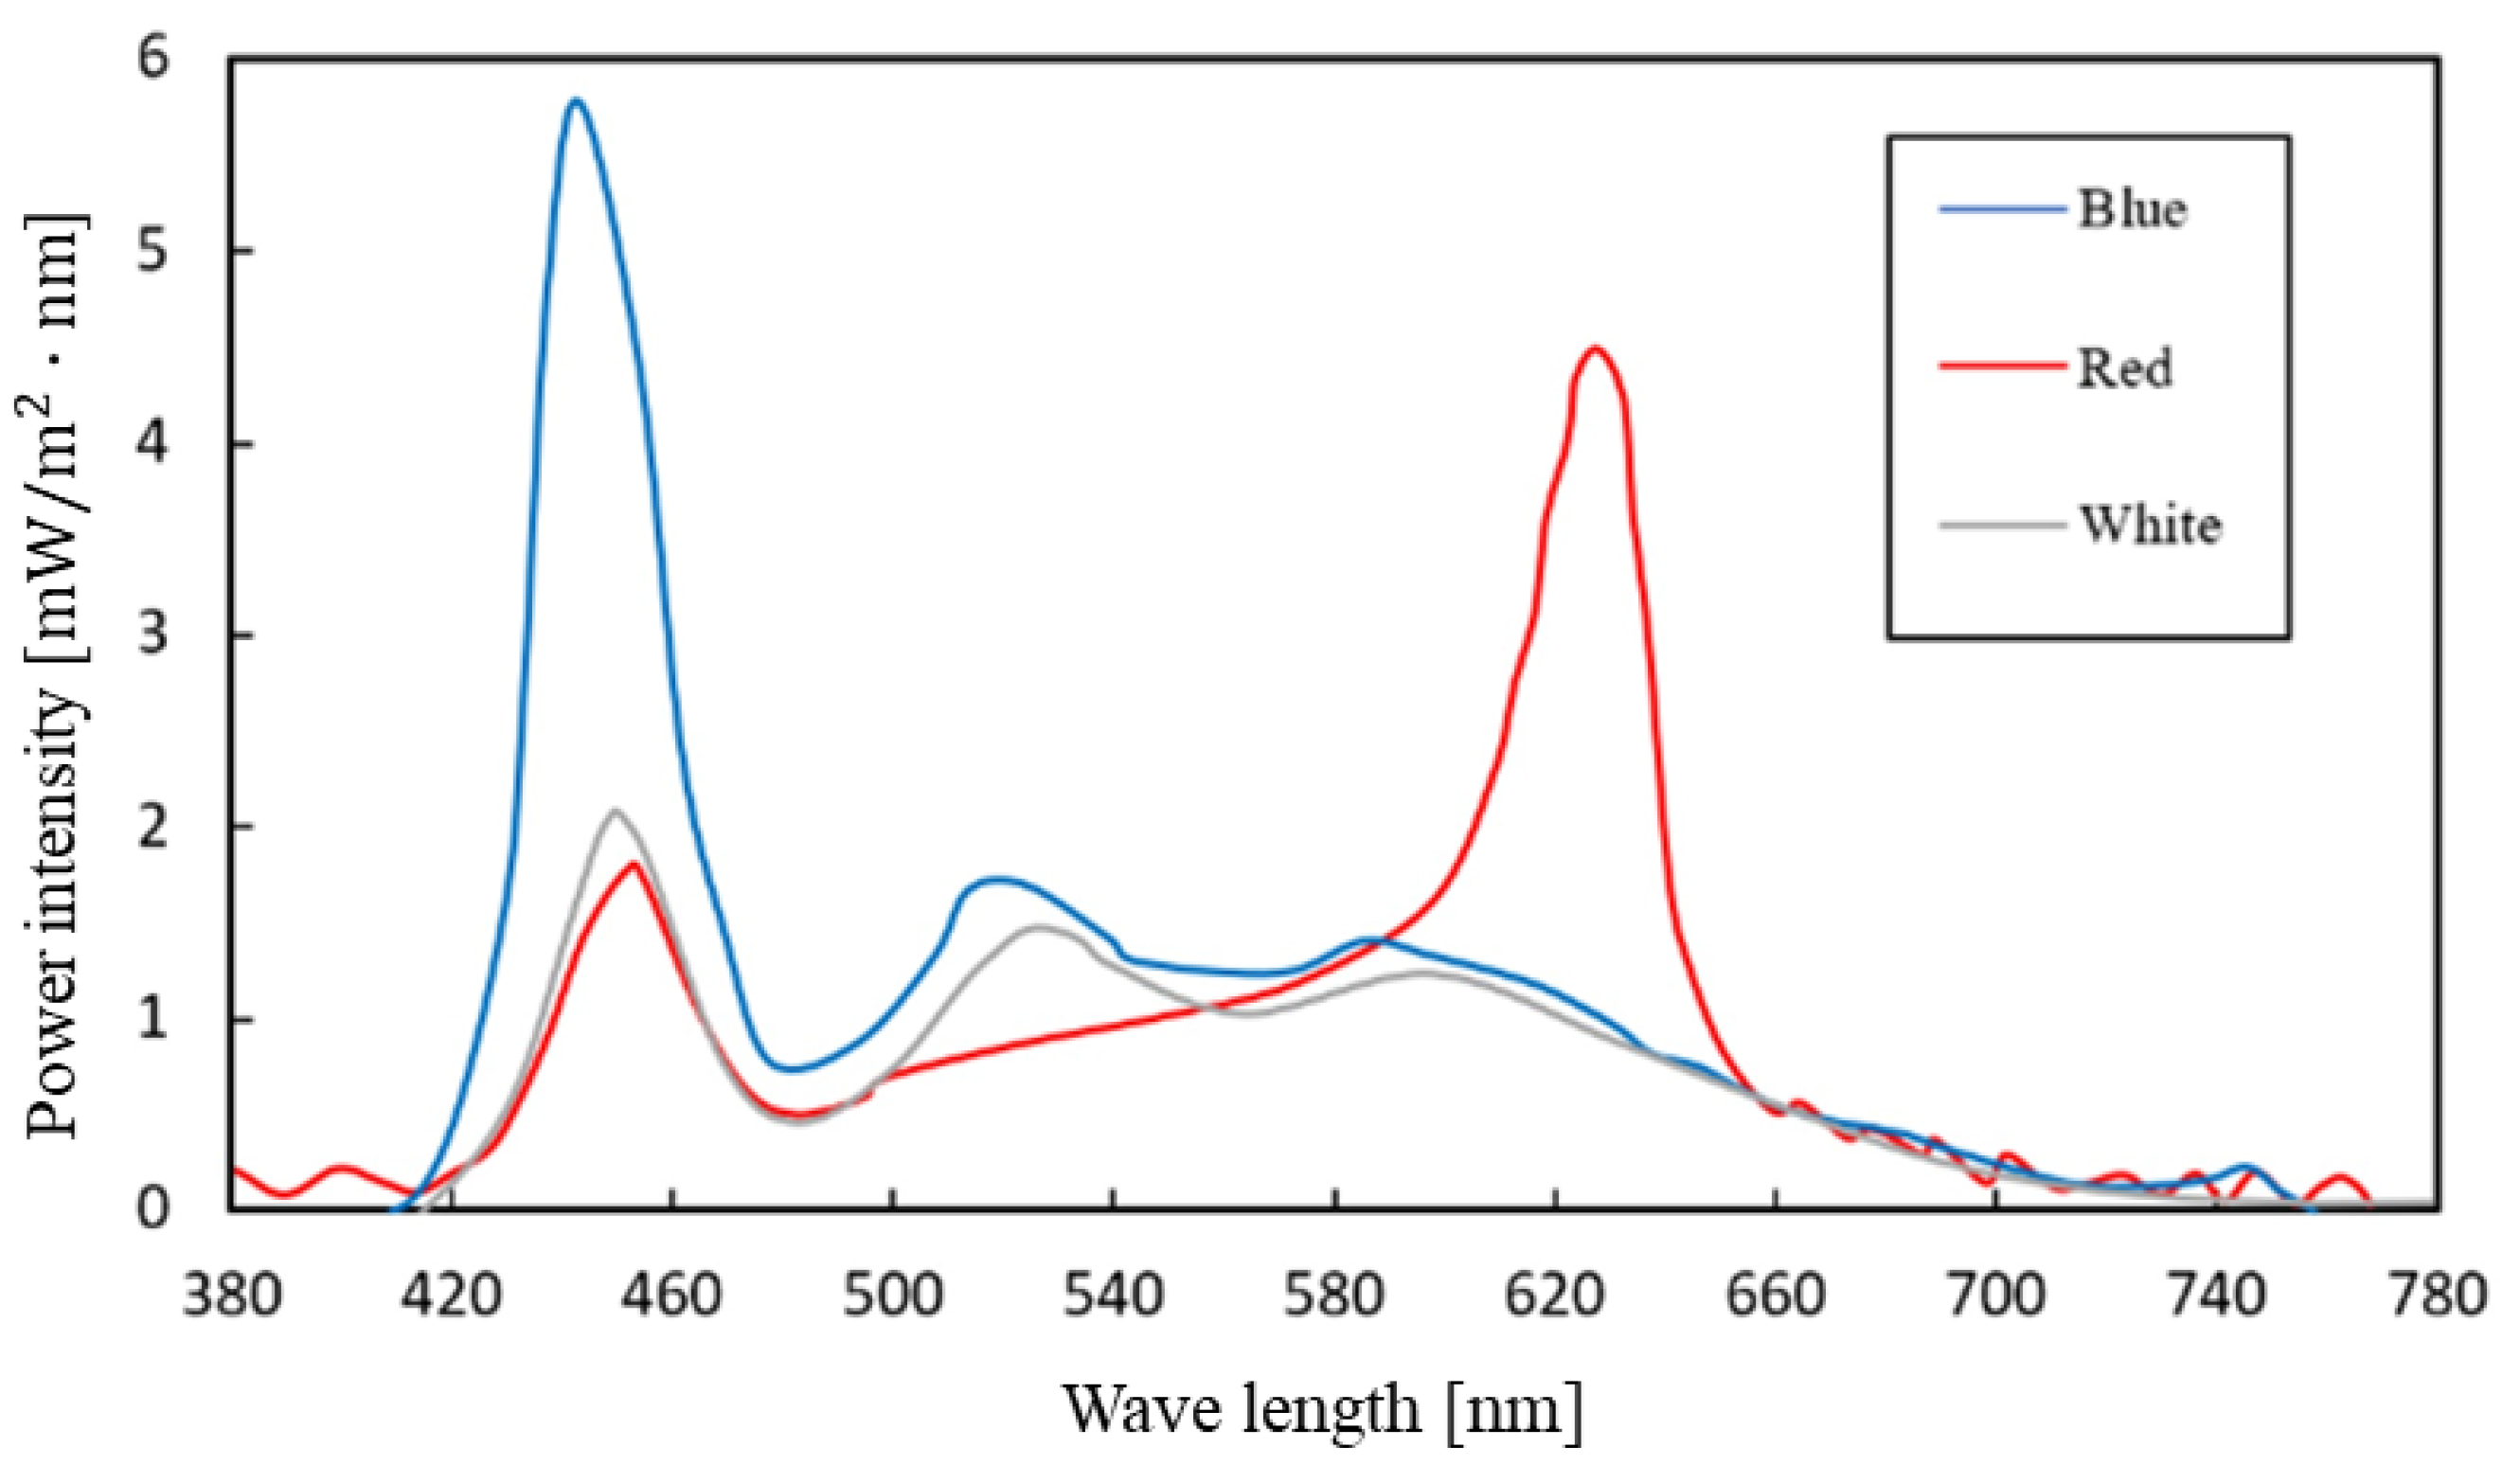
Spectrum: According to a previous study [37] that investigated the spectral power of monochromatic blue light and the percentage of change in the suppression of melatonin secretion, the spectrum must have a short-wavelength component of at least 20 μW/cm2 to produce non-visual effects. In contrast, this study employed blue, red, and white (baseline condition) light. The light color spectra had to be difficult to perceive but sufficient to produce the visual effects. Spectra were measured with a C-7000 spectrometer (SECONIC, Tokyo, Japan) (Figure A1);
(II)
Illuminance: Illuminance had to be sufficiently high to affect arousal level but low enough not to induce a perceivable change in light color. According to a previous study [36] investigating the relationship between illuminance and arousal level (subjective arousal level using the percentage of suppressed melatonin secretion), the arousal level increased at around 70 lx (illuminance at the cornea) and reached an intermediate arousal level at 90–180 lx. Therefore, we set the illuminance to 90 lx at the corneal position;
(III)
Irradiation time period: The irradiation time period was set based on the following: (i) participants’ sleep habits; (ii) under appropriate lighting conditions, non-visual effects during the daytime may affect arousal level, performance, etc.; and (iii) irradiating light with a large short-wavelength component at night may lead to sleep disorders [38]. In this study, the irradiation time period was set as 10:00 to 17:00;
(IV)
Irradiation duration: Previous studies [6,16] indicated that non-visual effects could be observed after 12 min of irradiation. Additionally, the effect on arousal level was independent of the length of irradiation time if it was longer than 12 min. Therefore, we set the irradiation duration to 20 min in consideration of fatigue and to ensure a sufficient irradiation time for the onset of the non-visual effects;
(V)
Spatial distribution: Previous studies [39,40,41] revealed that non-visual effects depend on the retinal area irradiated by light. In this study, the light source was located behind the participant so that the entire visual field was illuminated through the wall (i.e., the entire retina was uniformly illuminated);
(VI)
Lighting environment: We focused on chromatic adaptation and change blindness to create an environment that made it difficult to perceive changes in light color. Chromatic adaptation is a characteristic where the sensitivity to a certain light color decreases as the color continues to be viewed [42]. In contrast, change blindness is a perceptual phenomenon in which an observer does not notice a change in a visual stimulus when they are focused or distracted by another visual stimulus [43]. On the basis of these two characteristics, the light color (spectrum) was changed gradually [44], and the participant undertook a task to distract them from the color change [45].
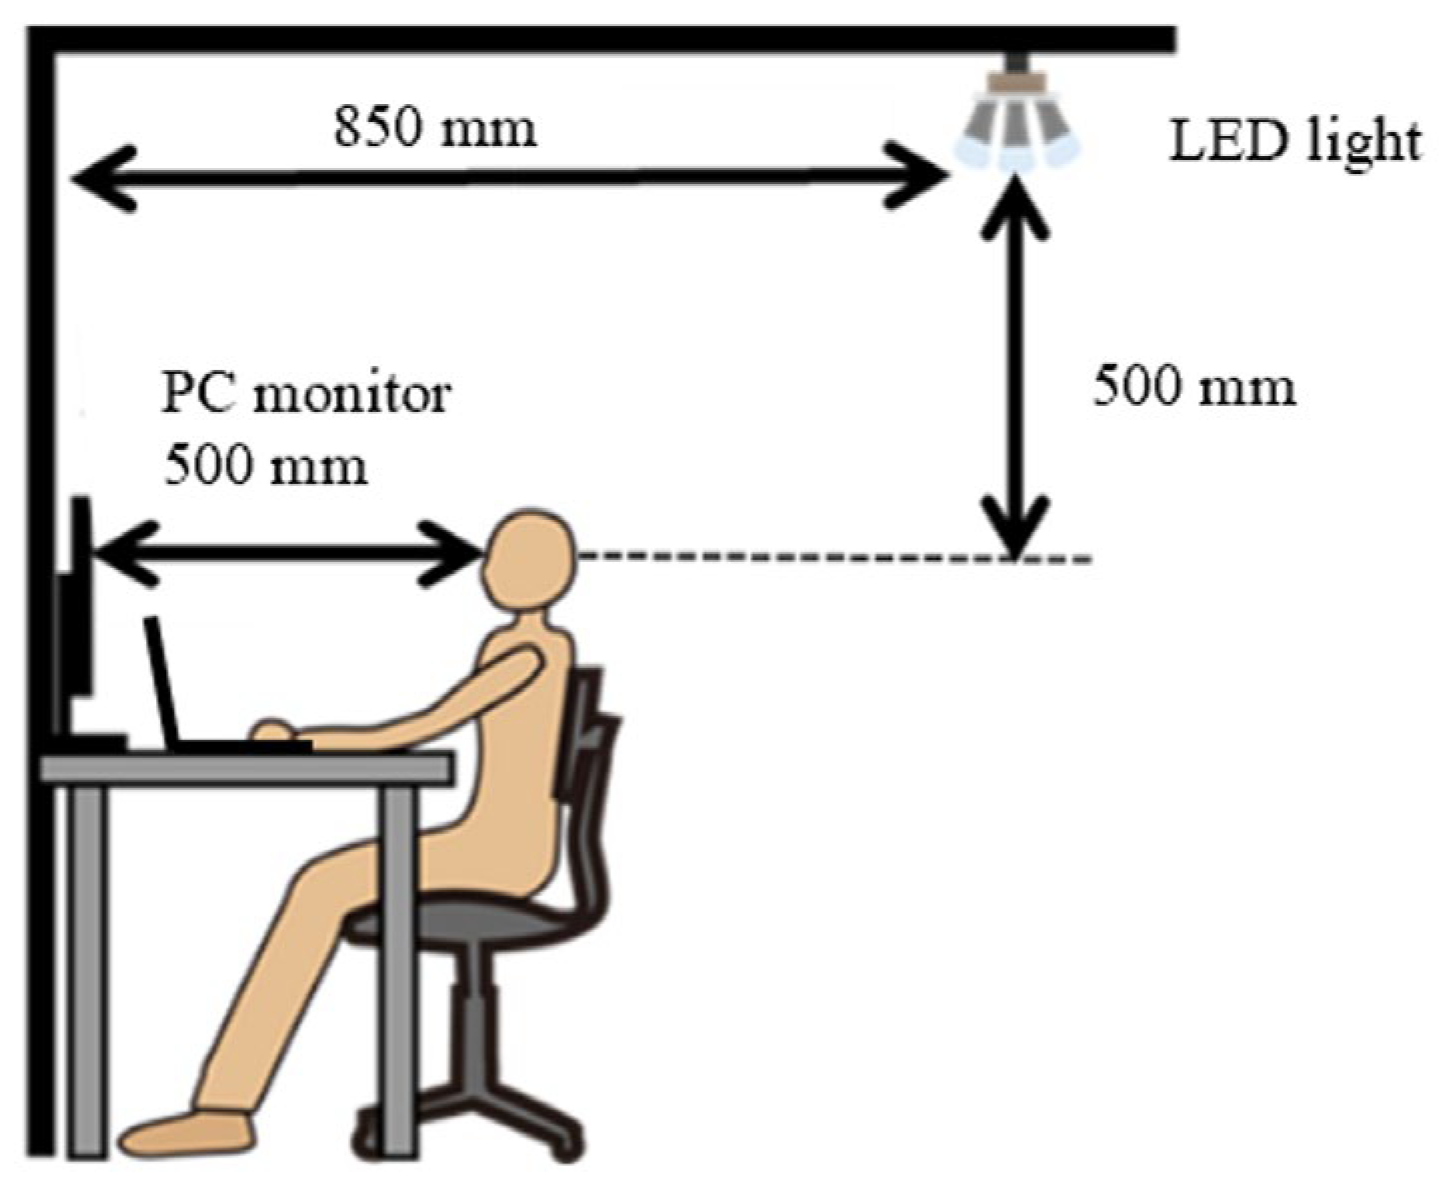
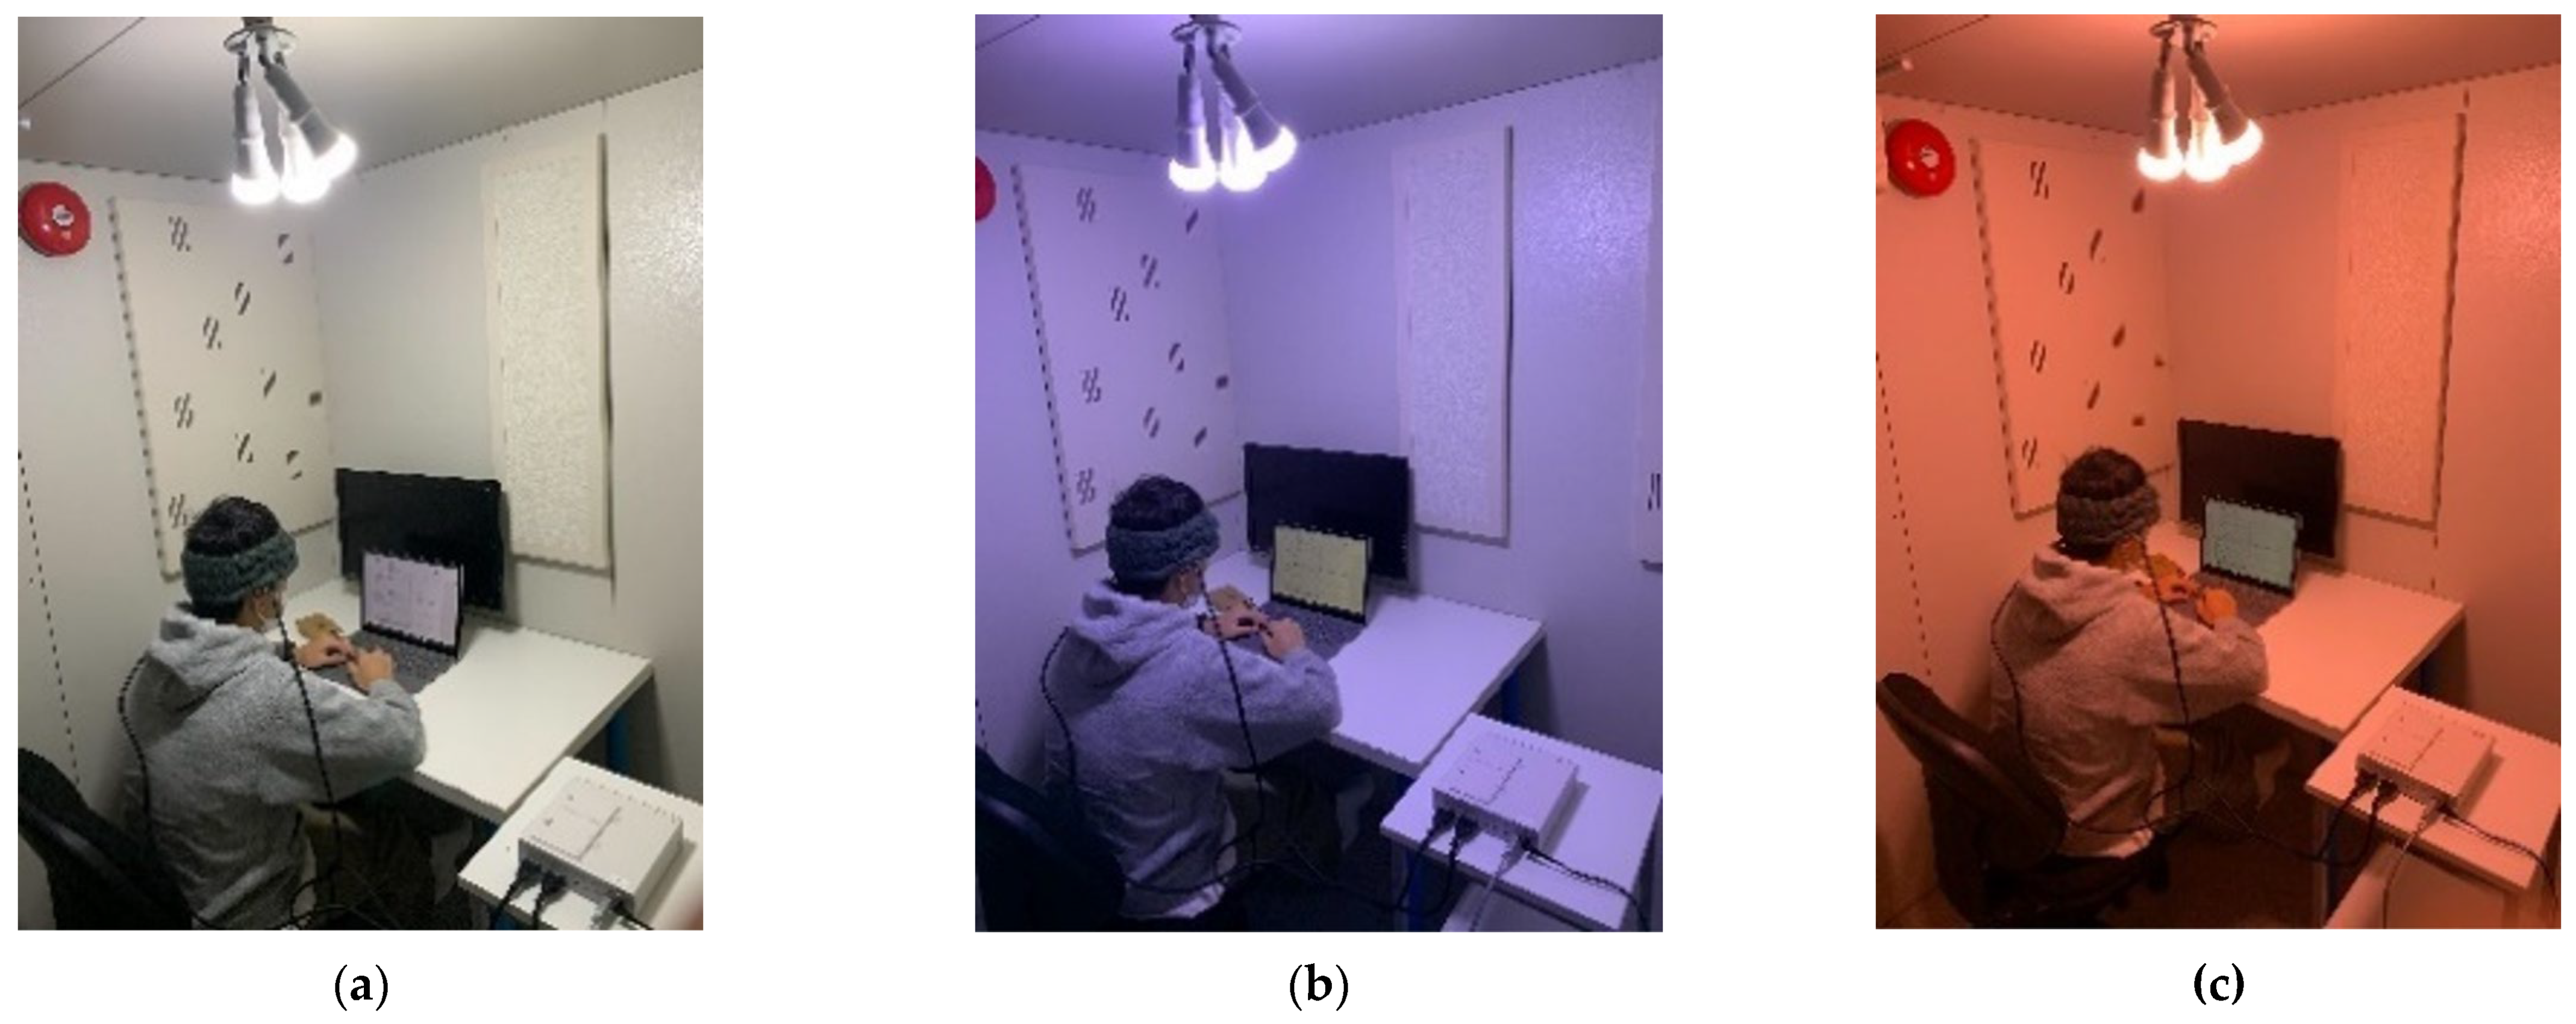
We asked each participant to use a PC or to read a book as tasks that required attention because our previous experiments suggested that tasks typically used in psychological experiments (e.g., the psychomotor vigilance task and visual search task) make participants sleepy and result in fluctuations in physiological responses. We used a monitor to provide the instructions during the experiment. The light emitted by the PC and monitor was too weak to affect the illuminance at the corneal position (Figure A2). Tasks involving sound were prohibited. To mitigate the impact of external noise on physiological responses [46], the experiment was conducted in a soundproof room (AMCVC25H; Yamaha, Shizuoka, Japan). The lighting device was a Hue White and Color Ambiance device (A60; Philips, Tokyo, Japan), and the light color was changed by specifying the chromaticity coordinates. Figure 2 depicts the positional relationship of the participants and devices. The positional relationship was chosen to ensure that the illuminance values of the LED light and PC monitor were approximately 90 lx and 1 lx at the corneal position. Figure 3 shows an actual image of a participant in each of the light color conditions. The temperature and humidity in the room were kept at 22 °C and 50% so that the temperature humidity index [47] was 65–70 (comfortable).
Figure 4 provides an overview of the experimental flow. The participants were initially exposed to the steady white light, which was followed by a blue/red transition light leading to a blue/red steady light. The order of the colors (blue/red) was randomly set. The transition and steady light were irradiated for 900 and 1200 s, respectively. The color of the transition light gradually changed from white (0.31271, 0.32902, 0.35827) to blue (0.25163, 0.21741, 0.53096) or red (0.42203, 0.31552, 0.26245) based on the XYZ color system. To prevent color afterimage effects (complementary color afterimage) from influencing physiology, the illumination was darkened for 120 s (illuminance at the cornea was less than 2 lx) after the end of each constant light. To stabilize the physiological response, constant white light was given as a control. After all the irradiations were completed, we asked participants whether they perceived a change in light color and, if a change was perceived, which color (white, blue, or red) changed.

3.2. Results and Discussion

3.2.1. Light Color Perception

We divided the participants into groups based on the perceived light color change (blue or red). The participants who correctly identified the blue light, correctly identified the red light, incorrectly identified the blue light, and incorrectly identified the red light were classified as BV (blue visual effects), RV (red visual effects), BNV (blue non-visual effects), and RNV (red non-visual effects), respectively. Table 1 summarizes the classification of the participants. Nine participants failed to perceive blue light and five failed to perceive red light. This suggests that the experimental environment made it difficult to perceive light colors. The physiological responses were compared between the following groups: (I) BV vs. RV, (II) BNV vs. RNV, (III) BNV vs. BV, and (IV) RNV vs. RV.

3.2.2. Brain Activity

This study calculated the deviations in ΔoxyHb for 1200 s (0–1200 s in constant light) from the average for 30 s (120–150 s in constant light). The mean was defined as a representative value. The representative values were compared using the Mann–Whitney U test.
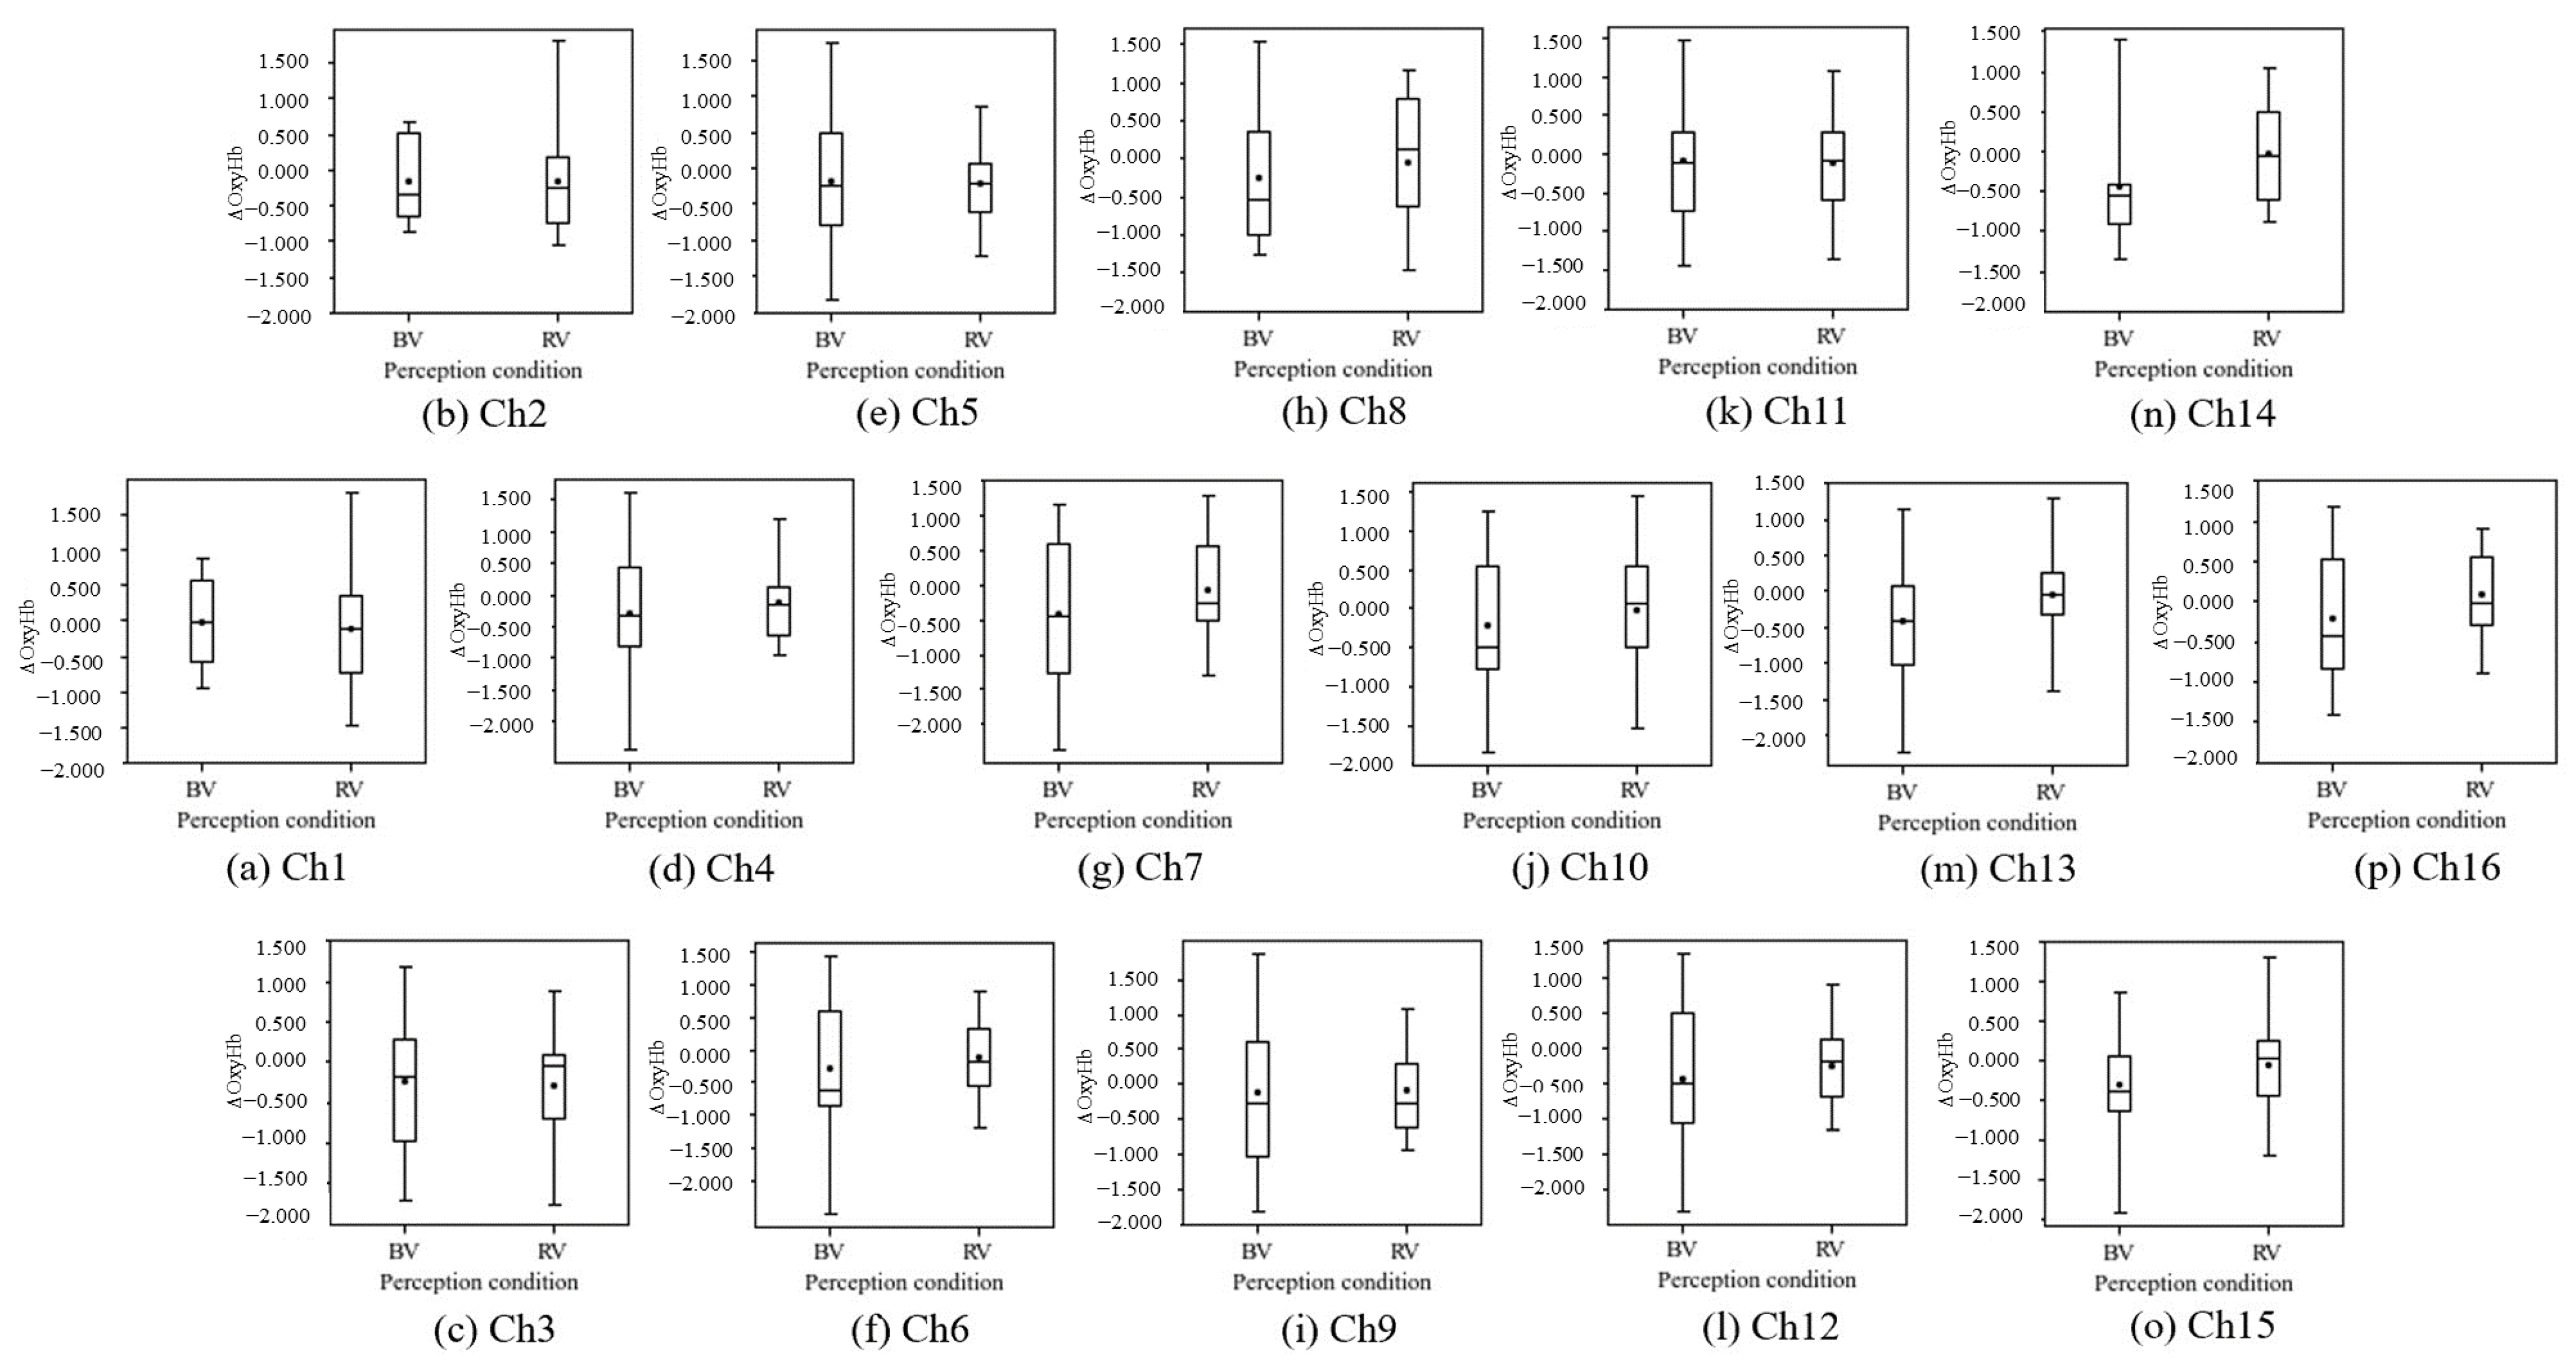
Figure 5 shows the results for comparison (I). ΔoxyHb in the RV condition had a higher mean than that in the BV condition in 13 of the 16 measured channels. However, the differences were not significant. Ch14 had a relatively large mean difference with a significance probability of p = 0.14. This was likely due to the visual effects of red light [2,4,5], suggesting that the perception of red light may contribute to arousal.
Figure 6 shows the results for comparison (II). Although none of the channels showed significant differences, ΔoxyHb in the BNV condition had higher means than that in the RNV condition in most channels (13 out of 16). Ch14 and Ch15 had relatively large mean differences with significance probabilities of p = 0.14 and p = 0.18, respectively. This was likely due to the non-visual effects of blue light [7,12,13], suggesting that the physical characteristics, such as the large short-wavelength component, of blue light may contribute to arousal.
Figure 7 shows the results for comparison (III). Significant differences at the 5% level were confirmed in Ch14 and Ch15 (p = 0.03), as denoted by the asterisk (*). All channels had higher means for ΔoxyHb in the BNV condition than in the BV condition in all channels. Relatively strong trends were observed in Ch2, Ch13, and Ch16 (p = 0.08, p = 0.13, and p = 0.11, respectively), which were likely due to the non-visual effects of blue light [7,12,13], implying that the physical characteristics, such as the large short-wavelength component, of blue light may contribute to arousal. Furthermore, the visual effects suggest that the perception of blue light may contribute to sedation.
Figure 8 shows the results for comparison (IV). Although none of the channels showed significant differences, ΔoxyHb in the RV condition was higher than that in the RNV condition for 6 of the 16 channels. This may have been due to the influence of personal preferences regarding light color, which increased the variation in the visual effects. This is evidenced by the greater variation in the visual effects than in the non-visual effects for all channels in Figure 7 and for 15 of the 16 channels in Figure 8.

3.2.3. Heart Rate Variability

As the standard heart rate is 60–100 beats per minute, data for the period from 600 to 1000 ms in the measured RRI were used in the analysis. The LF/HF ratio was calculated using the RRI data for the relevant previous 60 s. Then, a Mann–Whitney U test was performed for each comparison. Data from four participants were excluded from the comparison group because the instrument was disconnected during the experiment or the RRI changed erratically.
Figure 9 shows the results for comparison one. Although a significant difference could not be confirmed (p = 0.65), the LF/HF ratio in the RV condition had a higher mean than that in the BV condition (four of the seven participants with visual effects for both light colors had higher means for red light than for blue light). This was likely caused by the visual effects of red light [2,4,5], suggesting that the perception of red light may contribute more to the sympathetic nerve achieving a predominant state compared to blue light.
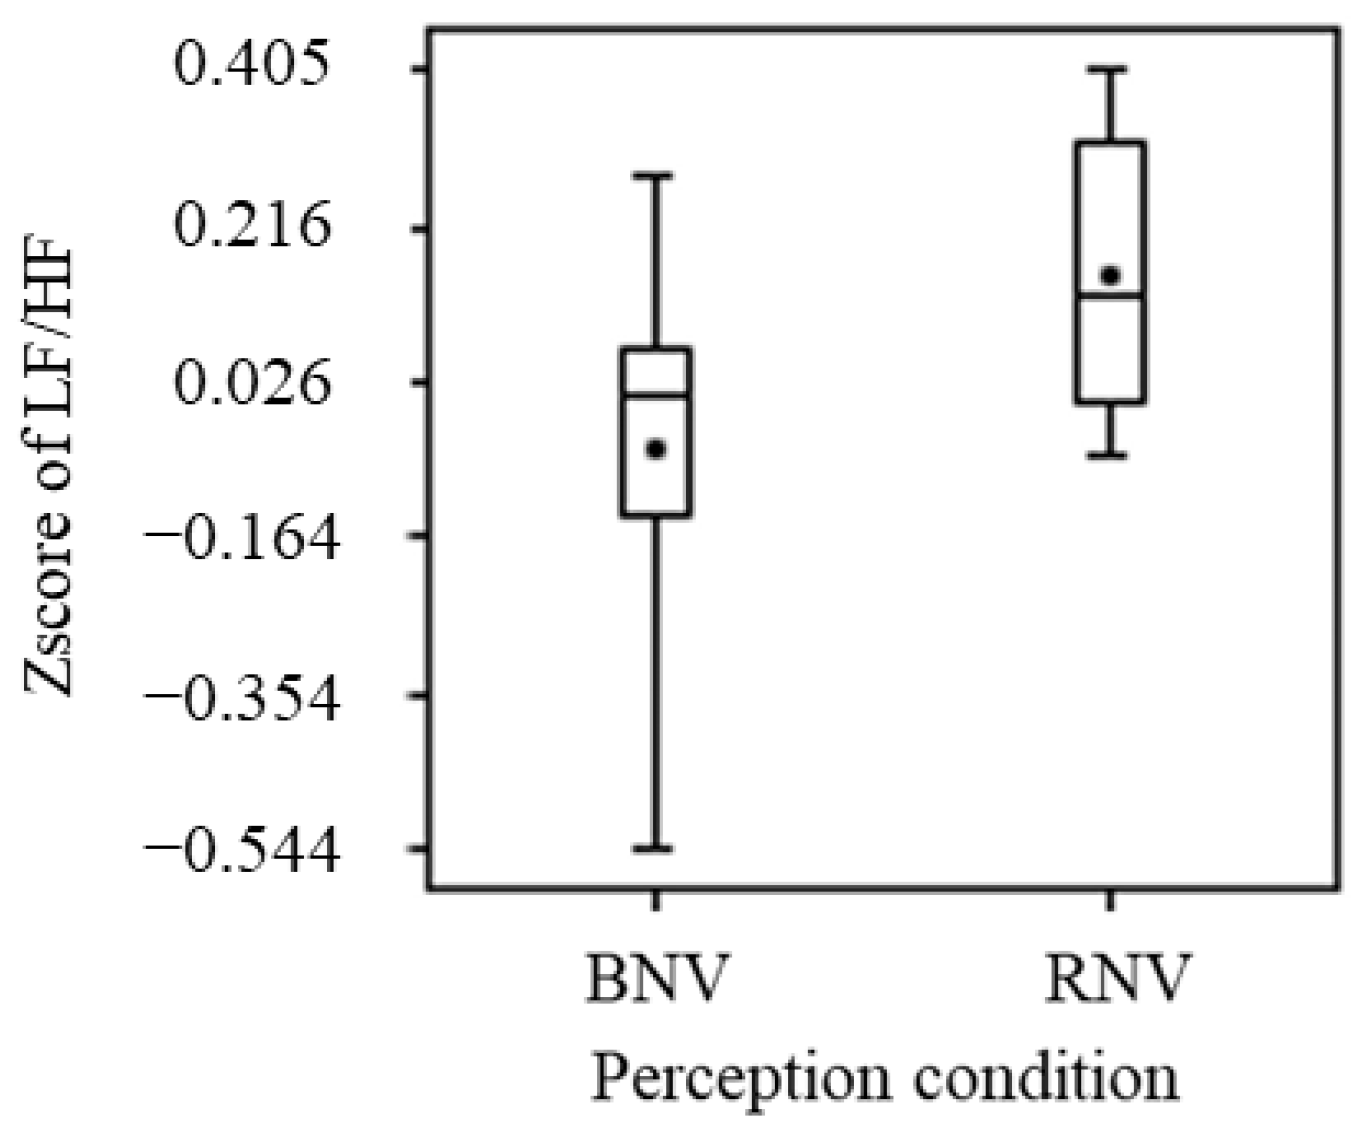
Figure 10 shows the results for comparison two. The LF/HF ratio in the RNV condition showed a higher mean than in the BNV condition. Significant differences were not observed (two of the four participants with non-visual effects for both light colors had higher means for blue light than for red light). Therefore, non-visual effects of blue light contributing to arousal were not observed.
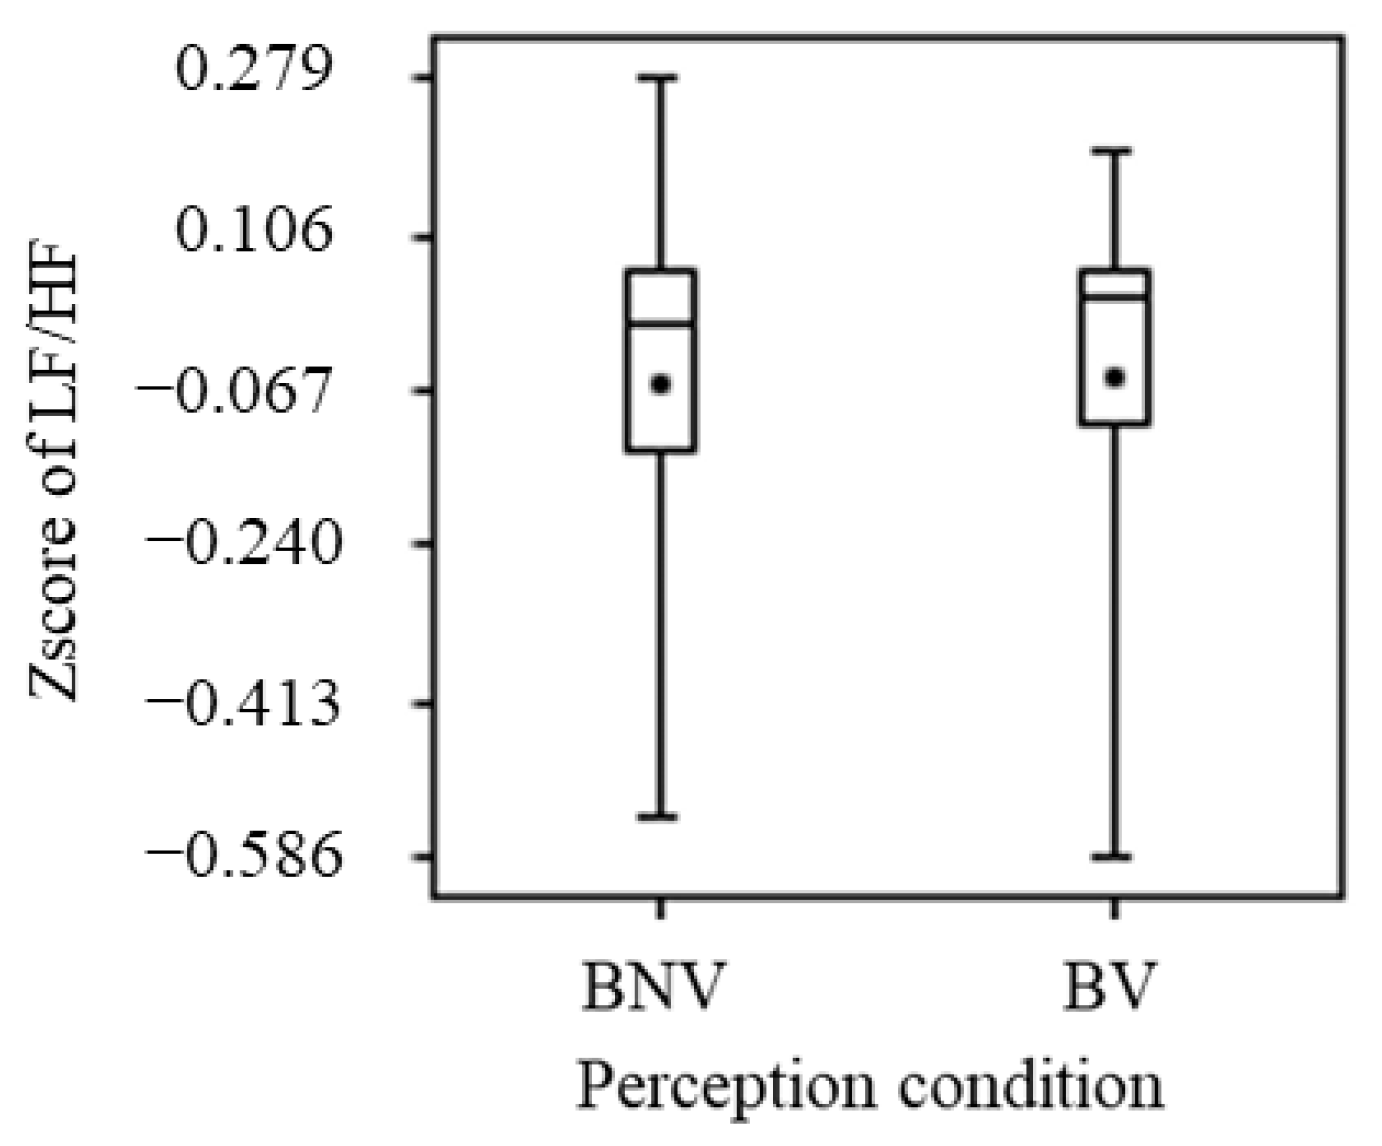
Figure 11 shows the results for comparison three. Significant differences were not confirmed. Additionally, a comparison of the means showed that they were equivalent and a significant result was not confirmed.
Figure 12 shows the results for comparison four. The LF/HF ratio in the RNV condition showed a higher mean than that in the RV condition, but significant differences were not observed. Thus, the visual effects of red light were not confirmed.
Only the means in comparison one showed a tendency, which may have been due to the noise effect during the LF/HF measurements and working effects. Breathing and sitting posture [5] may cause noise. On the other hand, the LF/HF ratio varies greatly depending on concentration and tension during work [20]. Therefore, the LF/HF ratio may have been affected by differences in the work content of individual participants.

3.2.4. Electrodermal Activity

This study calculated the deviations in the SCL over 1200 s (0–1200 s in constant light) from the average for 30 s (120–150 s in constant light) and defined their mean as a representative value. Then, the Mann–Whitney U test was performed to compare the results. Data from five participants were excluded because the instrument was disconnected during the experiment.
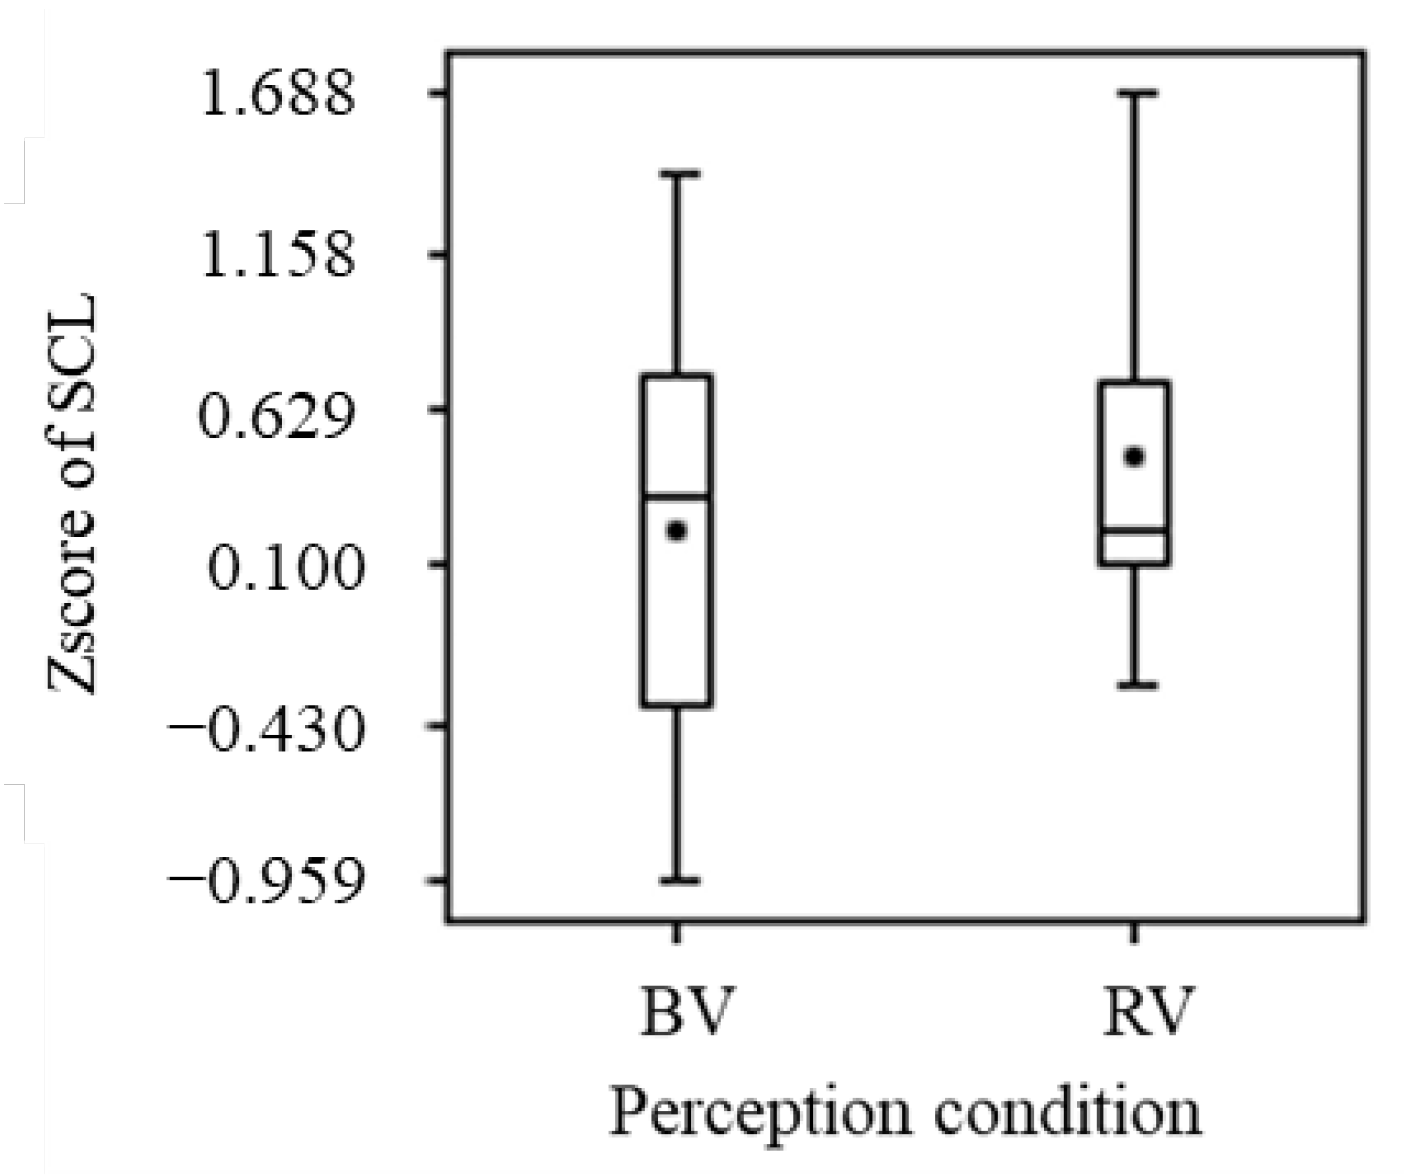
Figure 13 shows the results for comparison one. Although a significant difference (p = 0.49) was not observed, the SCL in the RV condition had a higher mean than that in the BV condition. For six of the nine participants with visual effects for both light colors, the mean for red light was larger than that for blue light. These results suggest the possibility of sympathetic dominance due to the visual effects of red light [2,4,5]. The perception of red light may contribute to arousal as well as brain activity.
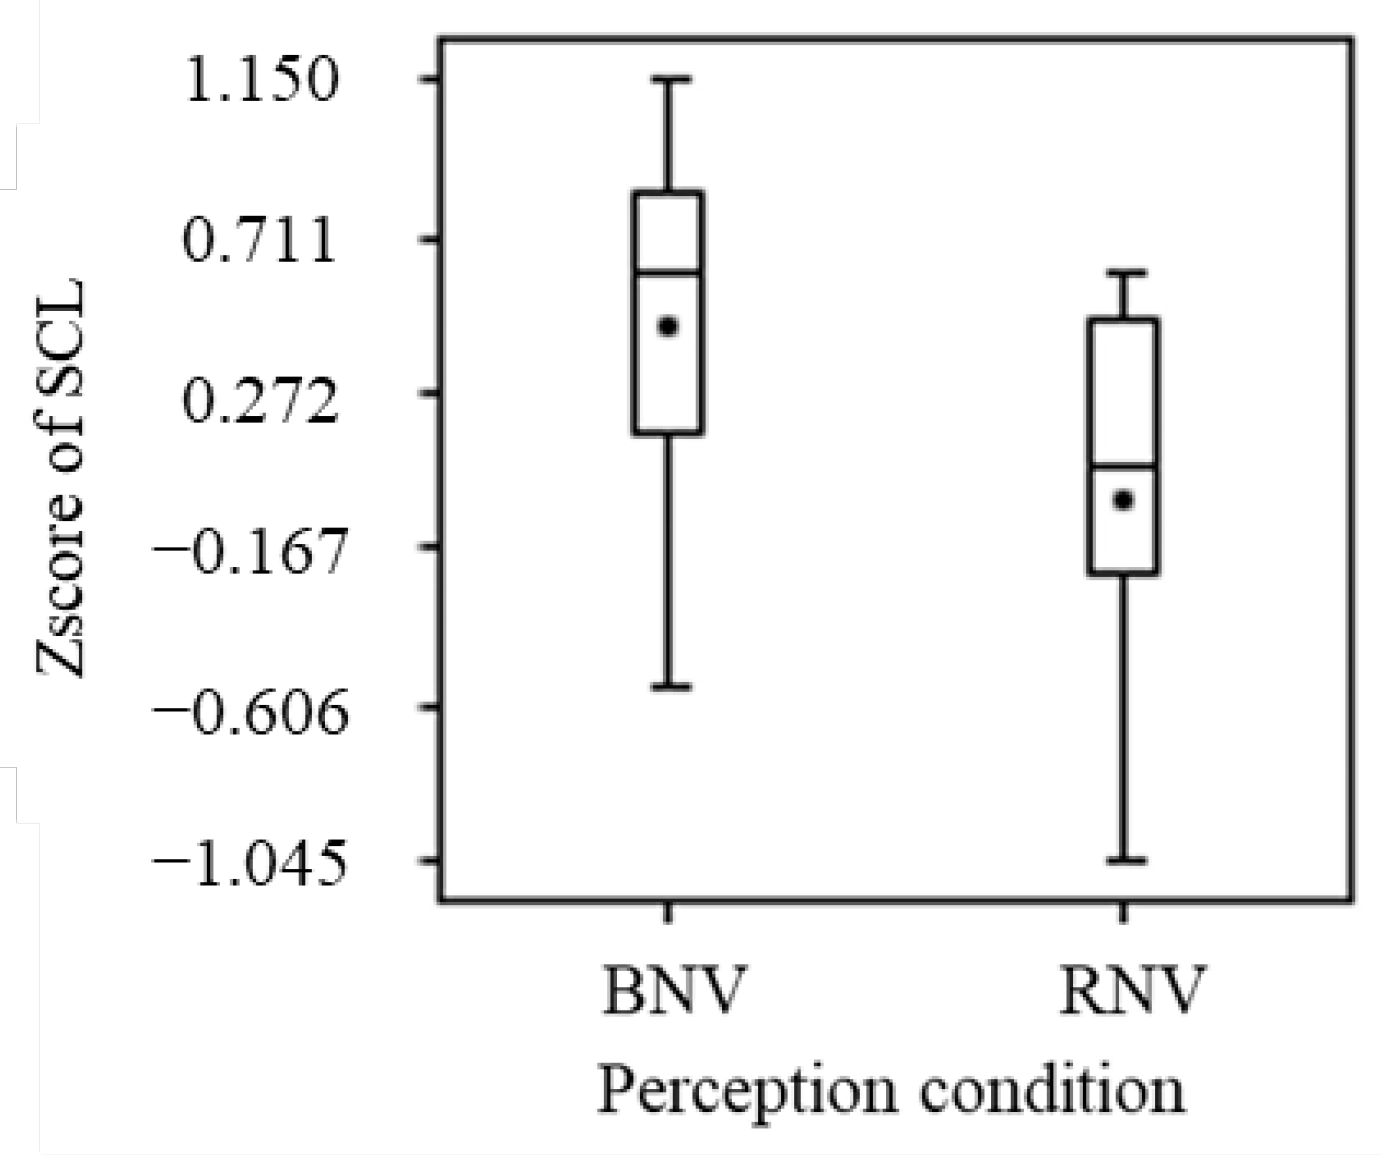
Figure 14 shows the results for comparison two. Although a significant difference (p = 0.26) was not observed, the SCL in the BNV condition had a higher mean than that in the RNV condition. For three of the four participants with non-visual effects from both light colors, the mean for blue light was higher than that for red light. This may suggest sympathetic dominance due to the non-visual effects of blue light [7,12,13], implying that the large short-wavelength component of blue light may contribute to arousal as well as brain activity.
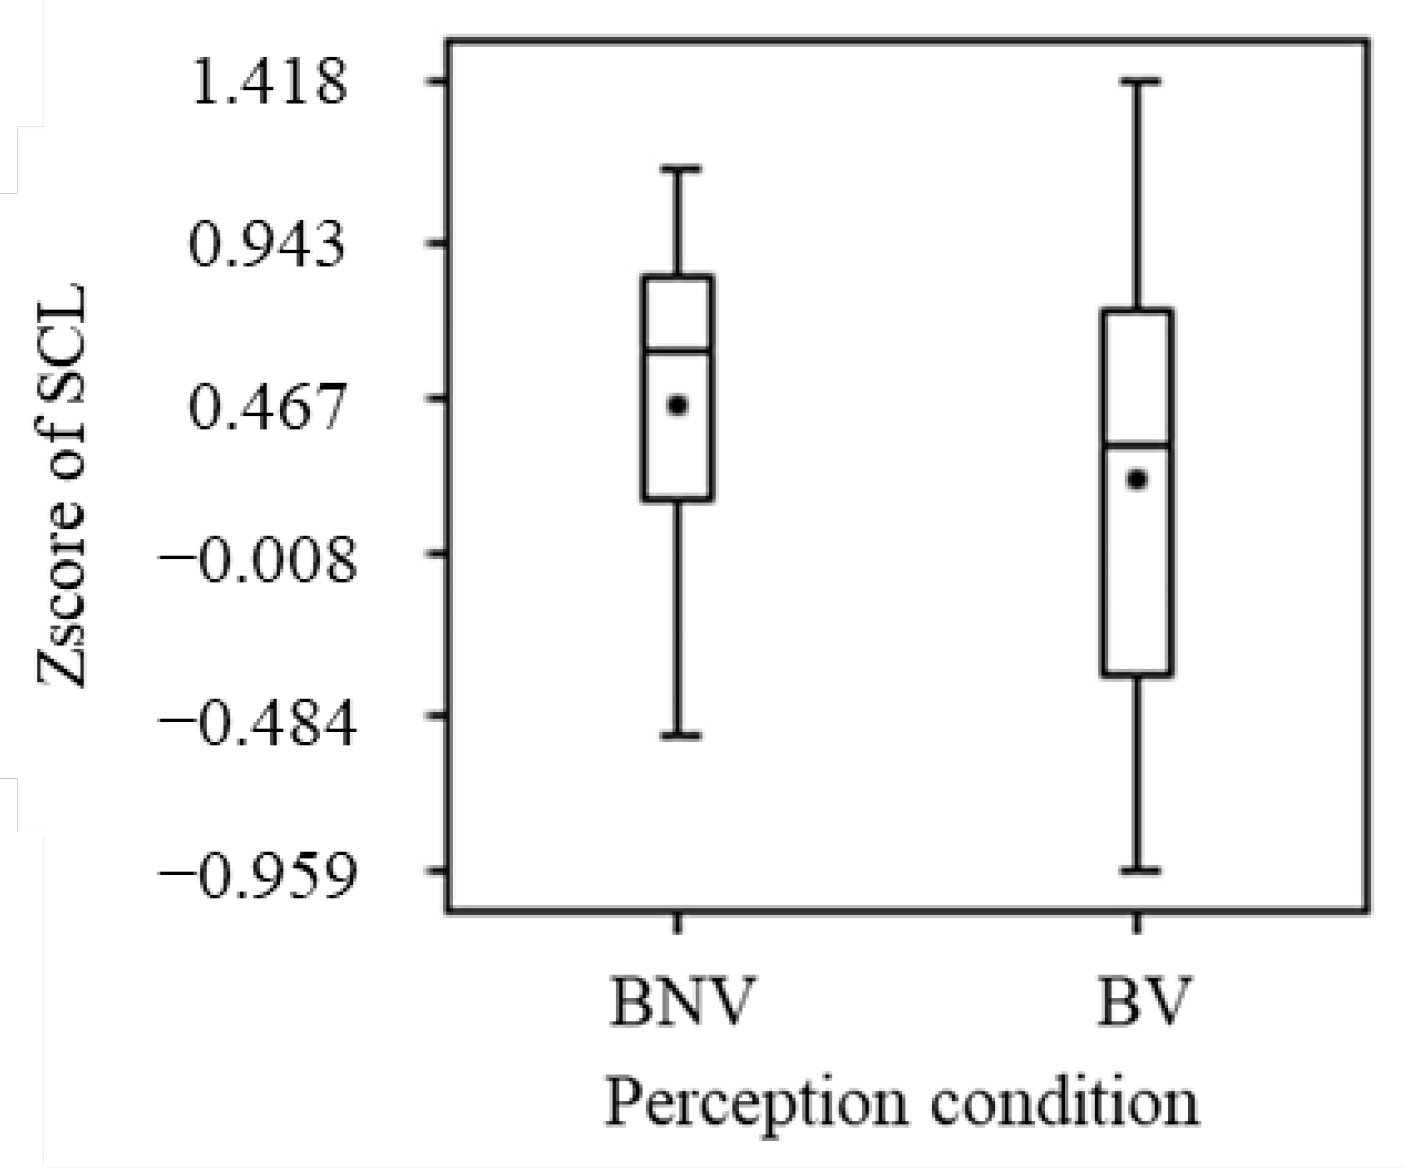
Figure 15 shows the results for comparison three. Although a significant difference (p = 0.59) was not observed, the SCL in the BNV condition had a higher mean than that in the BV condition. This implies the possibility of sympathetic dominance due to the non-visual effects of blue light [7,12,13], suggesting that the large short-wavelength component of blue light may contribute to arousal. Furthermore, the perception of blue light may contribute to sedation.
Figure 16 shows the results for comparison four. Although a significant difference (p = 0.23) was not observed, the SCL in the RV condition had a higher mean than that in the RNV condition. This may imply sympathetic dominance due to the visual effects of red light [2,4,5], suggesting that the perception of red light may contribute to arousal.
None of the comparisons in this study demonstrated significant differences. A previous study reported that SCL did not differ significantly with different illuminance levels [48]. Therefore, the changes in light color may not have caused significant differences. Additionally, the previous study showed slight tendencies in the mean comparisons [49]. Although no significant differences were confirmed in this study, all conditions showed tendencies in the mean comparisons, which were likely due to the effects of light color on EDA.
The following presents the limitations of this study and future issues:
  • This study set the red and blue light spectra to confirm the non-visual effects (i.e., the differences in the short-wavelength components of blue and red, especially from 446 nm to 477 nm). Simultaneously, to create an environment in which light color was not easily perceived, the long-wavelength component of red light was suppressed. Therefore, the red light used in this study may have been insufficient to induce visual effects;
  • The participants were compared by grouping according to the presence or absence of visual effects based on their perceptual results. However, it is possible that individual differences, such as personal preference [2] for light color and light history (experience) [50], may have affected the comparison results. Therefore, an experimental method that could be used to obtain and compare the physiological response results of both effects for each light color within the same participant was necessary. Additionally, this study did not equalize the male–female ratio, which was the same as the conventional studies [8,9,12] that confirmed non-visual effects using physiological measurements. However, gender differences in color preference have been indicated [51,52,53] and could have affected the results. Aside from gender difference, color preference is affected by differences in personalities [54,55,56] and cultures/experiences [57,58,59,60] and by different times of day/seasons [56,61], etc. Therefore, these factors need to be considered to obtain an accurate analysis result;
  • In this experiment, participants were assigned a free task using a PC or a book to prevent sleepiness. It is possible that differences regarding the task content may have affected the physiological response results. Therefore, it is necessary to consider tasks that can be conducted for a long period of time without making all participants feel sleepy.

4. Conclusions

This study constructed an environment in which light colors could not be easily perceived and measured the physiological responses (ΔoxyHb, LF/HF, and SCL) of 21 participants. The data were classified based on the light color and its perception by the participants to clarify the visual and non-visual effects. The results are summarized as follows:
  • The brain activation (increase in ΔoxyHb) in some regions of the PFC (p < 0.05) confirmed the non-visual effects of blue light. A comparison of the mean values indicated that blue light activates the prefrontal cortex and increases sweating (increase in SCL), but the differences were not statistically significant;
  • Although significant differences were not obtained for the visual effects of blue light, comparisons of the means showed tendencies toward a calming role for the prefrontal cortex and an inhibition of sweating;
  • Although no significant differences were obtained for the visual effects of red light, comparisons of the means showed a tendency to enhance sweating.
These results indicate that the non-visual and visual effects of blue light may contribute to arousal and sedation, respectively. In contrast, the visual effects of red light may cause arousal.

Author Contributions

Conceptualization, T.K.; methodology, H.M. and H.O.; validation, H.M. and H.O.; investigation, H.M. and H.O.; resources, T.K.; writing—original draft preparation, H.M. and H.O.; writing—review and editing, T.K.; supervision, T.K.; project administration, T.K.; funding acquisition, T.K. All authors have read and agreed to the published version of the manuscript.

Funding

This study was funded by OPTIS Japan Co., Ltd. (YP20634001).

Institutional Review Board Statement

The study was conducted in accordance with the declaration of Helsinki and approved by the ethics committee of Keio University. Approval no. 28, 5.4.2022.

Informed Consent Statement

Informed consent was obtained from all subjects involved in the study.

Data Availability Statement

Not applicable.

Acknowledgments

This study was partly supported by OPTIS Japan and was conducted with permission from the ethics committee of Keio University and informed consent from all participants. We would like to express our gratitude to all of them.

Conflicts of Interest

The funder (OPTIS Japan Co., Ltd.) had no role in the design of the study; in the collection, analyses, or interpretation of data; in the writing of the manuscript; or in the decision to publish the results.

Glossary

BNVBlue Non-visual
BVBlue Visual
EDAElectrodermal Activity
EEGElectroencephalogram
fMRIFunctional Magnetic Resonance Imaging
HFHigh frequency
LFLow frequency
MEGMagnetoencephalogram
NIRSNear-infrared Spectroscopy
PCPersonal Computer
RNVRed Non-visual
RRIR–R Interval
RVRed Visual
SCLSkin Conductance Level
SDStandard Deviation
ΔoxyHbChange in Oxygenated Hemoglobin

Appendix A

Figure A1. Spectral distribution.
Applsci 13 05785 g0a1
Figure A2. Spectral distribution with PC monitor.
Applsci 13 05785 g0a2

References

  1. Yasukouchi, A.; Ishibashi, K. Non-visual Effects of the Color Temperature of Fluorescent Lamps on Physiological Aspects in Humans. J. Physiol. Anthropol. Appl. Hum. Sci. 2005, 24, 41–43. [Google Scholar] [CrossRef] [PubMed]
  2. Jacobs, K.W.; Hustmyer, F.E. Effects of Four Psychological Primary Colors on GSR, Heart Rate and Respiration Rate. Percept. Mot. Skills 1974, 38, 763–766. [Google Scholar] [CrossRef] [PubMed]
  3. Warthen, D.M.; Provencio, I. The Role of Intrinsically Photosensitive Retinal Ganglion Cells in Nonimage-forming Responses to Light. Eye Brain 2012, 4, 43–48. [Google Scholar]
  4. Wilson, G.D. Arousal Properties of Red versus Green. Percept. Mot. Skills 1966, 23, 947–949. [Google Scholar] [CrossRef]
  5. Mary, J.; Paul, G.; Justin, C.D. The Impact of Modulated Color Light on the Autonomic Nervous System. Adv. Mind Body Med. 2013, 27, 7–16. [Google Scholar]
  6. Chang, A.; Santhi, N.; Hilaire, M.S.; Gronfier, C.; Bradstreet, D.S.; Duffy, J.F.; Lockley, S.W.; Kronauer, R.E.; Czeisler, C.A. Human Responses to Bright Light of Different Durations. J. Physiol. 2012, 590, 3103–3112. [Google Scholar] [CrossRef]
  7. Lockley, S.W.; Evans, E.E.; Scheer, F.A.J.L.; Brainard, G.C.; Czeisler, C.A.; Aeschbach, D. Short-Wavelength Sensitivity for the Direct Effects of Light on Alertness, Vigilance, and the Waking Electroencephalogram in Humans. Sleep 2006, 29, 161–168. [Google Scholar]
  8. Cajochen, C.; Munch, M.; Kobialka, S.; Krauchi, K.; Steiner, R.; Oelhafen, P.; Orgul, S.; Wirz-Justice, A. High Sensitivity of Human Melatonin, Alertness, Thermoregulation, and Heart Rate to Short Wavelength Light. J. Clin. Endocrinol. Metab. 2005, 9, 1311–1316. [Google Scholar] [CrossRef]
  9. Rüger, M.; Gordijn, M.C.M.; Beersma, D.G.M.; Vries, B.; Daan, S. Time-of Day Dependent Effects of Bright Light Exposure on Human Psychophysiology: Comparison of Daytime and Nighttime Exposure. Am. J. Physiol. Regul. Integr. Comp. Physiol. 2006, 290, 1419–1420. [Google Scholar] [CrossRef]
  10. Khademagha, P.; Aries, M.B.C.; Rosemann, A.L.P.; Loenen, E.J. Implementing Non-image-forming Effects of Light in the Built Environment: A review on what we need. Build. Environ. 2016, 108, 263–272. [Google Scholar] [CrossRef]
  11. Phipps-Nelson, J.; Redman, J.R.; Dijk, D.; Rajaratnam, S.M.W. Daytime Exposure to Bright Light, as Compared to Dim Light, Decreases Sleepiness and Improves Psychomotor Vigilance Performance. Sleep 2003, 26, 695–700. [Google Scholar] [CrossRef] [PubMed]
  12. Chellappa, S.L.; Steiner, R.; Blattner, P.; Oelhafen, P.; Gotz, T.; Cajochen, C. Non-Visual Effects of Light on Melatonin, Alertness and Cognitive Performance: Can Blue-Enriched Light Keep Us Alert? PLoS ONE 2011, 6, e16429. [Google Scholar] [CrossRef]
  13. Berson, D.M.; Dunn, F.A.; Motoharu, T. Phototransduction by Retinal Ganglion Cells that Set the Circadion Clock. Science 2002, 295, 1070–1073. [Google Scholar] [CrossRef] [PubMed]
  14. Rahman, S.A.; Shapiro, C.M.; Wang, F.; Ainlay, H.; Kazmi, S.; Brown, T.J.; Casper, R.F. Effects of Filtering Visual Short Wavelengths During Nocturnal Shiftwork on Sleep and Performance. Chronobiol. Int. 2013, 30, 951–962. [Google Scholar] [CrossRef]
  15. Elliot, A.J.; Maier, M.A.; Moller, A.C.; Fiedman, R.; Meinhardt, J. Color and Psychological Functioning: The Effect of Red on Performance Attainment. J. Exp. Psychol. 2007, 136, 154–168. [Google Scholar] [CrossRef]
  16. Souman, J.L.; Tinga, A.M.; te Pas, S.F.; van Ee, R.; Vlaskamp, B.N.S. Acute Alerting Effects of Light: A Systematic Literature Review. Behav. Brain Res. 2018, 337, 228–239. [Google Scholar] [CrossRef]
  17. Takahashi, S. Psychological Study of Environmental Colors (1): Effects of Color Lighting on the Performance of Simple Task. J. Hum. Environ. Stud. 2005, 3, 41–46. [Google Scholar] [CrossRef] [PubMed]
  18. Yamazaki, A.; Eto, K.; Shimada, H.A. Preliminary Analysis of Light Blue Backgrounds on the Scores of Web-based Tests Using NIRS. In Proceedings of the International Conference on Information Technology Based Higher Education and Training, Antalya, Turkey, 10–12 October 2013. [Google Scholar]
  19. Weinziri, J.; Heusser, P.; Nelle, M.; Wolf, U. Effects of Changes in Colored Light on Brain and Calf Muscle Blood Concentration and Oxygenation. Sci. World J. 2011, 11, 1216–1225. [Google Scholar] [CrossRef]
  20. Yamamoto, S.; Irikura, T. Physiological and Psychological Effects of Fluctuating Illumination on Heart Rate Variability in Concentration. J. Sci. Technol. Light. 2021, 45, 28–33. [Google Scholar] [CrossRef]
  21. Jing, L.; Yaru, Q.; Cheng, G.; Yanli, X.; Zhen, W.; Ruikang, Q. Lighting for Work: A Study on the Effect of Underground Low-light Environment on Miners’ Physiology. Environ. Sci. Pollut. Res. 2022, 29, 11644–11653. [Google Scholar]
  22. Vasung, L.; Abaci, T.E.; Ferradal, S.L.; Sutin, J. Exploring Early Human Brain Development with Structural and Physiological Neuroimaging. NeuroImage 2019, 187, 226–254. [Google Scholar] [CrossRef] [PubMed]
  23. Yamashita, G.; Tanaka, M.; Horiuchi, T. Analysis of Harmony between Color and Fragrance in Lighting Environments by the Reaction of the Orbitofrontal Area. i-Perception 2022, 13, 1–13. [Google Scholar] [CrossRef] [PubMed]
  24. Yu, H.; Akita, T. Effects of Illuminance and Color Temperature of a General Lighting System on Psychophysiology while Performing Paper and Computer Tasks. Build. Environ. 2022, 228, 109796. [Google Scholar] [CrossRef]
  25. Rodriguez, R.F.; Townsend, N.E.; Aughey, R.J.; Billaut, F. Influence of Averaging Method on Muscle Deoxygenation Interpretation during Repeated-sprint Exercise. Scand. J. Med. Sci. Sport. 2018, 28, 2263–2271. [Google Scholar] [CrossRef] [PubMed]
  26. Tsunashima, H.; Yanagisawa, K. Measurement of Brain Function of Car Driver Using Functional Near-Infrared Spectroscopy (fNIRS). Comput. Intell. Neurosci. 2009, 2009, 164958. [Google Scholar] [CrossRef]
  27. Yamada, T.; Umeyama, S.; Matsuda, K. Separation of fNIRS Signals into Functional and Systemic Components Based on Differences in Hemodynamic Modalities. PLoS ONE 2012, 7, e50271. [Google Scholar] [CrossRef]
  28. Tando, T.; Kaga, Y.; Kanemura, H.; Sugita, K.; Aihira, M. Developmental Changes in Frontal Lobe Function during a Verbal Fluency Task: A multi-channel near-infrared spectroscopy stud. Brain Dev. 2014, 36, 844–852. [Google Scholar] [CrossRef]
  29. Valera, B.; Dewailly, E.; Poirier, P. Impact of Mercury Exposure on Blood Pressure and Cardiac Autonomic Activity among Cree Adults. Environ. Res. 2011, 111, 1265–1270. [Google Scholar] [CrossRef]
  30. Dammen, L.; Finseth, T.T.; Mccurdy, B.H. Evoking stress reactivity in virtual reality: A Systematic Review and Meta-analysis. Neurosci. Biobehav. Rev. 2022, 138, 104709. [Google Scholar] [CrossRef]
  31. Bari, D.S.; Aldosky, H.; Tronstad, C.; Kalvoy, H.; Martinsen, O.G.; Martinsen, O.G. Electrodermal Responses to Discrete Stimuli Measured by Skin Conductance, Skin Potential, and Skin Susceptance. Ski. Res. Technol. 2018, 24, 108–116. [Google Scholar] [CrossRef]
  32. Woods, N.F.; Lentz, M.J.; Mitchell, E.S.; Kogan, H. Arousal and Stress Response across the Menstrual Cycle in Women with Three Perimenstrual Symptom Patterns. Res. Nurs. Health 1994, 17, 99–110. [Google Scholar] [CrossRef] [PubMed]
  33. Janina, H.; Simon, S.; Claus, B. Examination of the Skin Conductance level (SCL) as an Index of the Activity of the Sympathetic Nervous System for Application the Continuous Blood Pressure Measurement. Int. J. Biomed. Eng. Sci. 2018, 5, 1–11. [Google Scholar]
  34. Garcia, M.E.; Ara, J.R.; Martin, J.; Almarcegui, C. Retinal and Optic Nerve Degeneration in Patients with Multiple Sclerosis Followed up for 5 Years. Ophthalmology 2017, 124, 688–696. [Google Scholar] [CrossRef] [PubMed]
  35. Oldfield, R.C. the Assessment and Analysis of Handedness: The Edinburgh Inventory. Neuropsychologia 1971, 9, 97–113. [Google Scholar] [CrossRef]
  36. Cajochen, C.; Zeitzer, J.M.; Czeisler, C.A.; Dijk, D. Dose-response Relationship for Light Intensity and Ocular and Electroencephalographic Correlates of Human Alertness. Behav. Brain Res. 2000, 115, 75–83. [Google Scholar] [CrossRef]
  37. West, K.E.; Jablonski, M.R.; Warfield, B.; Cecil, K.S.; James, M.; Ayers, M.A.; Maida, J.; Bowen, C.; Sliney, D.H.; Rollag, M.D.; et al. Blue Light from Light-emitting Diodes Elicits a Dose-dependent Suppression of Melatonin in Humans. J. Appl. Physiol. 2011, 110, 619–626. [Google Scholar] [CrossRef]
  38. Wright, K.P.; McHill, A.W.; Birks, B.R.; Griffin, B.R.; Rusterholz, T.; Chinoy, E.D. Entrainment of the Human Circadian Clock to the Natural Light-Dark Cycle. Curr. Biol. 2013, 23, 1554–1558. [Google Scholar] [CrossRef]
  39. Glickman, G.; Hanifin, J.P.; Rollag, M.D.; Wang, J.; Cooper, H.; Brainard, G.C. Inferior Retinal Light Exposure is more Effective than Superior Retinal Exposure in Suppressing Melatonin in Humans. J. Biol. Rhythm. 2003, 18, 71–79. [Google Scholar] [CrossRef]
  40. Lasko, T.A.; Kripke, D.F.; Elliot, J.A. Melatonin Suppression by Illumination of Upper and Lower Visual Fields. J. Biol. Rhythm. 1999, 14, 122–125. [Google Scholar] [CrossRef]
  41. Visser, E.K.; Beersma, D.G.; Daan, S. Melatonin Suppression by Light in Humans is Maximal when the Nasal Part of the Retina is Illuminated. J. Biol. Rhythm. 1999, 14, 116–121. [Google Scholar] [CrossRef]
  42. Ikeda, M.; Pontawee, P.; Pichayada, K.; Aran, H. The Brain Adaptation to the Color of Illumination and not the Retinal Adaptation to the Color of Objects that Determines the Color Appearance of an Object in the Space. Opt. Rev. 2006, 13, 388–395. [Google Scholar] [CrossRef]
  43. Rensink, R.A. Change detection. Annu. Rev. Psychol. 2002, 53, 245–277. [Google Scholar] [CrossRef] [PubMed]
  44. Simons, D.J.; Franconeri, S.L.; Reimer, R.L. Change Blindness in the Absence of a Visual Disruption. Perception 2000, 29, 1143–1154. [Google Scholar] [CrossRef] [PubMed]
  45. Simons, D.J.; Rensink, R.A. Change Blindness: Past, Present, and Future. Trends Cogn. Sci. 2005, 9, 16–20. [Google Scholar] [CrossRef]
  46. Qiu, L.; Zhong, Y.; Xie, Q.; He, Z.; Wang, X.; Chen, Y. Multi-Modal Integration of EEG-fNIRS for Characterization of Brain Activity Evoked by Preferred Music. Front. Neurorobot. 2022, 16, 823435. [Google Scholar] [CrossRef]
  47. Thom, E.C. The Discomfort Index. Weatherwise 1959, 12, 57–61. [Google Scholar] [CrossRef]
  48. Eckberg, D.L.; Kifle, Y.T.; Roberts, V.L. Phase Relationship between Normal Human Respiration and Baroreflex Responsiveness. J. Physiol. 1980, 304, 489–502. [Google Scholar] [CrossRef] [PubMed]
  49. Huiberts, L.M.; Smolders, K.C.; De Kort, Y.A.W. Seasonal and Time-of-day Variations in Acute Non-image Forming Effects of Illuminance Level on Performance, Physiology, and Subjective Well-being. Chronobiol. Int. 2017, 34, 827–844. [Google Scholar] [CrossRef]
  50. Hebert, M.; Martin, S.K.; Lee, C.; Eastman, C.I. The Effects of Prior Light History on the Suppression of Melatonin by Light in Humans. J. Pineal Res. 2002, 33, 198–203. [Google Scholar] [CrossRef]
  51. Eysenck, H.J. A Critical and Experimental Study of Color Preference. Am. J. Psychol. 1941, 54, 385–391. [Google Scholar] [CrossRef]
  52. Hurlbert, A.; Owen, A. Biological, cultural, and developmental inflences on color preferences. In Handbook of Color Psychology; Cambridge University Press: Cambridge, UK, 2015; pp. 454–478. [Google Scholar]
  53. Valérie, B.; Sucharita, B.; Nijoo, D.; Mayukhini, P.; David, B. Gender Difference in Color Preference Across Cultures: An Archetypal Pattern Modulated by a Female Cultural Stereotype. Color Res. Appl. 2017, 43, 209–223. [Google Scholar]
  54. Charles, M.; Moyer, W.W. Correspondence of Self-referent Statements and Color Preference. Percept. Mot. Skills 1992, 74, 993–994. [Google Scholar] [CrossRef]
  55. Ireland, S.; Warren, Y.M.; Herringer, L.G. Anxiety and Color Saturation Preference. Percept. Mot. Skills 1992, 75, 545–546. [Google Scholar] [CrossRef]
  56. Zuber, I.; Ekehammar, B. Personality, Time of Day and Visual Perception: Preferences and Selective Attention. Personal. Individ. Differ. 1988, 9, 345–352. [Google Scholar] [CrossRef]
  57. Hurlbert, A.C.; Ling, Y.L. Biological Components of Sex Differences in Color Preference. Curr. Biol. 2007, 17, 623–625. [Google Scholar] [CrossRef] [PubMed]
  58. Stephen, E.; Karen, B. An Ecological Valence Theory of Human Color Preference. Schloss 2010, 107, 8877–8882. [Google Scholar]
  59. Davis, J.T.M.; Robertson, E.; Lew-Levy, S.; Neldner, K.; Kapitany, R.; Nielsen, M.; Hines, M. Cultural Components of Sex Differences in Color Preference. Child Dev. 2021, 92, 1574–1589. [Google Scholar] [CrossRef]
  60. Taylor, C.; Clifford, A.; Franklin, A. Color Preferences Are Not Universal. J. Exp. Phychogy 2013, 142, 1015–1027. [Google Scholar] [CrossRef]
  61. Schloss, K.B.; Nelson, R.; Parker, L.; Heck, I.A.; Palmer, S.E. Seasonal Variations in Color Preference. Cogn. Sci. 2017, 41, 1589–1612. [Google Scholar] [CrossRef]
Figure 1. Specifications of the OEG-SpO2. (a) OEG-SpO2; (b) light source, detector, and measurement point; and (c) measurement points based on the international 10–20 system.
Applsci 13 05785 g001
Figure 2. Experimental environment. The positional relationship of the participants and devices.
Applsci 13 05785 g002
Figure 3. Actual images of a participant in each of the light color conditions: (a) white, (b) blue, and (c) red.
Applsci 13 05785 g003
Figure 4. The experimental flow. The participants were initially exposed to the steady white light, which was followed by a blue/red transition light leading to a blue/red steady light.
Applsci 13 05785 g004
Figure 5. Comparison of ΔoxyHb between BV and RV.
Applsci 13 05785 g005
Figure 6. Comparison of ΔoxyHb between BNV and RNV.
Applsci 13 05785 g006
Figure 7. Comparison of ΔoxyHb between BNV and BV.
Applsci 13 05785 g007
Figure 8. Comparison of ΔoxyHb between RNV and RV.
Applsci 13 05785 g008
Figure 9. Comparison of LF/HF ratio between BV and RV.
Applsci 13 05785 g009
Figure 10. Comparison of LF/HF ratio between BNV and RNV.
Applsci 13 05785 g010
Figure 11. Comparison of LF/HF ratio between BNV and BV.
Applsci 13 05785 g011
Figure 12. Comparison of LF/HF ratio between RNV and RV.
Applsci 13 05785 g012
Figure 13. Comparison of SCL between BV and RV.
Applsci 13 05785 g013
Figure 14. Comparison of SCL between BNV and RNV.
Applsci 13 05785 g014
Figure 15. Comparison of SCL between BNV and BV.
Applsci 13 05785 g015
Figure 16. Comparison of SCL between RNV and RV.
Applsci 13 05785 g016
Table 1. Classification of participants according to the perception conditions for each light color.
Perception ConditionParticipant Number
BV3, 4, 5, 6, 7, 8, 13, 16, 17, 19, 20, 21
BNV1, 2, 9, 10, 11, 12, 14, 15, 18
RV3, 4, 5, 6, 7, 8, 9, 10, 12, 13, 15, 16, 17, 18, 19, 20
RNV1, 2, 11, 14, 21
Disclaimer/Publisher’s Note: The statements, opinions and data contained in all publications are solely those of the individual author(s) and contributor(s) and not of MDPI and/or the editor(s). MDPI and/or the editor(s) disclaim responsibility for any injury to people or property resulting from any ideas, methods, instructions or products referred to in the content.