Article

Clustering Approach for Reliable Wireless Communication

by
Carmen Florea
1,2,
Mădălina-Georgiana Berceanu
1,2,*,
Răzvan-Florentin Trifan
1 and
Ioana-Manuela Marcu
1,*
1
Telecommunications Department, National University of Science and Technology Politehnica Bucharest, Splaiul Independenței 313, 060042 Bucharest, Romania
2
Academy of Romanian Scientists, Ilfov 3, 050044 Bucharest, Romania
*
Authors to whom correspondence should be addressed.
Appl. Sci. 2024, 14(1), 13; https://doi.org/10.3390/app14010013
Submission received: 18 November 2023 / Revised: 13 December 2023 / Accepted: 15 December 2023 / Published: 19 December 2023
(This article belongs to the Section Electrical, Electronics and Communications Engineering)

Abstract

:
Multiple access techniques for 5G systems are based on principles related to security, efficiency, and performance increase. Multi-user shared access (MUSA) is included in code-domain non-orthogonal multiple access (CD-NOMA) techniques with multiple benefits including multiple-access interference minimization and system capacity increase. The additional benefits of MUSA include its grant-free nature, which makes it applicable to scenarios involving random access channels, minimal latency communications, etc. Depending on the high-frequency diversity of the fading-affected channels, this technique is also used to lessen their effects. This paper illustrates the concept of code correlation used in MUSA by proposing a method to allocate MUSA codes to active users in an uplink data transmission system based on clusters. This clustering approach (grouping of 3GPP TR 38.812 spreading codewords) enables performance improvement in different system configurations by implementing various scenarios and providing reliable results. It is demonstrated that four-length spreading code selection from 3GPP family codes is a satisfactory solution, and this cluster grouping can be designed in a less overloaded multi-user system. The challenges, advantages, and limitations of the proposed method are outlined throughout the study.

1. Introduction

Multiple access techniques are a crucial concept in developing a new generation of cellular systems. Orthogonal multiple access (OMA) schemes have successfully responded to challenges raised by end-users up until a few years ago. Still, they have the disadvantage of limiting the number of users that can use the system since orthogonality cannot be ensured between many resource blocks (RBs), thus reducing the spectral efficiency of the communication systems. Currently, with the increased demands for massive connectivity, low communication latency [1,2,3,4,5,6], and superior quality of service (QoS) guarantees, non-orthogonal multiple access (NOMA) schemes can represent a reliable solution. NOMA schemes can obtain a higher throughput and an improved spectral efficiency by overlapping signals in time and frequency domains, and thus, the multiple access process is ensured by users’ separation into different domains while using other techniques [7,8,9]. The classification of NOMA techniques includes power domain NOMA (PD-NOMA) [10,11,12,13] and code domain NOMA (CD-NOMA) [14] techniques that are being used for inter-user interference (IUI) suppression and multiplexing in multiple domains (e.g., lattice partition multiple access (LPMA), building block sparse-constellation-based orthogonal multiple access (BOMA), and pattern division multiple access (PDMA)) [15].
The principle of the PD-NOMA technique relies on allocating a power factor to each user’s data depending on the quality of the channel and further transmission of the overlapped data into the system. For data recovery at the receiver’s end, a successive interference cancellation (SIC) technique is used [16,17]. Yet, PD-NOMA is challenging for higher capacity systems due to its limitations in resource allocation and user pairing, which lead to error propagation in successive interference cancellation (SIC) [18,19,20].
Code-domain NOMA aims to multiplex several users using non-orthogonal unique sequences with low correlation properties [19]. Under this category, interleave division multiple access (IDMA) [21,22], low-density spreading CDMA (LDS-CDMA) [23,24], low-density spreading orthogonal frequency-division multiplexing (LDS-OFDM) [25], sparse code multiple access (SCMA) [26], and MUSA [27,28,29,30,31,32,33,34,35] demonstrated efficient performance in multiple transmission scenarios. Compared to the classic CDMA technique, IDMA provides better efficiency because multiple access interference (MAI) is used at the interleaving block level and there is a higher throughput [36]. The performance of a multi-carrier IDMA (MC-IDMA) system relies on its capacity in terms of user numbers and relays, making this technique unsuitable for a MIMO system [37]. Better results can be obtained using the LDS-CDMA technique [38], and practical implementations demonstrate that using transmission on multiple carrier frequencies makes LDS-OFDM a dependable candidate for wideband communication [39,40]. Lately, the MUSA technique was highly implemented to avoid or minimize interference in the system (also with a role in the reliable detection and reception of user data) through various SIC techniques. In [28], short MUSA low-correlated codes were designed starting from the real and imaginary sets of values {0, 1, 1 + j, j, −1 + j, −1, −1 − j, −j, 1 − j}. Using an SIC receiver, their approach enables grant-free access and increases traffic load. Thus, in our paper, we implemented small-length low-correlated MUSA codes to observe the system’s behavior. The authors in [41,42] state that MUSA manages to ensure massive connectivity among multiple users in 5G systems by providing users with access to Internet of Things (IoT). In [41], it is stated that a MUSA pattern can make use of quantized elements within the spreading sequences, which are elements achieved from typical digital modulations like quadrature amplitude modulation (QAM) and quadrature phase shift keying (QPSK). Since researchers at ZTE and Nokia have successfully used this technique, we considered implementing it in our experimental study. Our present strategy will apply the MMSE-SIC algorithm for bit error rate (BER) optimization in a multi-user communication system, since the reliability of MUSA is demonstrated when using the minimum mean squared error (MMSE) with soft interference cancellation (SIC) in ideal and Rayleigh fading channels [43]. Complex MUSA codes with different lengths (2, 4, 8, and 16), QPSK digital modulation, and an MMSE-SIC receiver allow for a quick decrease in the BER values of up to 10−5 in both channel scenarios [43]. An SIC detector is also used at the receiver with the zero-forcing (ZF) technique to mitigate interference in a downlink power domain multi-user MIMO-NOMA with (2 × 2) and (8 × 8) configurations and single-input single-output (SISO) NOMA systems with two users. In a Rayleigh fading-affected channel, the multiple-input multiple-output (MIMO) NOMA approach overcomes the SISO-NOMA’s performance by demanding a lower transmission power to achieve the same BER [44]. Moreover, [45] outlines the benefits of applying NOMA concepts in the Rayleigh fading environment. To resume the assets of MUSA, a study from 2021 [46] pointed out that this is a technique that allows grant-free transmission, that the users must not be aware of their corresponding spreading codes, and that the probability of collisions is low. In addition, because of the high-frequency diversity, massive overload (more than 700%) is easily handled concurrently. Furthermore, categorizing the spreading sequences into groups is only stated in this research. Consequently, we used clustering approaches with specific features to execute this strategy.
Three CD-NOMA multiple access methods (MUSA, SCMA, and PDMA) were compared in [47], where QPSK data are broadcasted in a communication environment affected by Rayleigh fading. By using SIC to maximize the performance, the authors demonstrated that MUSA and PDMA lead to comparable results, while SCMA leads to slightly better results. Complete scenarios referring to the system’s capacity were evaluated under the same circumstances in [48]. Ordered successive interference cancellation (OSIC)-based multi-user detection (MUD) and MPA-based MUD have been used at the receiver side. In [49], another three CD-NOMA multiple access techniques were compared by evaluating the BER behavior when the signal-to-noise ratio (SNR) varies—using MUSA, SCMA, and IDMA. An uplink SISO connection is considered when data from up to 24 users are QPSK-modulated, orthogonal frequency-division multiplexed (OFDM), and when the data are altered by Rayleigh fading on the communication channel. On the receiving end, an MMSE detector was employed. The MMSE linear detector in MUSA seeks to assist in lowering the desired power of the signal and achieving interference cancellation. It was possible to achieve an acceptable block error rate (BLER) with low/average overload multipliers even with a low diversity gain of MUSA. As a result, it is demonstrated that low code rate modulations are used in a high overload system by the MUSA technique. In addition, MUSA proved to perform better in the low SNR range compared to IDMA and SCMA.
Having demonstrated the advantages of the MUSA technique with the MMSE-SIC detector above, the current study focuses on optimizing the transmission in a CD-NOMA MIMO system by introducing a novel manner of grouping and selecting the available MUSA codes from a cluster. The rest of this paper has the following structure: Section 2 advances the innovative approach of grouping and selecting MUSA codes for certain users. In Section 3, the global system model and the suitable design are described in detail. Section 4 integrates the outcomes and pertinent discussions obtained from MATLAB simulations. In Section 5, the future work perspective is included alongside the conclusions.

2. Materials and Methods

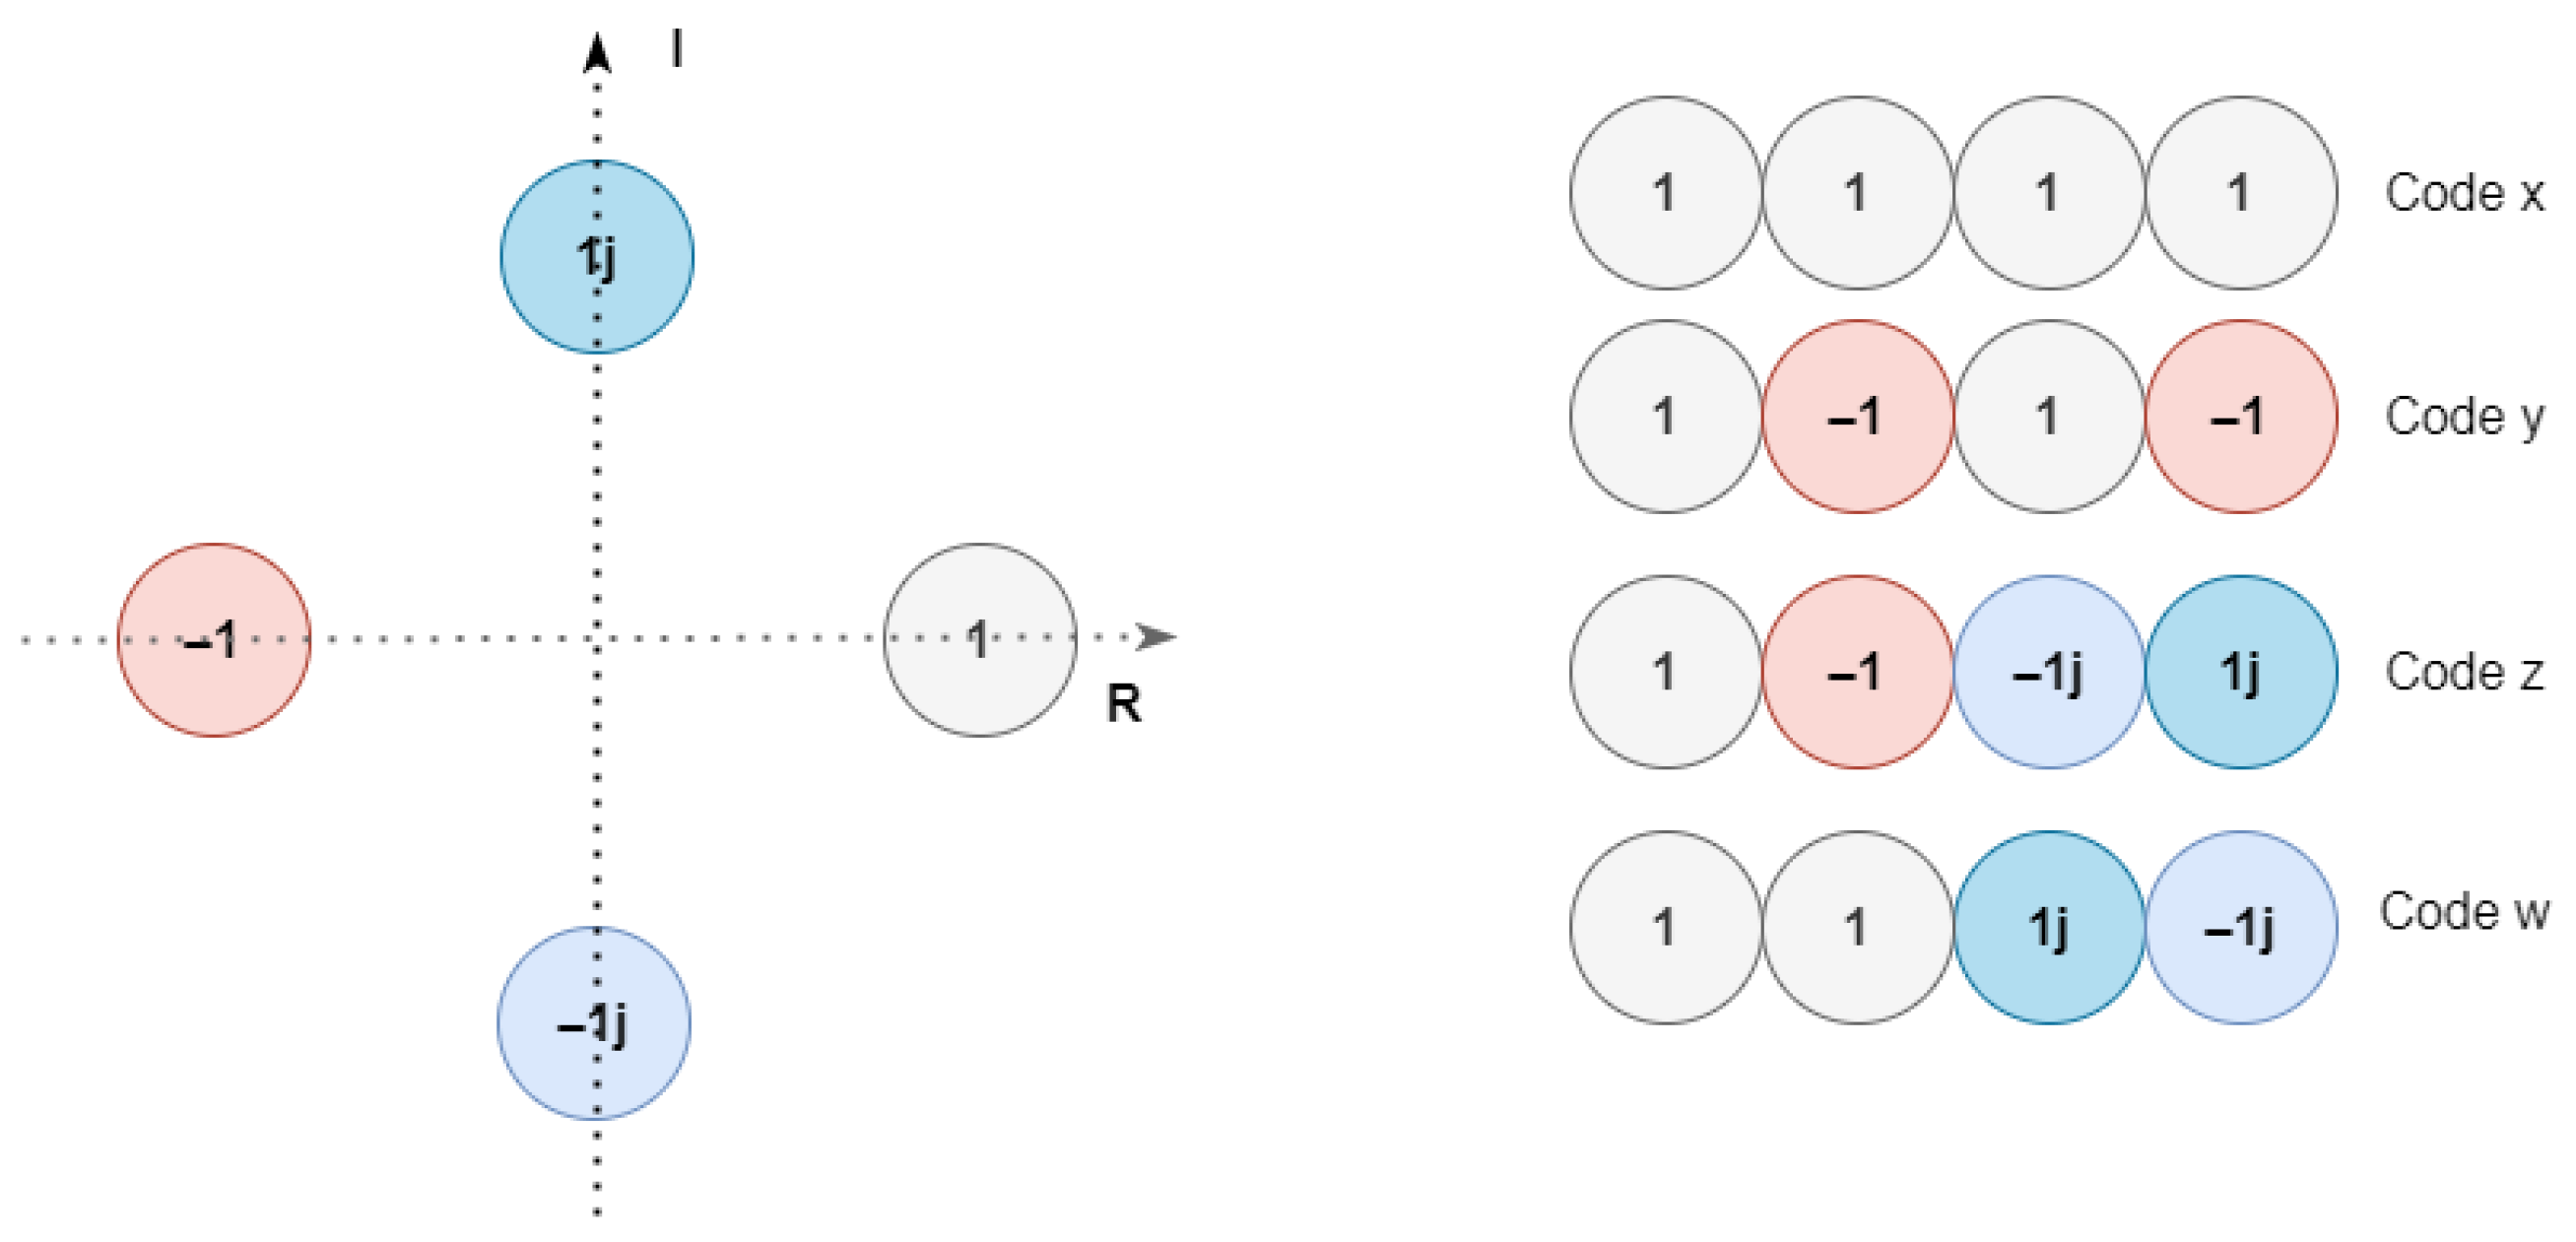
2.1. MUSA Codes Selection

The key role of multiple access techniques lies in facilitating multiple users to be active simultaneously. This must be achieved by maintaining the key performance indicators (KPIs), such as inter-user interference, at an acceptable level. With code-based approaches, users’ signals can be separated by accessing perfectly orthogonal or low-correlated sequences, which can lower the IUI. In fifth-generation systems, spreading codes used for the MUSA technique are generated using values from two sets: {1, −1} and {−1, 0, 1} or {−2, −1, 0, 1, 2}, for both real/imaginary parts. Possible combinations include, for example, {1 + j, 1 − j, −1 + j, −1 − j}, or {−2, −2j, −2 − 2j, −2 + 2j, −2 − j, −2 + j, −1 − 2j, −1 + 2j, −1 − j, −1 + j, −1, −j, 0, j, 1, 1 − j, 1 + j, 2, 1 − 2j, 1 − j, 2 − j, 2 + j, 2j, 2 − 2j, 2 + 2j}, selected depending on the network’s capacity. Considering L, the length of the spreading code, and N, the number of values in the set, there can be NL: 4L, 9L, or 25L spreading codes [50]. To appropriate the technical details related to the MUSA technique, the innovative aspect of this research relies on a unique design of MUSA complex spreading codes starting from the CDMA technique (an OMA technique) using real spreading codes and their grouping into “clusters”.
According to 3GPP Specifications [51,52], for multi-access signature classification, MUSA handles user equipment (UE) with low correlation sequences to separate different users at the symbol level. To maximize spectral efficiency, symbols can be chosen from binary phase shift keying (BPSK), QAM, or QPSK. For example, in the CP-OFDM waveform with BPSK, the combination { 1 + j 2 , 1 j 2 } can be considered.
Data processing comprising symbol-level spreading is depicted in Figure 1.
According to Figure 1, the order of the transformations applied to users’ data begins with coding and modulation, followed by symbol-by-symbol processing performed using spreading sequences. Basic elements of the spreading sequences can be drawn from quantized constellations such as QPSK and 9-QAM constellations (the total numbers of sequences are 4L and 9L). Four code sequences using a QPSK constellation are depicted in Figure 2.
Using low correlation spreading sequences, the multipath effects on individual user data are mitigated. For the signals to be effectively decoded, at the receiver’s end, the same spreading sequences as those in the transmission part must be used for their identification.
MUSA functionality assumes that each user randomly selects a certain spreading sequence from a large group of sequences. To minimize the undesired phenomena that may affect signals on the propagation channel and to improve the performance of the communication, the same approach is available for symbol spreading. Although MUSA sequences are low-correlation sequences, the randomness of the allocation can lead to neighboring sequences, or the same sequence being assigned to two users that have highly correlated channels. According to the authors of [53], when the elements of the spreading sequences are selected from 9-QAM constellations, e.g., {−1, −1 − j, −1 + j, −j, 0, j, 1, 1 − j, 1 + j}, groups of three 4-length orthogonal codes (c1, c2, c3 in Equation (1)) can be obtained.
c 1 = [ j j j j ] c 2 = [ j j     1 + j       1 j   ] c 3 = [ 1 + j     1 j     1 1 ]
Similarly, up to 16 low correlation spreading codes can be designed [53]. However, increasing the code length results in a throughput decrease, as data bits occupy more resources due to the number of additional bits added with spreading.
The cross-correlation of any two code sequences, x and y of length, L, is defined in [54] using the dot product, x × yH, where H is the transpose conjugate of y (the Hermitian operator). The cross-correlation matrix (C) for the 3 orthogonal codes in Equation (1) is computed in Equation (2):
C = [ c 1 c 2 c 3 ] [ c 1 c 2 c 3 ] H = [ 4 0 0 0 6 0 0 0 6 ]
The autocorrelation is neither fixed nor equal to the code length value, while the cross-correlation is zero. Codewords with a length of 4 proposed by the 3GPP TR 38.812 [52] were used in this analysis and can be seen in Table 1.

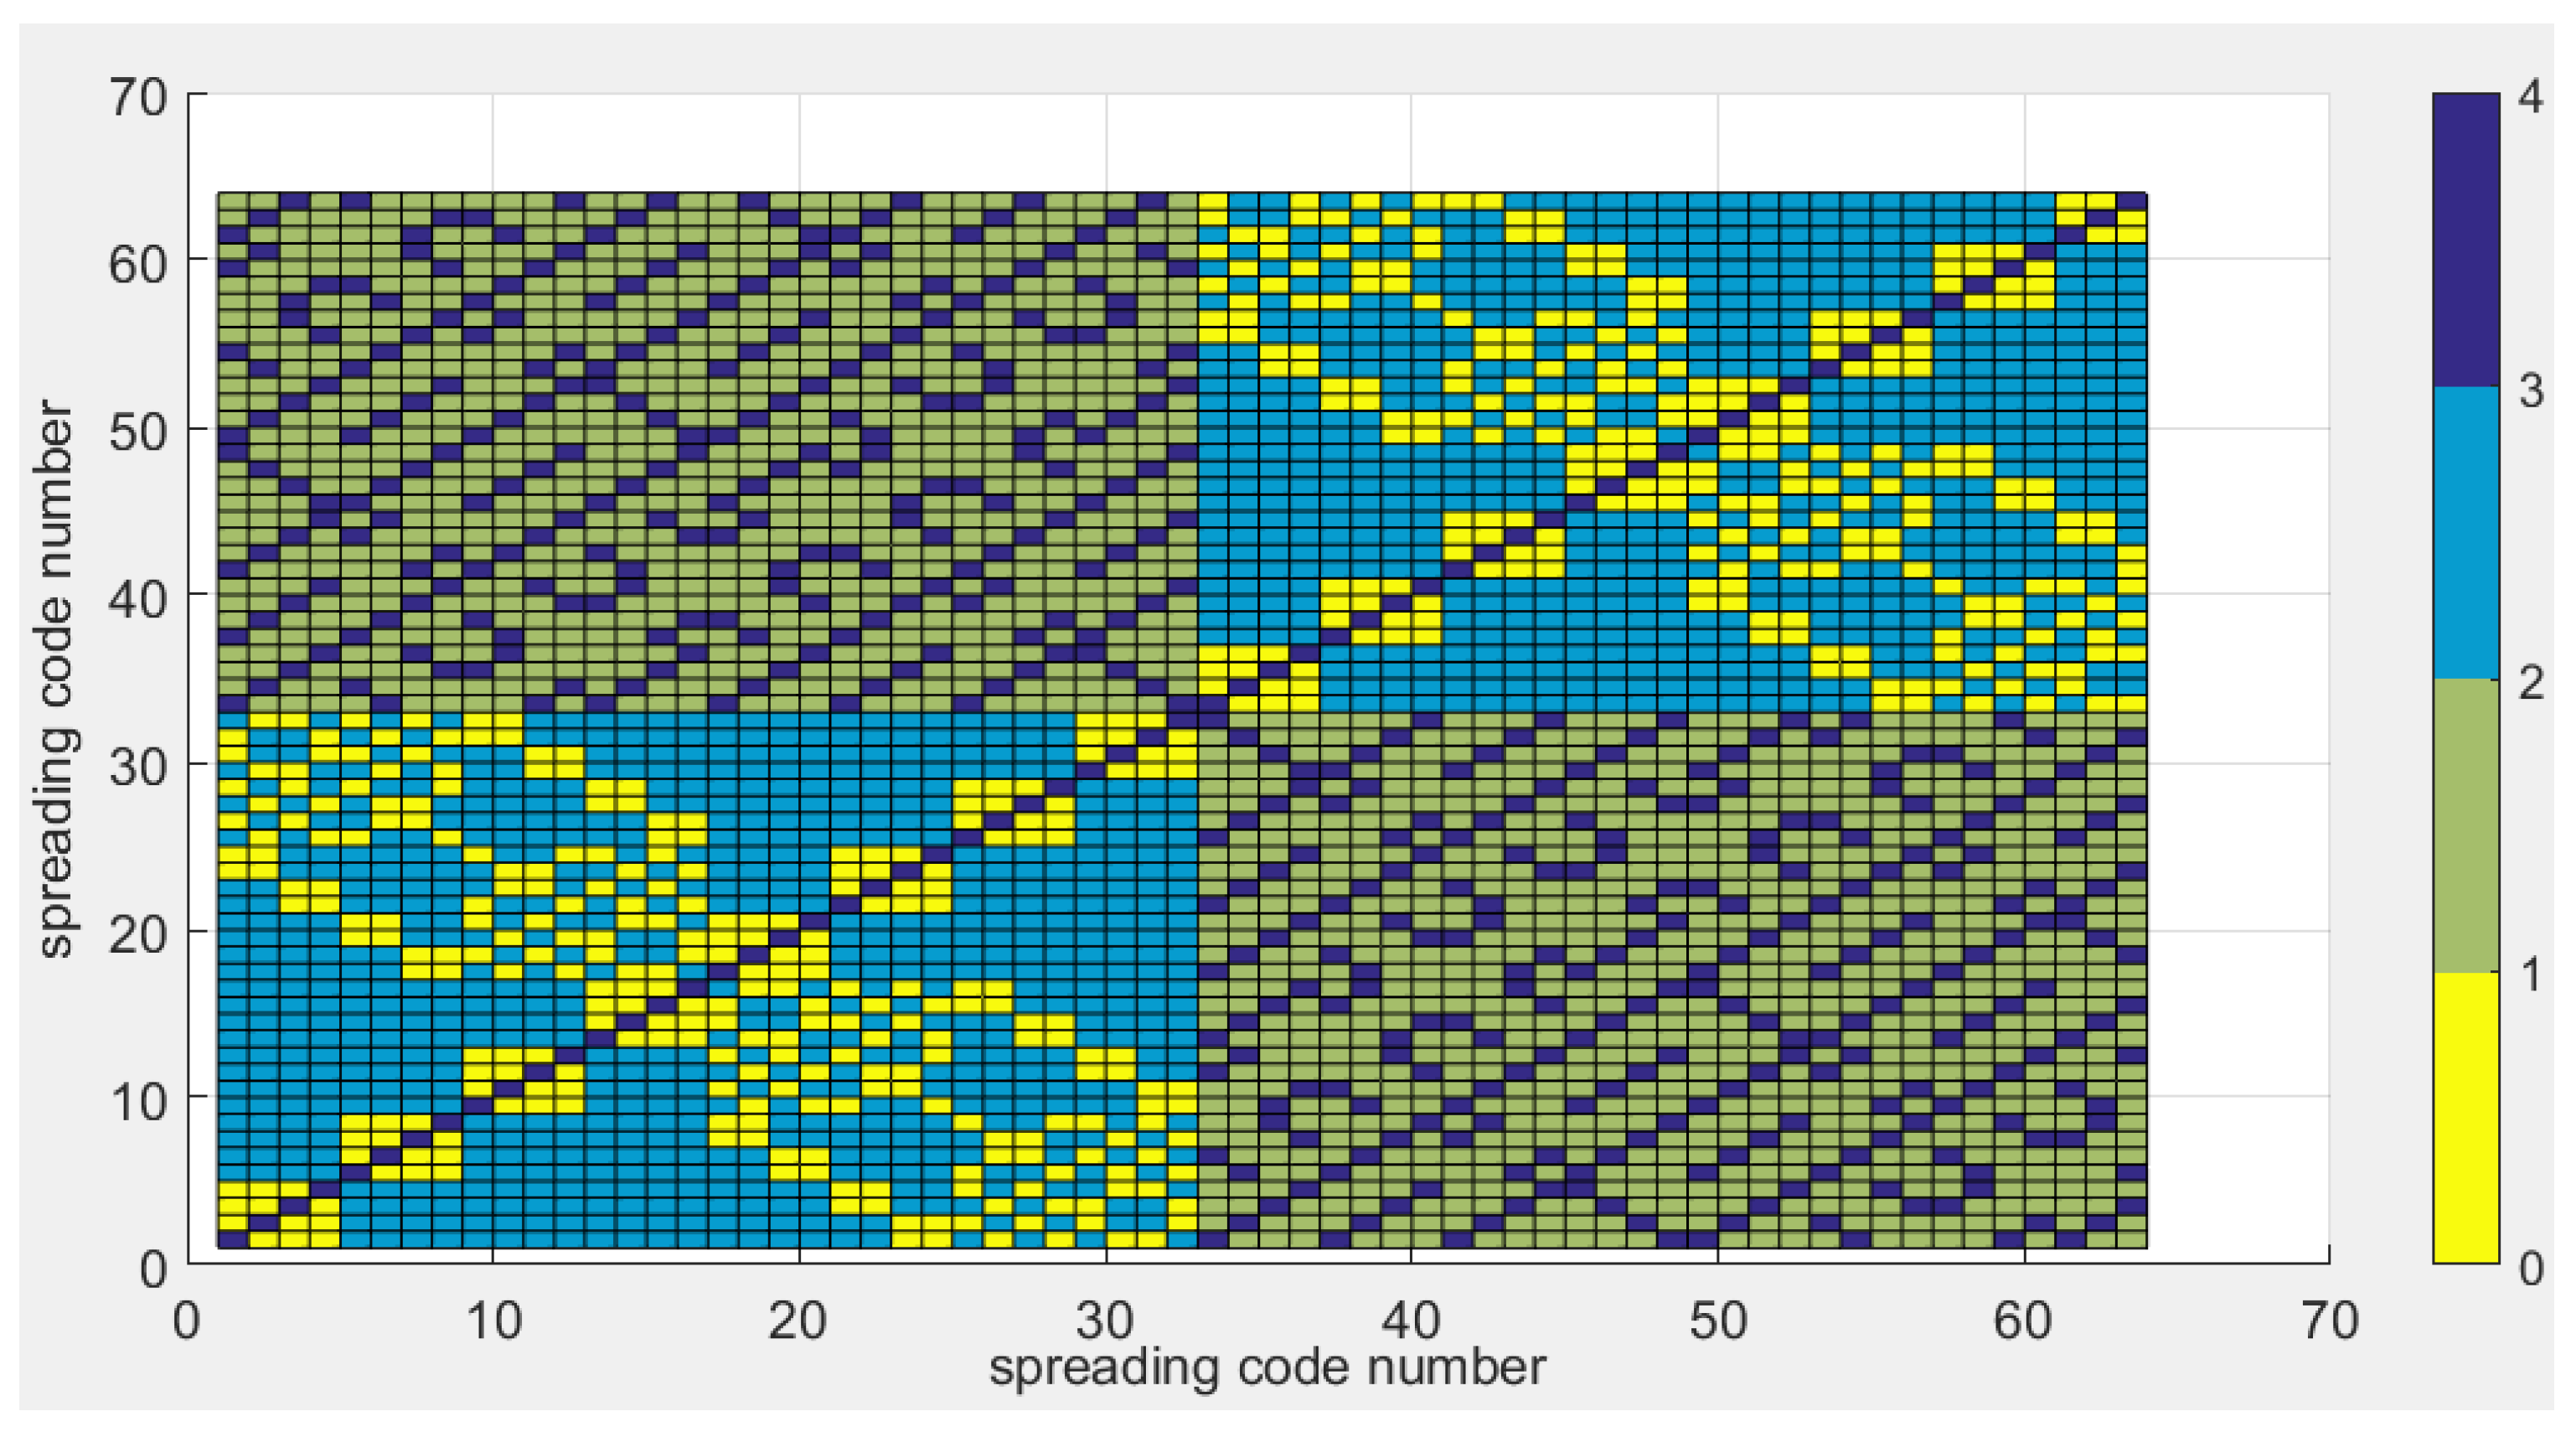
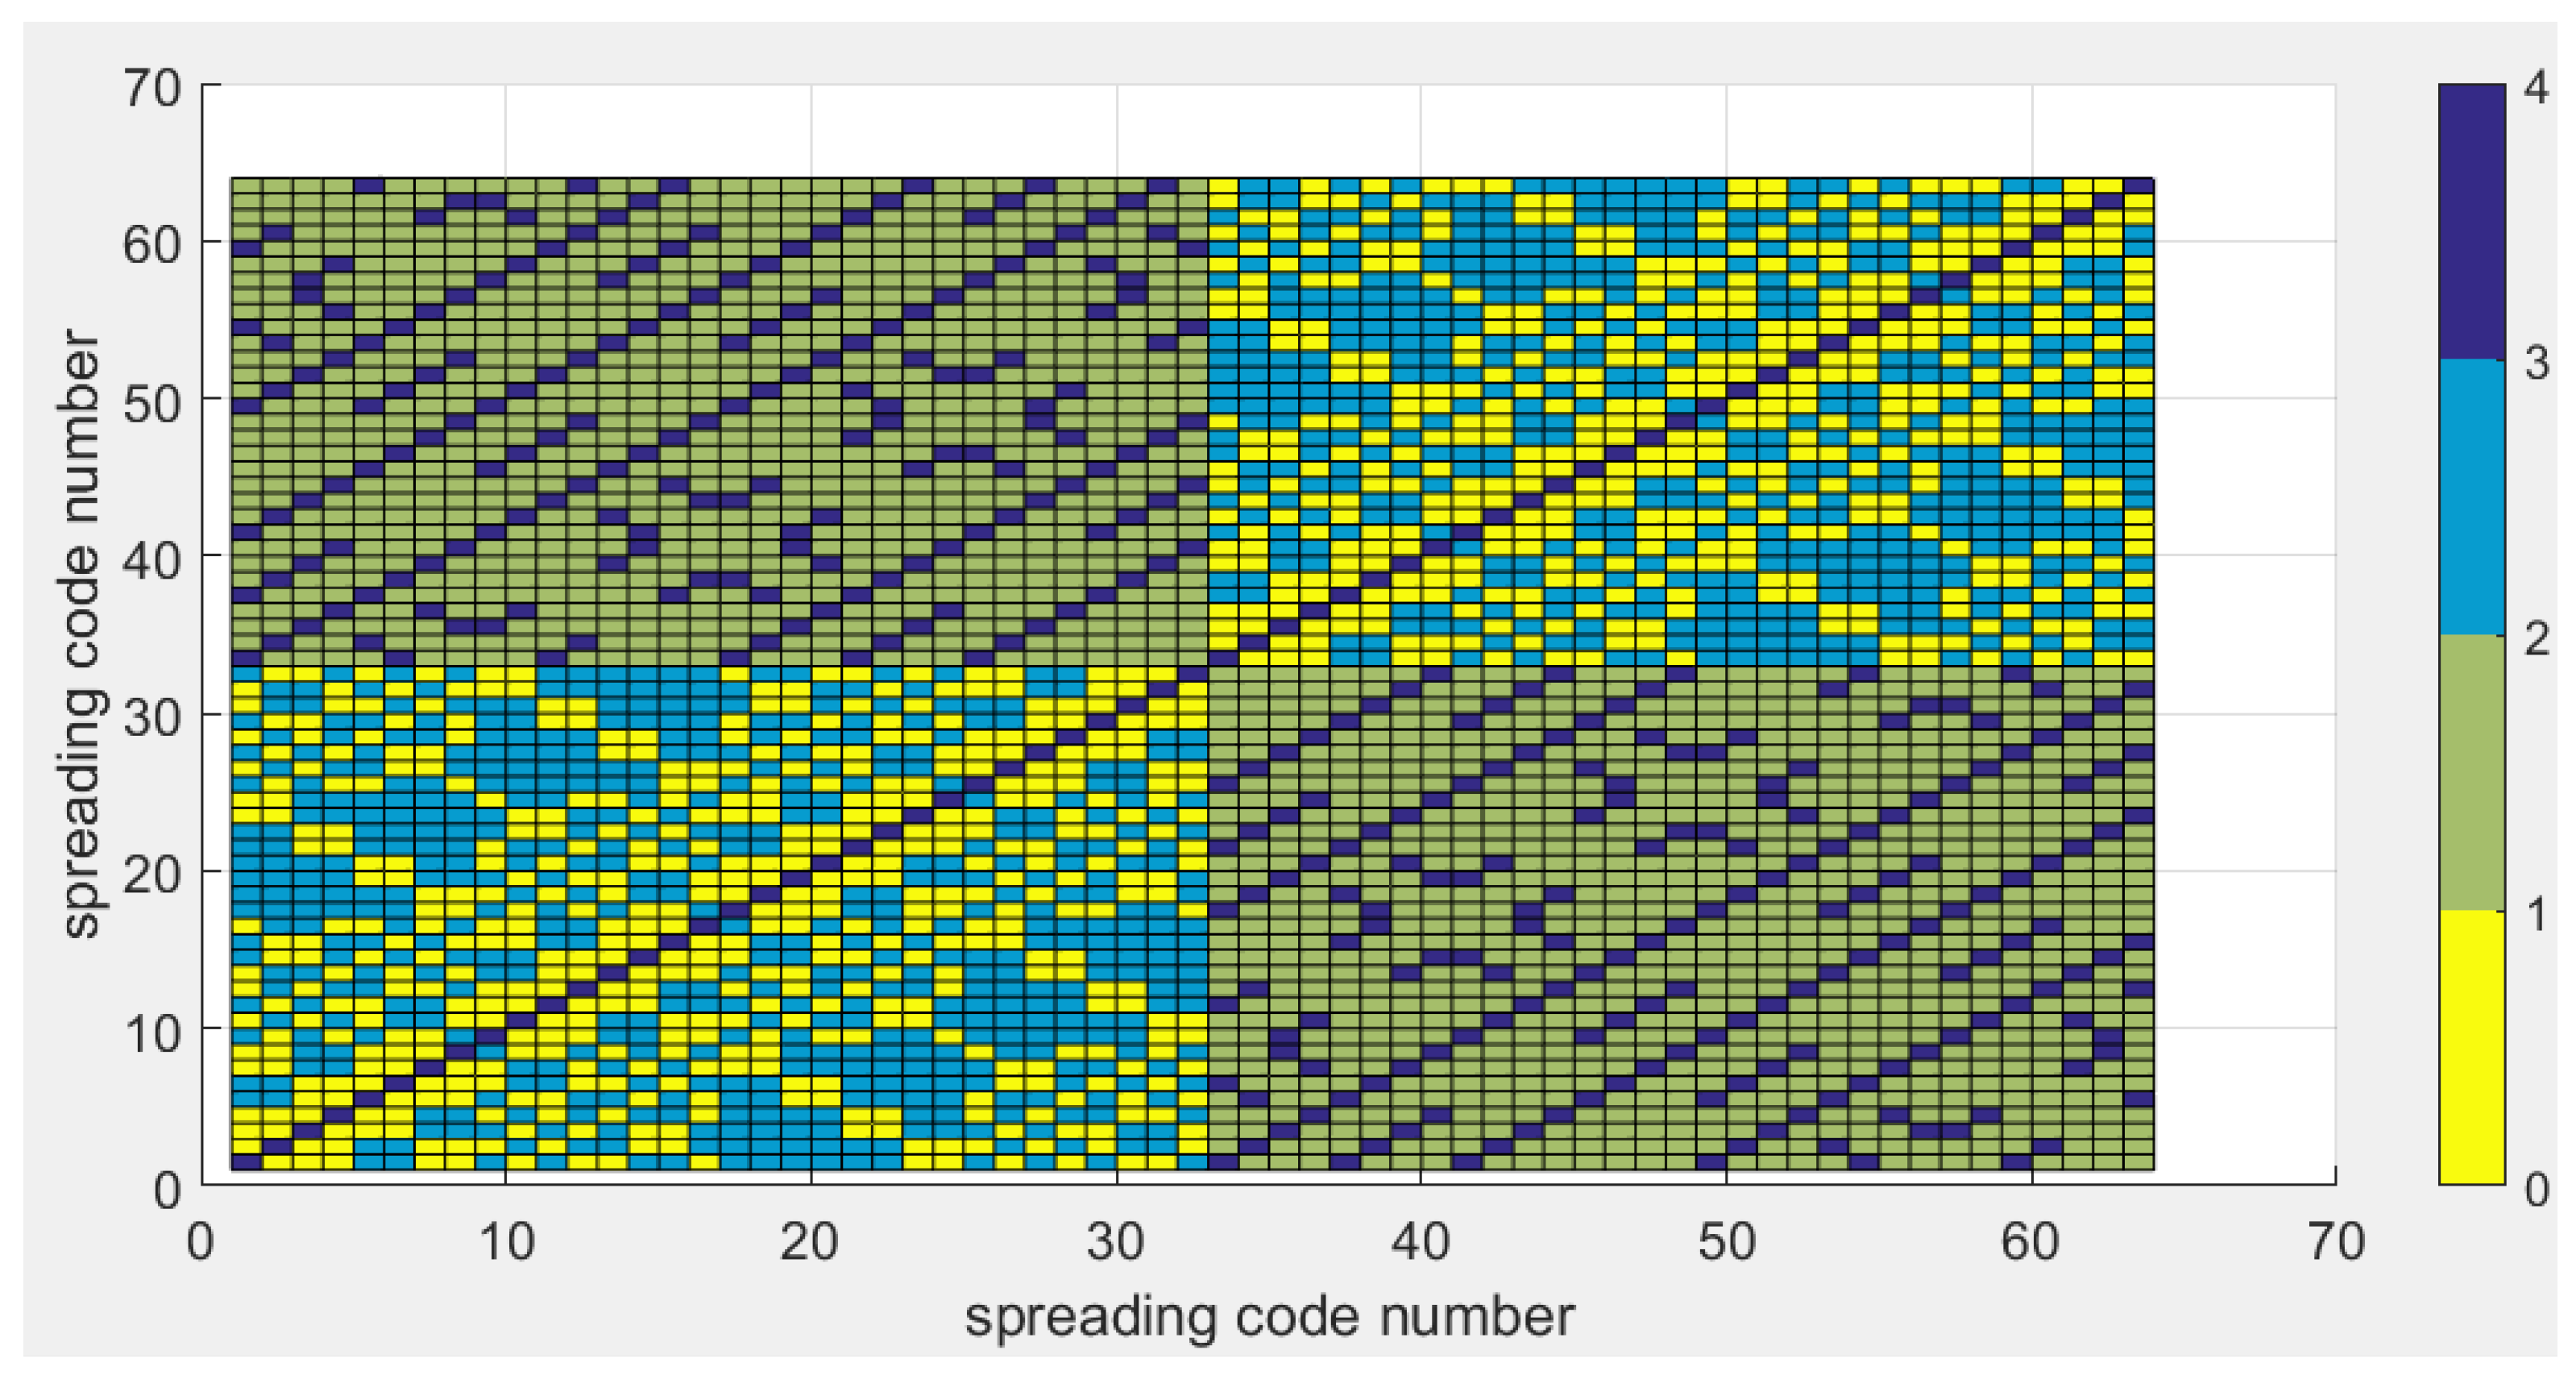
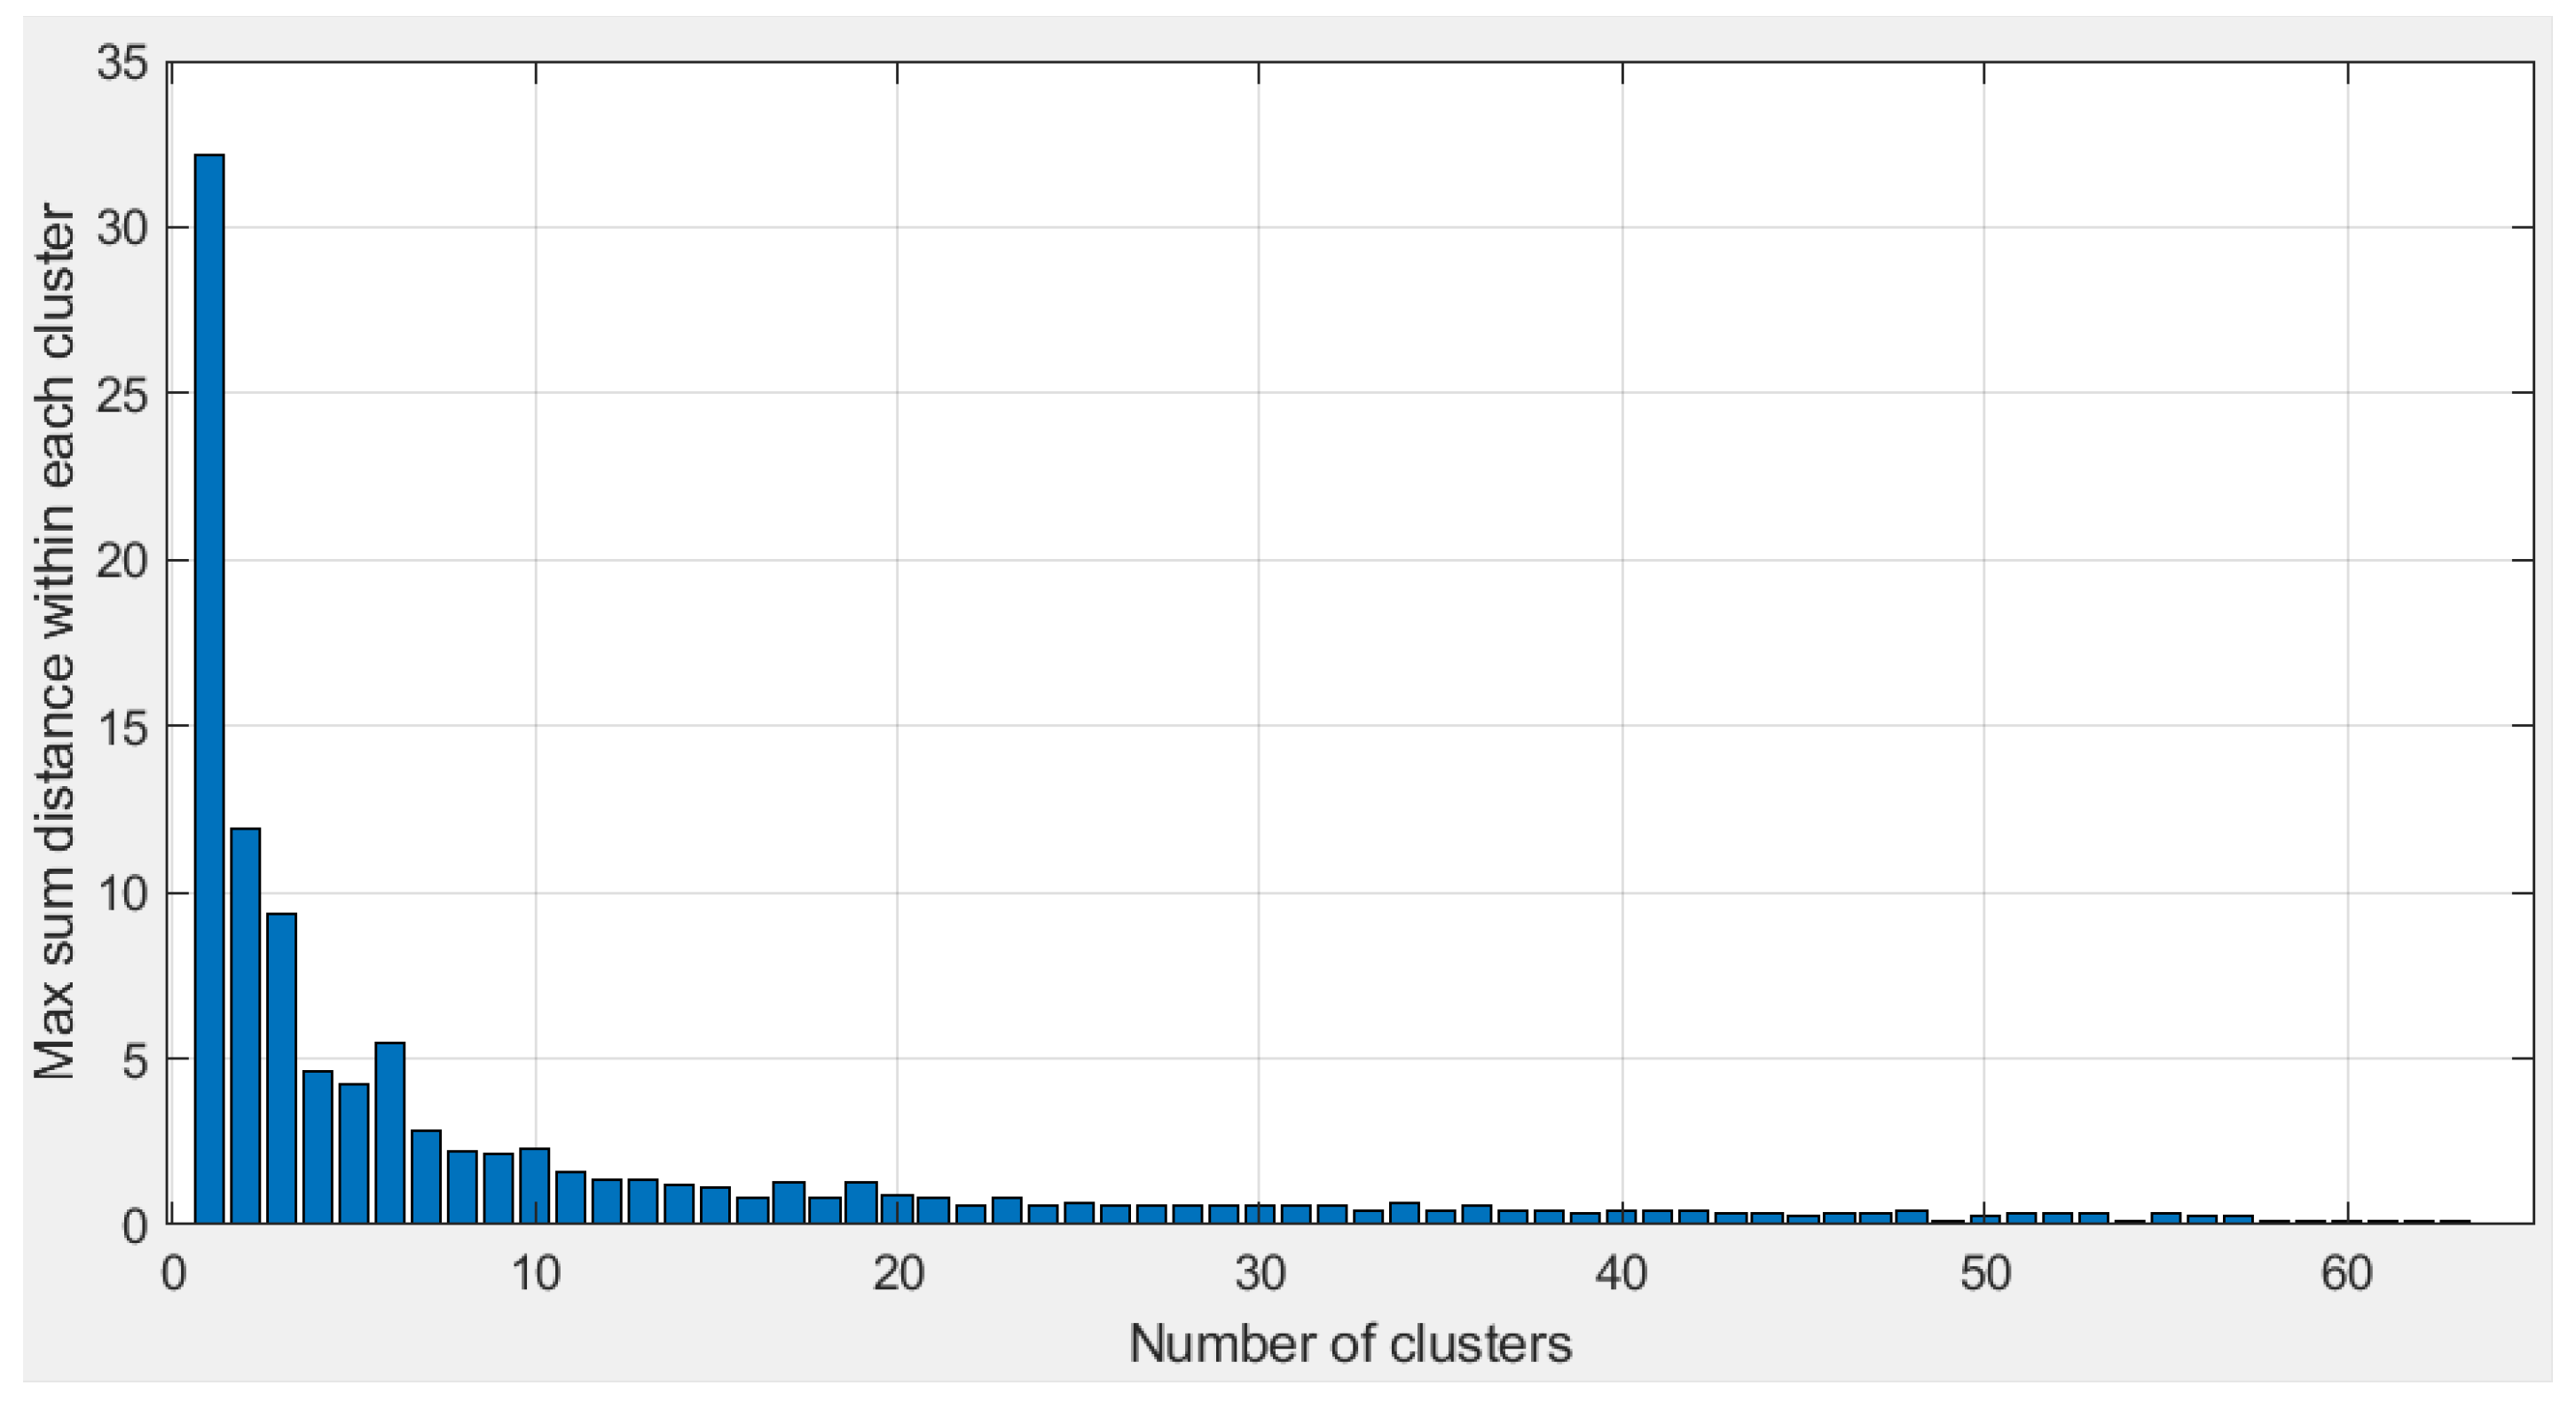
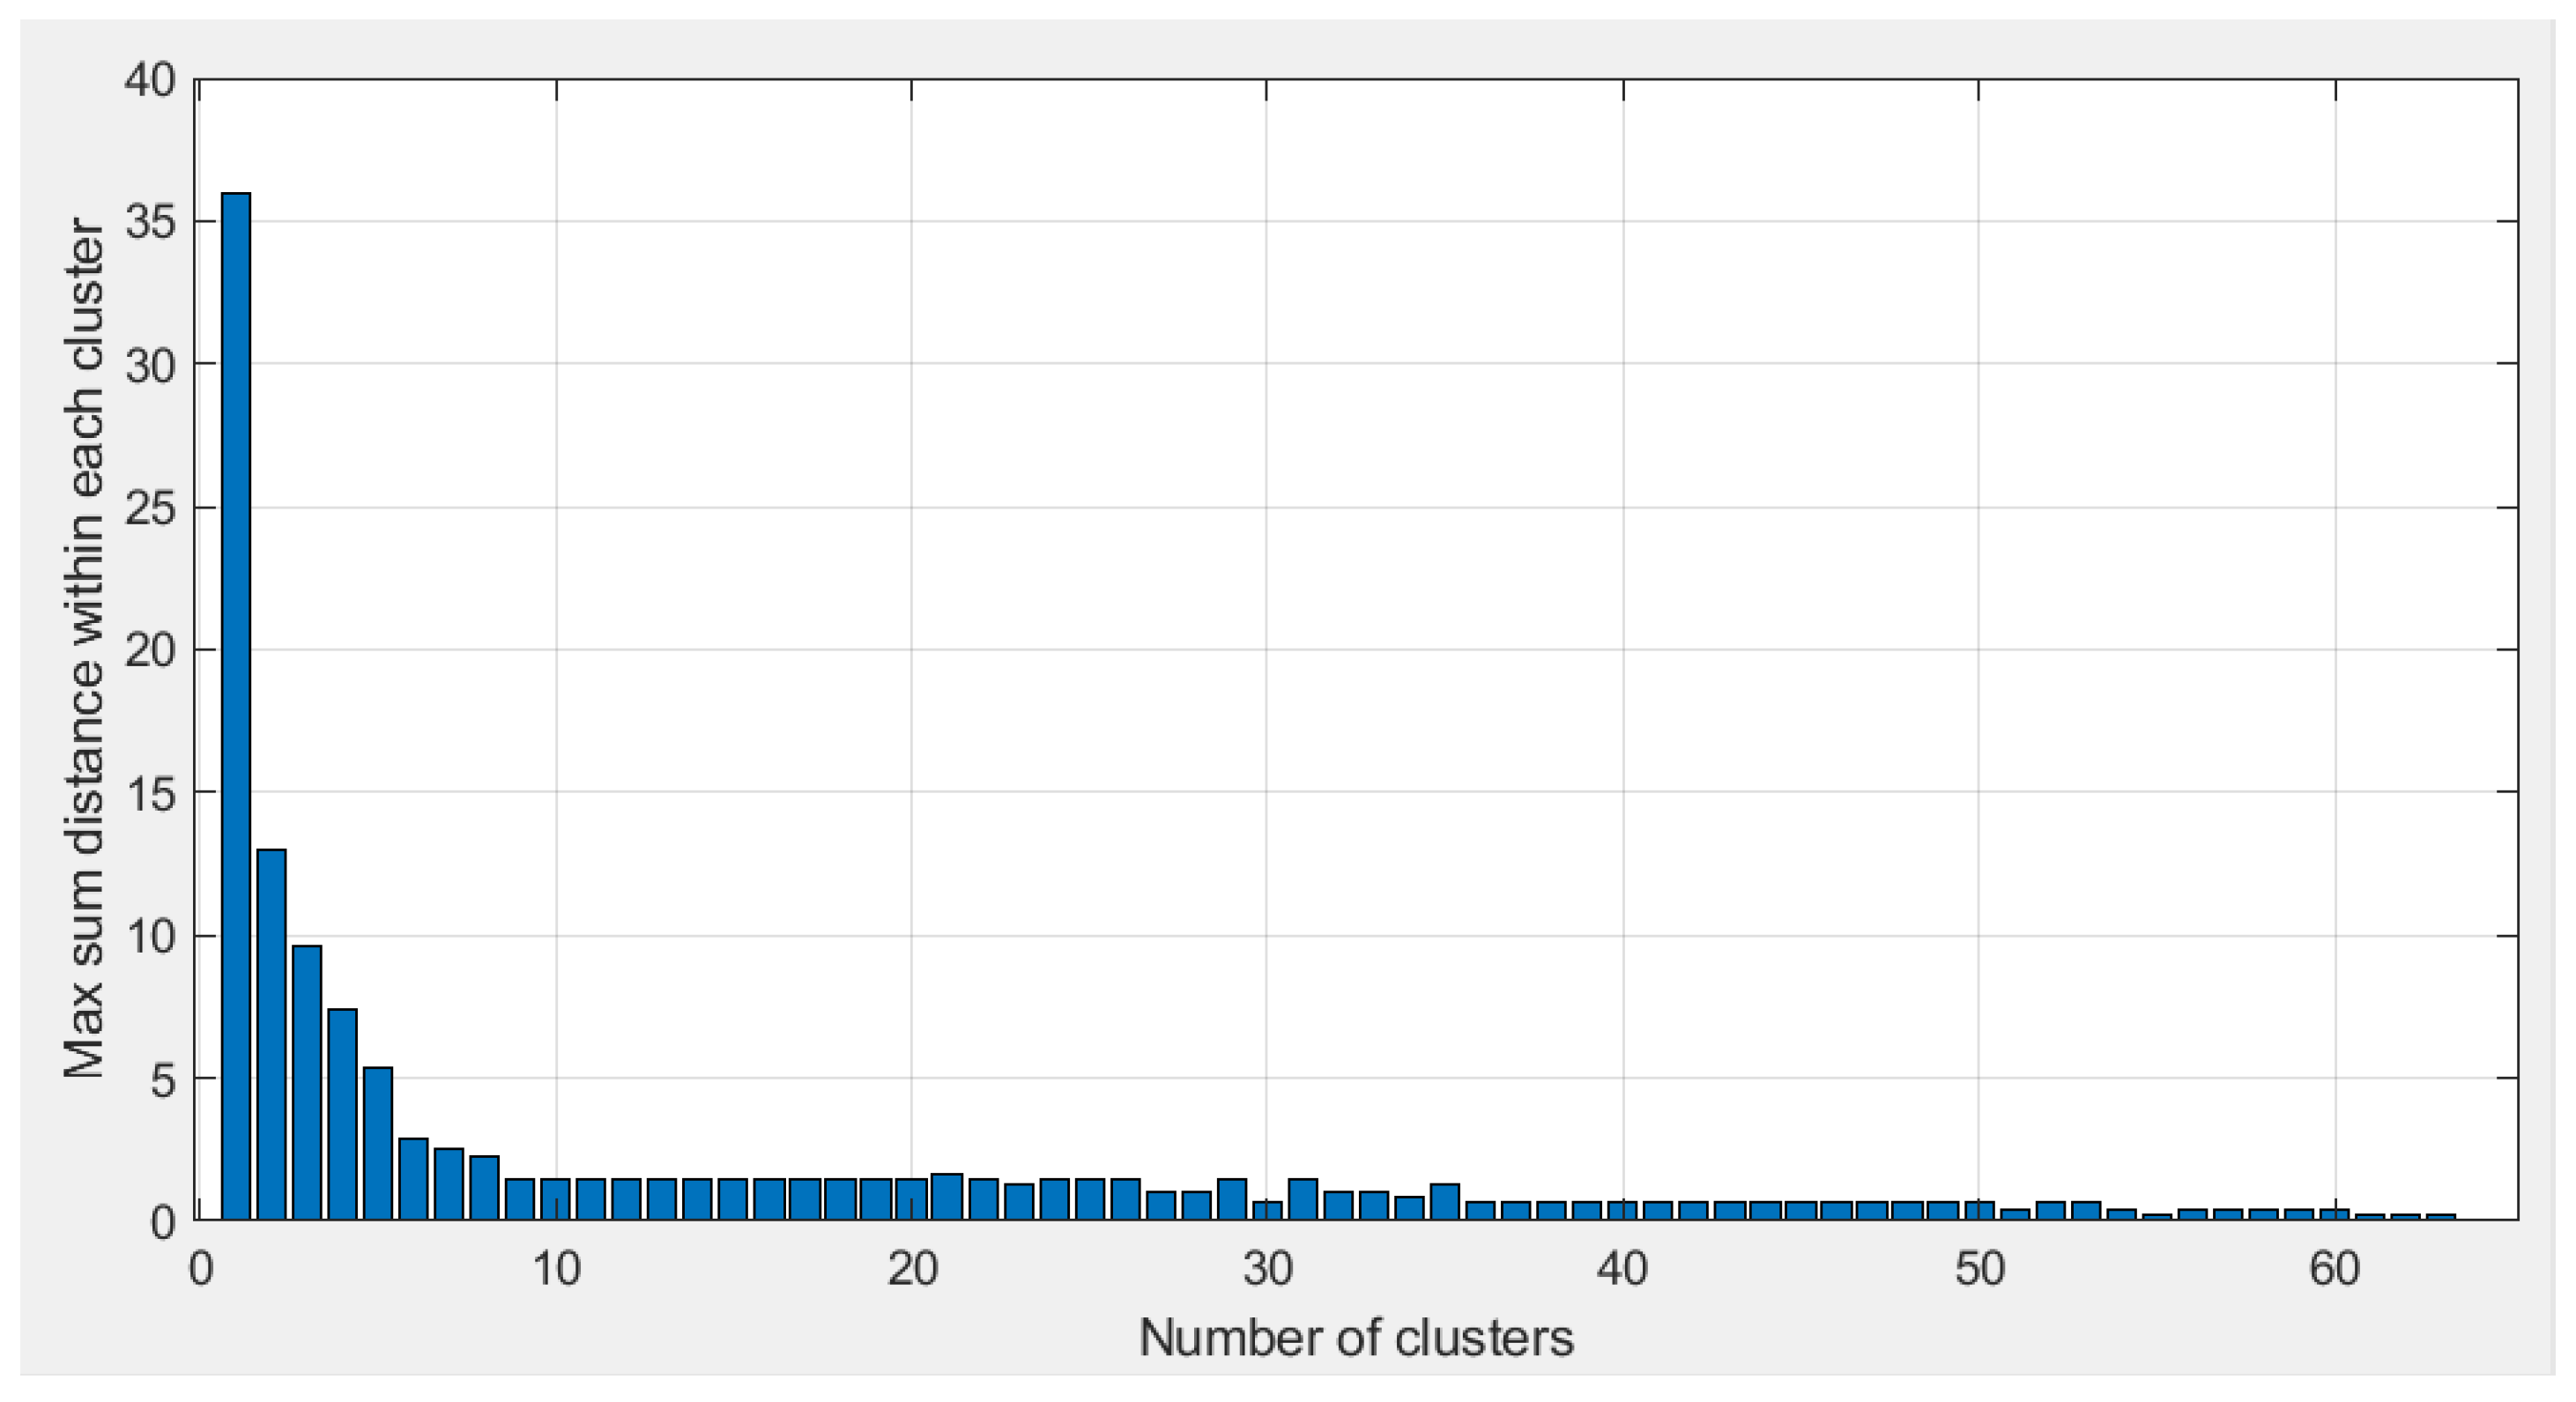
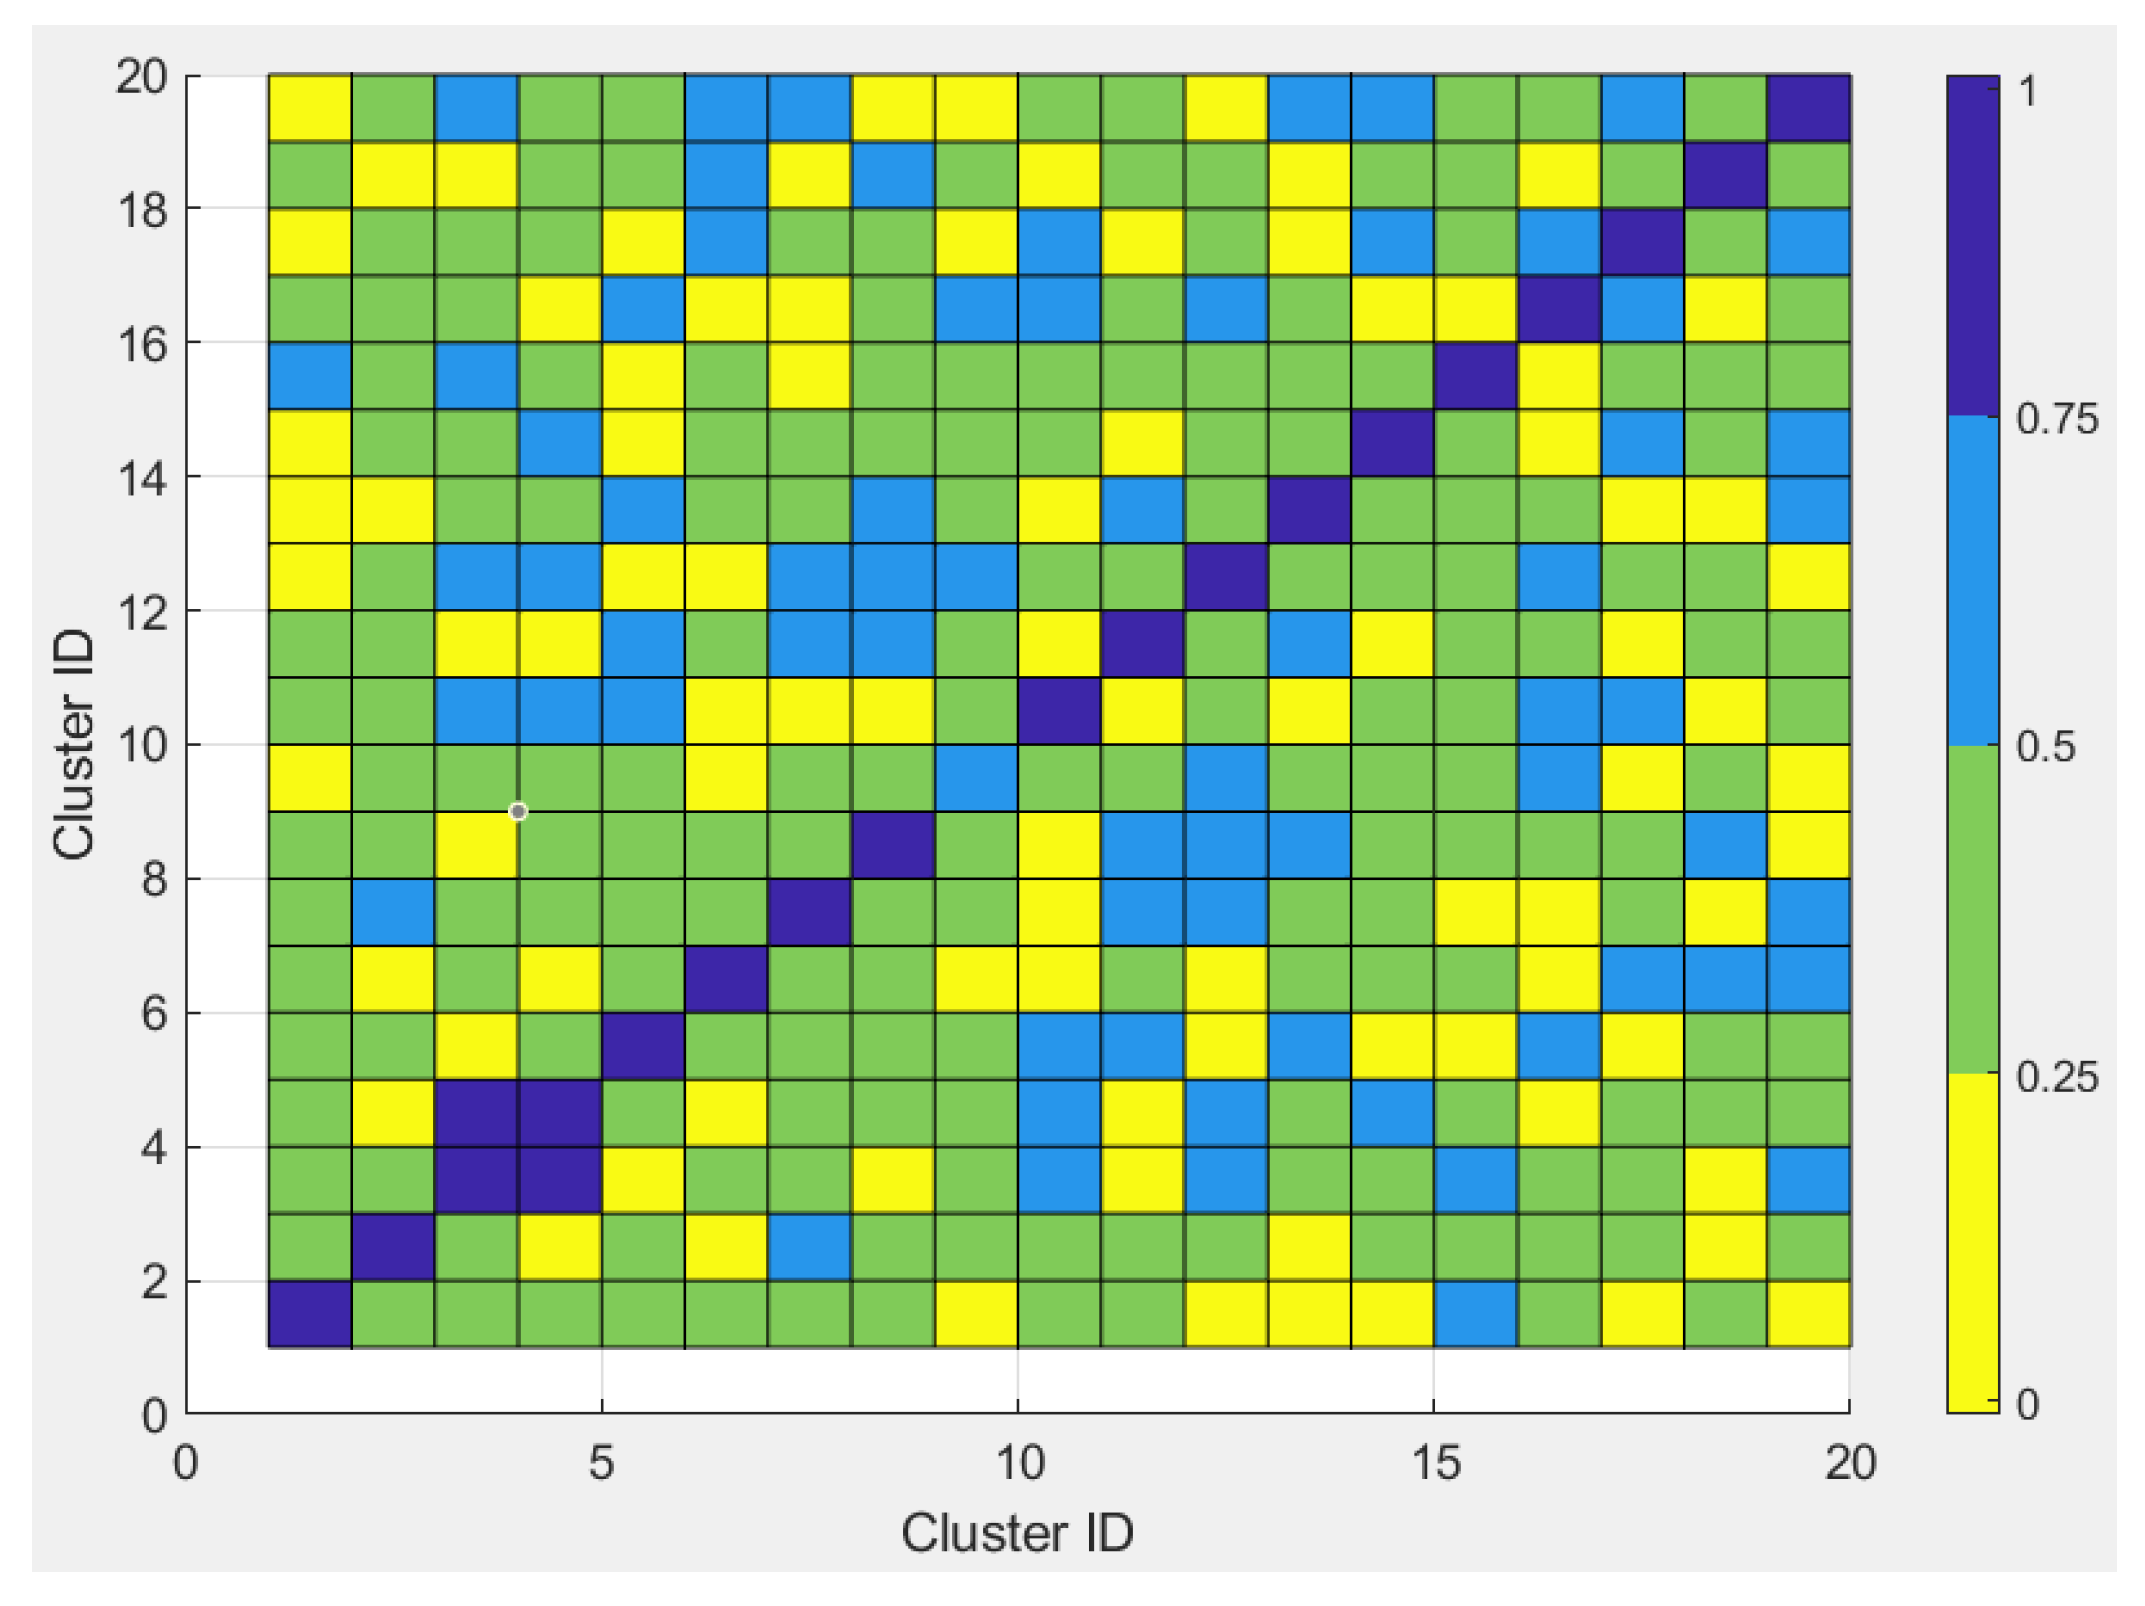
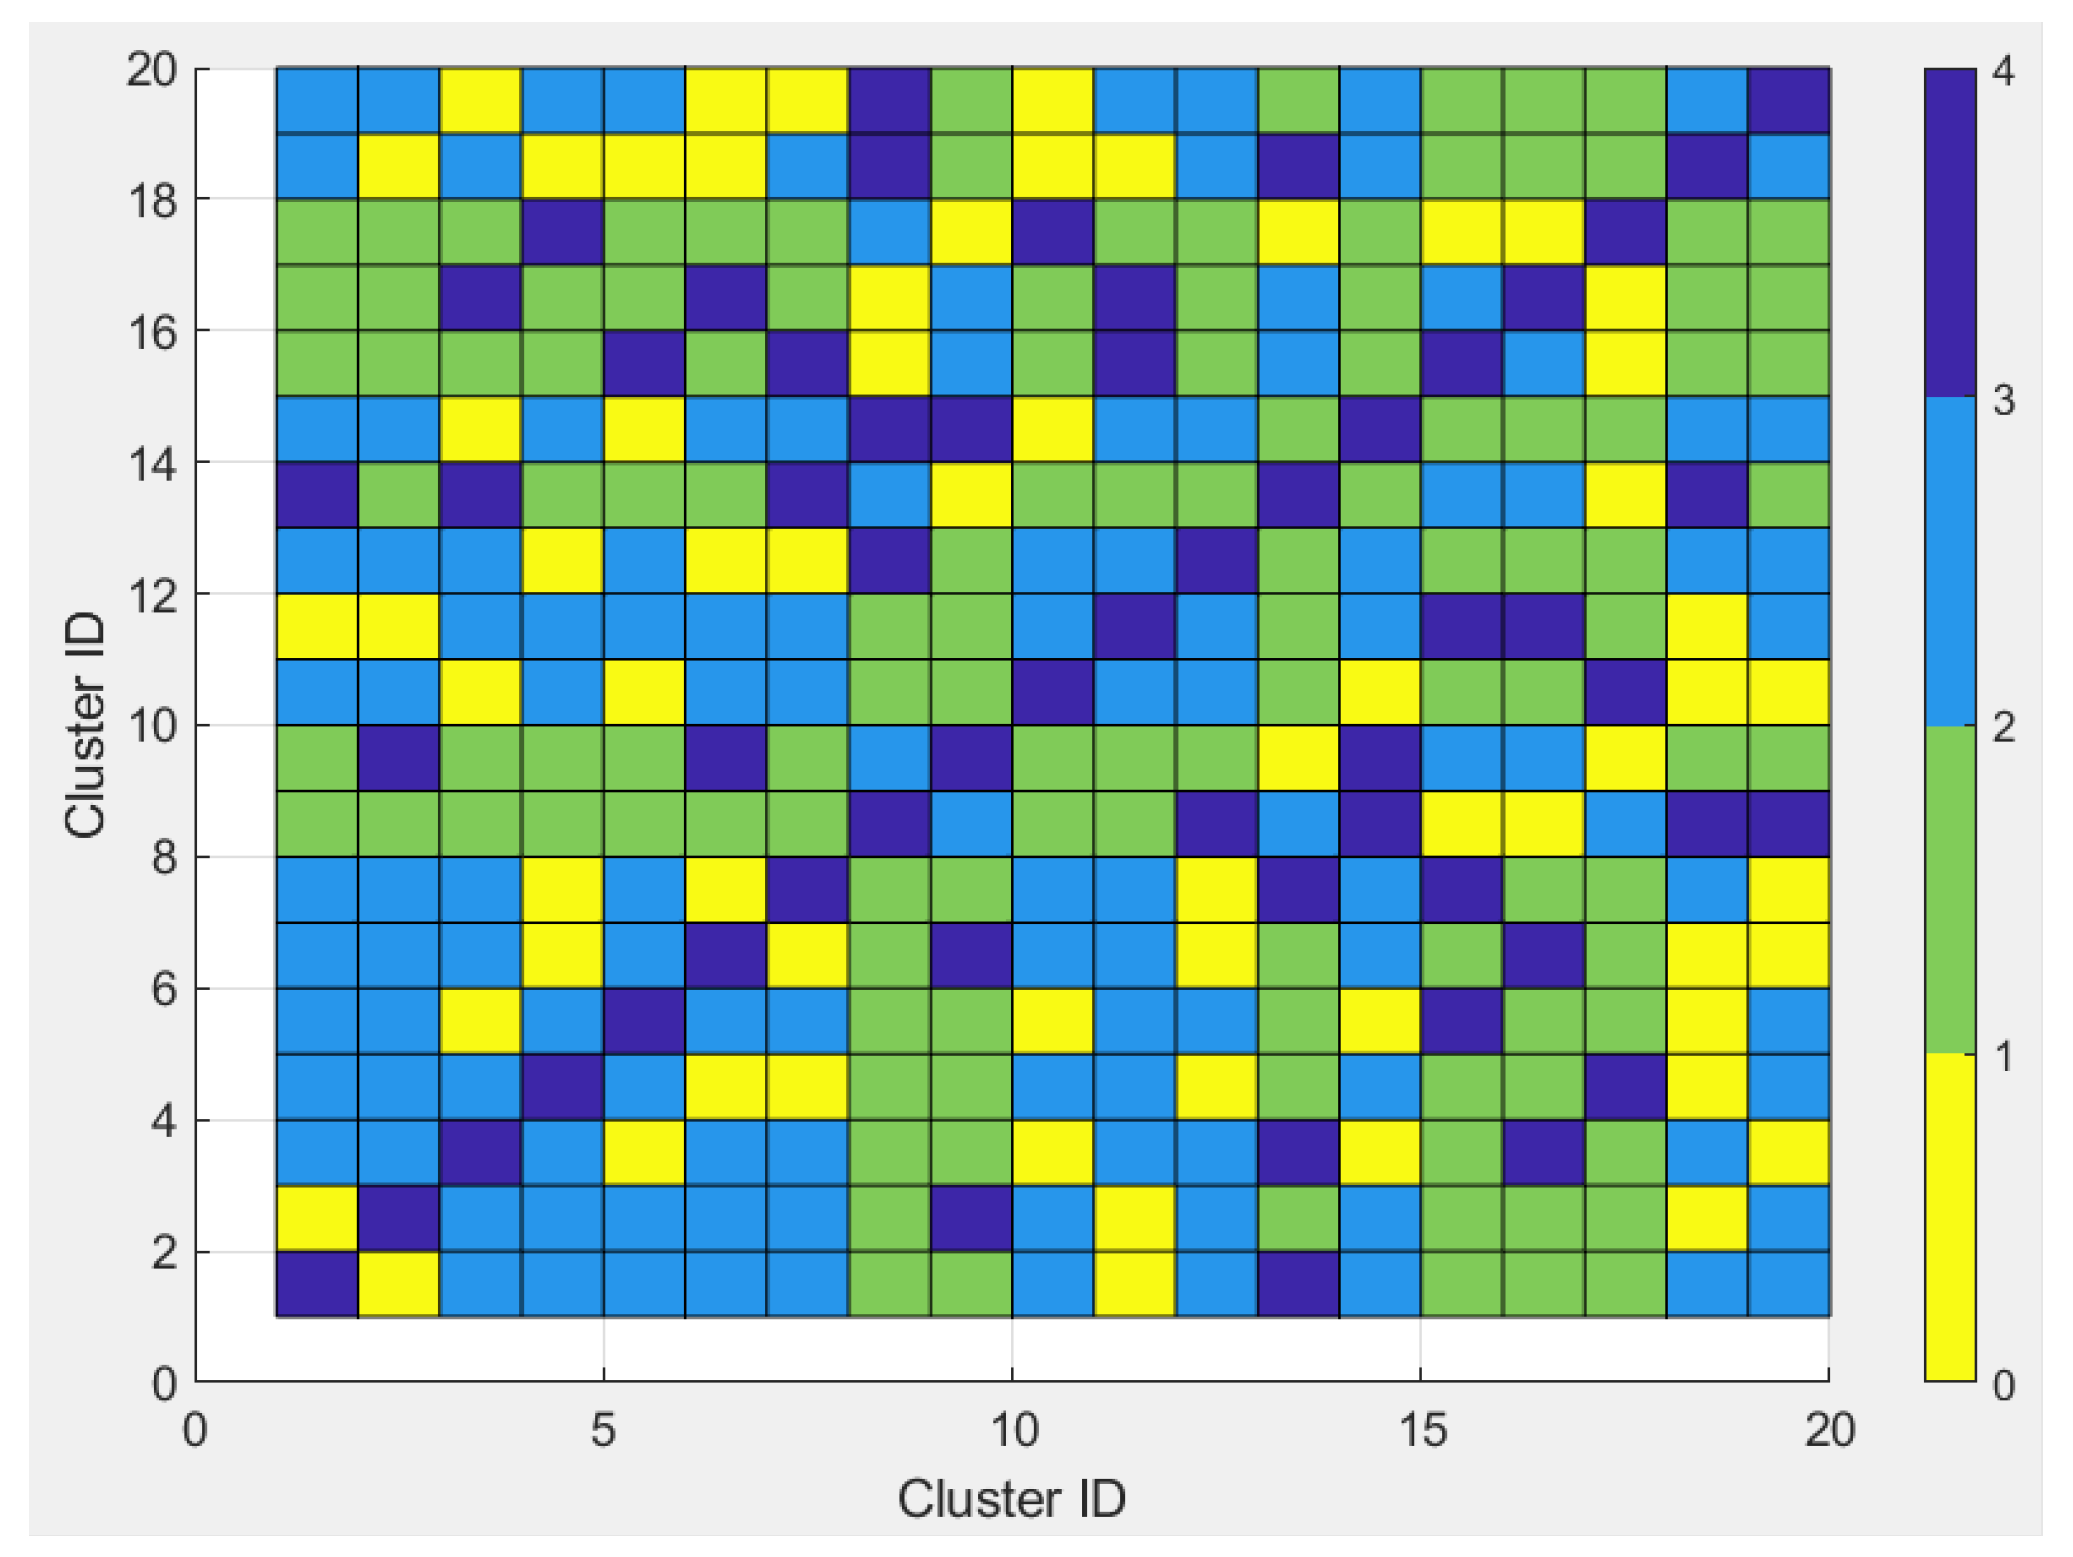
2.2. Cluster Conception and Performance

Since the selection of the most appropriate low-correlation codes is not trivial, as all combinations need to be explored, in this paper, an enhanced method for allocating the sequences that aim to minimize the cross-correlation between allocated sequences is proposed. The method implies the following two steps:
  • The method first creates k groups (clusters) of highly cross-correlated sequences.
  • Next, a single sequence is assigned to various users, chosen at random from the group. Users are divided into groups based on a round-robin process. Users using the same cluster can only randomly choose sequences from that corresponding cluster.
Compared to the random classical approach, this novel approach decreases the probability of allocating highly correlated (or the same) sequences to different users, which, in turn, leads to better system performance.
K-means and k-medoids clustering algorithms were used to group length L complex values and MUSA sequences. [55]. Each sequence is assumed to be a variable having coordinates in the L-dimensions plane.
The cross-correlation matrix in Figure 3 illustrates the maximum value equal to 4 (code length) and shows that any code is orthogonal with 9 other codes. Also, each code has a low cross-correlation (>0 and no more than 1.4 in absolute value) with 24 other codes.
Three metrics for cross-correlation were examined, including the squared Euclidean distance, the sample correlation between sequences [39], and the cross-correlation (the dot product, x × yH) introduced in Equation (2):
Squared Euclidean distance:
Assumption: The higher the distance d between sequences s and c, the less the cross-correlation.
The center sequence of cluster c is the average value of the sequences of the cluster:
( s , c ) = ( s c ) ( s c ) H
Sample correlation between sequences:
Assumption: The higher the difference of “1 − sample correlation between points” (viewed as sequences of values) is, the smaller the correlation.
To determine the sequences of a cluster, they are normalized to have zero mean and unit standard deviation. Next, the center sequence (s) in cluster (c) is computed.
( s , c ) = 1 ( s s ¯ ) ( c c ¯ ) H ( s s ¯ ) ( s s ¯ ) ( c c ¯ ) ( c c ¯ ) H
s ¯ = 1 L ( j = 1 L s j ) 1 L ¯
c ¯ = 1 L ( j = 1 L c j ) 1 L ¯
where 1 L ¯ is a row of L elements of one.
s j , c j are elements of a sequence s and the cluster’s center c.
One minus the normalized cross-correlation.
d ( s , c ) = 1 | s c H | 4
The clustering algorithm groups highly correlated codes by minimizing the distance between them. Therefore, the distance metric should be smaller for codes with high correlation. Thus, we chose one minus the normalized cross-correlation as a distance metric.
K-means and k-medoids implementations in MATLAB simulation environments only accept sequences with real values. Thus, the complex value spreading codes were converted into real values using 2 × L length sequences as follows:
s r e a l = as   [ Real   ( s ) Imag   ( s ) ]
This changed the correlation properties between the codes compared to Figure 3. The autocorrelation remains the same (diagonal values equal to 4), but the cross-correlation is lower on average, which means that more orthogonal sequences can result from this approach. For instance, in this case, any code is orthogonal with 15 other codes (cross-correlation equals the minimum value of 0), and any code has a low cross-correlation (equal to 1) with 26 others. Figure 4 displays the absolute value of the cross-correlation between the real value sequences.
To overcome the limitation of k-means implementation that uses predefined distance metrics, a similar clustering algorithm (k-medoids) was investigated. It allows the use of any distance metrics, including one minus the normalized cross-correlation mentioned previously. Both k-means and k-medoids algorithms split the data into k mutually exclusive clusters by minimizing the distance from the points to the cluster center. Compared to k-means, which sets the cluster center as the mean of points, k-medoids sets it to the median of the points. Thus, in the k-medoids algorithm, the cluster center is one of the sequences from the cluster.
The number of clusters, denoted by k, required to group the sequences is unknown. To identify the optimum value, the sum of the sequences’ distances to the cluster is computed and plotted for various numbers of clusters. The assumption is that the smaller the sum distance, the more correlated the sequences belonging to the same cluster. Figure 5 and Figure 6 show the maximum sum distances across the clusters for various values of k for k-means and k-medoids implementations.
In the k-means algorithm, the maximum sum distance has a steep decrease between 1 and 10 clusters, and after k = 20, the decreasing rate is negligible. Yet, the k-medoids algorithm with the modified distance metric shows a faster distance decrease from 10 clusters, and the lowering rate reduces significantly. Therefore, grouping the sequences in more than 20 and 10 clusters, respectively, will lead to clusters with marginally higher correlated sequences. To support this affirmation, Figure 7 illustrates the plot of the minimum correlation between sequences of the same cluster, averaged across the clusters. The cross-correlation between complex-valued sequences within clusters increases exponentially with the number of clusters and begins to flatten once k exceeds 20 clusters.
If 20 clusters are used, the minimum correlation between complex-valued sequences of various clusters is depicted in Figure 8 and Figure 9. For the minimum value equal to 4, it can be assumed that the cluster contained a single sequence. The higher the minimum value, the more correlated the sequences of the same cluster. Given that the minimum cross-correlation is never equal to 0, the clusters do not contain orthogonal sequences. Note that, on average, k-medoids with the modified distance metric led to a higher correlation within clusters compared to k-means, where the correlation distance was applied to a length of 8 real sequences.
However, this clustering approach does not provide any insights into the cross-correlation between sequences of different clusters. Thus, an additional algorithm would be required to ensure that during the allocation of sequences from different clusters, those are decorrelated enough. An insight into the correlation between sequences of various clusters is evaluated in Figure 10 when plotting the cross-correlation matrix between the center sequences of different clusters for k = 20 clusters.
It is noticeable that the correlation between any sequence of difference clusters is not zero; instead, correlation values typically range from 0.4 to 1.
Most of the correlation values in Figure 11 are lower than the code length’s maximum value of 4.

3. System Model and Set-Up

The implemented uplink wireless communication system employs CD-NOMA for multiple access in a multiple-cell system (with K users having one individual antenna), with one base station (BS) using two or four antennas. Rayleigh fading or Rice fading with a K-factor equal to 5 dB was assumed to affect all channels [43,44]. The MMSE and MMSE-SIC detectors were deployed at the base station [41,42], and users were transmitting OFDM symbols. Thus, the system is less susceptible to interference and uses the channel bandwidth more efficiently.
Other aspects of the system setup consist of the following:
  • The number of users varies from 20 to 70.
  • The length of data transmitted by each user is 700 or 7000 bits.
  • Digital modulation: BPSK and QPSK;
  • Noise on the communication channel: AWGN;
  • Simulation iterations: 10.
After completing the following procedures, an OFDM symbol was produced [56]:
Step 1. Modulation: Data symbols are created by mapping the input bits. This study employed BPSK or QPSK modulation.
Step 2. Different users’ symbols are spread using the codes presented in Section 2.
Step 3. Serial-to-parallel conversion: Each data symbol has a subcarrier associated with it.
Step 4. Inverse fast Fourier transform (iFFT): A translation into the frequency-domain occurs.
Step 5. Parallel-to-serial conversion: The subcarriers’ transmission time expansion occurs.
Step 6. A cyclic prefix (CP)–guard interval is added to each symbol to avoid inter-symbol interference (ISI). The aim is to extend the symbol’s length such that the various copies of a symbol arrive at reception in a multipath propagation, fall within a symbol period, and thus maintain the orthogonality between subcarriers.
The OFDM setup parameters complying with the LTE standards are provided in Table 2.

4. Results and Discussion

This section outlines the simulation results. The performance of the system was evaluated by computing the BER variation with the SNR in different scenarios, and the improvement brought by the clusters division approach was highlighted. The simulations for a negative SNR were considered relevant for the system’s behavior in a very noisy environment. The six types of scenarios are highlighted in Table 3.

4.1. Scenario 1: Two Antennas at BS/20 Users/MUSA Codes Length 4

Figure 12 depicts the results when two detectors, MMSE and MMSE-SIC, are used at the base station. Spreading codewords from Table 1 are allocated to users in two manners: randomly (without any rules) and from different clusters (the codes are divided into 20 clusters using the k-means method and the sample correlation distance metric, as presented in Section 2). Each of the K users is using a single code from only one cluster. The MMSE-SIC detector is leading to better performance in both situations (random and cluster), so this detector will be implemented for the other scenarios. It can also be noted that for two antennas at the base station, using the novel clustering approach, the performance is improved since the BER values decrease faster as the SNR increases.

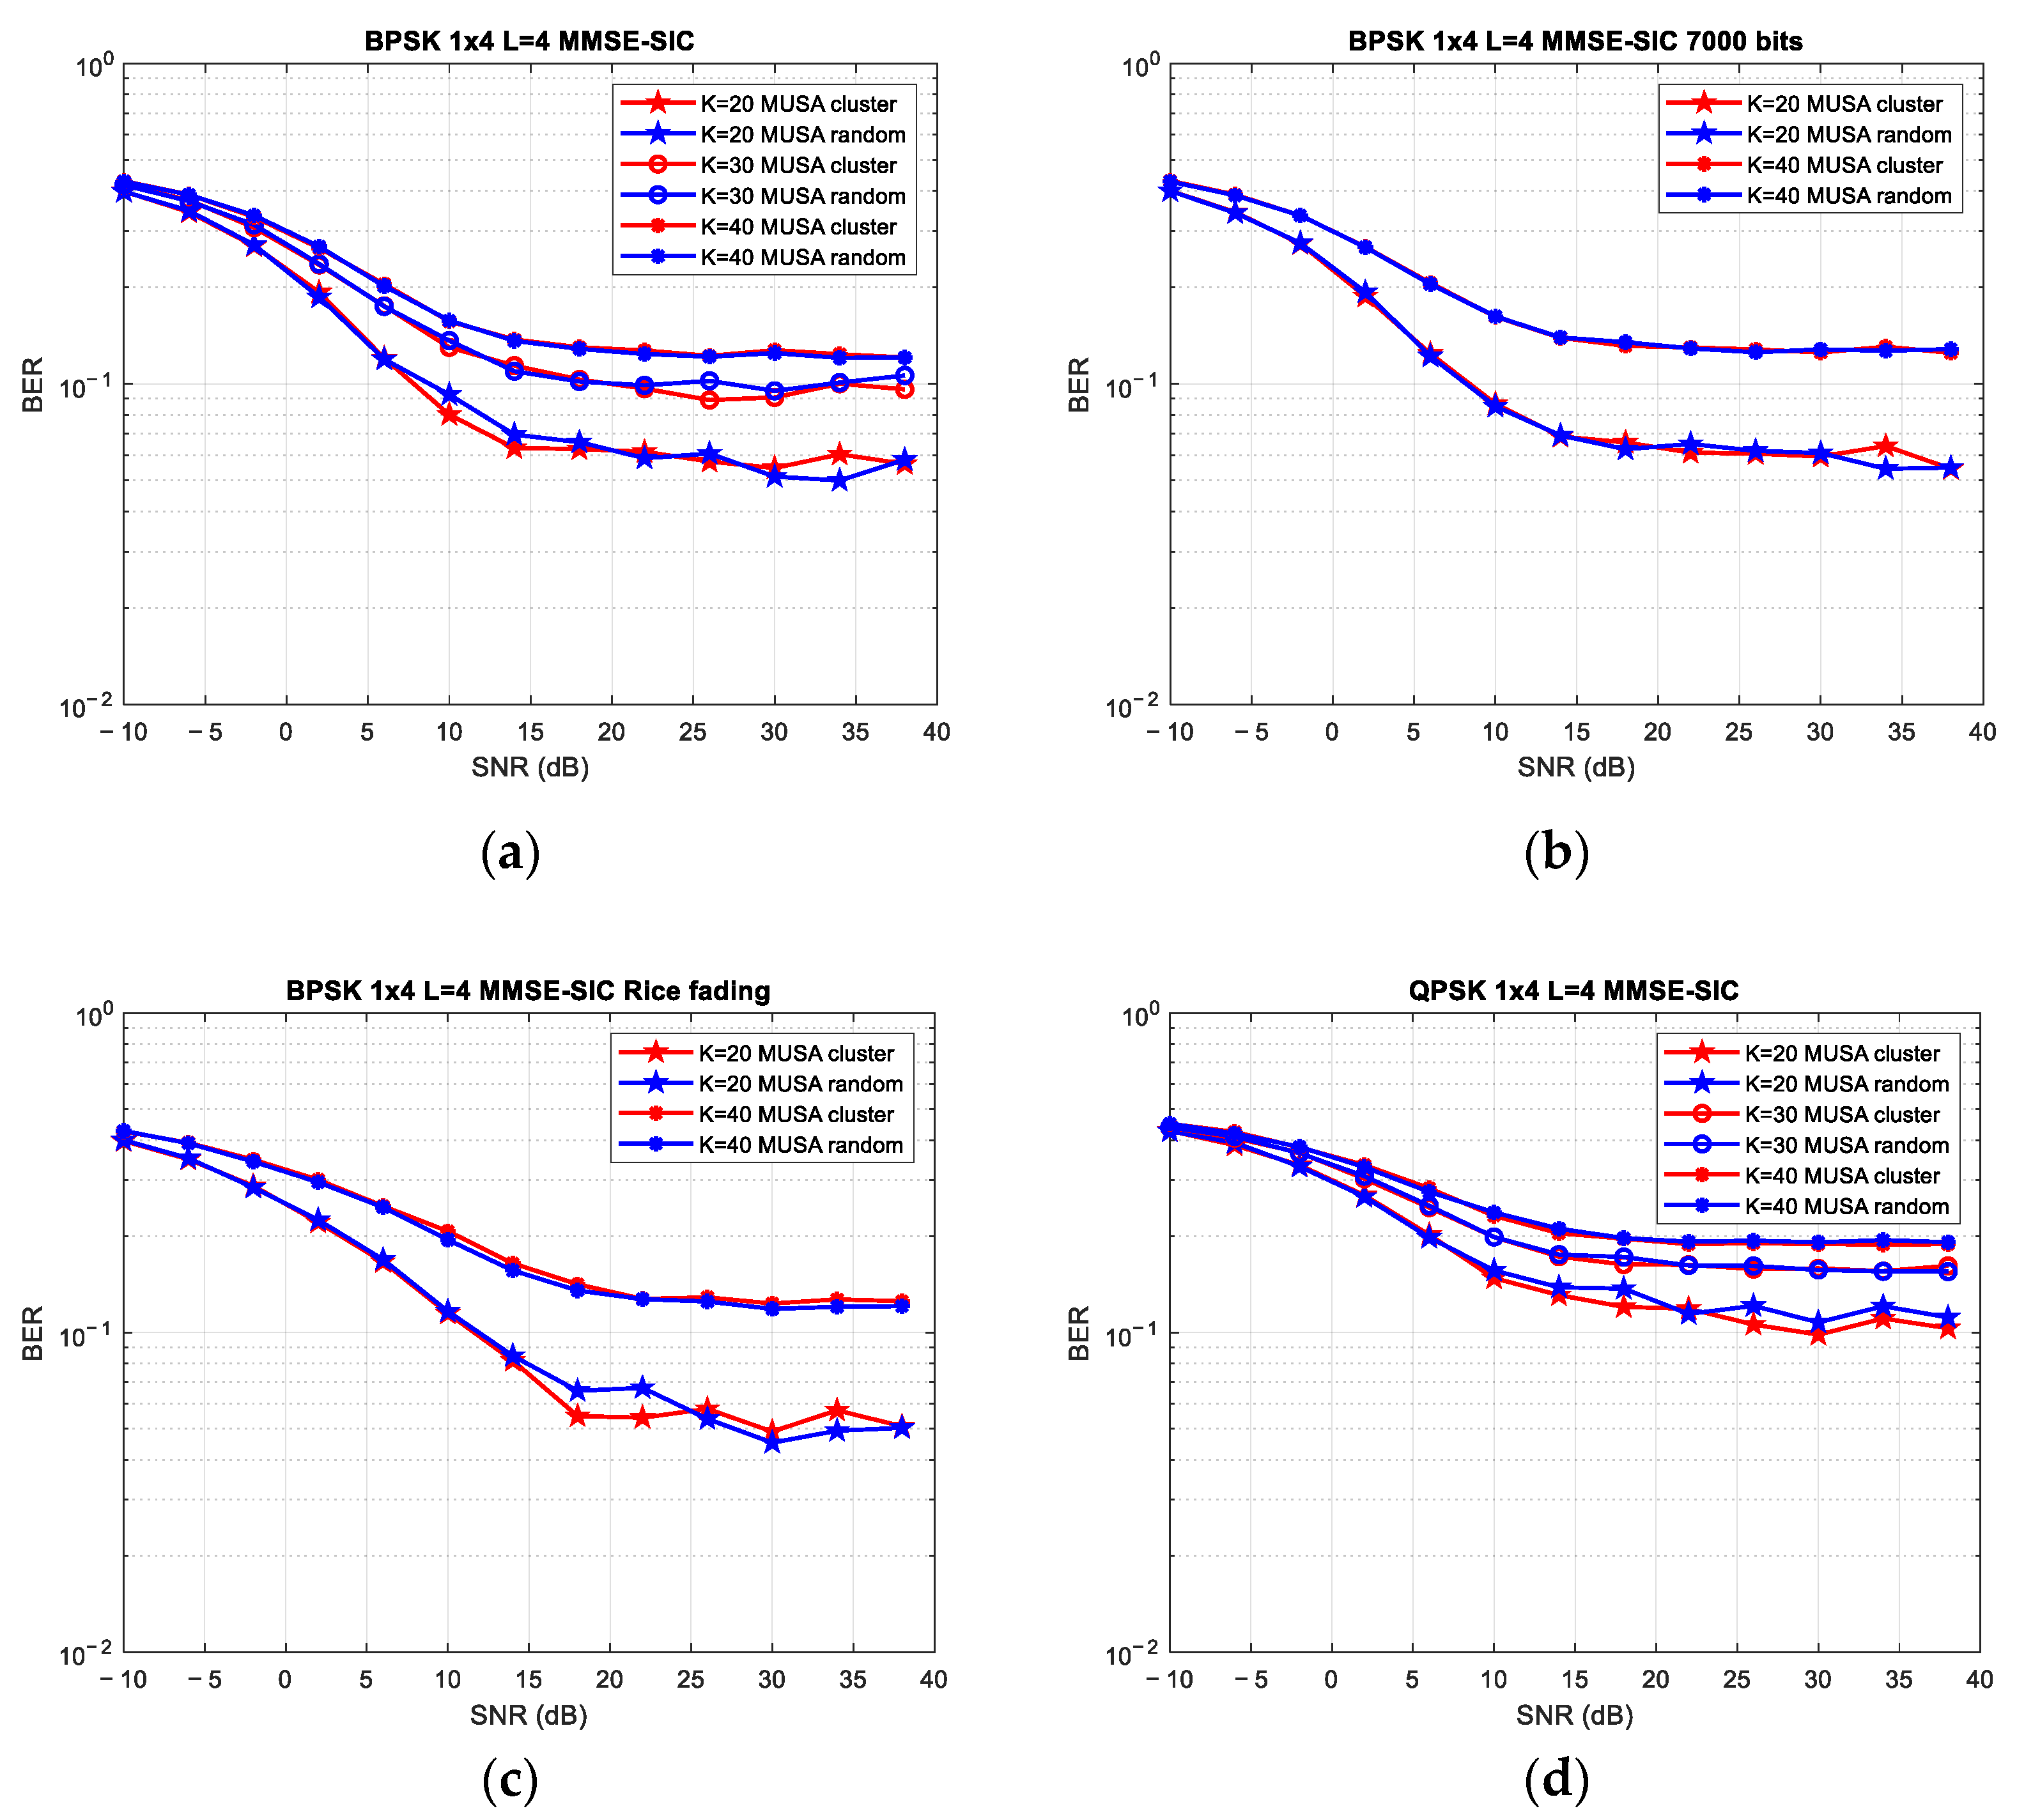
4.2. Scenario 2: Two Antennas at BS/20, 30, and 40 Users/MUSA Code Length of 4

The codewords in Table 1 are split up into 20 clusters for this scenario, but the number of users K is increased to 30 and 40. Hence, instead of 10 users, as considered previously, the codewords from 20 clusters are used by 20, 30, and 40 users, respectively. The Rayleigh fading channel was used to obtain Figure 13a and Figure 13b. It can be seen from Figure 13a that clustering still performs better than allocating codes randomly. The three simulations with 20, 30, and 40 users, respectively, show that the difference is only observable at an SNR higher than 10 dB. Additionally, as Figure 13b illustrates, the clustering approach results in a marginal improvement in performance for K = 20 when the data length is increased ten times.
Given the fact that extending the data length does not result in a noticeable improvement in performance, the simulation results shown in Figure 13c,d were conducted with a 700 bits data length. The results shown in Figure 13c were obtained by testing Rice fading under the same conditions as Rayleigh fading, with a K-factor of 5 dB. It is obvious that using clustering also improves the performance of the channel. Furthermore, better results can be seen when comparing them to those shown in Figure 13a because the Rice fading has a better channel gain due to the presence of the line-of-sight (LoS) component.
To compare the effectiveness of different modulation schemes, QPSK was evaluated in a Rayleigh fading channel transmission, shown in Figure 13d. QPSK transmits two bits per symbol, while BPSK transmits only one. Although QPSK has a bandwidth that is twice more efficient than BPSK, it also requires 3 dB more SNR to achieve the same BER. This is the reason why it was expected to see additional gains from clustering at 10 dB (where clustering gains can be observed for BPSK with 20 users in Figure 13a plus 3 dB). However, for QPSK with 20 users, the clustering gains become visible starting from 5 dB SNR. This outlines the benefits of the proposed algorithm even more compared to a random code allocation. The same trend can also be observed for higher numbers of users, 30 and 40, respectively.

4.3. Scenario 3: Four Antennas at BS/20, 30, and 40 Users/MUSA Code Length of 4

Compared to the previous results, the simulations presented in Figure 14 account for a higher number of antennas at the base station, equal to 4. While Figure 14c shows the results obtained in a Rice fading channel, Figure 14a,b,d were obtained in a Rayleigh fading channel. When compared to Figure 13, it is expected that all cases involving 20, 30, and 40 users will experience an increase in system performance; however, there is no discernible difference in the BER between the random and clustered allocation methods of codes. The use of clusters results in marginal improvements in a system with 30 users (see Figure 14a). No improvement can be marked for any of the K values by lengthening the data.
Similarly, to the previous scenario, a data length of 700 bits was taken into consideration for analysis in Scenario 3, where tests of the QPSK modulation—shown in Figure 14d—and Rice fading—shown in Figure 14c—were conducted. In both cases, using clusters is advantageous for a less loaded system, where K is equal to 20.

4.4. Scenario 4: Four Antennas at BS/40 and 62 Users/MUSA Code Length of 31

Figure 15 illustrates the performance of the system for an increased code length of 31. As expected, by increasing the length of the codes from 4 to 31, the system’s performance also increases. Instead of using clusters, in this scenario, all users had allocated spreading sequences as follows: 31 users received classical pseudo-noise (PN) codes with a length of 31 [53], transformed into complex ones, and the other users had randomly allocated MUSA codes. This approach lets us highlight that accounting for the correlation between codes brings a considerable benefit to the performance of the system. When the system is 200% overloaded (62 users using 31 codes—the length of the code), due to only 31 out of 62 users using low-correlated PN codes, there is a slight difference in the BER compared to the case in which all users received random MUSA codes.

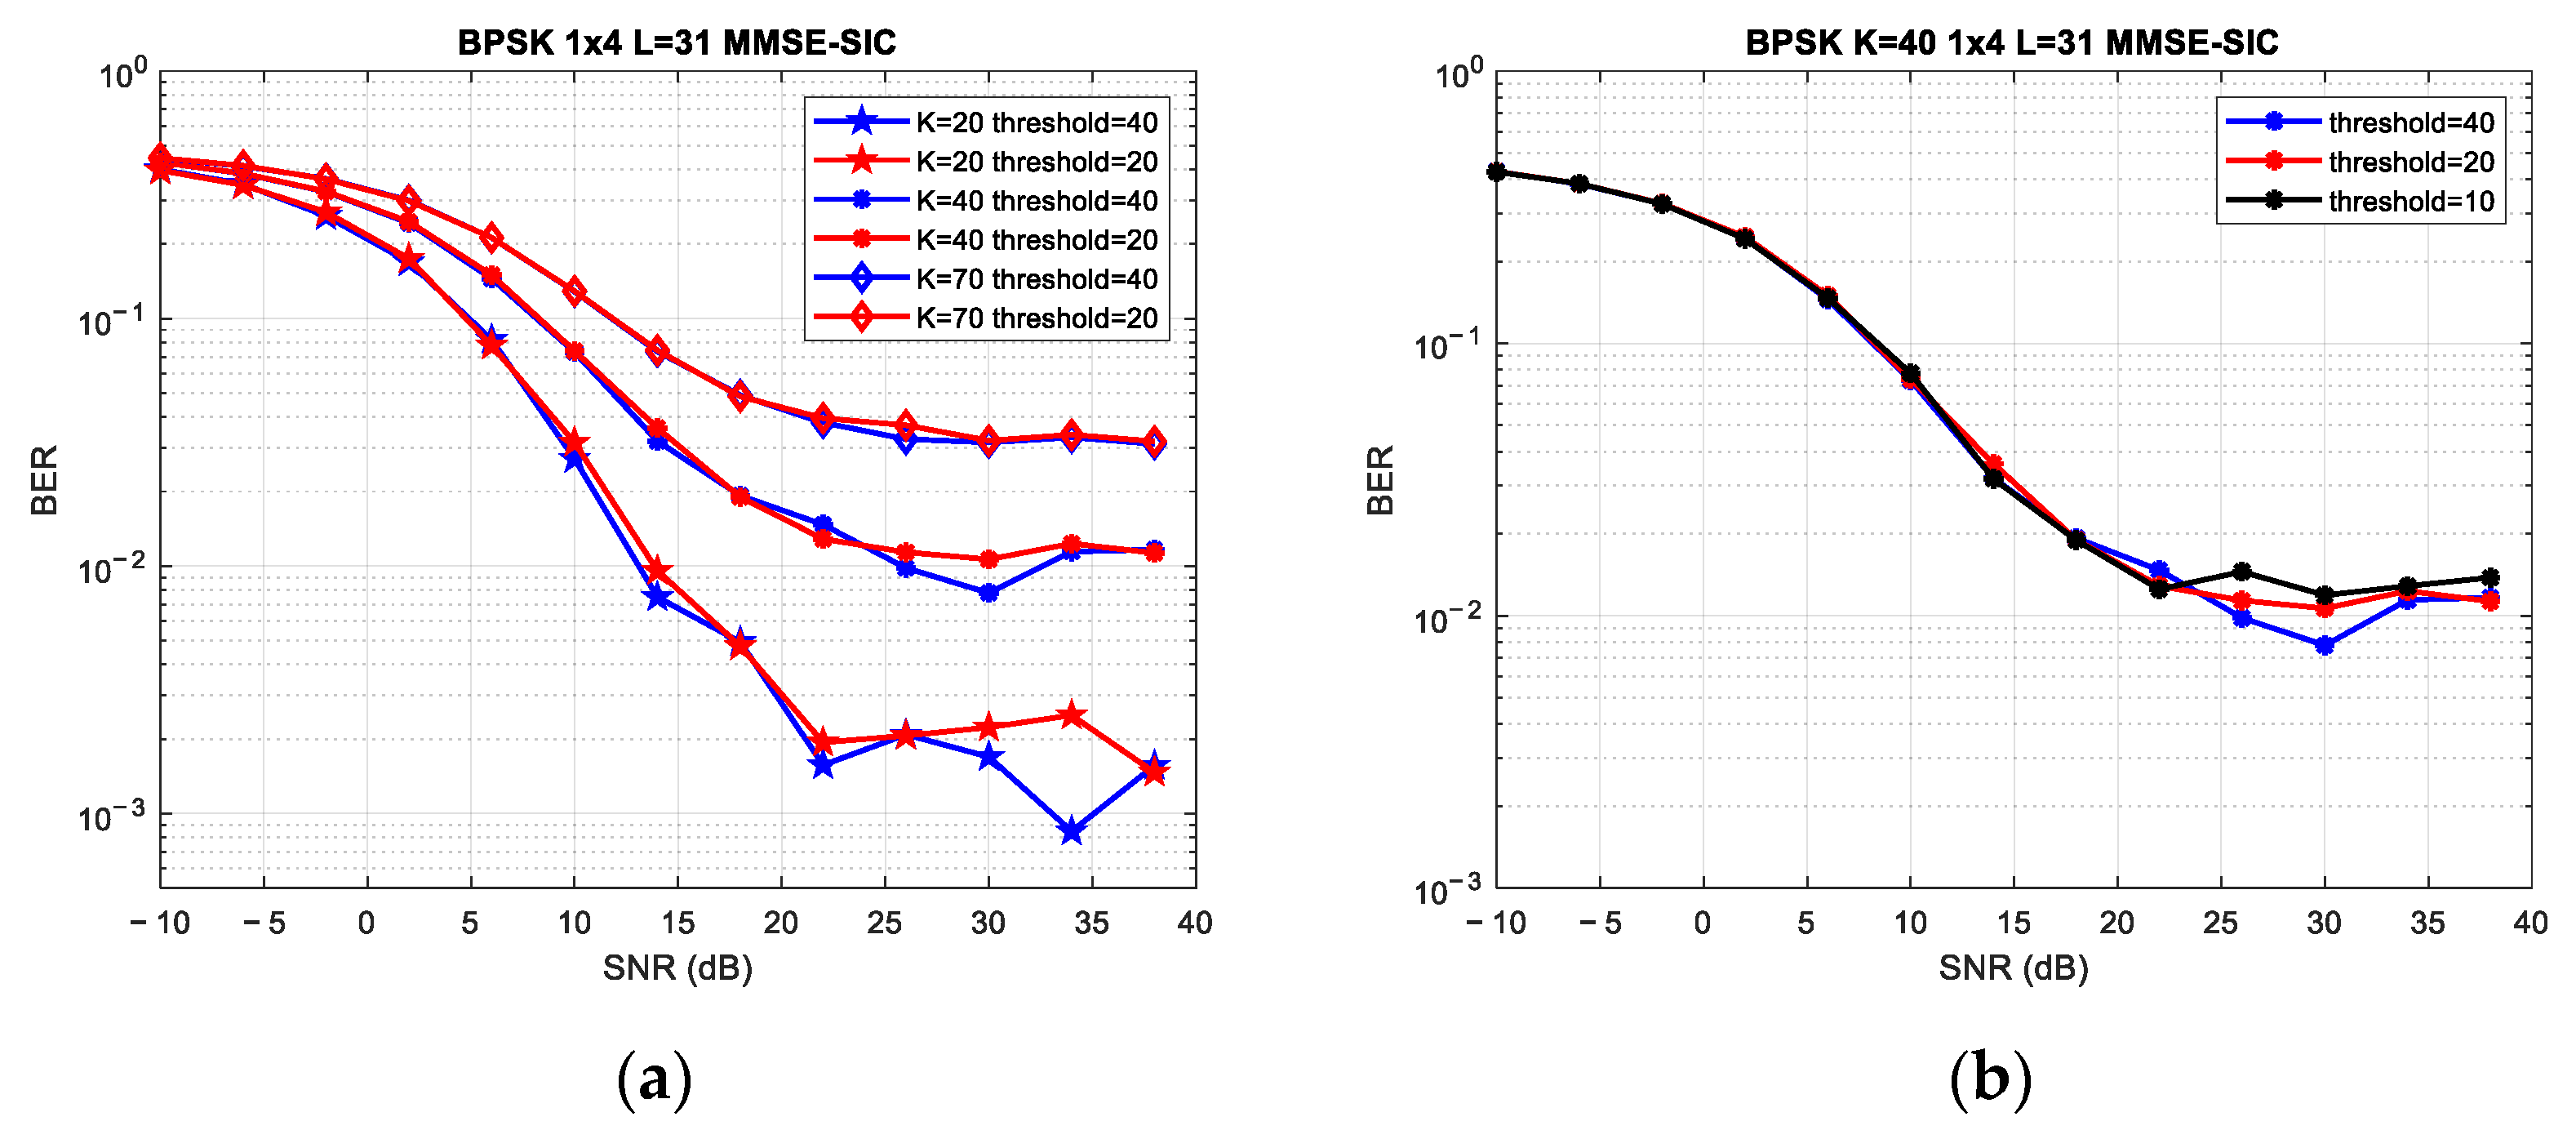
4.5. Scenario 5: Four Antennas at BS/20, 40, and 70 Users/MUSA Code Length of 31

The results achieved with Scenario 4 confirm the previous conclusions that the allocation of low-correlation codes increases the system performance. In Figure 16a, 200 random MUSA codes were divided into 20 and 40 clusters, respectively, using the method presented in Section 2, by imposing a higher correlation threshold for the sequences of the same cluster. The combination of an increased number of users and large data is not suitable for performance improvement. A higher correlation threshold will lead to a higher number of clusters (equal to 40), with fewer codewords inside, which will maximize the system’s BER, for an SNR higher than 25 dB. In Figure 16b, a lower correlation threshold was used for the simulation of a system with 40 users. Thus, the algorithm grouped the sequences into 10 clusters. A lower correlation threshold leads to a greater number of users using codewords from the same cluster. The performance of the system slightly decreases in this scenario because the sequences assigned to various users are often part of the same cluster, and thus, they are correlated.

4.6. Scenario 6: Two and Four Antennas at BS/20, 30, and 40 Users/MUSA Code Length of 4

Figure 17 depicts a comparison between the two clustering approaches presented in Section 2, k-means and k-medoids, respectively. In both cases, BS with two antennas and BS with four antennas, respectively, the k-medoids method brings small benefits, regardless of the number of users (K = 20, 30, or 40). This confirms that the main limitation of the clustering approach is not the distance metric, but the fact that we do not assess the correlation between clusters when assigning the sequences to users. As expected, the overall BER performance increases when the BS is equipped with four antennas for both clustering methods.
The results from all simulations are better summarized in Table 4.

5. Conclusions

Code-domain multiple access solutions provide simplicity with increased performance and interference control solutions. In LTE-compliant systems, MUSA codewords for users’ signal separation allow for efficient design and low mathematical complexity. Therefore, this study’s topic is aimed at investigating the benefits of using clusters in the MUSA code allocation process. A certain number of spreading codewords are grouped into clusters to facilitate the access of multiple users to non-interference communications (highly correlated sequences).
In this research, it was also outlined that the number of clusters must be selected depending on a correlation threshold. Furthermore, a method of determining the correlation threshold considering the number of K users in the system was investigated.
An extensive analysis demonstrated that for moderate overloaded systems, with limited resources, the current approach can still lead to an increase in performance. Moreover, if MUSA codewords are designed starting from the classical PN code used in multiple-access code division, the quality of the system is improved because more users benefit from codes with low correlations.
It was shown in all cases that no clustering technique is effective for transmission “drawn” into noise (negative SNR values), and performance cannot be enhanced. However, when the effects of long MUSA codewords (random/PN) are superimposed with a larger number of users, it becomes evident that no improvement is possible. For a smaller user base, the clustering method produces better BER values. The clustering approach leads to better BER values for a reduced number of users. In regard to the clustering design, although the k-medoids method allowed us to use a more accurate correlation metric, its performance improvement was still limited. This is because the main drawback of the clustering algorithm was not the distance metric used, but the disregard for the correlation between clusters when assigning the sequences to users. It was demonstrated that, for clustering conception, the k-medoids algorithm leads to acceptable and close results to the ones achieved with the k-means algorithm.
An additional BER analysis implies the comparison of the Rayleigh and Rice fading effects across the performance of the system. Rice fading gives reasonable results because of its capacity to emulate line-of-sight (LoS) transmission. Furthermore, testing QPSK modulation schemes with BSs that have two or four antennas showed lower BER and clustering gains that are noticeable at lower SNR values. Without using a sequence allocation mechanism that evaluates the correlation between clusters, it was shown that using a higher correlation threshold to obtain a higher number of clusters can marginally improve the performance of the system.
The clustering approach has the main benefit of having a low probability of allocating highly correlated (or the same) sequences to different users, but it is limited in its ability to ensure good correlation properties for MUSA codewords to minimize the probability of interference in a communication system. As a result, the BER performance can be enhanced.
Future work will involve investigating the appropriate selection of clusters that ensures a low correlation between clusters used to assign sequences to various users. Additional validation scenarios will include different modulations and coding schemes and an analysis of other spreading codes used in CD-NOMA.

Author Contributions

C.F. and M.-G.B., conceptualization and writing—original draft; I.-M.M., R.-F.T. and C.F., writing—review and editing; I.-M.M., funding acquisition and supervision; C.F., M.-G.B. and R.-F.T., data curation; I.-M.M., methodology; C.F., software; I.-M.M. and M.-G.B., resources and investigation. All authors have read and agreed to the published version of the manuscript.

Funding

This work was funded by a grant (no. 14/2022) from the Academy of Romanian Scientists, Ilfov 3, 050044 Bucharest, Romania, by the 2023–2026 Sectoral Plan for Research—Development of the Ministry of Agriculture and Rural Development—ADER 2026, project contract no. ADER 6.3.13/2023, “Smart viticulture based on loT—premise for climate change management techniques”. Authors would also like to thank Vodafone Innovation Hub from National University of Science and Technology Polytechnic Bucharest and Infovista, France, for their logistic support used in this research.

Institutional Review Board Statement

Not applicable.

Informed Consent Statement

Not applicable.

Data Availability Statement

The data that support the findings of this study are available from all corresponding authors upon reasonable request. The data are not publicly available due to privacy and ethical concerns.

Conflicts of Interest

The authors declare no conflict of interest.

References

  1. Sinaie, M.; Wing Kwan Ng, D.; Jorswieck, E.A. Resource Allocation in NOMA Virtualized Wireless Networks under Statistical Delay Constraints. IEEE Wirel. Commun. Let. 2018, 7, 954–957. [Google Scholar] [CrossRef]
  2. Yu, Y.; Chen, H.; Li, Y.; Ding, Z.; Vucetic, B. Antenna selection for MIMO-NOMA networks. In Proceedings of the 2017 IEEE International Conference on Communications (ICC), Paris, France, 21–25 May 2017. [Google Scholar]
  3. Ding, Z.; Liu, Y.; Choi, J.; Sun, Q.; Elkashlan, M.; Chih-Lin, I.; Poor, H.V. Application of non-orthogonal multiple access in LTE and 5G networks. IEEE Commun. Mag. 2017, 55, 185–191. [Google Scholar] [CrossRef]
  4. Ding, Z.; Lei, X.; Karagiannidis, G.K.; Schober, R.; Yuan, J.; Bhargava, V. A survey on non-orthogonal multiple access for 5G networks: Research challenges and future trends. IEEE J. Sel. Areas Commun. 2017, 35, 2181–2195. [Google Scholar] [CrossRef]
  5. Baidas, M.W.; Alsusa, E.; Hamdi, K.A. Performance analysis of downlink NOMA networks over Rayleigh fading channels. In Proceedings of the 2018 IEEE Wireless Communications and Networking Conference (WCNC), Barcelona, Spain, 15–18 April 2018. [Google Scholar]
  6. Wan, D.; Wen, M.; Cheng, X.; Mumtaz, S.; Guizani, M. A promising non-orthogonal multiple access-based networking architecture: Motivation, conception, and evolution. IEEE Wirel. Commun. 2019, 26, 152–159. [Google Scholar] [CrossRef]
  7. Dai, L.; Wang, B.; Yuan, Y.; Han, S.; Chih-Lin, I.; Wang, Z. Nonorthogonal multiple access for 5G: Solutions, challenges, opportunities, and future research trends. IEEE Commun. Mag. 2015, 53, 74–81. [Google Scholar] [CrossRef]
  8. Lin, B.; Tang, X.; Ghassemlooy, Z. A Power Domain Sparse Code Multiple Access Scheme for Visible Light Communications. IEEE Wirel. Commun. Lett. 2020, 9, 61–64. [Google Scholar] [CrossRef]
  9. Balasubramanya, N.M.; Gupta, A.; Sellathurai, M. Combining Code-Domain and Power-Domain NOMA for Supporting Higher Number of Users. In Proceedings of the 2018 IEEE Global Communications Conference (GLOBECOM), Abu Dhabi, United Arab Emirates, 9–13 December 2018. [Google Scholar]
  10. Islam, S.M.R.; Avazov, N.; Dobre, O.A.; Kwak, K.-S. Power domain non-orthogonal multiple access (NOMA) in 5G systems: Potentials and challenges. IEEE Commun. Surv. Tutor. 2017, 19, 721–742. [Google Scholar] [CrossRef]
  11. Ding, Z.; Adachi, F.; Poor, H.V. The application of MIMO to nonorthogonal multiple access. IEEE Trans. Wirel. Commun. 2016, 15, 537–552. [Google Scholar] [CrossRef]
  12. Ding, Z.; Dai, L.; Poor, H.V. MIMO-NOMA design for small packet transmission in the Internet of Things. IEEE Access 2016, 4, 1393–1405. [Google Scholar] [CrossRef]
  13. Liu, Y.; Ding, Z.; Elkashlan, M.; Poor, H.V. Cooperative nonorthogonal multiple access with simultaneous wireless information and power transfer. IEEE J. Sel. Areas Commun. 2016, 34, 938–953. [Google Scholar] [CrossRef]
  14. Zhang, S.; Xu, X.; Lu, L.; Wu, Y.; He, G.; Chen, Y. Sparse code multiple access: An energy efficient uplink approach for 5G wireless systems. In Proceedings of the 2015 IEEE Global Communications Conference, Austin, TX, USA, 8–12 December 2014. [Google Scholar]
  15. Mathur, H.; Deepa, T. A Survey on Advanced Multiple Access Techniques for 5G and Beyond Wireless Communications. Wirel. Pers. Commun. 2021, 118, 1775–1792. [Google Scholar] [CrossRef]
  16. Mohammadi, M.; Shi, X.; Chalise, B.K.; Ding, Z.; Suraweera, H.A.; Zhong, C.; Thompson, J.S. Full-duplex non-orthogonal multiple access for next generation wireless systems. IEEE Commun. Mag. 2019, 57, 110–116. [Google Scholar] [CrossRef]
  17. Jamali, M.V.; Mahdavifar, H. Massive Coded-NOMA for Low-Capacity Channels: A Low-Complexity Recursive Approach. IEEE Trans. Commun. 2021, 69, 3664–3681. [Google Scholar] [CrossRef]
  18. Yan, C.; Yuan, Z.; Li, W.; Yuan, Y. Non-Orthogonal Multiple Access Schemes for 5G. ZTE Commun. 2016, 14, 11–16. [Google Scholar]
  19. Shukla, A.; Kumar, M.; Kumar Deolia, V. Code domain non orthogonal multiple access schemes for 5G and beyond communication networks: A review. J. Eng. Res. 2021, 10, 132–152. [Google Scholar] [CrossRef]
  20. Chauhan, A.; Jaiswal, A. Multidimensional Signal Space Non-Orthogonal Multiple Access with Imperfect SIC: A Novel SIC Reduction Technique. IEEE Trans. Veh. Technol. 2023, 1–15. [Google Scholar] [CrossRef]
  21. Kusume, K.; Bauch, G.; Utschick, W. IDMA vs. CDMA: Analysis and Comparison of Two Multiple Access Schemes. IEEE Trans. Wirel. Commun. 2012, 11, 78–87. [Google Scholar] [CrossRef]
  22. Sony, D.; Keerthi, P.; Aditya, O.; Sravya, N. Simulation and Performance Analysis of Interleave Division Multiple Access (IDMA) in Comparison with Code Division Multiple Access (CDMA). Asian J. Appl. Sci. Technol. 2021, 5, 90–94. [Google Scholar] [CrossRef]
  23. Al-Imari, M.; Imran, M.A. Low density spreading multiple access. In Multiple Access Techniques for 5G Wireless Networks and Beyond; Springer: Cham, Switzerland, 2018; pp. 493–514. [Google Scholar]
  24. Elsaraf, Z. Performance Analysis of Code Domain NOMA in 5G Systems. In Proceedings of the 2019 Conference: Emerging Technology Conference (EMiT_19), Huddersfield, UK, 9–11 April 2019. [Google Scholar]
  25. Wang, Q.; Zhang, R.; Yang, L.-L.; Hanzo, L. Non-Orthogonal Multiple Access: A Unified Perspective. IEEE Wirel. Commun. 2018, 25, 10–16. [Google Scholar] [CrossRef]
  26. Nikopour, H.; Baligh, H. Sparse code multiple access. In Proceedings of the 2013 IEEE 24th Annual International Symposium on Personal, Indoor, and Mobile Radio Communications (PIMRC), London, UK, 8–11 September 2013. [Google Scholar]
  27. Tao, Y.; Liu, L.; Liu, S.; Zhang, Z. A Survey: Several Technologies of Non-Orthogonal Transmission for 5G. China Commun. 2015, 12, 1–15. [Google Scholar] [CrossRef]
  28. Yuan, Z.; Yu, G.; Li, W.; Yuan, Y.; Wang, X.; Xu, J. Multi-User Shared Access for Internet of Things. In Proceedings of the 2016 IEEE 83rd Vehicular Technology Conference (VTC Spring), Nanjing, China, 15–18 May 2016. [Google Scholar]
  29. Eid, E.M.; Fouda, M.M.; Tag Eldien, A.S.; Tantawy, M.M. Performance analysis of MUSA with different spreading codes using ordered SIC method. In Proceedings of the 2017 12th International Conference on Computer Engineering and Systems (ICCES), Cairo, Egypt, 19–20 December 2017. [Google Scholar]
  30. Zia, M.F.; Hamamreh, J.M. An advanced non-orthogonal multiple access security technique for future wireless communication networks. RS Open J. Innov. Commun. Technol. 2020, 1, 1–10. [Google Scholar] [CrossRef]
  31. Hayat, O.; Ngah, R.; Hashim, S.Z.M. Multi-user Shared Access (MUSA) procedure for device discovery in D2D communication. Telecommun. Syst. 2021, 76, 291–297. [Google Scholar] [CrossRef]
  32. Kim, H.; Kim, H.; Hong, D. Performance of 5G Multiple Access Schemes. In Proceedings of the 2022 International Conference on Electronics, Information, and Communication (ICEIC), Jeju, Republic of Korea, 6–9 February 2022. [Google Scholar]
  33. Tan, Y.; Li, S.; Su, B.; Xia, Z. MUSA System Based on Extended Sequences Optimization and User Rate Power Allocation. In Proceedings of the 2023 9th International Conference on Control Science and Systems Engineering (ICCSSE), Shenzhen, China, 16–18 June 2023. [Google Scholar]
  34. Thushan, S.; Ali, S.; Mahmood, N.H.; Rajatheva, N.; Latva-Aho, M. Deep Learning-Based Blind Multiple User Detection for Grant-Free SCMA and MUSA Systems. IEEE Trans. Mach. Learn. Commun. Netw. 2023, 1, 61–77. [Google Scholar] [CrossRef]
  35. Wu, X.; Lu, L.; Jiang, M. Deep learning aided cyclostationary feature analysis for blind modulation recognition in massive MIMO systems. Digit. Signal Process. 2023, 134, 103890. [Google Scholar] [CrossRef]
  36. Jhamb, A. Analysis of Various Parameters Used in CDMA and IDMA Techniques. Int. J. Eng. Dev. Res. 2017, 5, 392–394. [Google Scholar]
  37. Vishvaksenan, K.S.; Rajmohan, R. Performance analysis of multi-carrier IDMA system for co-operative networks. Clust. Comput. 2019, 22, 7695–7703. [Google Scholar] [CrossRef]
  38. Luo, Q.; Gao, P.; Liu, Z.; Xiao, L.; Mheich, Z.; Xiao, P.; Maaref, A. An Error Rate Comparison of Power Domain Non-Orthogonal Multiple Access and Sparse Code Multiple Access. IEEE Open J. Commun. Soc. 2021, 2, 500–511. [Google Scholar] [CrossRef]
  39. Jehan, A.; Zeeshan, M. Comparative Performance Analysis of Code-Domain NOMA and Power-Domain NOMA. In Proceedings of the 2022 16th International Conference on Ubiquitous Information Management and Communication (IMCOM), Seoul, Republic of Korea, 3–5 January 2022. [Google Scholar]
  40. Shukla, A. Comparative analysis of various code domain NOMA schemes for future communication networks. Mater. Today Proc. 2021, 46, 5797–5800. [Google Scholar] [CrossRef]
  41. Al-Dulaimi, O.M.K.; Al-Dulaimi, A.M.K.; Alexandra, M.O.; Al-Dulaimi, M.K.H. Strategy for Non-Orthogonal Multiple Access and Performance in 5G and 6G Networks. Sensors 2023, 23, 1705. [Google Scholar] [CrossRef]
  42. Chen, Y.; Bayesteh, A.; Wu, Y.; Ren, B.; Kang, S.; Sun, S.; Xiong, Q.; Qian, C.; Yu, B.; Ding, Z.; et al. Toward the standardization of non-orthogonal multiple access for next generation wireless networks. IEEE Commun. Mag. 2018, 56, 19–27. [Google Scholar] [CrossRef]
  43. Xu, Y.; Wang, G.; Zheng, L.; Liu, R.; Zhao, D. BER Performance Evaluation of Downlink MUSA over Rayleigh Fading Channel. In Proceedings of the MLICOM 2017: Machine Learning and Intelligent Communications, Weihai, China, 5–6 August 2017. [Google Scholar]
  44. Prashar, A.; Sood, N. Performance Analysis of MIMO-NOMA and SISO-NOMA in Downlink Communication Systems. In Proceedings of the 2022 2nd International Conference on Intelligent Technologies (CONIT), Hubli, India, 24–26 June 2022. [Google Scholar]
  45. Umakoglu, I.; Namdar, M.; Basgumus, A. UAV-Assisted Cooperative NOMA System with the nth Best Relay Selection. Adv. Electr. Comput. Eng. 2023, 23, 39–46. [Google Scholar] [CrossRef]
  46. Budhiraja, I.; Kumar, N.; Tyagi, S.; Tanwar, S.; Han, Z.; Piran, J.; Suh, D.Y. A Systematic Review on NOMA Variants for 5G and beyond. IEEE Access 2021, 9, 85573–85644. [Google Scholar] [CrossRef]
  47. Wang, B.; Wang, K.; Lu, Z.; Xie, T.; Quan, J. Comparison study of non-orthogonal multiple access schemes for 5G. In Proceedings of the 2015 IEEE International Symposium on Broadband Multimedia Systems and Broadcasting, Ghent, Belgium, 17–19 June 2015. [Google Scholar]
  48. Oyerinde, O.O. Comparative Study of Overloaded and Underloaded NOMA Schemes with Two Multiuser Detectors. In Proceedings of the 2019 IEEE 2nd Wireless Africa Conference (WAC), Pretoria, South Africa, 18–20 August 2019. [Google Scholar]
  49. Kim, H.; Lim, Y.-G.; Chae, C.-B.; Hong, D. Multiple Access for 5G New Radio: Categorization, Evaluation, and Challenges. arXiv 2017, arXiv:1703.09042. [Google Scholar]
  50. Eid, E.M.; Fouda, M.M.; Tag Eldien, A.S.; Tantawy, M.M. Performance analysis of 5-ary MUSA and SCMA for uplink transmission. Indones. J. Electr. Eng. Comput. Sci. 2019, 15, 365–372. [Google Scholar]
  51. ATIS 3GPP SPECIFICATION, 3rd Generation Partnership Project; Technical Specification Group Radio Access Network. Study on Non-Orthogonal Multiple Access (NOMA) for NR (Release 16); 3GPP Support Office: Sophia Antipolis, France, 2018. [Google Scholar]
  52. 3GPP 38.812 TR. Study on Non-Orthogonal Multiple Access (NOMA) for NR. Available online: https://portal.3gpp.org/desktopmodules/Specifications/SpecificationDetails.aspx?specificationId=3236 (accessed on 20 July 2023).
  53. Dutta, P.; Ramyasree, J.; Sridhar, V.; Minchula, V.K.; Mohanta, H.C.; Mahfoudh, S.; Shah, S.B.H.; Singh, S.P. Evaluating the Efficiency of Non-Orthogonal MU-MIMO Methods in Smart Cities Technologies & 5G Communication. Sustainability 2023, 15, 236. [Google Scholar] [CrossRef]
  54. Andrew, G.J. A Primer on Zadoff Chu Sequences. arXiv 2023, arXiv:2211.05702v2. [Google Scholar]
  55. Matlab Documentation for K-Means. Available online: https://www.mathworks.com/help/stats/kmeans.html (accessed on 1 November 2023).
  56. Domathoti, B.; Ch, C.; Madala, S.; Berhanu, A.A.; Rao, Y.N. Simulation Analysis of 4G/5G OFDM Systems by Optimal Wavelets with BPSK Modulator. J. Sens. 2022, 2022, 8070428. [Google Scholar] [CrossRef]
Figure 1. Processing steps with specific symbol-level spreading (transmitter level).
Applsci 14 00013 g001
Figure 2. QPSK spreading sequences and four code examples.
Applsci 14 00013 g002
Figure 3. Cross-correlation matrix for 64 spreading sequences (length of 4).
Applsci 14 00013 g003
Figure 4. Cross-correlation matrix for 64 spreading sequences (length 8).
Applsci 14 00013 g004
Figure 5. Maximum sum distance of sequences within each cluster for the k-means algorithm.
Applsci 14 00013 g005
Figure 6. Maximum sum distance of sequences within each cluster for k-medoids algorithm.
Applsci 14 00013 g006
Figure 7. Minimum cross-correlation between sequences of each cluster.
Applsci 14 00013 g007
Figure 8. Minimum cross-correlation between sequences of the same cluster for k-means.
Applsci 14 00013 g008
Figure 9. Minimum cross-correlation between sequences of the same cluster for k-medoids.
Applsci 14 00013 g009
Figure 10. Cross-correlation matrix between the center sequences of different clusters (k-means).
Applsci 14 00013 g010
Figure 11. Cross-correlation matrix between the center sequences of different clusters (k-medoids).
Applsci 14 00013 g011
Figure 12. BER vs. SNR for Scenario 1.
Applsci 14 00013 g012
Figure 13. BER vs. SNR for Scenario 2: (a) 700 bits transmitted; (b) 7000 bits transmitted; (c) Rice fading; (d) QPSK modulation.
Applsci 14 00013 g013
Figure 14. BER vs. SNR for Scenario 3: (a) 700 bits transmitted; (b) 7000 bits transmitted; (c) Rice fading; (d) QPSK modulation.
Applsci 14 00013 g014
Figure 15. BER vs. SNR for Scenario 4.
Applsci 14 00013 g015
Figure 16. BER vs. SNR for Scenario 5: (a) thresholds for K = 20; 40; 70; (b) new threshold for K = 40.
Applsci 14 00013 g016
Figure 17. BER vs. SNR for Scenario 6: (a) BS with 2 antennas, (b) BS with 4 antennas.
Applsci 14 00013 g017
Table 1. A total of 64 spreading codes from 256 possible combinations [52].
Codeword
No.
Codeword
No.
11 1 1 133111−j
21 1−1−13411−1j
31−1 1−1351−11j
41−1−1 1361−1−1−j
51 1−jj371 1−j 1
61 1j−j381 1j−1
71−1−j−j391−1−j−1
81−1jj401−1j 1
91−j 1j411−j 1 1
101−j−1−j421−j−1−1
111j 1−j431j 1−1
121j−1j441j−1 1
131−j−j−1451−j−jj
141−jj 1461−jj−j
151j−j 1471j−j−j
161jj−1481jjj
171 1 1−1491 1 1j
181 1−1 1501 1−1−j
191−1 1 1511−1 1−j
201−1−1−1521−1−1j
211 1−j−j531 1−j−1
221 1jj541 1j 1
231−1−jj551−1−j1
241−1j−j561−1j−1
251−j 1−j571−j 1−1
261−j−1j581−j−1 1
271j 1j591j 1 1
281j−1−j601j−1−1
291−j−j 1611−j−j−j
301−jj−1621−jjj
311j−j−1631j−jj
321jj 1641j −j
Table 2. OFDM setup parameters.
ParameterValue
FFT length128
Data subcarriers72
SC spacing15 kHz
FFT sampling frequency15 kHz × 128 = 1.92 MHz
Subcarrier indexes−36 to −1 and 1 to 36
OFDM symbol duration1/15 kHz = 66.7 µs
CP duration4.76 µs
Total symbol duration71.43 µs
Table 3. Scenarios definition.
Scenario No.Features
12 antennas at BS/K = 20/MUSA code length of 4/Rayleigh fading/BPSK
22 antennas at BS/K = 20, 30, 40/MUSA code length of 4/Rayleigh and Rice fading/BPSK and QPSK
34 antennas at BS/K = 20, 30, 40/MUSA code length of 4/Rayleigh and Rice fading/BPSK and QPSK
44 antennas at BS/K = 40 and 62/MUSA code length of 31
54 antennas at BS/K = 20, 40, and 70/MUSA code length of 31
62 and 4 antennas at BS/K = 20, 30, and 40/MUSA code length of 4
Table 4. Summative results for all scenarios.
Scenario No.Method TypeMUSA
Code Length
SNR
(dB)
VariationDiscussions
1No
clustering
230MMSEThe combination of the clustering method and MMSE-SIC leads to better results in BER terms than the classic approach for low-length MUSA codes.
ClusteringMMSE-SIC
2K = 20430Random vs. ClusterSince performance is similar, it can be stated that the clustering approach cannot be efficient for an overloaded system with users having limited resources which transmit large data. When comparing the outcomes of Rayleigh and Rice fading, Rice performs better because it emulates LoS communication. Furthermore, by analyzing BPSK and QPSK performance in this system, it was shown that a BPSK modulation scheme produces better BER values; however, the clustering benefits can be at a lower SNR for QPSK.
K = 30
K = 40
3No
clustering vs.
clustering
430K= 20
vs. K = 30
vs. K = 40
4No
clustering
31-K = 40 vs. K = 62
and random vs. PN codes
Overlapping high-length MUSA codewords (random/PN) and an increased number of users does not lead to improvement. The clustering approach performs well for a reduced number of users.
Clustering
520 clusters vs.
40 clusters
-40-Without using a sequence allocation mechanism that evaluates the correlation between clusters, it is efficient to group the code sequences into a higher number of clusters. Creating more clusters with fewer, but highly correlated, codewords leads to marginally better BER values.
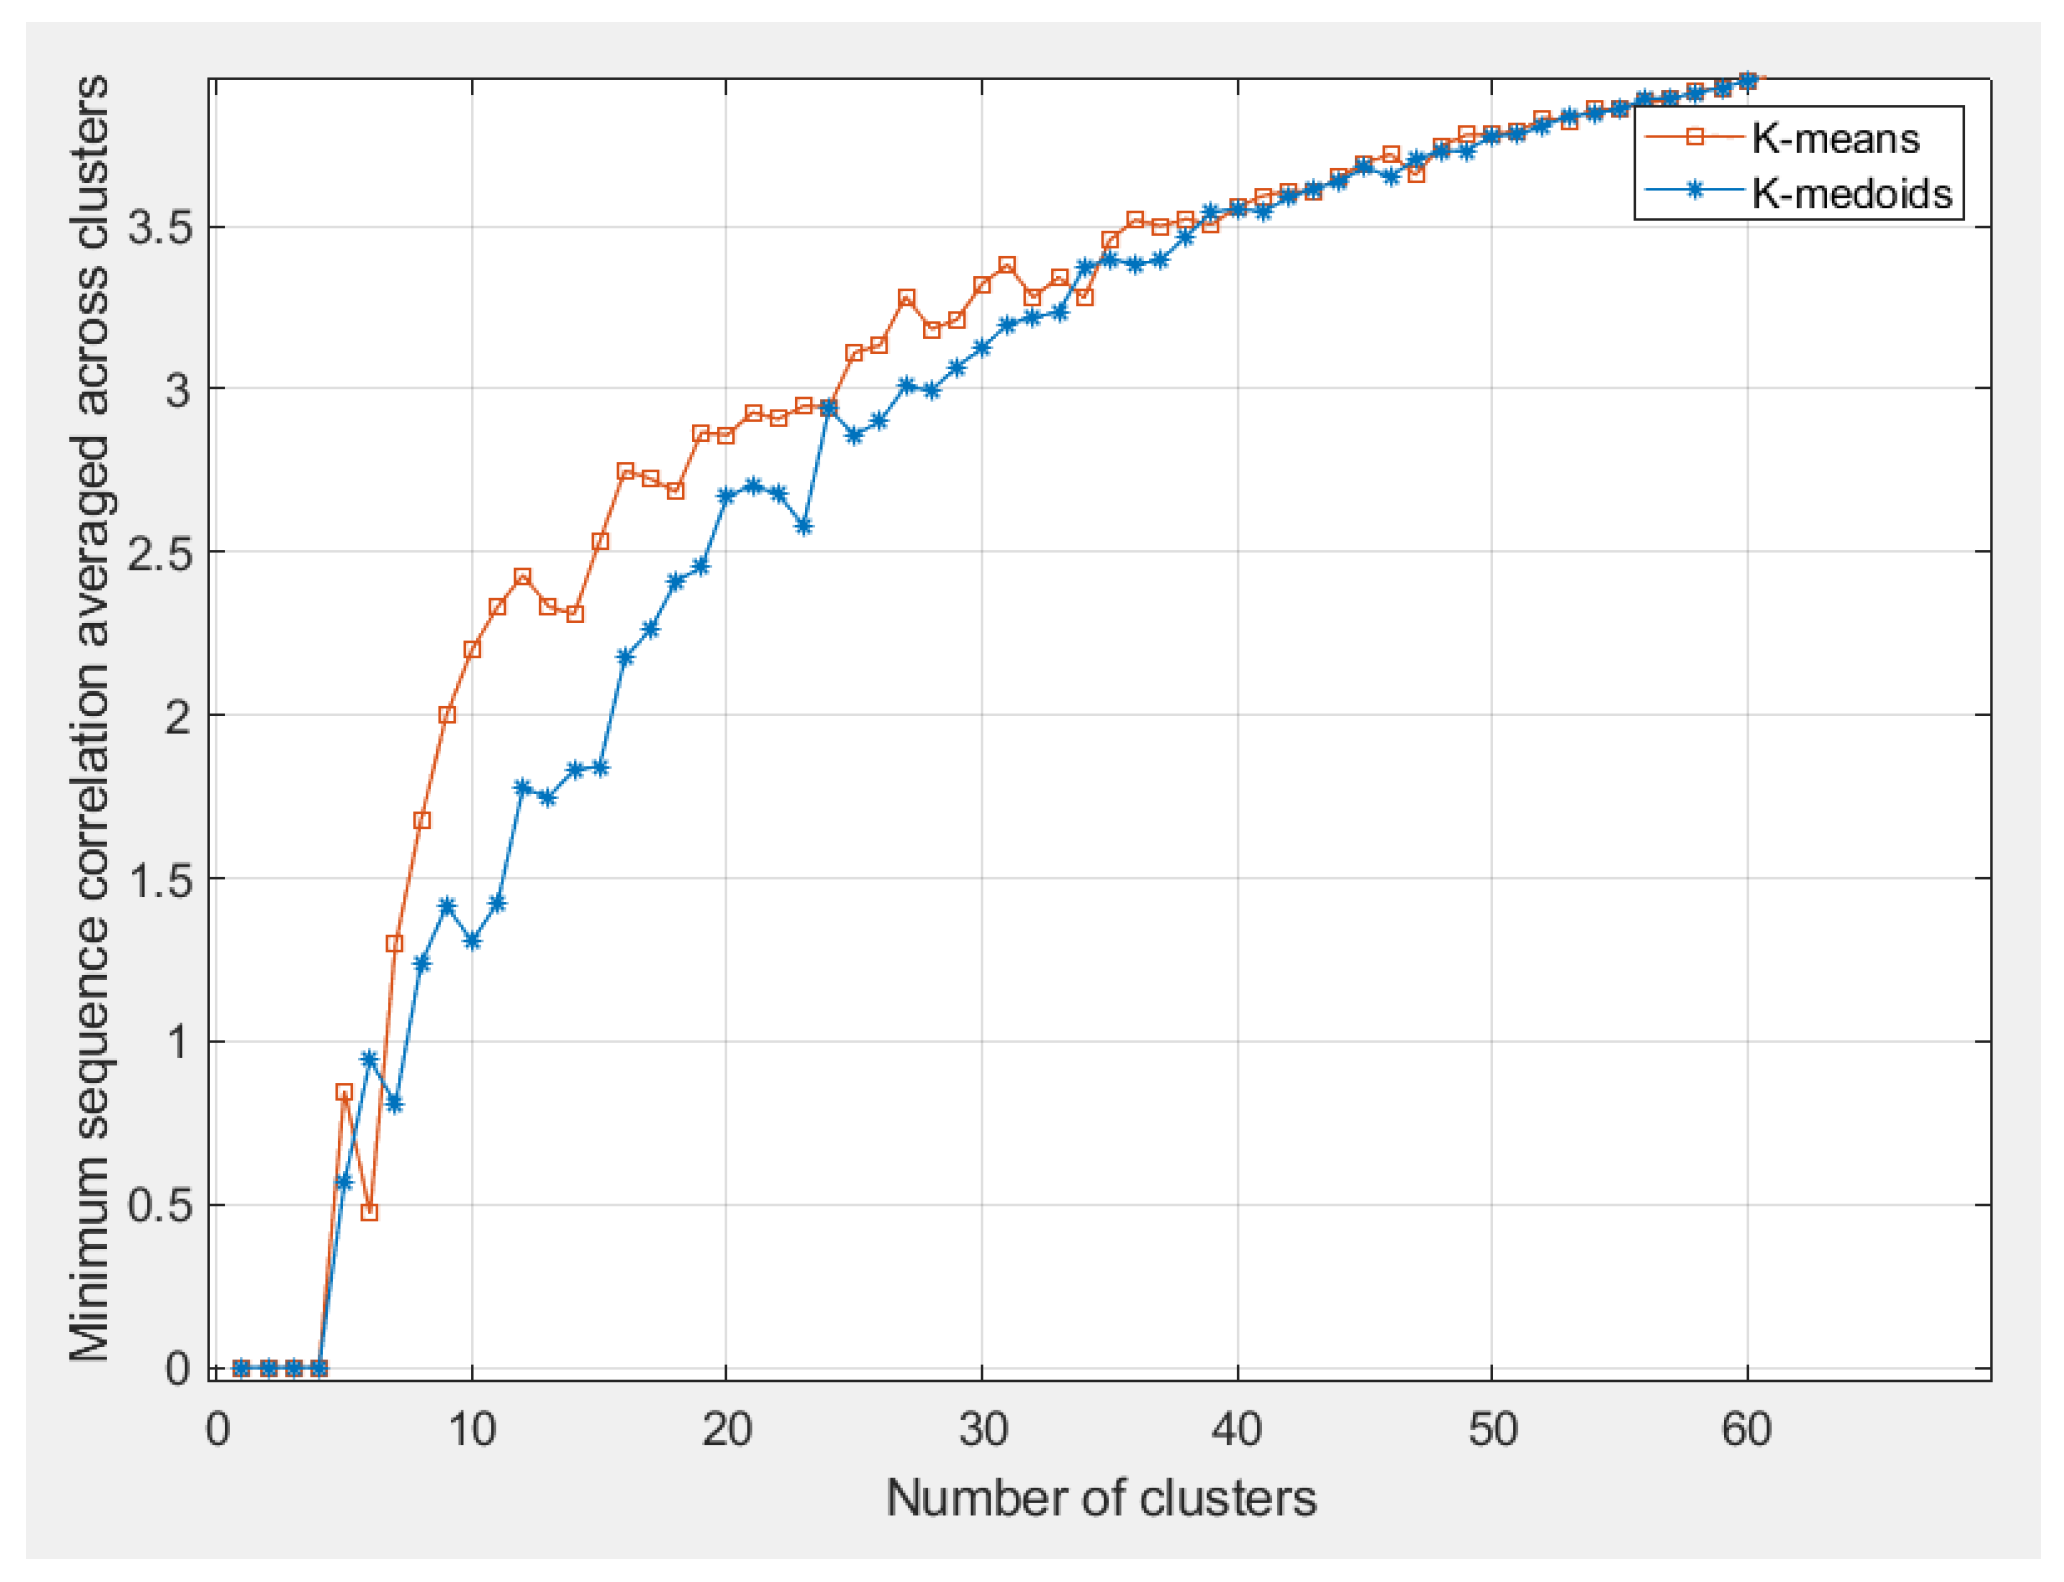
6k-means
vs.
k-medoids
algorithms
4--Both clustering algorithms (k-means and k-medoids) lead to acceptable and comparable results only for a small number of users.
Disclaimer/Publisher’s Note: The statements, opinions and data contained in all publications are solely those of the individual author(s) and contributor(s) and not of MDPI and/or the editor(s). MDPI and/or the editor(s) disclaim responsibility for any injury to people or property resulting from any ideas, methods, instructions or products referred to in the content.

