Article

Experimental Investigation of Lanthanum-Modified Reinforced Composite Material for Phosphorus Removal

School of Civil Engineering, Southeast University, Nanjing 210000, China
*
Author to whom correspondence should be addressed.
Appl. Sci. 2024, 14(1), 135; https://doi.org/10.3390/app14010135
Submission received: 28 November 2023 / Revised: 15 December 2023 / Accepted: 21 December 2023 / Published: 22 December 2023

Abstract

:
Adsorption stands as an economically viable, efficient, recyclable, operationally straightforward, cost-effective, and low-sludge method extensively employed for phosphorus removal. In an effort to enhance the adsorption capabilities of the adsorbent, this study employs the rare-earth metal lanthanum in conjunction with the group’s previously researched high-efficiency composite industrial residue phosphorus removal materials (EPRC) for modification, thereby generating lanthanum-modified reinforced composite phosphorus removal materials (La-EPRC). Subsequently, the novel material undergoes static modification, followed by experimental investigations into static and dynamic adsorption for phosphorus removal. Static adsorption experiments reveal optimal phosphorus removal efficiency when the initial phosphorus solution concentration is 20 mgP/L, with a La-EPRC particle dosage of 3 g/250 mL and a temperature of 25 °C. The removal efficiency of phosphorus particles is above 90% within the pH range of 4 to 10. Common coexisting anions in water, including Cl, SO42−, HCO3, and CO32−, demonstrate minimal impact on the efficacy of phosphorus removal. La-EPRC demonstrates a robust adsorption stability in both water and hot water environments. In a 2.5 mol/L NaOH solution, effective desorption of La-EPRC particles is observed, facilitating material regeneration. The raw materials for La-EPRC are easily accessible and cost-effective, imparting significant potential for widespread applications.

1. Introduction

Phosphorus, essential for all Earth’s organisms, holds significant ecological influence. Simultaneously, it poses environmental risks, notably contributing to water body eutrophication [1]. Algal overgrowth is observed when total phosphorus in a water body exceeds 0.02 mg/L and total nitrogen exceeds 0.2 mg/L [2]. Consequently, managing phosphorus concentrations is critical for point source control. Major contributors include domestic sewage, industrial and livestock wastewater, runoff from mountainous forests and cultivated land, and minor amounts from rainfall and snowfall. The discharge of phosphorus-containing wastewater significantly pollutes water environments and ecosystems.
Current wastewater phosphorus removal methods primarily encompass biological methods [3,4], chemical precipitation [5], adsorption [6], membrane separation [7], crystallization [8], and so forth. The adsorption method involves utilizing the porous nature or extensive surface area of an adsorbent for the physical or chemical adsorption of phosphate, leading to surface deposition and achieving phosphorus removal objectives [9]. The adsorption method is characterized by its efficiency, recyclability, ease of operation, low cost, and minimal sludge production, making it a widely applicable and economical approach to phosphorus removal [10].
The synthesis of an effective adsorbent is pivotal to the success of the adsorption method. Adsorption efficiency can be notably enhanced through appropriate modifications to the adsorbent, such as employing lanthanide modification [11]. Lanthanide-modified adsorbents have demonstrated substantial improvement in both adsorption capacity and the rate of phosphate removal [12].
This study employs the rare-earth metal lanthanum to modify the efficient composite industrial residue phosphorus removal material (EPRC), the group’s former research outcome, to create lanthanum-modified enhanced composite phosphorus removal material (La-EPRC). Initial experimental analysis identifies the optimal modification method. Subsequently, La-EPRC undergoes static adsorption experiments to assess phosphorus removal efficacy, exploring stability during removal and material regeneration feasibility.

2. Materials and Methods

2.1. Preparation of La-EPRC Particles

La-EPRC granules, derived from lanthanum-modified fly ash and steel slag, were formulated with a specific ratio of binder. The binder, 525R ordinary silicate cement, was augmented with a plant-based blowing agent to enhance porosity and increase the material’s specific surface area.
The steel slag and fly ash utilized were sourced from an iron and steel plant and a power plant in Nanjing, respectively. Table 1 and Table 2 outline the primary physical properties and chemical compositions of the steel slag and fly ash employed in this study.
The experiment utilized 525R ordinary silicate cement as a binder, enhancing the hardening and molding of La-EPRC particles. Table 3 provides the primary chemical composition of the binder.
The experiment employed a plant-based foaming agent derived from a saponification reaction, consisting primarily of rosin and sodium hydroxide. The foaming agent exhibited a viscous brown liquid appearance [13].
Lanthanum modification led to loading of the modified steel slag and fly ash, with the adjusted ratio of 12:2:1.5 for lanthanum-modified fly ash (La-FA)/lanthanum-modified steel slag (La-SS)/binder.
The specific preparation method was as follows: Mass ratio of 12:2:1.5 for lanthanum metal-modified fly ash (La-FA), lanthanum metal-modified steel slag (La-SS), and binder, with the plant-based blowing agent accounting for 8‰ of the total composite material mass. The water required for granulation (4 mL/15 g) was mixed with the blowing agent, beaten with a magnetic stirrer to form a foam, and then added to the modified base material powder [14]. The mixture was introduced into a drum granulator for granulation, with particle size set at 3 mm. Within 6–8 h of granulation completion, the maintenance phase began, involving regular water spraying to maintain granule surface humidity for enhanced granule strength. The La-EPRC granule preparation flowchart is depicted in Figure 1.

2.2. Optimizing Adsorption Substrate Preparation for La-EPRC Particles

Optimizing La-EPRC particle preparation involves three key factors: the lanthanide to steel slag (SS) and fly ash (FA) mass ratio, impregnation time of the adsorbed substrate in the lanthanide solution, and the sequence of lanthanide immobilization.

2.2.1. Optimal Lanthanum-to-Substrate Mass Ratio

A total of 2 g of steel slag was impregnated in a lanthanum nitrate hexahydrate solution with lanthanum-to-slag mass ratios ranging from 0.2 to 0.5. The mixture was placed in a shaker (25 ± 1 °C, 150 ± 5 r/min) and shaken for 12 h. Following impregnation, a 1 mol/L sodium hydroxide solution was added to adjust the solution pH to 10, fixing the lanthanum element for 1 h. Further, 2 g of modified steel slag (La-SS) was weighed to remove phosphate from a 20 mg/L phosphorus solution, assessing the adsorption and phosphorus removal effect.
Lanthanum-modified fly ash (La-FA) was prepared similarly, with 2 g of fly ash impregnated in lanthanum nitrate hexahydrate solution at mass ratios of 0.2 to 0.5. After loading, 2 g of La-FA was weighed to assess its adsorption and phosphorus removal effectiveness from a 20 mg/L phosphorus solution.

2.2.2. Optimal Lanthanum Nitrate Solution Impregnation Time

Adopting the optimal ratios determined in the preceding section (0.4 for lanthanum-to-steel slag and 0.3 for lanthanum-to-fly ash), consistent experimental procedures were maintained to examine the impact of varying impregnation times on the adsorption and phosphorus removal effectiveness of the modified substrates.

2.2.3. Optimal Lanthanide Fixation Scheme

Sodium hydroxide was employed to immobilize the lanthanum elements, facilitating the formation of a stable lanthanum hydroxide crystal structure on the adsorption substrate. With a lanthanum-to-steel slag ratio of 0.4, lanthanum-to-fly ash ratio of 0.3, and a 12 h impregnation time, this study explored the influence of the sequence of sodium hydroxide addition into the suspension system on the adsorption effectiveness of phosphorus removal.

2.3. Characterization of La-EPRC Particles for Static Adsorption of Phosphorus Removal

2.3.1. Adsorption Isotherm Experiments

Two widely used adsorption isotherm models, Langmuir and Freundlich, were employed to investigate the adsorption mechanism of La-EPRC particles [15]. The experimental design involved adding phosphorus solution concentrations ranging from 5 mgP/L to 100 mgP/L into labeled stoppered conical flasks (labeled 1–9). Phosphorus standard reserve solutions were prepared and added to the flasks, followed by dilution to 250 mL with deionized water. Nine portions of La-EPRC material (2 g each) were weighed and added to the respective conical flasks. The solutions underwent continuous shaking in a shaker (25 ± 1 °C, 150 ± 5 r/min), and supernatants were collected after reaching adsorption equilibrium. These supernatants were filtered through a 0.45 μm pore size filter, and UV-Vis spectrophotometry was used to determine absorbance values to calculate corresponding adsorption concentrations [16], and adsorption isotherms at 25 °C were constructed. Similar procedures were followed at 15 °C and 35 °C to generate corresponding relationship curves.
  • Langmuir adsorption isotherm modeling
The Langmuir model posits that the adsorbent surface offers a finite number of adsorption sites, and the adsorption process exclusively transpires within a monomolecular layer. According to this model, the adsorbent attains maximum adsorption capacity when its surface reaches a state of saturated adsorption. Furthermore, the model assumes uniform attraction among all adsorption sites, implying equal affinities. As the reaction progresses, the surface adsorption sites on the adsorbent gradually become occupied, resulting in a deceleration of the adsorption rate. When nearly all available adsorption sites are engaged, the adsorption rate approaches zero, signifying the attainment of dynamic equilibrium in the adsorption reaction [17]. The specific expression for the Langmuir model is articulated as follows:
q e = q m K L C e 1 + K L C e ,
C e q e = 1 q m K L + C e q m .
In the given equation, q e represents the adsorption capacity at equilibrium in mg/g; q m denotes the saturated adsorption capacity of the adsorbent in mg/g; C e represents the equilibrium concentration of the adsorbent in mg/L; and K L signifies the Langmuir constant, expressed in L/mg. To determine these parameters, a linear fit was conducted by plotting C e / q e against C e . The saturated adsorption capacity ( q m ) can be computed from the slope of the resulting straight line, while the intercept yields the Langmuir constant ( K L ).
  • Freundlich adsorption isotherm model
The Freundlich model characterizes the adsorption process of the adsorbent as intricate, multilayered, and non-uniform in adsorption sites. It acknowledges the presence of heterogeneous adsorption sites on the surface of the adsorbent and postulates that the adsorbent is capable of offering an infinite number of adsorption sites. This model falls under physical adsorption and is applicable to describing the adsorption processes of both gases and liquids [18]. The specific expressions for the Freundlich model are articulated as follows:
q e = K F C e 1 n ,
ln q e = 1 n ln C e + ln K F .
In the provided equation, q e represents the adsorption capacity at equilibrium in mg/g; n signifies the Freundlich constant; C e denotes the equilibrium concentration of the adsorbent in mg/L; and K F denotes the Freundlich constant in mg/g. Through the plotting of ln q e against ln C e and subsequent linear fitting, the constant n can be computed from the slope of the resulting straight line, while the intercept provides the value of K F . The constant n is influenced by temperature, and a value between 0.1 and 0.5 for 1/n suggests a more facile adsorption process. K F , on the other hand, is predominantly affected by temperature and the specific surface area of the adsorbent. A larger K F corresponds to a higher maximum adsorption capacity for the material.

2.3.2. Adsorption Kinetics

The following amounts of the prepared phosphorus standard reserve solution were added to a 250 mL stoppered conical flask: 1.25 mL, 2.5 mL, 3.75 mL, and 5 mL. They were then diluted with deionized water to achieve concentrations of 5, 10, 15, and 20 mg/L. A total of 2 g of La-EPRC particles was weighed, added to the conical flask with varying phosphorus concentrations, and mixed thoroughly. The flasks were placed on a shaker for the adsorption experiment (25 ± 1 °C, 150 ± 5 r/min). Sampling occurred at 2 h, 4 h, 8 h, 12 h, 18 h, 24 h, 30 h, 36 h, 48 h, and 72 h. The upper layer of the supernatant was extracted during sampling and filtered through 0.45 μm filters. Absorbance was determined using the ammonium molybdate spectrophotometric method.
The experimental procedure for La-EPRC particle adsorption kinetics at different temperatures mirrored the aforementioned method, with shaker temperatures set at 15 °C, 25 °C, and 35 °C. The data were analyzed using pseudo-first-order (PFO) and pseudo-second-order (PSO) adsorption kinetic models.
  • PFO adsorption kinetic model
Lagergren’s research introduced the PFO adsorption kinetic model to delineate monolayer adsorption primarily governed by boundary diffusion. This model is particularly adept at capturing the swift reaction phase within the adsorption process, offering a more nuanced representation of this specific stage rather than the entirety of the adsorption process [19]. The expression for this PFO adsorption kinetic model is as follows:
ln Q e Q t = ln Q e k 1 t .
In the formula, Q e represents the adsorption capacity at equilibrium (mg/g), while Q t signifies the adsorption capacity of the adsorbent at time t (h) in milligrams per gram. The PFO kinetic equilibrium constant is denoted as k 1 , expressed in units of 1/h. When plotting t against ln Q e Q t , a well-fitted straight line with a correlation coefficient (R2) approaching 1 indicates that the material’s adsorption process aligns with the PFO kinetic model. The adsorption equilibrium constant is determined by the slope of this line, while the intercept allows for the calculation of the adsorbent’s equilibrium adsorption amount.
  • PSO adsorption kinetic model
The PSO adsorption kinetic model, elucidated and synthesized by HoYS and McKayG, primarily addresses adsorption processes constrained by chemisorption [20]. This model aptly characterizes the entirety of the adsorption process and is represented by the following expression:
t Q t = 1 k 2 Q e 2 + t Q e .
In this equation, k 2 denotes the PFO kinetic equilibrium constant, expressed in units of g/(mg × h). By plotting t/ Q t against t, the slope of the resulting straight line, derived from the regression fit, provides the value of Q e , while the intercept corresponds to the value of k 2 .

2.3.3. Adsorbent Dosage Experiment

A total of 5 mL of the phosphorus standard reserve solution with a concentration of 1 gP/L was taken for nine samples. Deionized water was added to dilute the samples to 250 mL and mixed well to create a solution with a concentration of 20 mgP/L. The following amounts of La-EPRC particles were weighed: 1 g, 1.5 g, 2 g, 2.5 g, 3 g, 3.5 g, 4 g, 4.5 g, and 5 g. These were sequentially added to conical flasks No. 1–9. The flasks were placed in a shaker (25 ± 1 °C, 150 ± 5 r/min) for continuous shaking. After the adsorption reaction reached equilibrium, typically in 48 h, the reaction was stopped and supernatant samples were collected. All nine samples were filtered through a 0.45 μm filter, absorbance was determined using ammonium molybdate spectrophotometry, and the remaining phosphorus concentration in the solution and the adsorbent adsorption amount were calculated.

2.3.4. Solution pH Experiments

The pH of nine 250 mL phosphate solutions (20 mg P/L) was adjusted to 2~12 using 1 mol/L, 0.1 mol/L NaOH, and HCl solutions. Adding 2 g of La-EPRC particles to solutions with different pH levels, the mixtures were placed on a shaking table (25 ± 1 °C, 150 ± 5 r/min) for continuous shaking until the adsorption reaction reached equilibrium, typically at 48 h. After reaching equilibrium, the reaction was halted, and supernatant samples were collected to determine and calculate the remaining phosphorus content and adsorbent removal efficiency. This process involved filtering the supernatant through a 0.45 μm filter and analyzing the impact of solution pH on the adsorption effect.

2.3.5. Coexisting Anion Experiments

Common water anions Cl, SO42−, HCO 3 ,  and CO32− (added as sodium salts) were chosen for study in terms of their impact on La-EPRC particle adsorption. Nine 5 mL portions of a phosphorus standard stock solution (1 gP/L) were individually diluted to 250 mL with deionized water, resulting in a solution with a concentration of 20 mg P/L. Coexisting anions Cl, SO42−, HCO 3 , and CO32− were added at molar concentration ratios of elemental phosphorus (0.5:1, 1:1, 2:1). The corresponding masses of NaCl, N a 2 S O 4 , NaHC O 3 , and N a 2 C O 3 were weighed and added to the phosphorus solution. A total of 2 g of La-EPRC particles was introduced into each solution and placed on a shaker (25 ± 1 °C, 150 ± 5 r/min) for continuous shaking. After the adsorption reaction reached equilibrium at 48 h, the reaction was stopped, supernatant samples were taken, and after filtering through a 0.45 μm filter, the absorbance was measured. The remaining phosphorus concentration and adsorbent adsorption were calculated to analyze the impact of coexisting anions on adsorption efficiency.

2.4. Stability Analysis and Regeneration Studies of La-EPRC Particles

2.4.1. Material Adsorption Stability

The adsorption stability of the material was assessed by experimentally determining the desorption of adsorbed phosphorus elements from La-EPRC particles in room temperature water, high-temperature hot water, and sulfuric acid solution.
1.
Room Temperature Water Desorption
The following amounts of 1 g P/L phosphorus standard reserve solution were taken: 1.25 mL, 2.5 mL, 5 mL, 12.5 mL, 25 mL, 37.5 mL, and 50 mL. These were diluted with deionized water to 250 mL, creating concentrations of 5 mg P/L, 10 mg P/L, 20 mg P/L, 50 mg P/L, 100 mg P/L, 150 mg P/L, 200 mg P/L. A total of 3 g of La-EPRC particles was weighed into each conical flask and placed in a shaker (25 ± 1 °C, 150 ± 5 r/min). After 48 h of continuous shaking, the samples were taken and filtered through a 0.45 μm filter, and absorbance was measured using ammonium molybdate spectrophotometry to calculate residual phosphorus concentration and the adsorption amount of the adsorbent.
After adsorption, La-EPRC particles were washed 3–5 times with water and air-dried. The dried particles were placed in seven 250 mL conical flasks sequentially, with 250 mL of deionized water added simultaneously. The particles were subjected to constant shaking in a shaker (25 ± 1 °C, 150 ± 5 r/min) for 48 h to desorb the material. After the reaction was halted, samples were collected, and after filtration for absorbance determination, the desorbed material amount and desorption rate were calculated.
2.
Desorption in High-Temperature Water
The following amounts of 1 g P/L phosphorus standard reserve solution were taken: 1.25 mL, 2.5 mL, 5 mL, 12.5 mL, 25 mL, 37.5 mL, and 50 mL. These were diluted with deionized water to 250 mL, creating concentrations of 5 mg P/L, 10 mg P/L, 20 mg P/L, 50 mg P/L, 100 mg P/L, 150 mg P/L, and 200 mg P/L. A total of 3 g of La-EPRC particles was weighed for each flask, placed in a shaker (25 ± 1 °C, 150 ± 5 r/min), and sampled after the adsorption reaction reached equilibrium at 48 h. The samples were filtered, absorbance was measured, and phosphorus concentration and the adsorption amount of the adsorbent were calculated.
After adsorption, La-EPRC particles were rinsed 3~5 times with water and dried naturally indoors. The dried particles were placed into 7 sets of 250 mL conical flasks, adding 250 mL of deionized water simultaneously. The particles were placed in a shaker with constant shaking (25 ± 1 °C, 150 ± 5 r/min), desorption was conducted for 48 h, the reaction was stopped, the supernatant was sampled, the samples were filtered, absorbance was determined, and the material desorption amount and desorption rate were calculated.
3.
Desorption in Sulfuric Acid Solution
A total of 5 mL of 1 g P/L phosphorus standard reserve solution was taken and distributed into five conical flasks. Each flask was diluted to 250 mL with deionized water to create a 20 mg P/L dilute solution. A total of 3 g of La-EPRC particles was weighed into each flask, placed in a shaker with constant shaking (25 ± 1 °C, 150 ± 5 r/min), and sampled after the 48 h adsorption reaction reached equilibrium. The samples were filtered, absorbance was measured, and phosphorus concentration and the adsorption amount of the adsorbent were calculated.
After adsorption, La-EPRC particles were rinsed 3~5 times with water and dried naturally indoors. Sulfuric acid solutions with concentrations of 0.01 mol/L, 0.1 mol/L, 0.5 mol/L, and 1.0 mol/L were prepared. The dried particles were sequentially placed into five 250 mL conical flasks and desorbed in a shaker for 48 h. The reaction was stopped, sampled, absorbance after filtration was measured, and the amount of material desorbed and desorption rate were calculated.

2.4.2. Adsorbent Regeneration Experiment

  • NaOH Concentration
A total of 5 mL of 1 g P/L phosphorus standard reserve solution was taken, diluted to 250 mL with deionized water, and mixed well to create a 20 mg P/L phosphorus dilute solution. A total of 3 g of La-EPRC particles was weighed, added to a conical flask, and placed in a shaker with constant shaking (25 ± 1 °C, 150 ± 5 r/min). After stopping the reaction for 48 h, the samples were filtered and measured to calculate the adsorption capacity of the adsorbent.
After adsorption, 250 mL of NaOH solution was reintroduced to the La-EPRC particles, with concentrations ranging from 0.01 mol/L to 4 mol/L. They were continuously placed in the shaker for 24 h to achieve full desorption. At the end of the reaction, a supernatant sample was taken to determine absorbance using a spectrophotometer and the phosphate desorption rate was calculated.
2.
Desorption Time
A total of 3 g of La-EPRC particles was added to 250 mL of 20 mg P/L phosphorus solution, placed in a shaker with constant shaking (25 ± 1 °C, 150 ± 5 r/min), and sampled after the reaction stopped at 48 h. The samples were filtered and measured to calculate the adsorption capacity of the adsorbent. After adsorption, 250 mL of 2.5 mol/L NaOH solution was reintroduced into the La-EPRC particles and shaking was continued to fully desorb them. Samples were taken at 2 h, 4 h, 8 h, 12 h, 18 h, 24 h, and 48 h intervals, and the absorbance of the phosphorus solution was measured using a spectrophotometer after sample removal to calculate the phosphate desorption rate at different time points.
3.
Three Successive Adsorption–Desorption Experiments
A total of 3 g of La-EPRC particles was added to 250 mL of 20 mg P/L phosphorus solution and placed in a shaker (25 ± 1 °C, 150 ± 5 r/min). Sampling was conducted after 48 h, followed by filtration for absorbance determination and calculation of adsorption capacity. Subsequently, 250 mL of 2.5 mol/L NaOH solution was reintroduced for 24 h to fully desorb the La-EPRC particles. This adsorption–desorption cycle was repeated twice more, and absorbance was measured to calculate adsorption capacity and removal rate.

3. Results and Discussion

3.1. Optimization of Preparation Conditions for Adsorption Substrates of La-EPRC Particles

3.1.1. Optimal Lanthanum-to-Substrate Mass Ratio

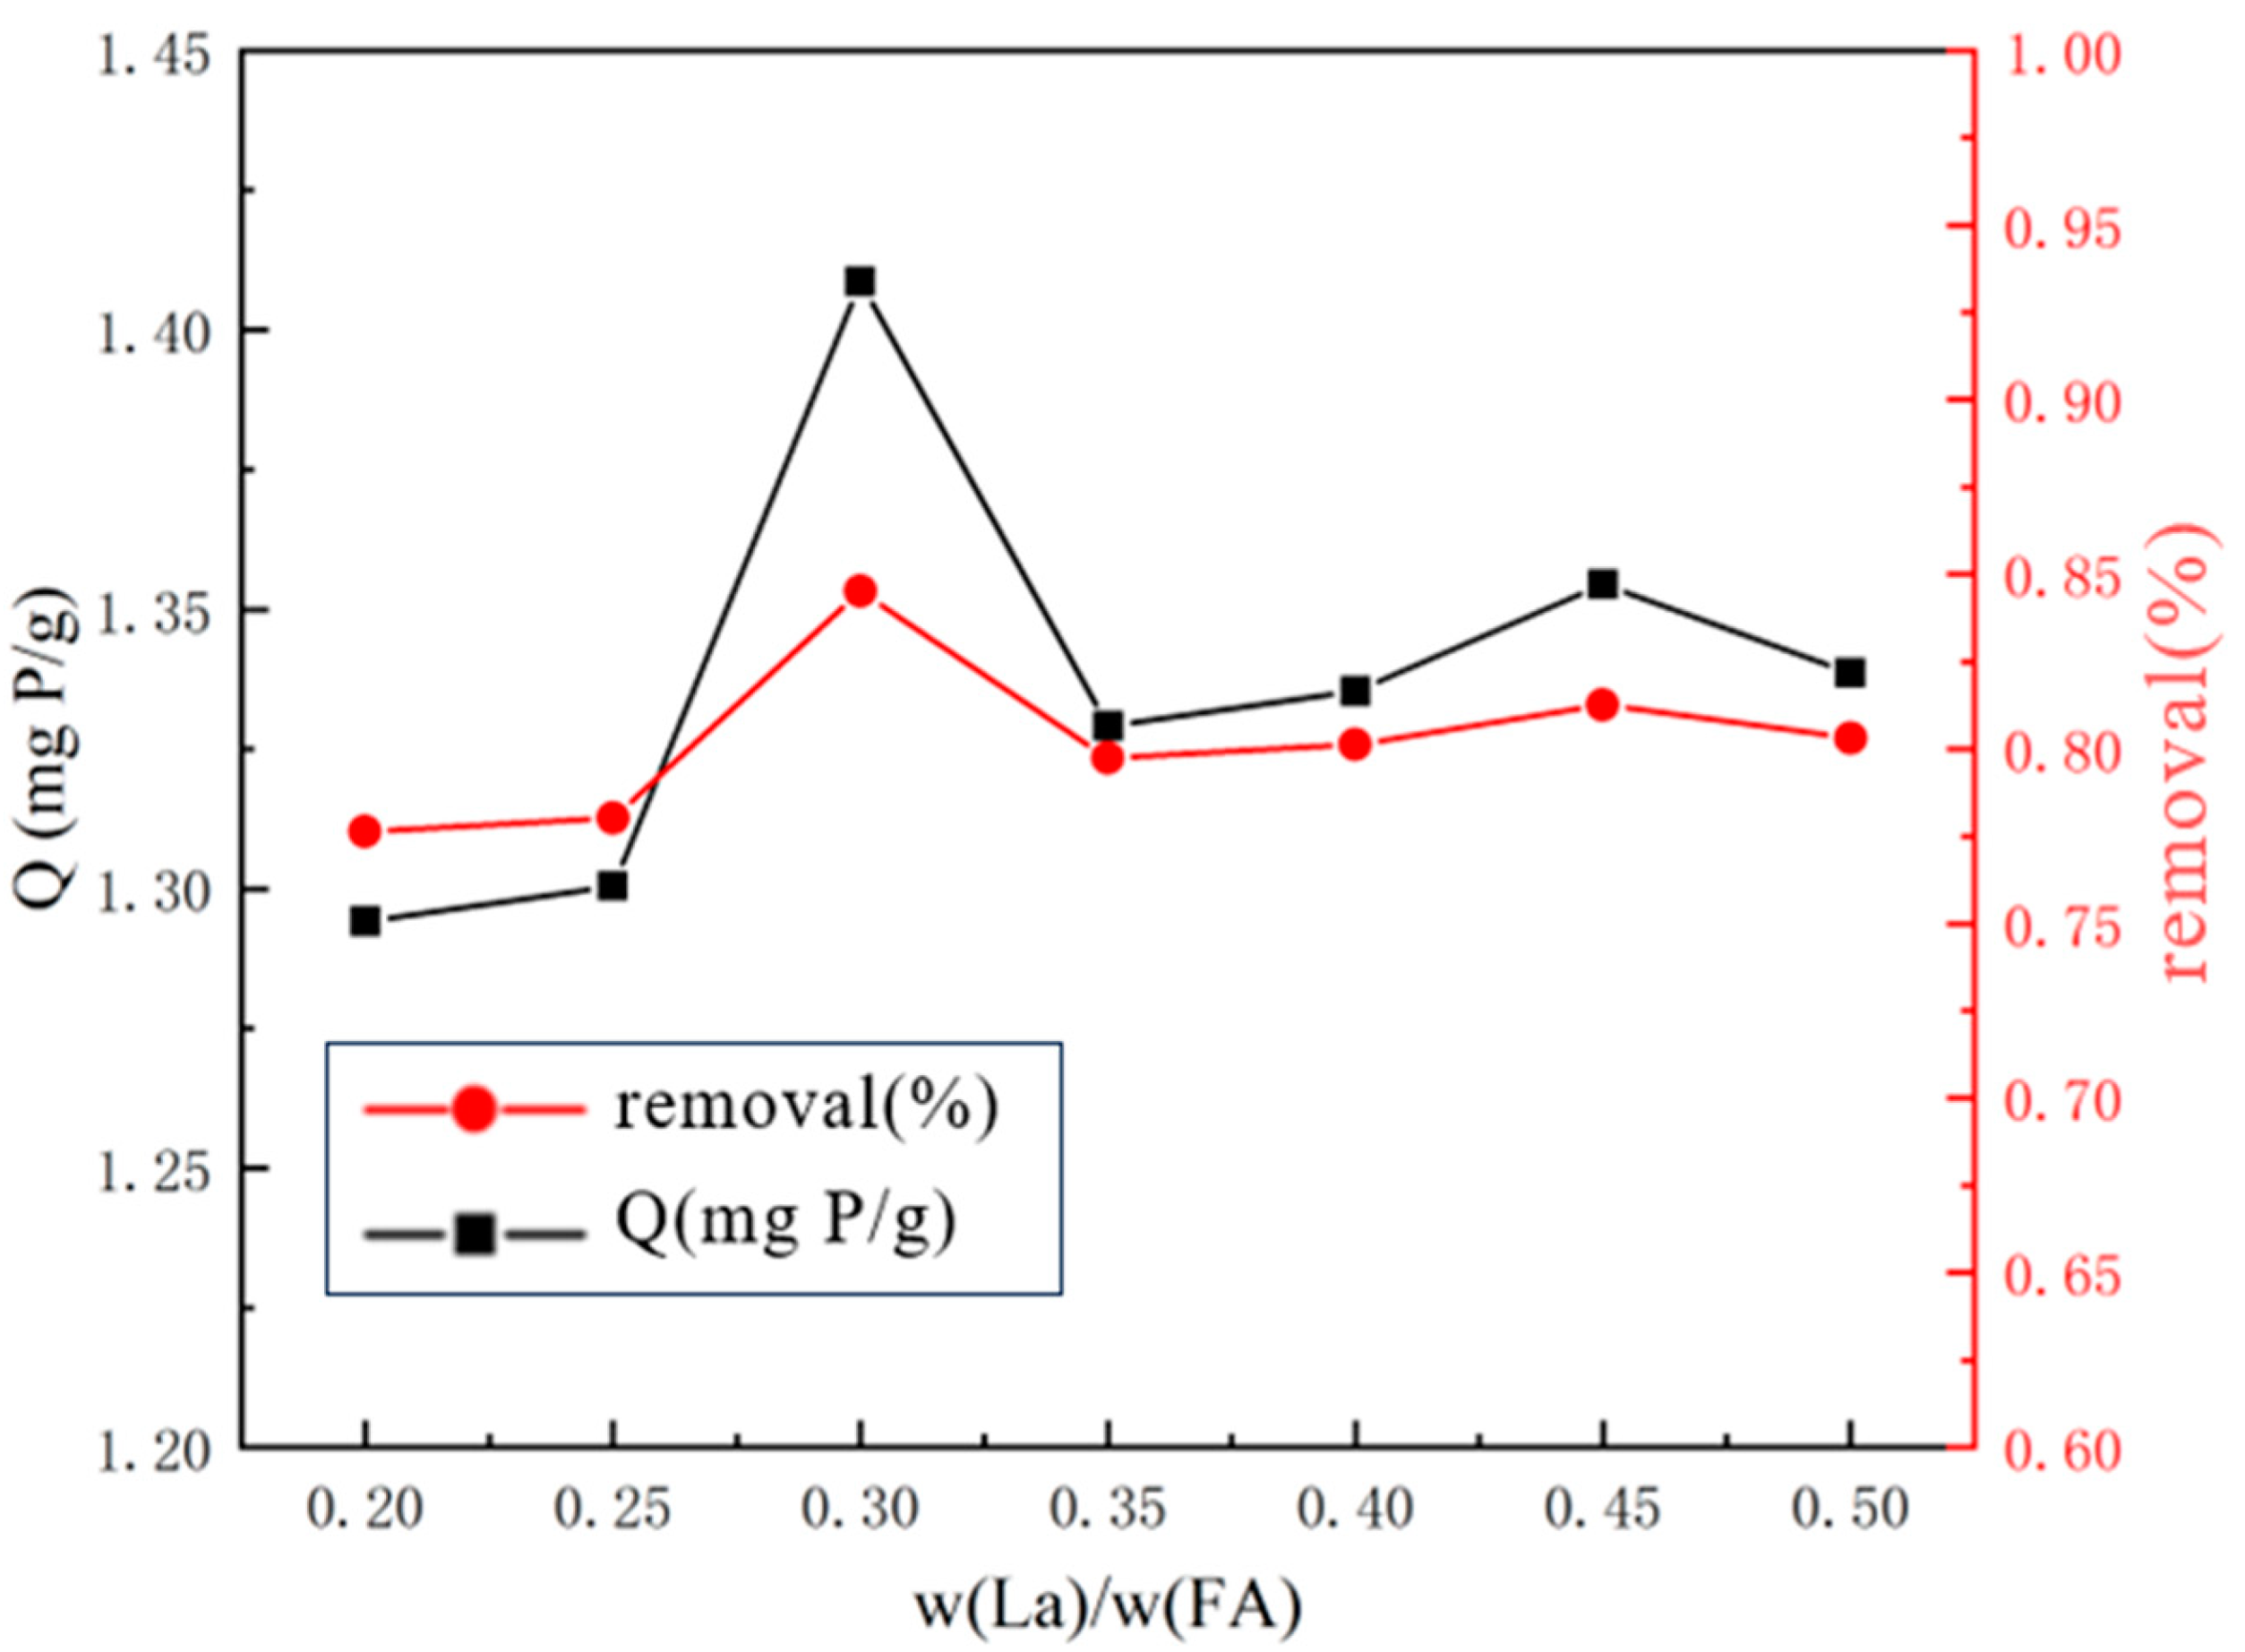
Figure 2 and Figure 3 present the experimental findings, highlighting the discernible impact of varying w(La)/w(SS) and w(La)/w(FA) on the adsorption and phosphorus removal capabilities of the materials. Initially, an increase in the lanthanum-to-substrate mass ratio led to greater binding sites, enhancing adsorption capacity and removal rate. However, at later stages, the interplay of factors, including w(La)/w(SS) and w(La)/w(FA), resulted in a decline in material adsorption capacity and removal rate. Notably, lanthanum-modified steel slag exhibited optimal phosphate removal at a mass ratio of 0.4, achieving a removal rate of 96%. Lanthanum-modified fly ash demonstrated superior phosphate removal at a mass ratio of 0.3, yielding an 84% removal rate. Consequently, w(La)/w(SS) = 0.4 and w(La)/w(FA) = 0.3 were identified as the optimal mass ratios for adsorption substrate modification in this study.

3.1.2. Optimal Lanthanum Nitrate Solution Impregnation Time

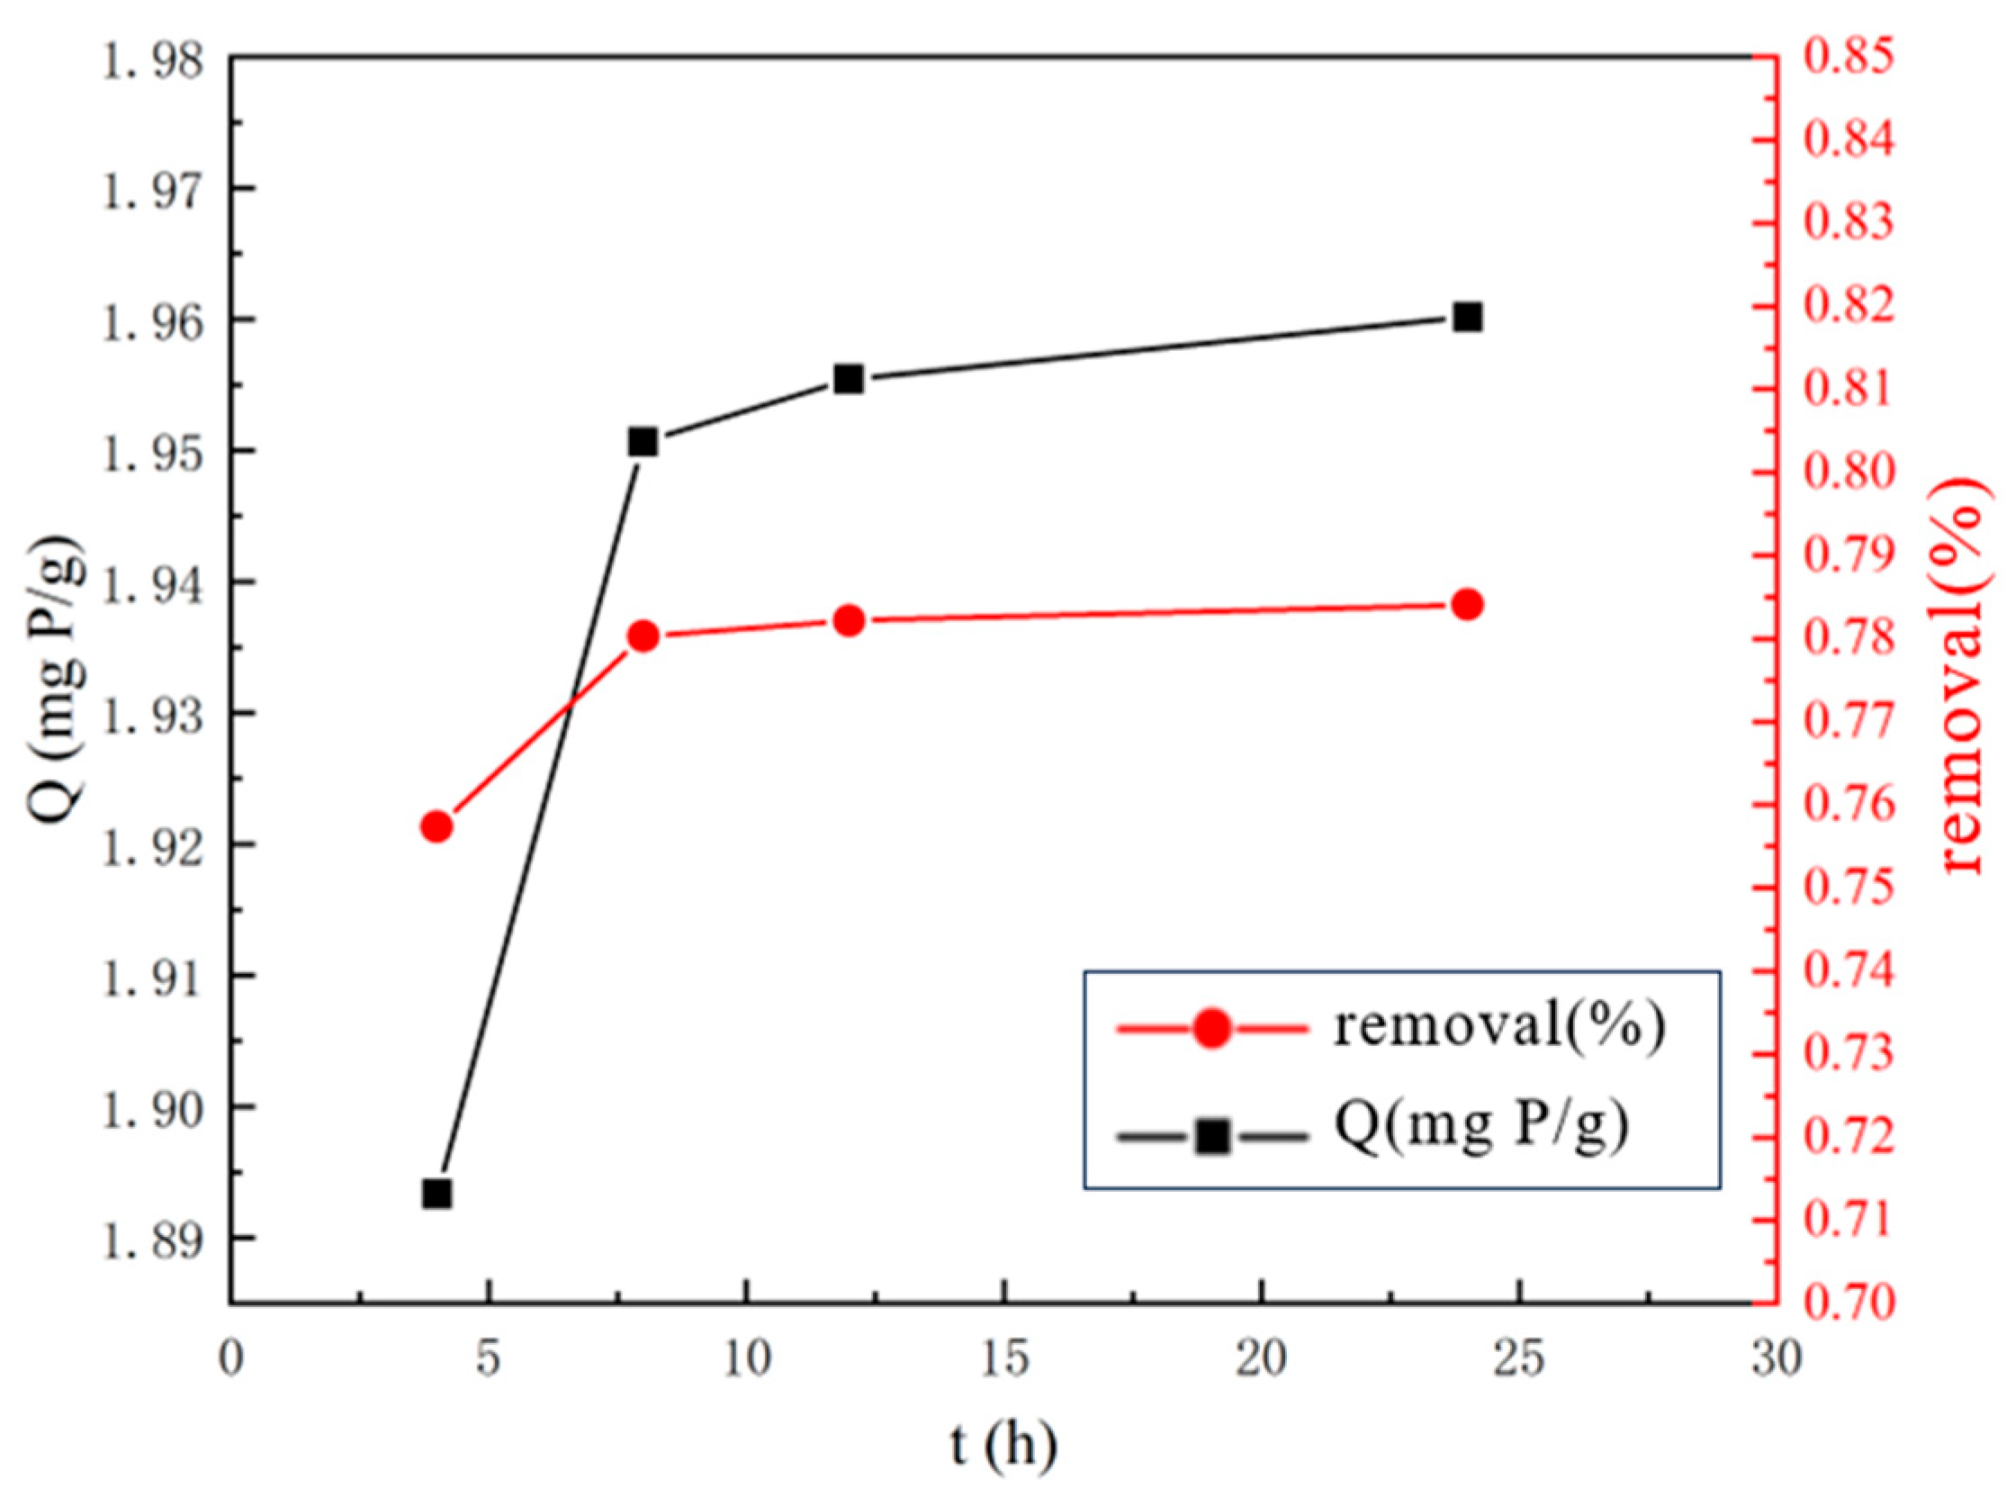
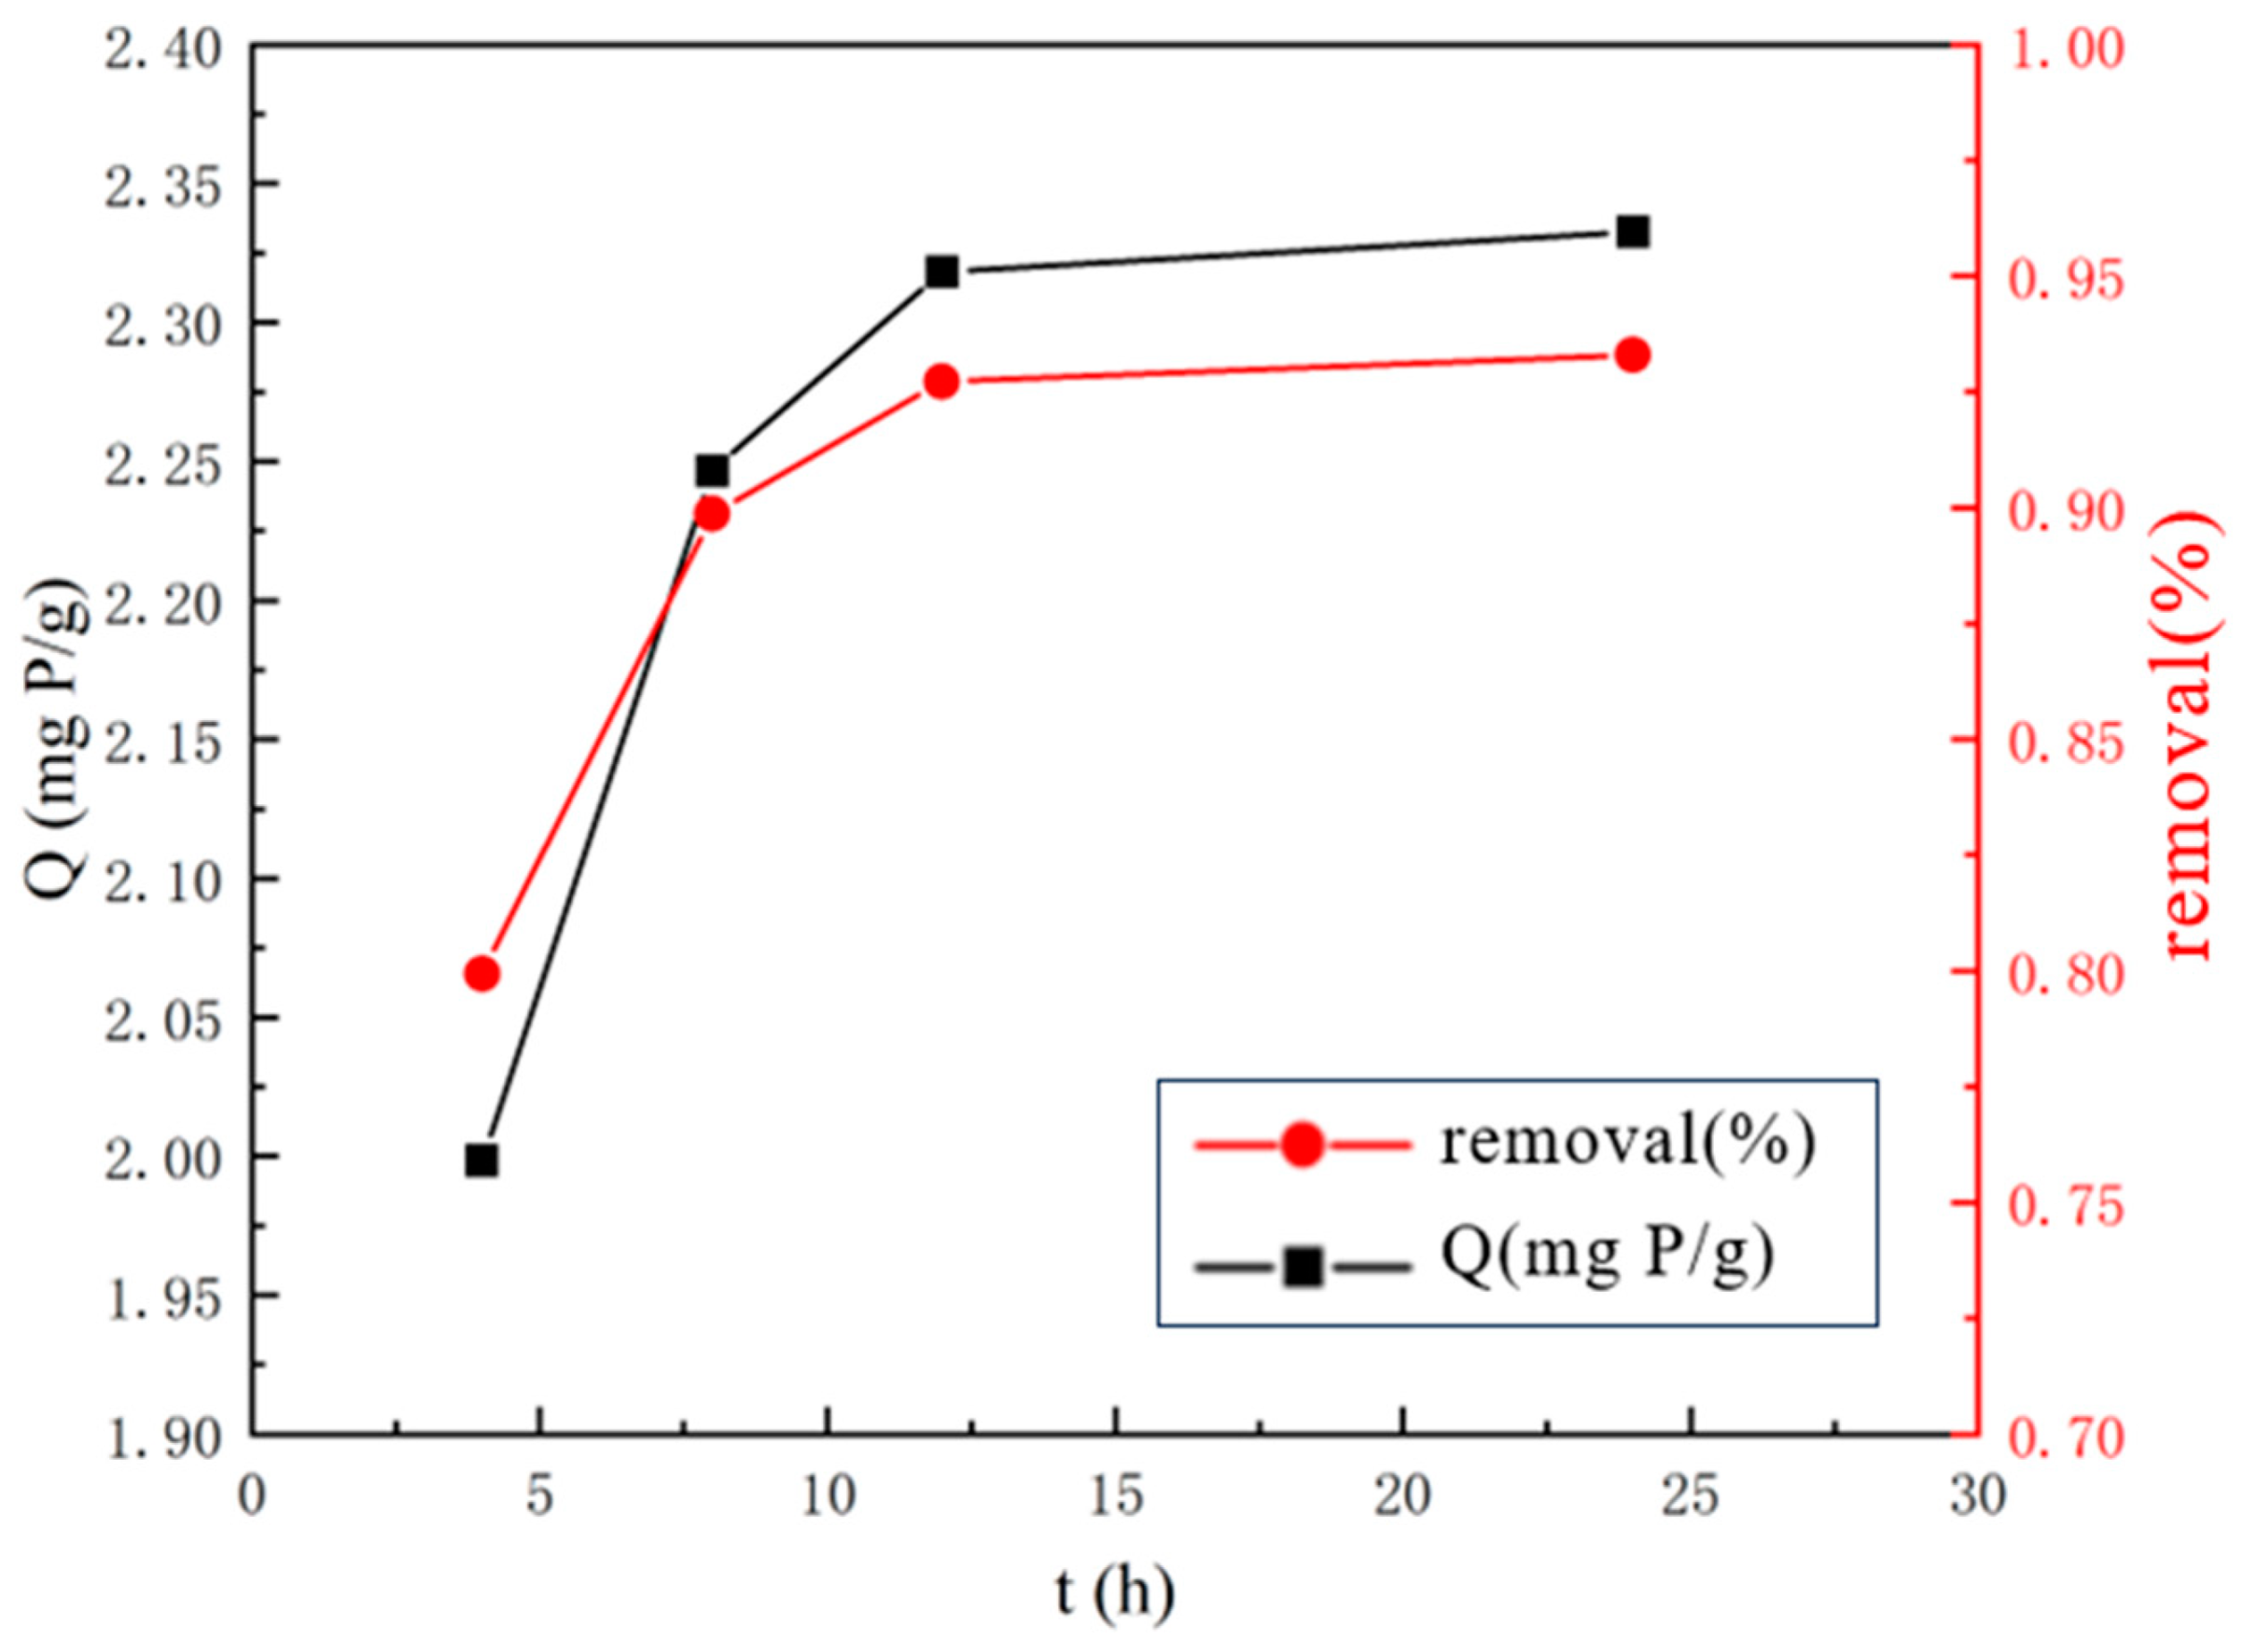
The experimental results are depicted in Figure 4 and Figure 5. With the extension of the impregnation time of lanthanum nitrate solution, the adsorption and phosphorus removal capacity of the modified material gradually improves. The adsorption capacity of modified steel slag steadily increases within the 4~12 h impregnation time range, reaching equilibrium after 12 h. In contrast, modified fly ash essentially reaches equilibrium after 8 h of impregnation. Extending the impregnation time allows sufficient time for lanthanum ions to reach the surface of steel slag and fly ash, becoming stably immobilized on the material’s surface. The loading of lanthanum on the material’s surface essentially saturates in the later stages, and further extending the impregnation time does not significantly impact the adsorption effect. According to the experimental results, the impregnation time for modified steel slag was set at 12 h. Since the adsorption capacity of modified fly ash did not show substantial differences after 8 h of impregnation, the impregnation time for modified fly ash was also set at 12 h for the convenience of subsequent experiments.

3.1.3. Optimal Lanthanide Immobilization Procedure

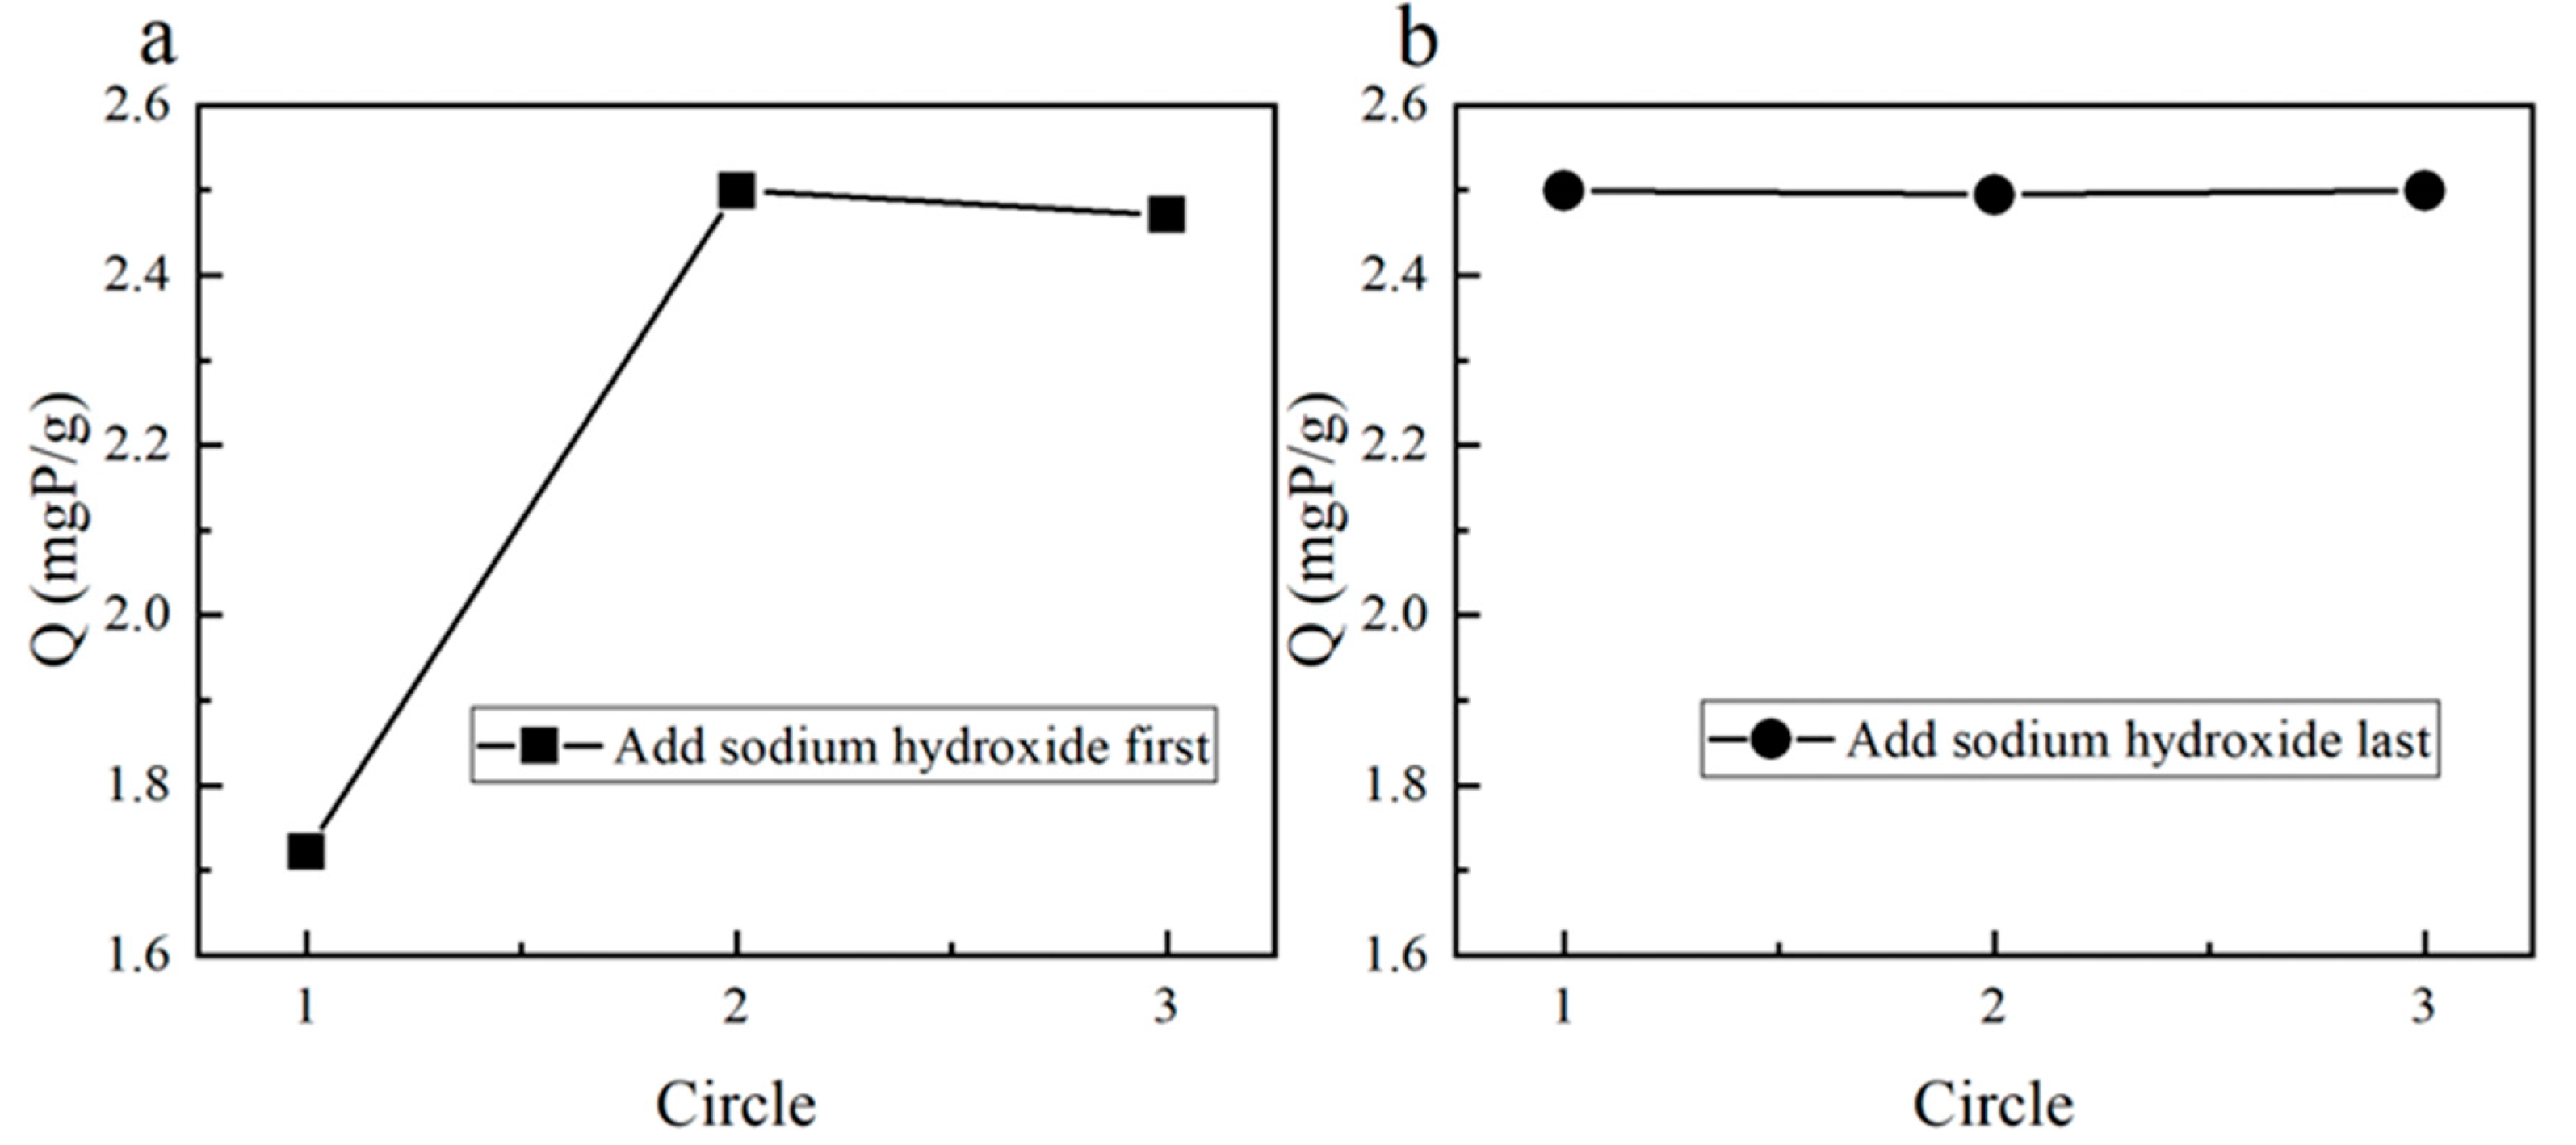
As depicted in Figure 6 and Figure 7, coprecipitation fixation with sodium hydroxide after the completion of the impregnation process on the adsorption substrate yields a more stable result for both modified steel slag and modified fly ash. This enhanced stability is attributed to the 12 h loading of lanthanum on the adsorption substrate, allowing for a more effective reaction between lanthanum and the material in the surface and pores of the adsorption substrate. In contrast, the simultaneous addition of sodium hydroxide during loading may impede the stable reaction between lanthanum and the adsorbent substrate.

3.2. Characterization of La-EPRC Particles for Static Adsorption of Phosphorus Removal

3.2.1. Adsorption Isotherms

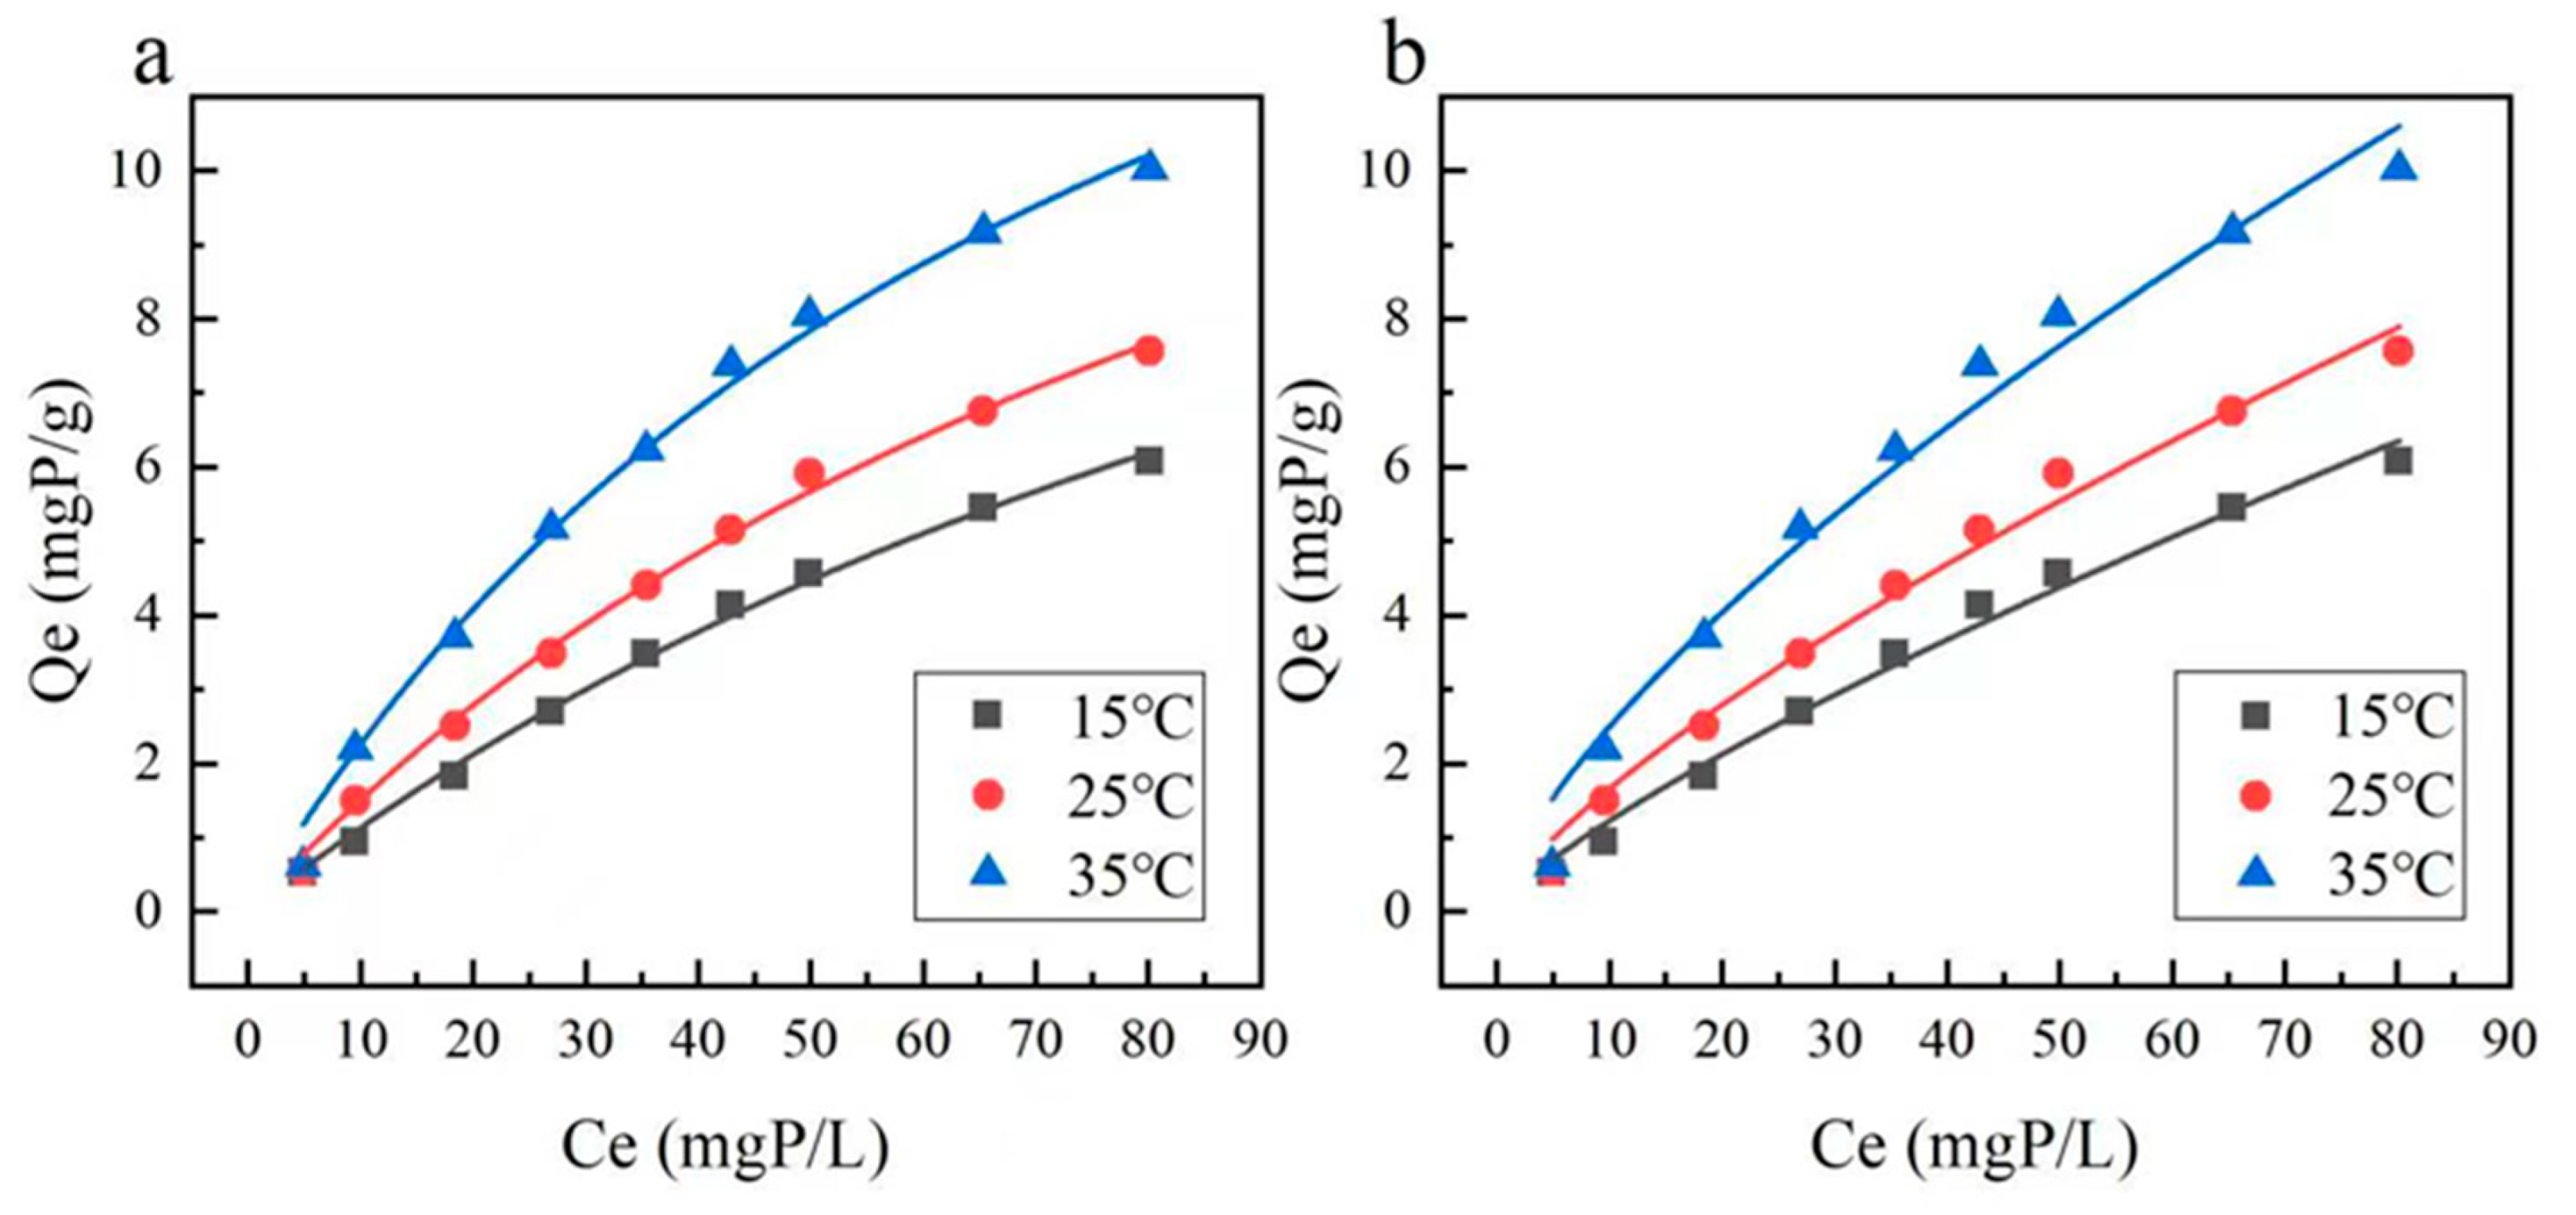
The Langmuir and Freundlich isotherm models were individually applied to fit the experimental data, as illustrated in Figure 8 and detailed in Table 4.
Examining the data in Table 4 reveals that the correlation coefficients in the final fitting results of the Langmuir isothermal adsorption model exceed 0.99, while those of the Freundlich isothermal adsorption model surpass 0.98. The fitting correlations for both models are notably high. Furthermore, the fit of the Langmuir isothermal adsorption model at different temperatures outperforms that of the Freundlich isothermal adsorption model. This suggests that the adsorption process of phosphate by La-EPRC material aligns more closely with the Langmuir isothermal adsorption model, indicating a predominant monomolecular layer adsorption mode for the particles.
Analyzing the QM values from the Langmuir model in the table reveals that the saturation adsorption amount of La-EPRC particles increases with temperature in the range of 15–35 °C. Parameter KL values in the table, all within the range of 0.1, indicate that La-EPRC material is favorable for the adsorption of phosphate.
Regarding the Freundlich model, the parameter KF, reflecting adsorption affinity, increases within the temperature range of 15–35 °C, suggesting that the primary adsorption mode of La-EPRC material is monomolecular layer adsorption. The values of 0.5 < 1/n < 2, remaining near 0.7 and decreasing with temperature, indicate that temperature continues to promote the adsorption reaction.
The adsorption of phosphate by La-EPRC material conforms more closely to the Langmuir isothermal adsorption model. Consequently, the primary adsorption mechanism of this material is monolayer adsorption, with a maximum saturated adsorption capacity of 20.395 mg P/g. In contrast, the EPRC material prior to modification exhibits a maximum saturated adsorption capacity of 4.18 mg P/g [21], underscoring a substantial improvement in the adsorption capacity of the modified material.

3.2.2. Adsorption Kinetics

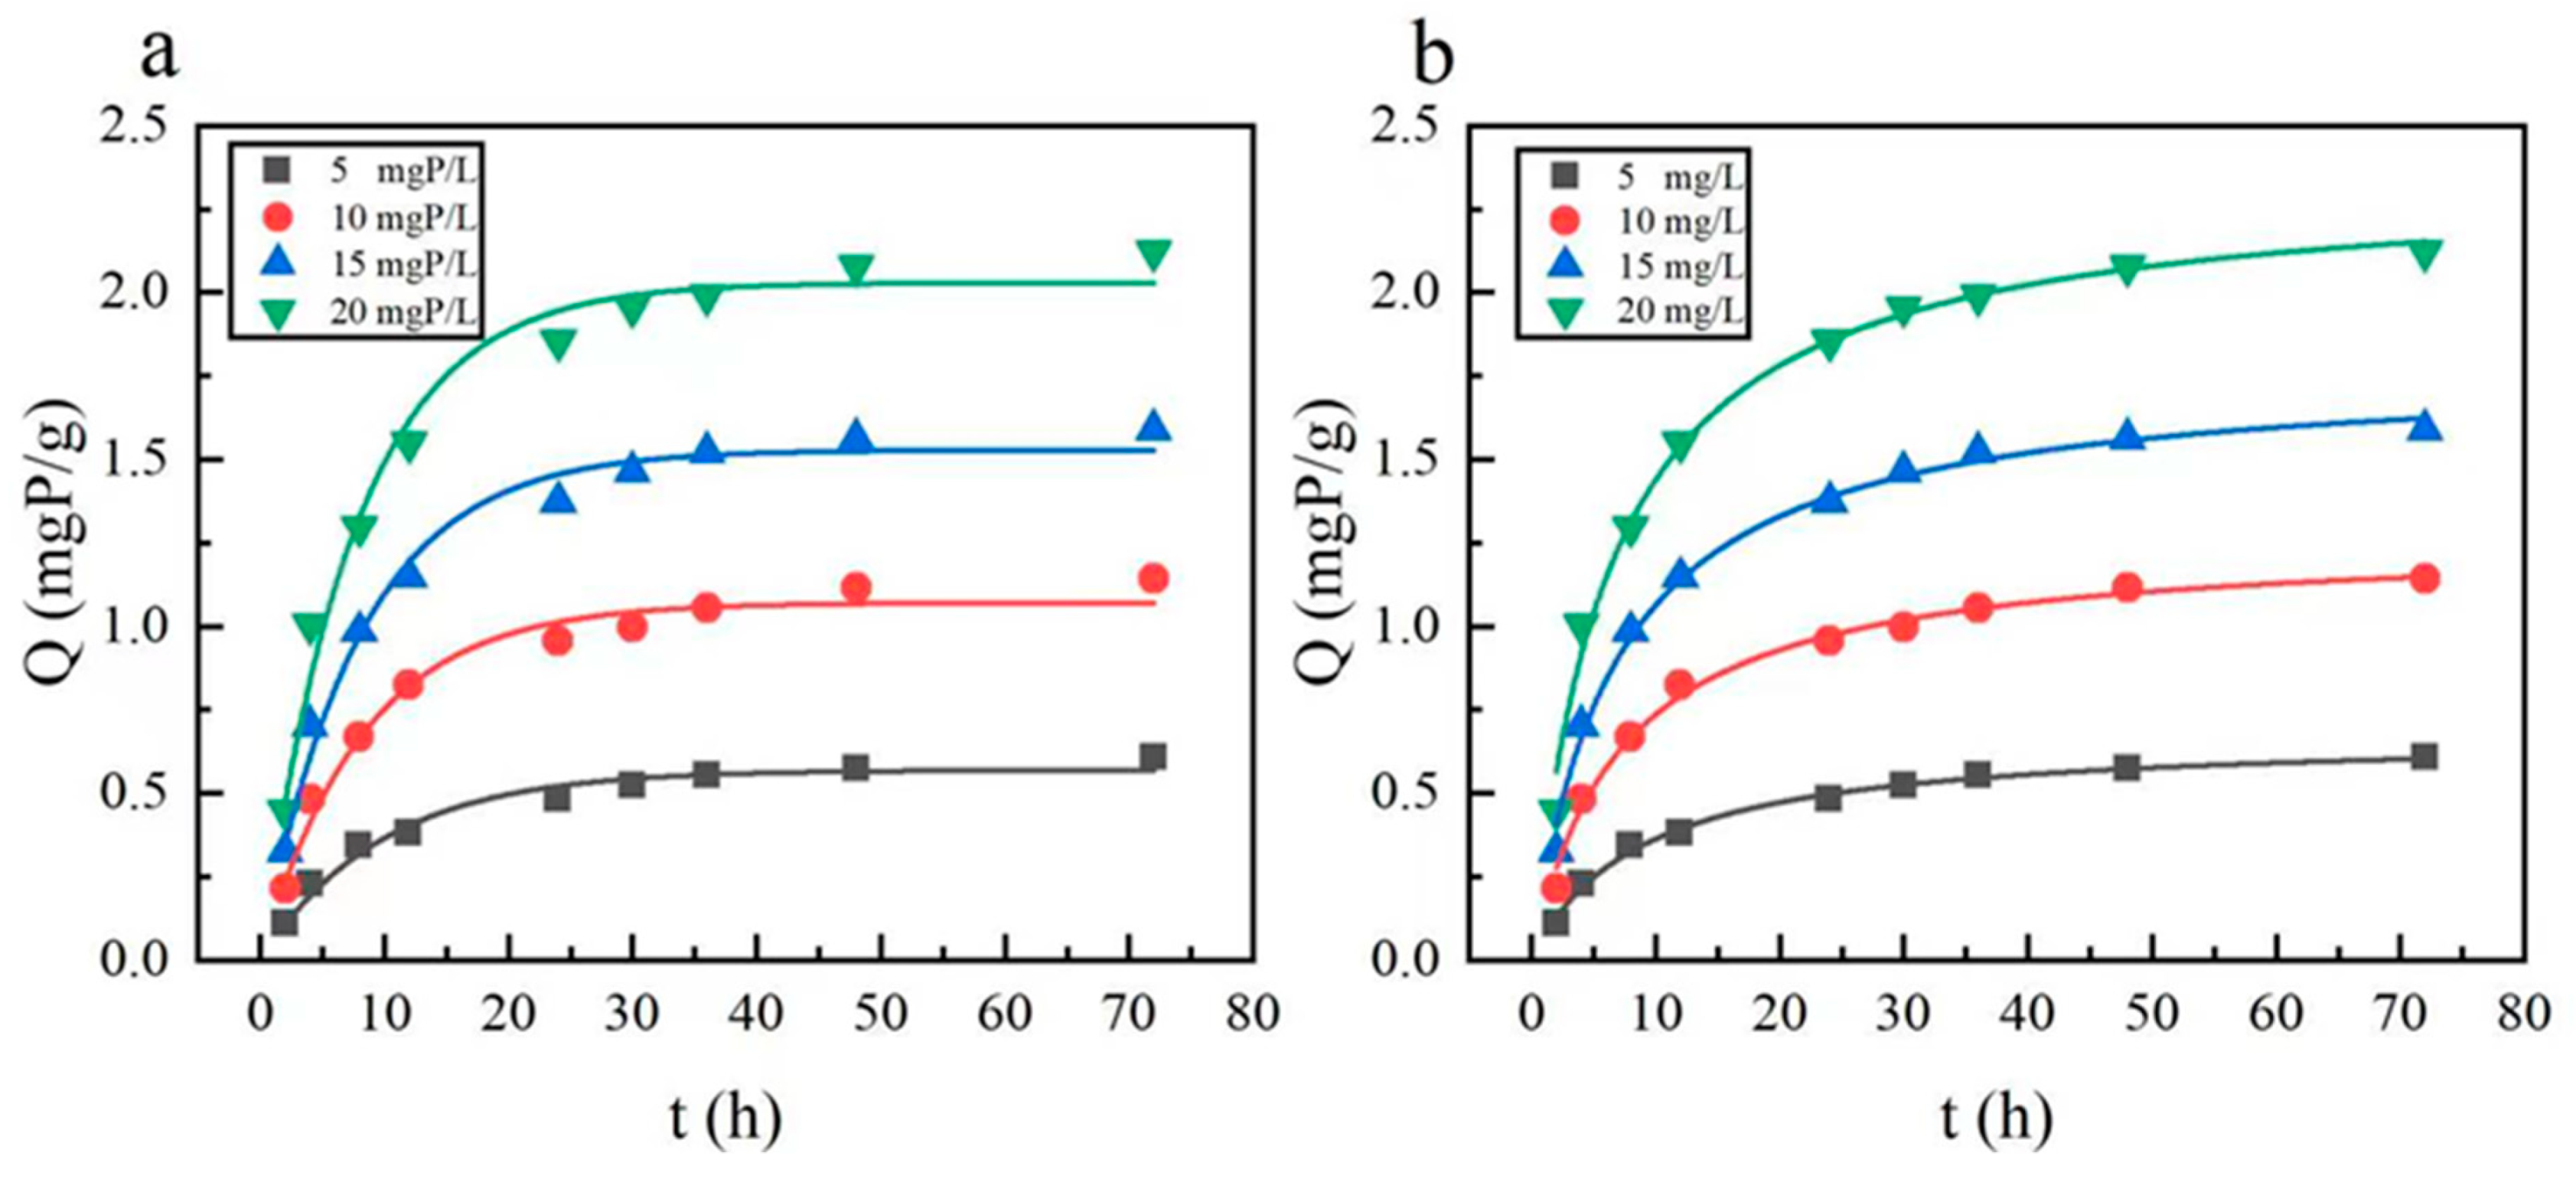
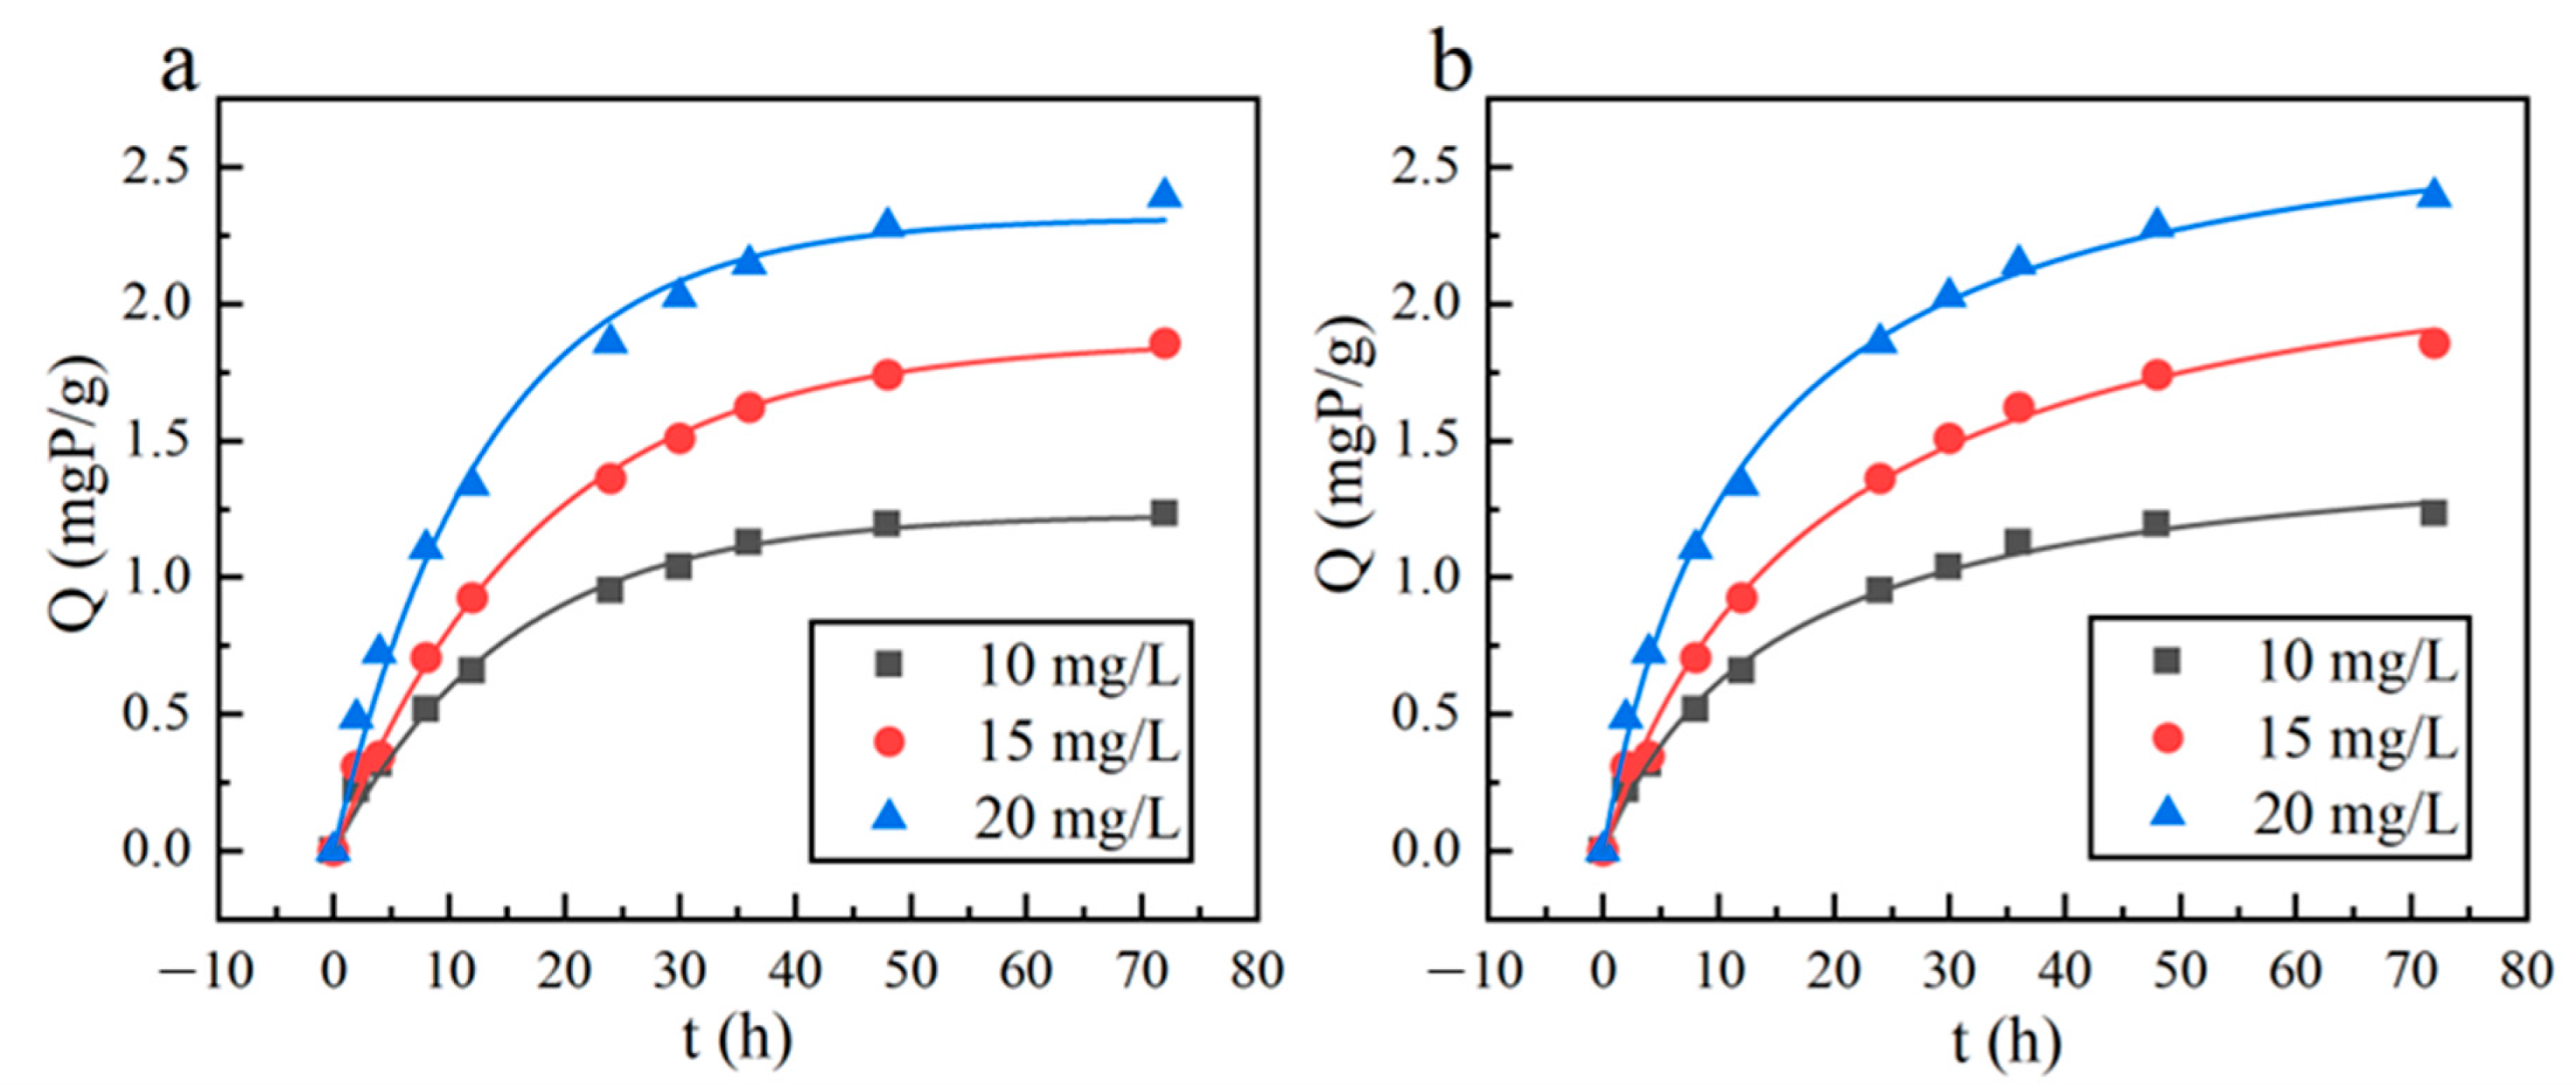
Corresponding to phosphorus concentration and adsorption amount, a relationship curve between reaction time (t) and adsorption amount (Q) was plotted, as illustrated in Figure 9. Notably, the adsorption rate during the initial period is faster for each reaction with different initial concentrations of phosphorus solution. This phenomenon is attributed to the abundance of material adsorption sites in the initial phase, leading to less competition and facilitating a rapid reaction. As the reaction progresses, the concentration difference in the solution decreases, resulting in a gradual reduction in adsorption rate, indicating the transition to the slow reaction stage. With diminishing phosphorus solution concentration, the competitiveness of adsorption sites intensifies, further slowing down the adsorption rate. Over time, the material’s adsorption eventually reaches equilibrium, entering the adsorption equilibrium stage, represented by a flat curve.
Additionally, higher initial concentrations of the reaction correspond to greater adsorption capacities in the early stage and higher capacities upon reaching equilibrium. Furthermore, lower initial concentrations of the phosphorus solution lead to faster equilibrium times, whereas higher concentrations result in slower equilibrium times.
Pseudo-first-order (PFO) and pseudo-second-order (PSO) kinetic models were applied to the data obtained from the aforementioned experiments. The fitting results are depicted in Figure 9, and detailed outcomes are summarized in Table 5.
As indicated in Table 5, the correlation coefficients for PFO kinetics (R2 > 0.96) and PSO kinetics (R2 > 0.99) are highly regressive. However, the results from PSO kinetics surpass those of the PFO kinetics model across different initial concentrations of the phosphorus solution. This suggests that the adsorption kinetics of La-EPRC particles align more closely with the PSO kinetics model. The qe values calculated from the PSO kinetic fitting also exhibit closer agreement with the experimentally obtained values. Consequently, it can be concluded that the adsorption of phosphorus by the modified particles primarily involves chemisorption, with the adsorption process being predominantly rate-limited by chemisorption [22].
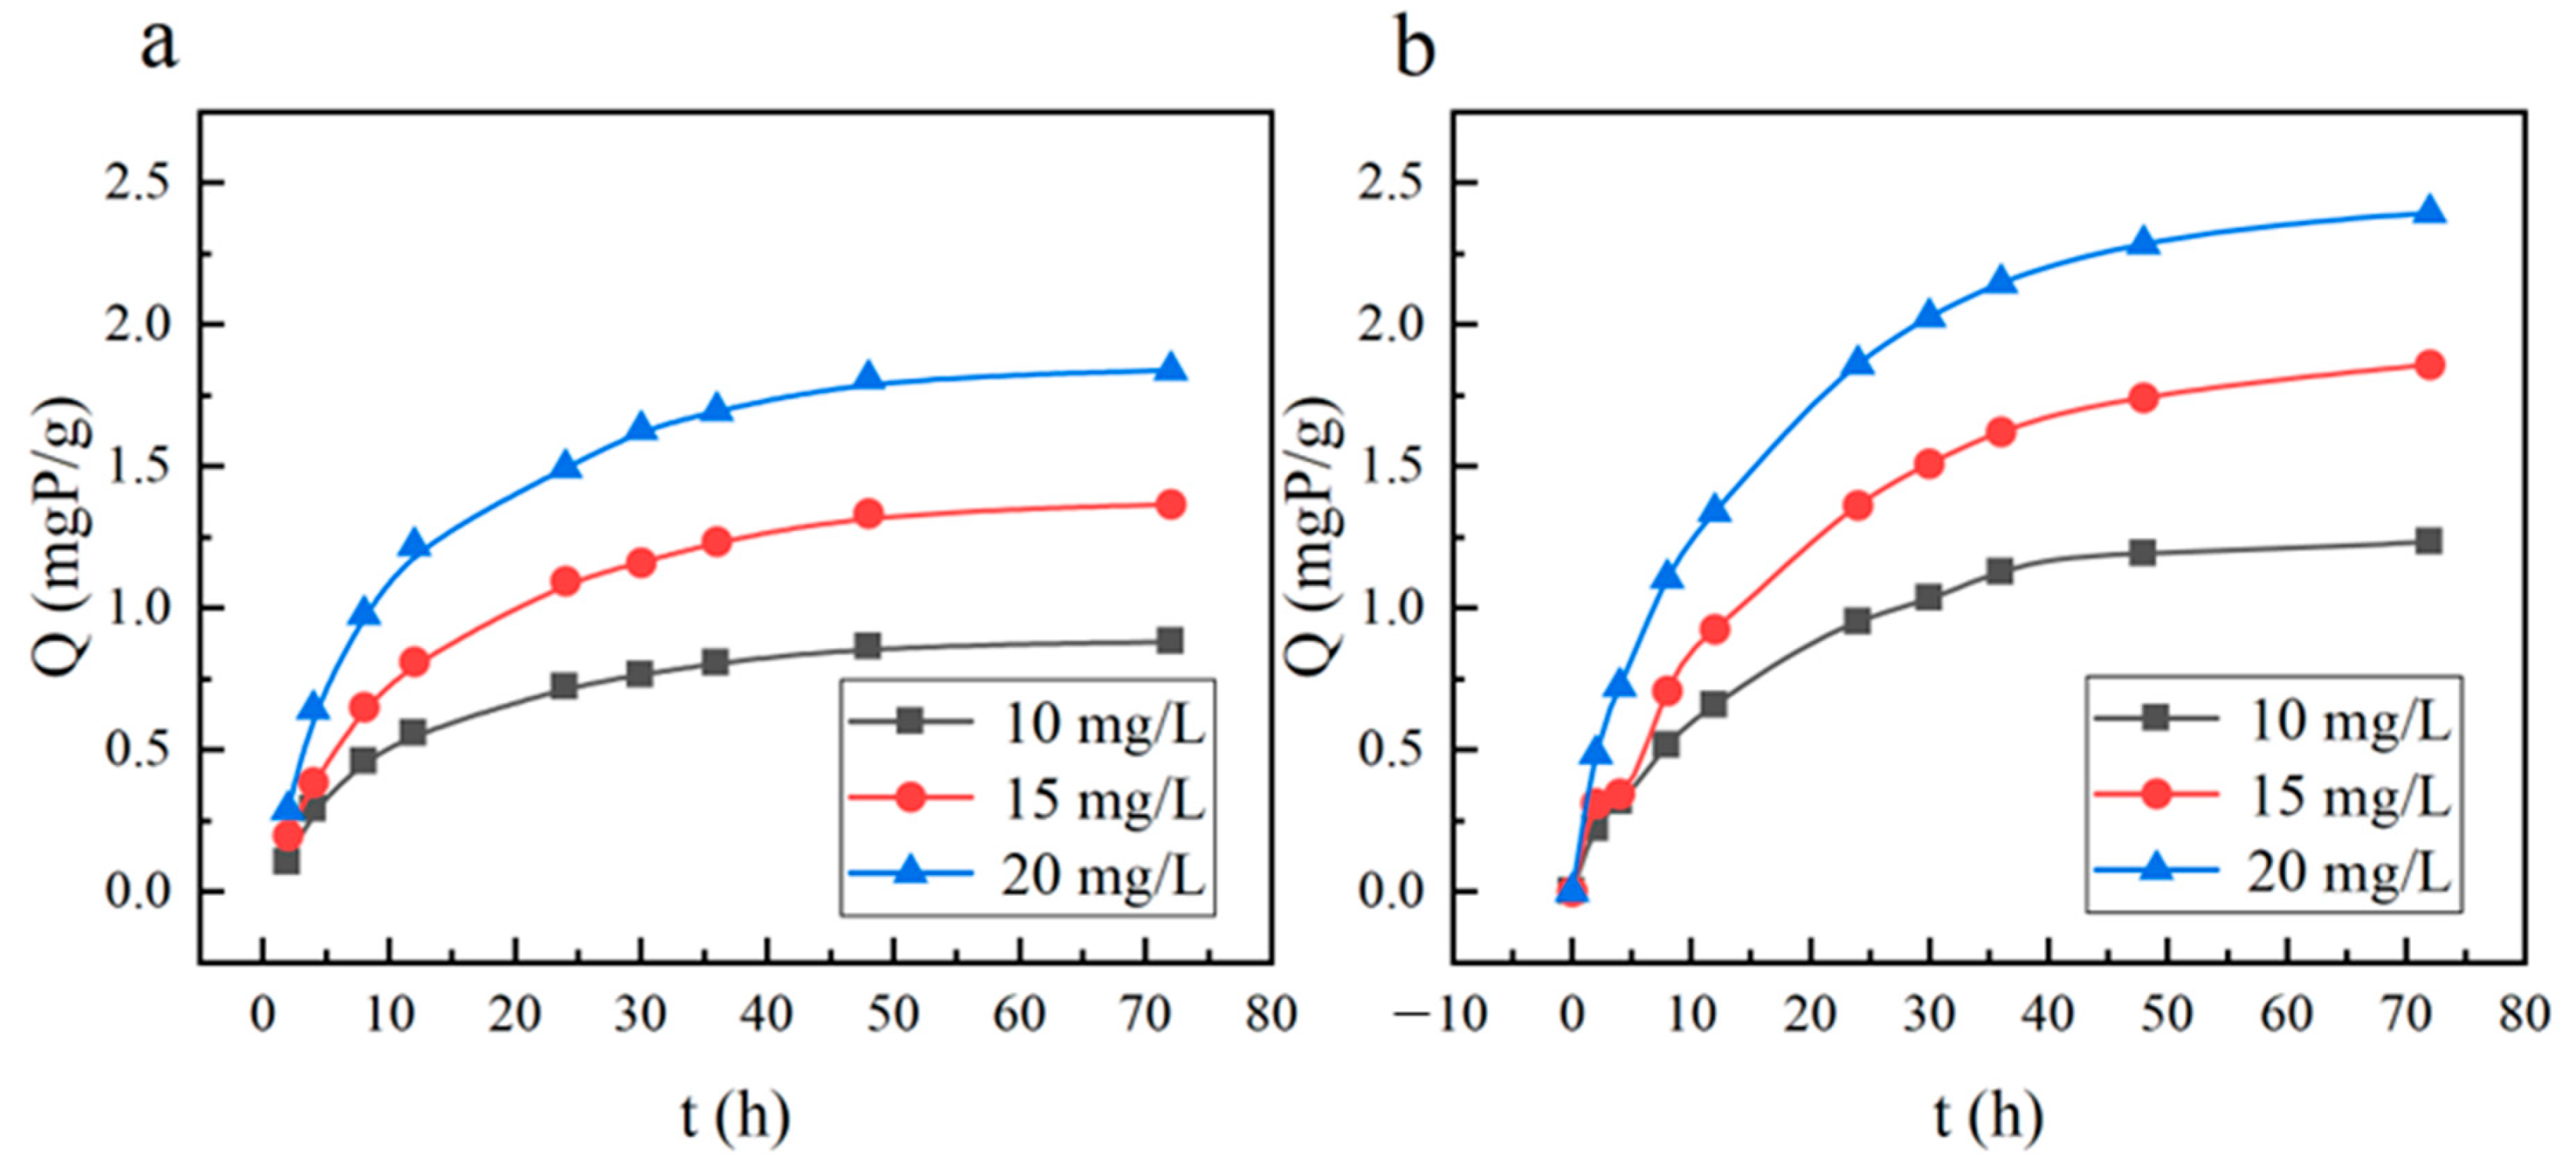
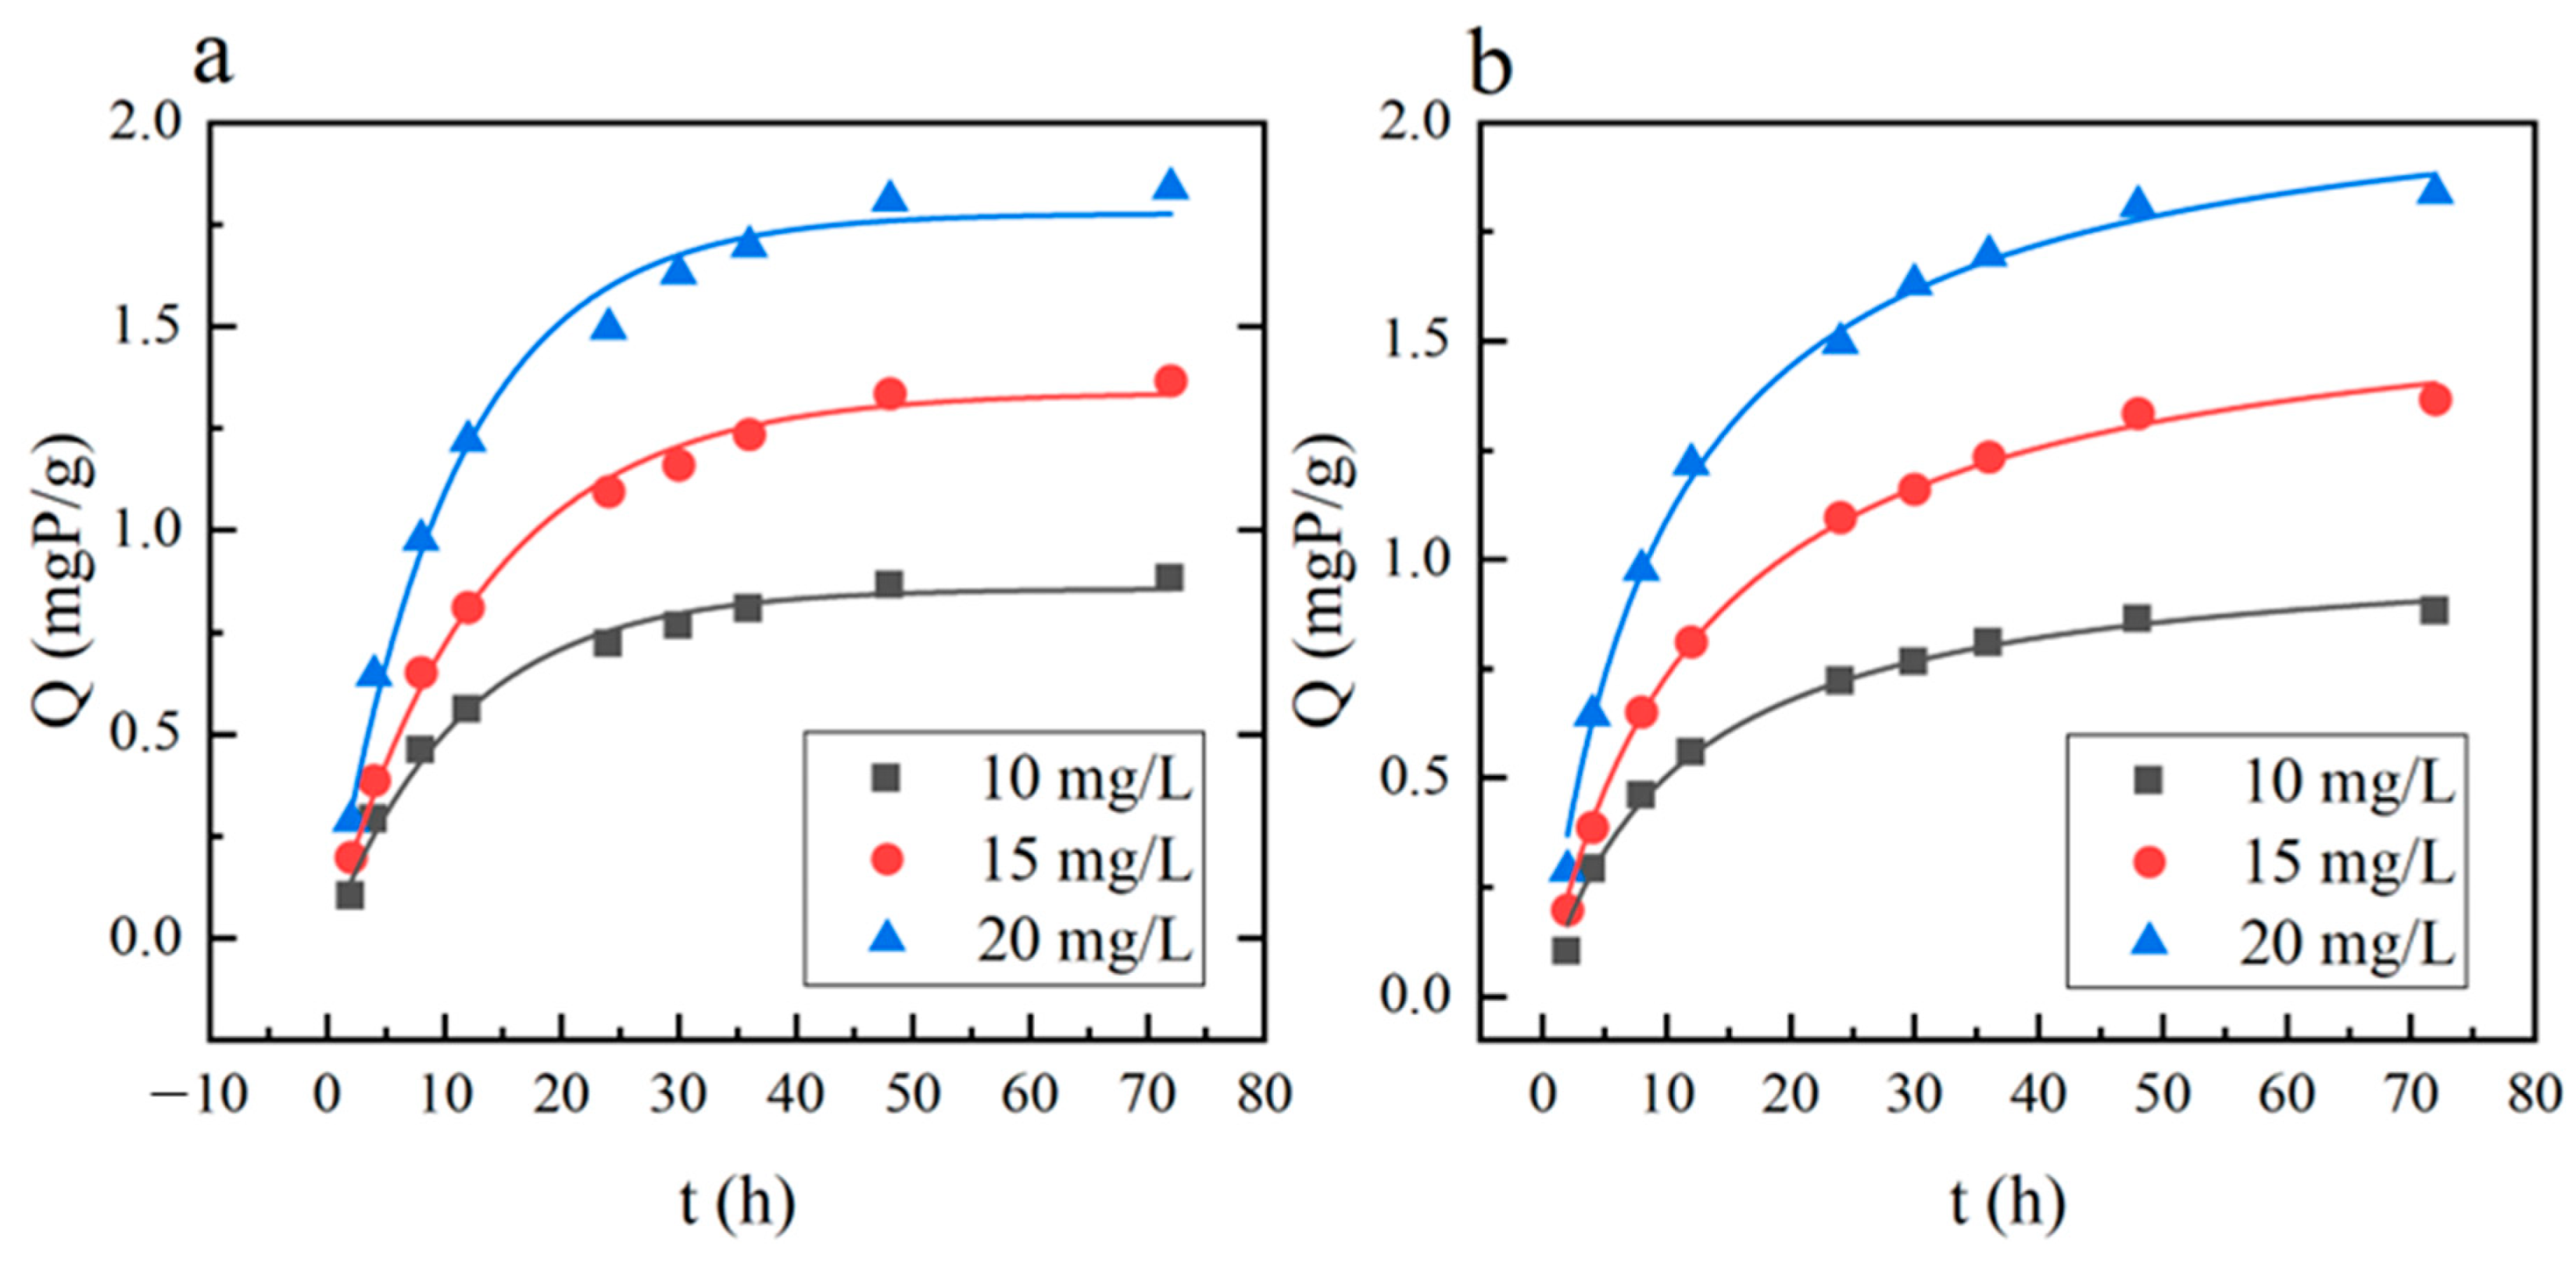
The adsorption kinetics curves at various temperatures are illustrated in Figure 10. The results of the PFO and PSO kinetic fits can be observed in Figure 11 and Figure 12, as well as in Table 6.
From the fitting results depicted in Figure 11 and Figure 12 and Table 6, it is evident that the elevation in temperature enhances the correlation of both kinetic models, with PFO and PSO kinetic fits at 35 °C closely resembling each other. This suggests a complex adsorption process involving both physical and chemical mechanisms for La-EPRC particles. Overall, the PFO adsorption kinetic model appears more suitable for elucidating the phosphate removal adsorption process by La-EPRC particles. Moreover, the qe value for the initial phosphate concentration of 20 mg/L is greater than that for 10 mg P/L, indicating increased adsorption efficiency with higher initial phosphorus solution concentrations.

3.2.3. Effect of Adsorbent Dosage on Phosphorus Removal

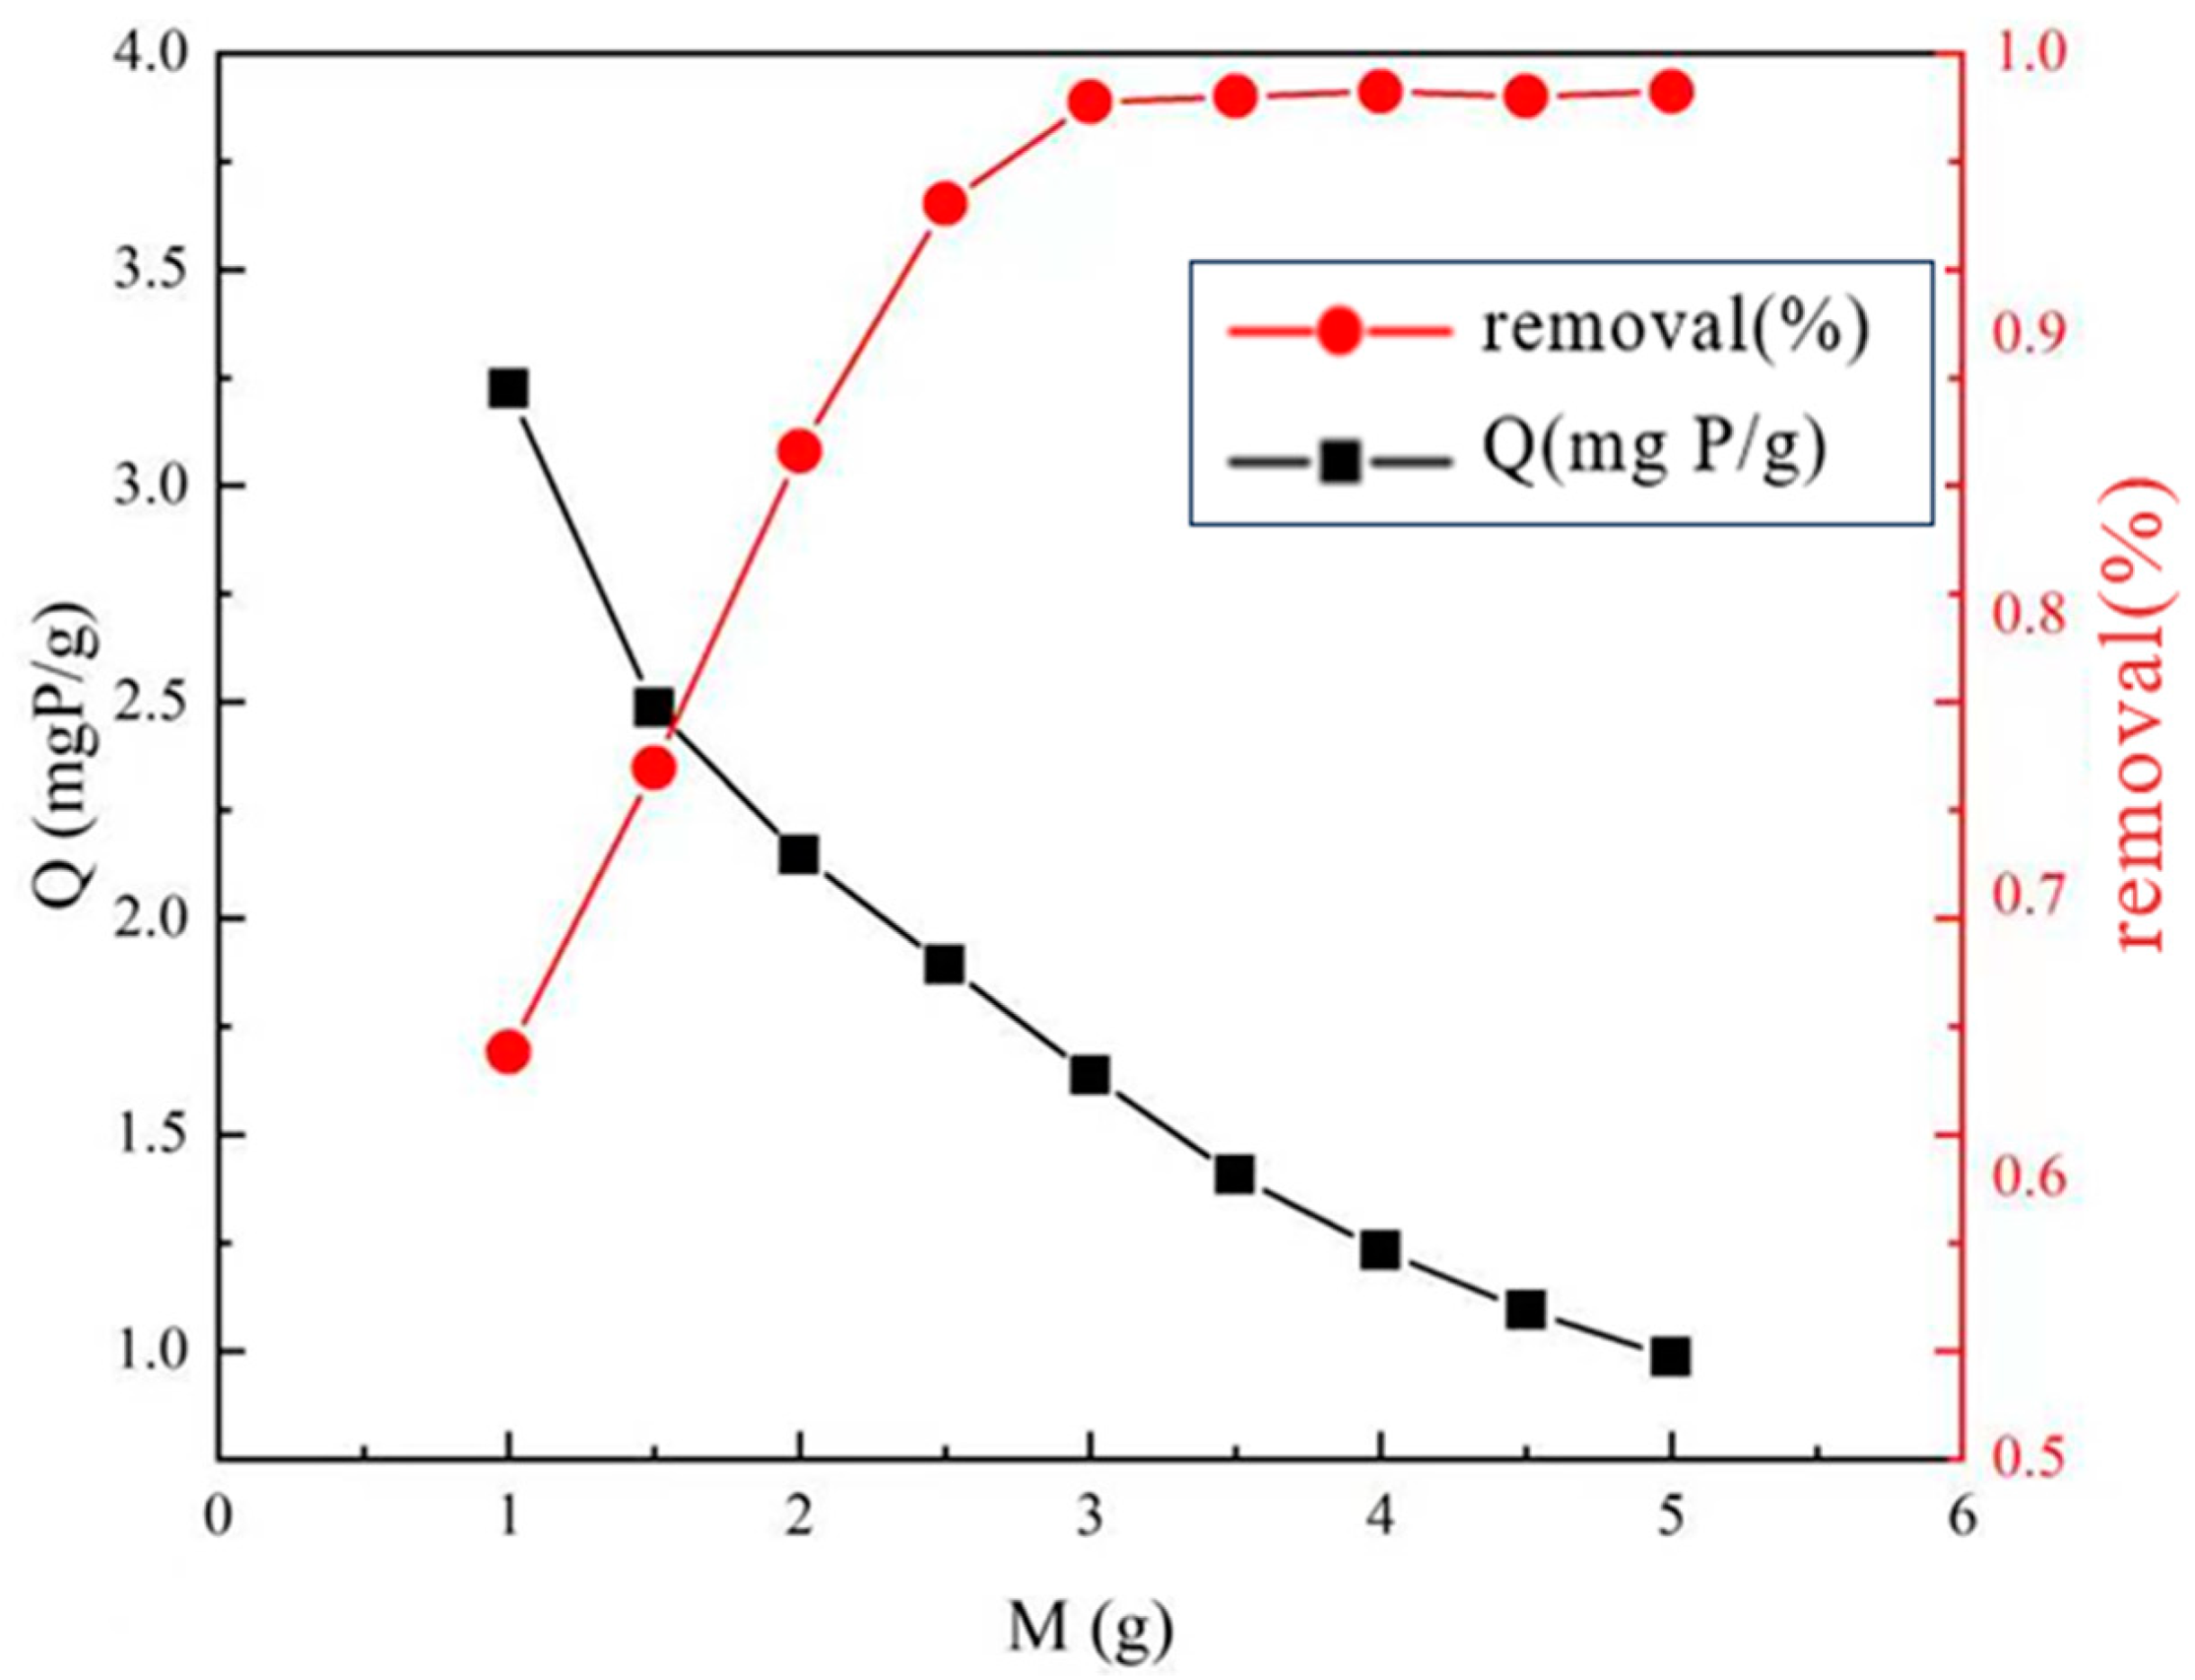
Figure 13 illustrates that the unit adsorption capacity of the adsorbent gradually decreases with increasing La-EPRC dosage. This is primarily due to the heightened adsorbent dosage resulting in an increase in adsorption sites, while the phosphorus concentration in the solution remains constant, leading to a reduction in phosphorus adsorption per unit mass of La-EPRC particles. Conversely, the adsorption removal rate increases with higher adsorbent dosage. For instance, at a La-EPRC dosage of 3 g, the highest removal rate surpasses 98%, and further dosage increases show minimal impact on the removal rate. This is indicative of near-complete removal of phosphorus from the solution at this point.

3.2.4. Effect of Solution pH on Adsorption Effect

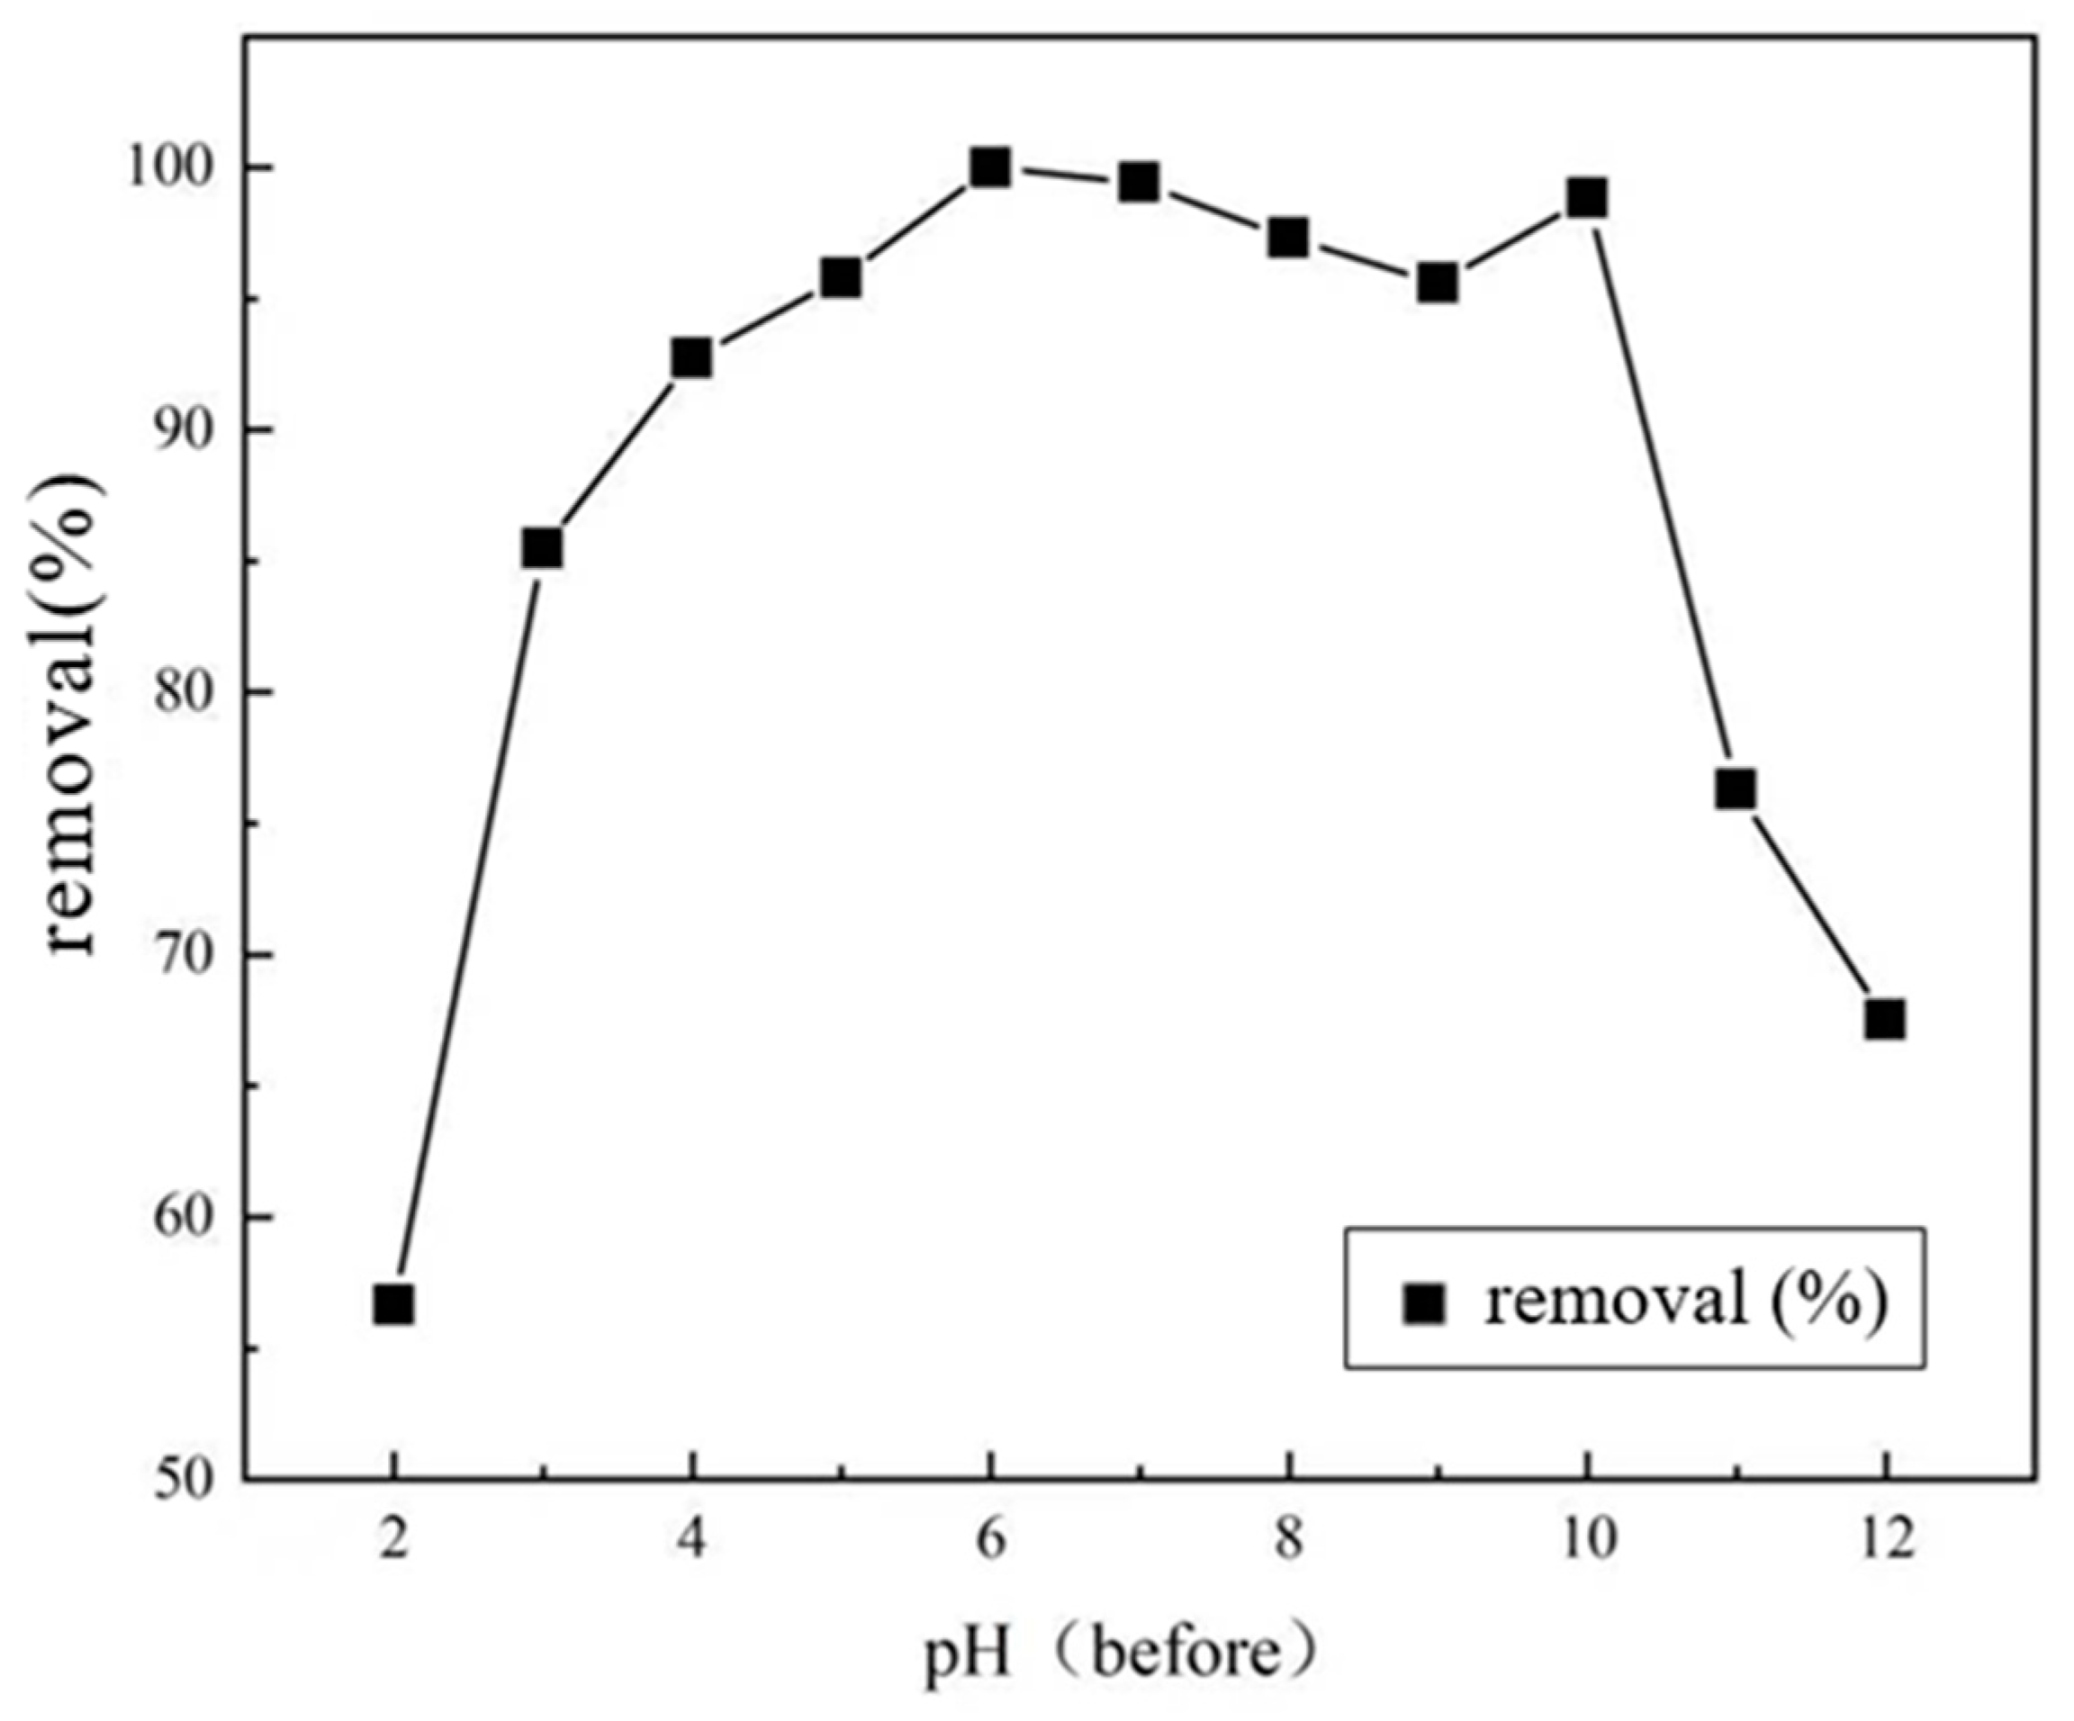
The correlation between the initial pH of the solution and removal efficiency is graphically represented in Figure 14. Upon observation of the figures, it becomes evident that the removal efficiency of phosphorus by La-EPRC particles exhibits a pattern of initially increasing, reaching a peak at pH = 6, and a subsequent decline. Specifically, within the pH range of 4 to 10, the removal rate of phosphorus by the adsorbent exceeds 90%, underscoring the optimal effectiveness of phosphorus adsorption by La-EPRC particles in weakly acidic, neutral, and weakly alkaline aqueous environments. Notably, phosphorus removal rate demonstrates relative resilience to changes in solution acidity and alkalinity within this range.
In weakly acidic and neutral water environments, the predominant phosphate form is H 2 PO 4 , known for its robust affinity with La3+. Consequently, phosphorus removal efficiency is notably high. In weakly alkaline water conditions (pH = 10), the binding between La3+ and phosphate weakens, leading to the formation of calcium phosphate through the reaction between Ca2+ on the adsorbent’s surface and OH , ultimately resulting in removal in the form of hydroxyapatite crystals. The efficacy of this reaction is maximized at pH = 10.
At pH values below 4, phosphate removal efficiency diminishes noticeably due to the prevalence of H 3 PO 4 , which lacks effective binding with La3+ and exhibits low adsorption capacity. In extremely acidic conditions (pH = 2), surface material detachment occurs, resulting in slight turbidity in the solution. La3+ may also desorb during this process, leading to a compromised final phosphorus removal effect.
Conversely, at pH values exceeding 10, a significant decline in material adsorption efficiency is observed. This is attributed to the elevated concentration of OH , leading to competition with phosphate adsorption. The high concentration of OH in the solution hinders phosphate adsorption, as the binding affinity of phosphate dominated by H PO 4 with the material’s surface is weaker than that of H 2 PO 4 . Additionally, Ca2+ on the material’s surface is completely bound, further diminishing adsorption effectiveness.

3.2.5. Influence of Coexisting Anions on the Effectiveness of Phosphorus Removal

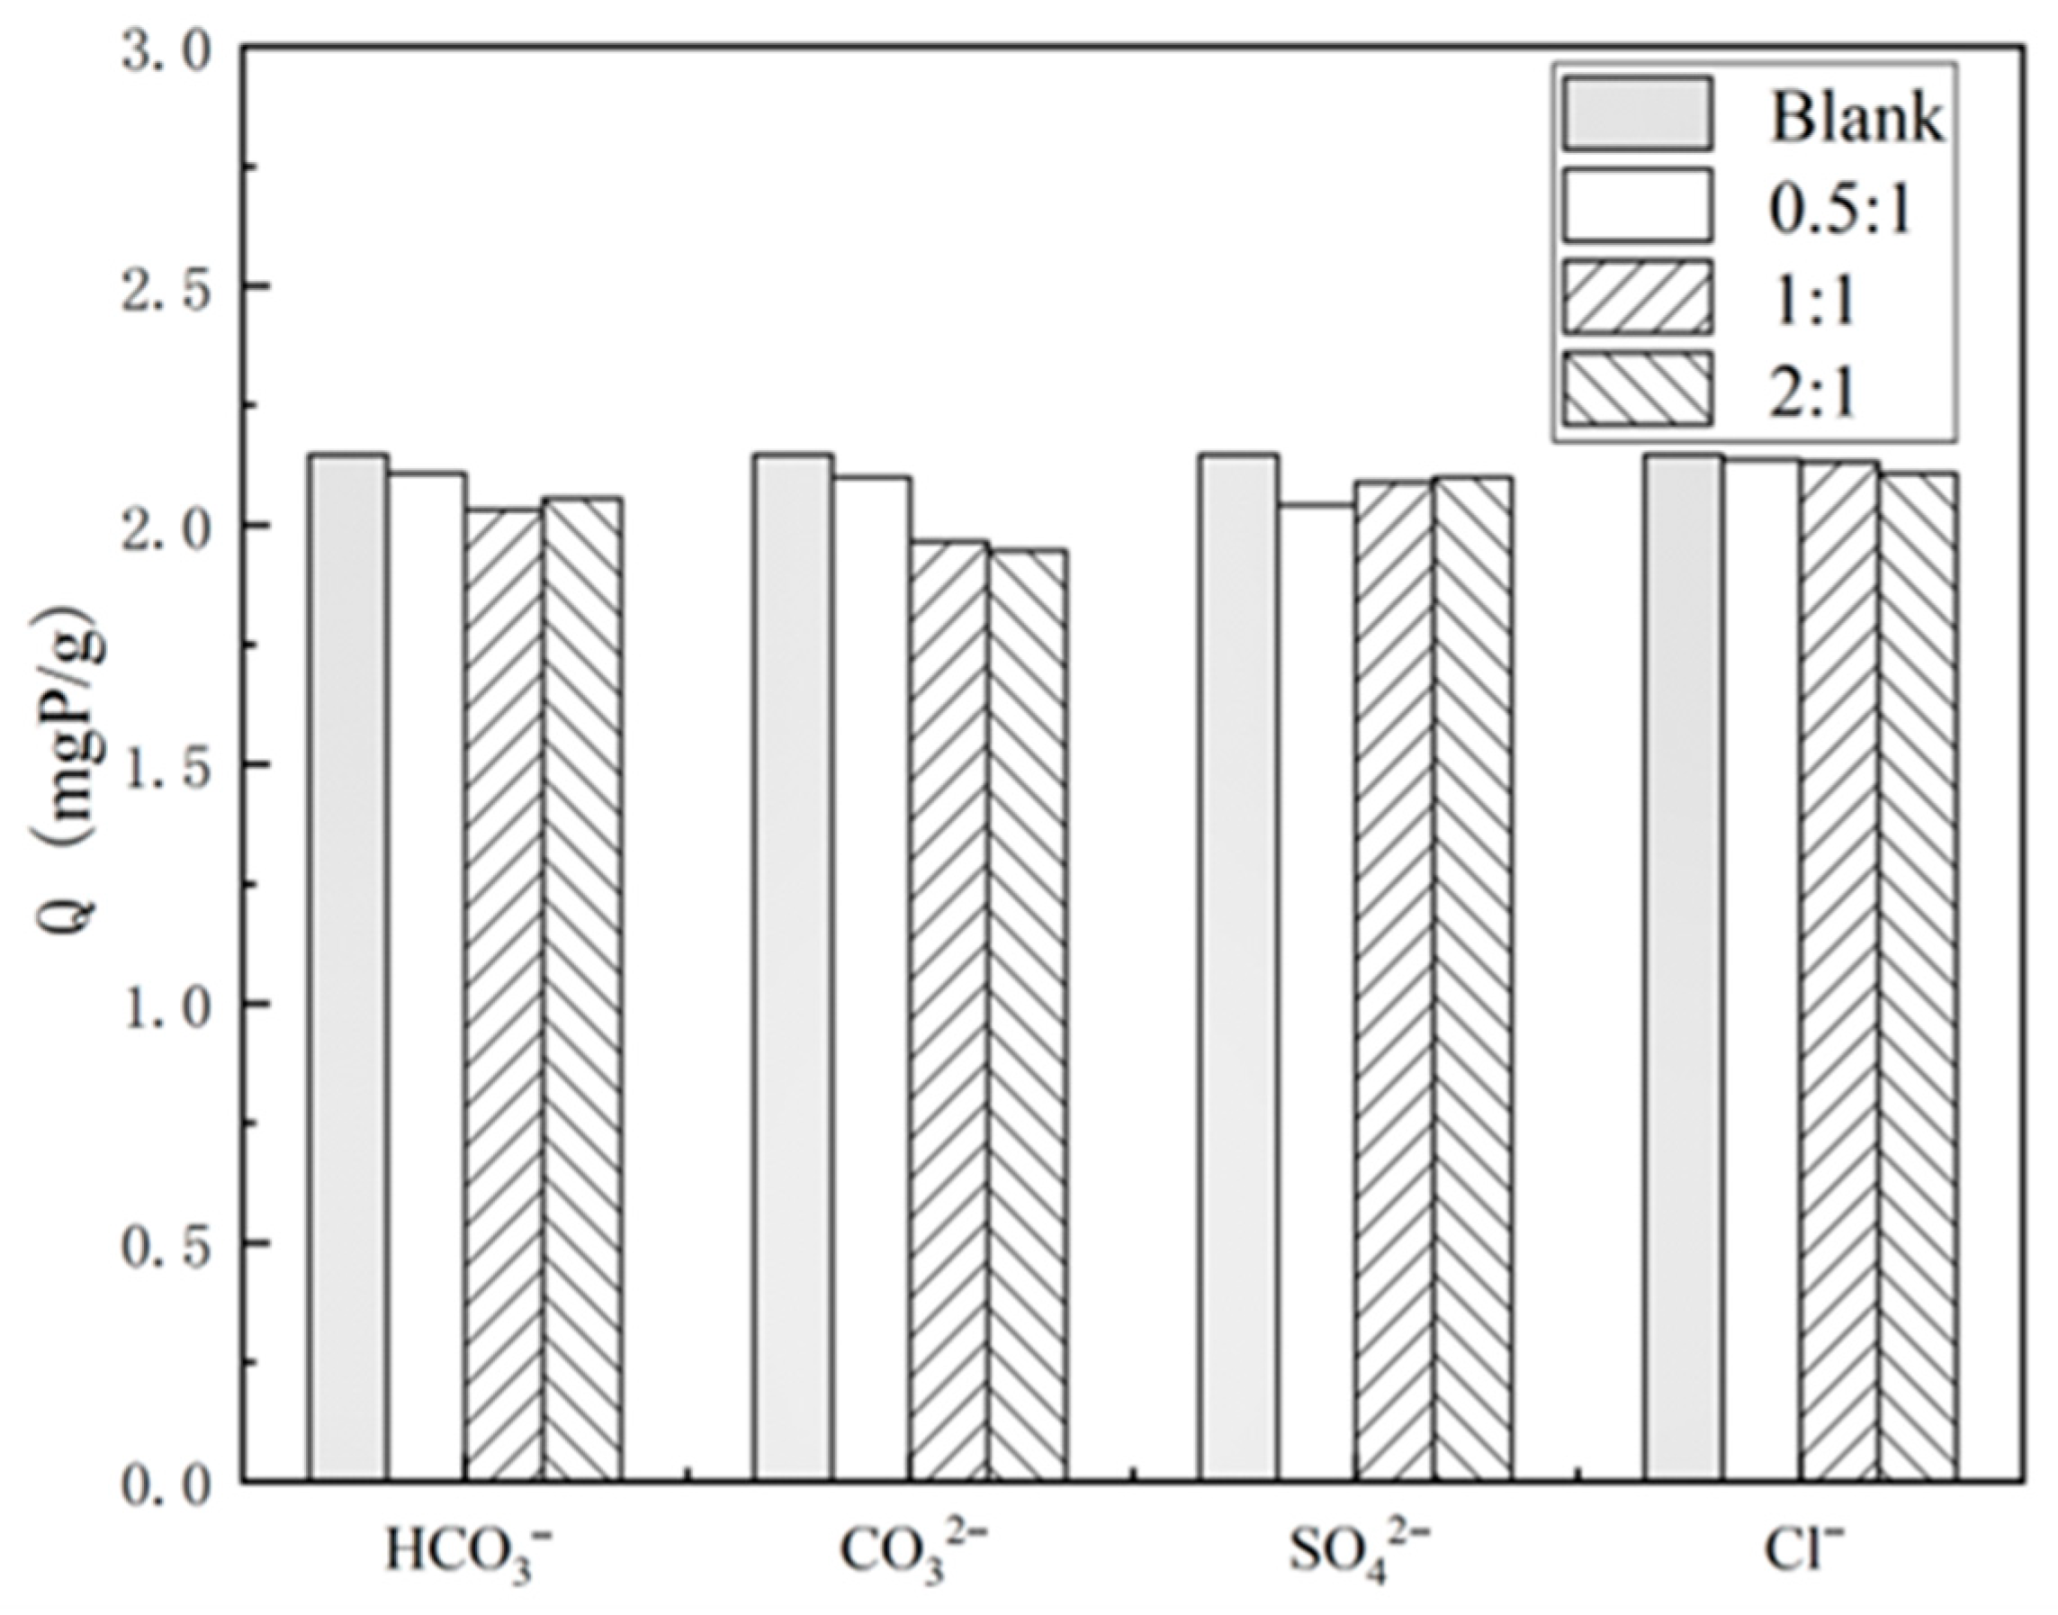
As depicted in the relationship diagram (Figure 15), the influence of several coexisting anions on the adsorption capacity of La-EPRC particles appears negligible. The presence of C l , SO42−, and HCO 3 has almost no discernible effect on phosphorus adsorption. Among them, C l exhibited the lowest impact, resulting in a marginal decrease of 1.77% in the adsorption capacity of La-EPRC particles when present at a molar concentration ratio of 2:1 with elemental phosphorus compared to the blank group without other anions, yielding a value of 2.108 mg P/g. Similarly, the presence of SO42− and HCO 3 reduced the adsorption capacity of La-EPRC particles by 4.89% and 5.34%, respectively, compared to the blank group. The most notable impact on the adsorption efficacy of La-EPRC was observed with CO32−, where the adsorption capacity decreased by 9.34% to 1.945 mg P/g at a molar concentration ratio of CO32− to elemental phosphorus of 2:1. This decline is attributed to the lower KSP value of La2(CO3)3 (3.98 × 10⁻³⁴) compared to that of LaPO4 (3.7 × 10⁻²³), favoring the formation of La2(CO3)3 [23]. The coexisting anions, particularly CO32−, exhibited greater favorability for the formation of La2(CO3)3.
The reduction in phosphate adsorption by La-EPRC particles in the presence of coexisting anions can be mainly attributed to competition from other oxygenated anions [24]. The results indicate that the impact of competition on adsorption is limited, and La-EPRC demonstrates a selective adsorption capacity for phosphate.

3.3. Safety Analysis and Regeneration Study of La-EPRC Particles

3.3.1. Desorption Experiments

  • Desorption in Water at Room Temperature
As evident from the data in Table 7, the desorption amount increases with the rise in adsorption amount, maintaining a relatively small range (<0.6%). This indicates that La-EPRC particles exhibit minimal desorption in clear water at room temperature, posing a low risk of secondary pollution in water bodies. The firm adsorption of phosphate by this adsorbent is attributed to the reaction between lanthanum ions and other metal ions in the substrate with phosphate, resulting in the formation of phosphate precipitates with low solubility. These precipitates are generally resistant to dissolution in clear water, leading to a low desorption rate of the material.
2.
Desorption in Hot Water at High Temperature
As evident from the data in Table 8, the desorption trends of La-EPRC particles in high-temperature hot water align with those observed in clear water. However, with the rise in desorption solution temperature, a slight increase in the material desorption amount is noted. This may be attributed to elevated temperature causing the partial solubilization of phosphate precipitation, leading to a marginal increase in material desorption. Nevertheless, the overall desorption rate of the adsorbent remains below 0.7%, emphasizing the high stability of the adsorbent particles and affirming their safe utilization.
3.
Desorption in Sulfuric Acid Solution
The desorption of La-EPRC particles in a sulfuric acid solution is detailed in Table 9. In comparison to material desorption in clear water and high-temperature hot water, there is a substantial increase in material desorption in the sulfuric acid solution. The desorption rate of the material experiences a significant enhancement with the escalation of sulfuric acid concentration, exceeding 60% in certain instances. The continuous shedding of the surface material of the particles is observed with increasing sulfuric acid concentration, and the particles essentially disintegrate at a sulfuric acid concentration of 10 mol/L, resulting in high turbidity in the solution.
The predominant factor contributing to heightened material desorption is likely the reaction of sulfate ions with phosphate precipitates. This reaction leads to the conversion of the precipitates into sulfate precipitates, resulting in the dissolution of phosphates. In practical engineering applications, a low-concentration sulfuric acid solution can be employed to facilitate the regeneration of La-EPRC particles, allowing for the recovery of phosphorus elements and the sustainable reuse of resources.

3.3.2. Adsorbent Regeneration Experiment

  • Effect of NaOH Concentration on The Regeneration Effect of Adsorbent
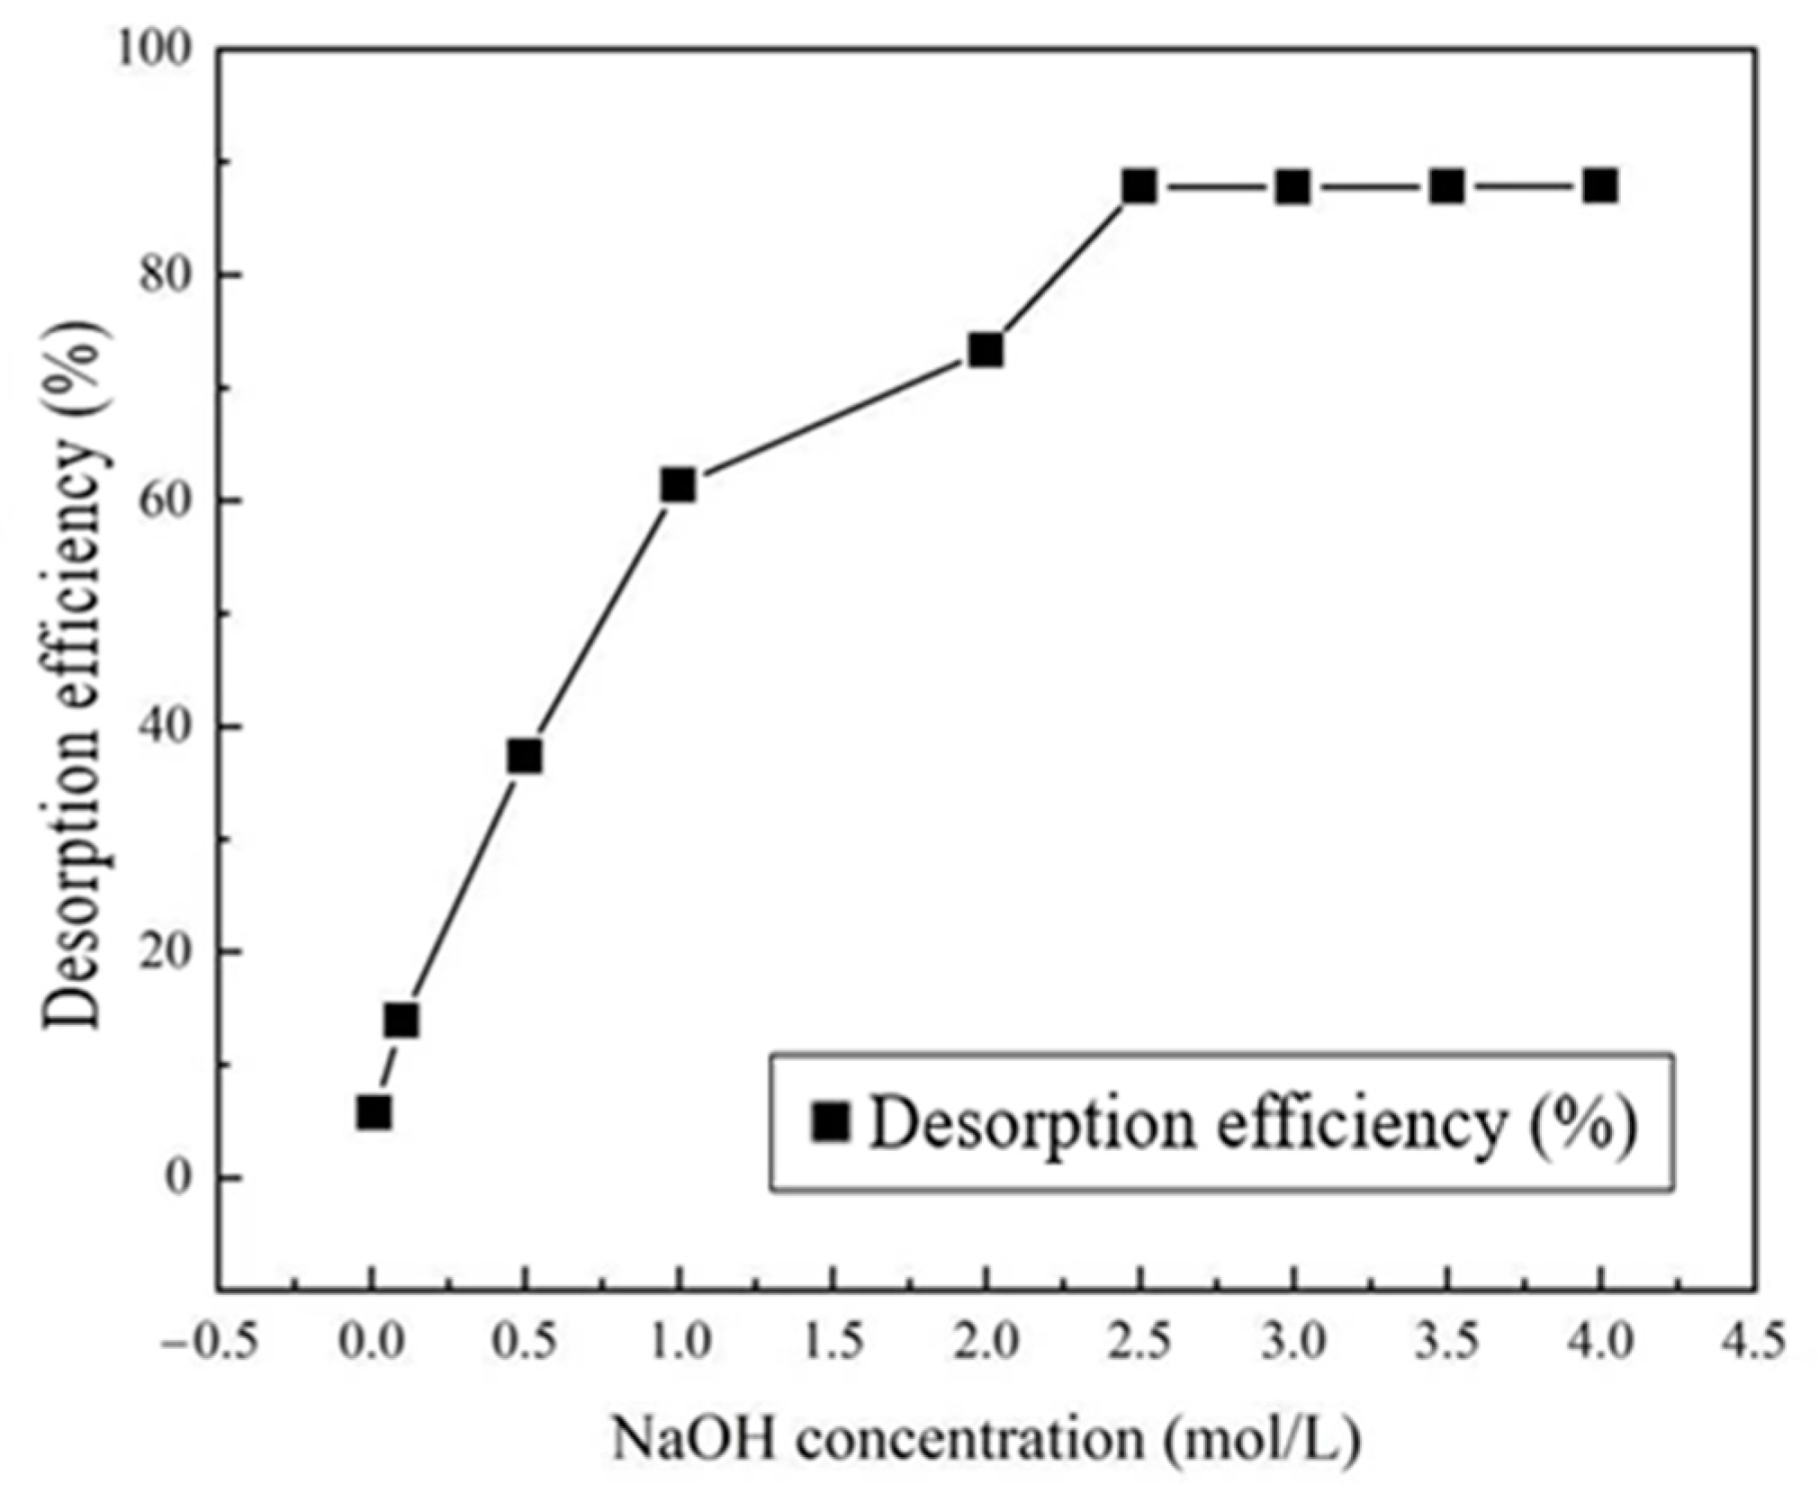
Figure 16 illustrates the experimental outcomes regarding the impact of varying NaOH concentrations on the desorption rate of the adsorbent. Analyzing the relationship curve between NaOH concentration and phosphate desorption rate reveals that, at low NaOH concentrations, the phosphate desorption rate increases with rising NaOH concentration. Phosphate desorption rate essentially peaks when NaOH concentration reaches 2.5 mol/L, approximately at 87.82%. Subsequent increases in NaOH concentration do not substantially alter the phosphate desorption rate, maintaining a state of desorption saturation. Therefore, for regenerating the adsorbent, a 2.5 mol/L NaOH solution is recommended as the desorption concentration. Subsequent analyses will focus on assessing the impact of desorption time on the regeneration effectiveness of the adsorbent.
2.
Effect of Desorption Time on Regeneration of Adsorbent
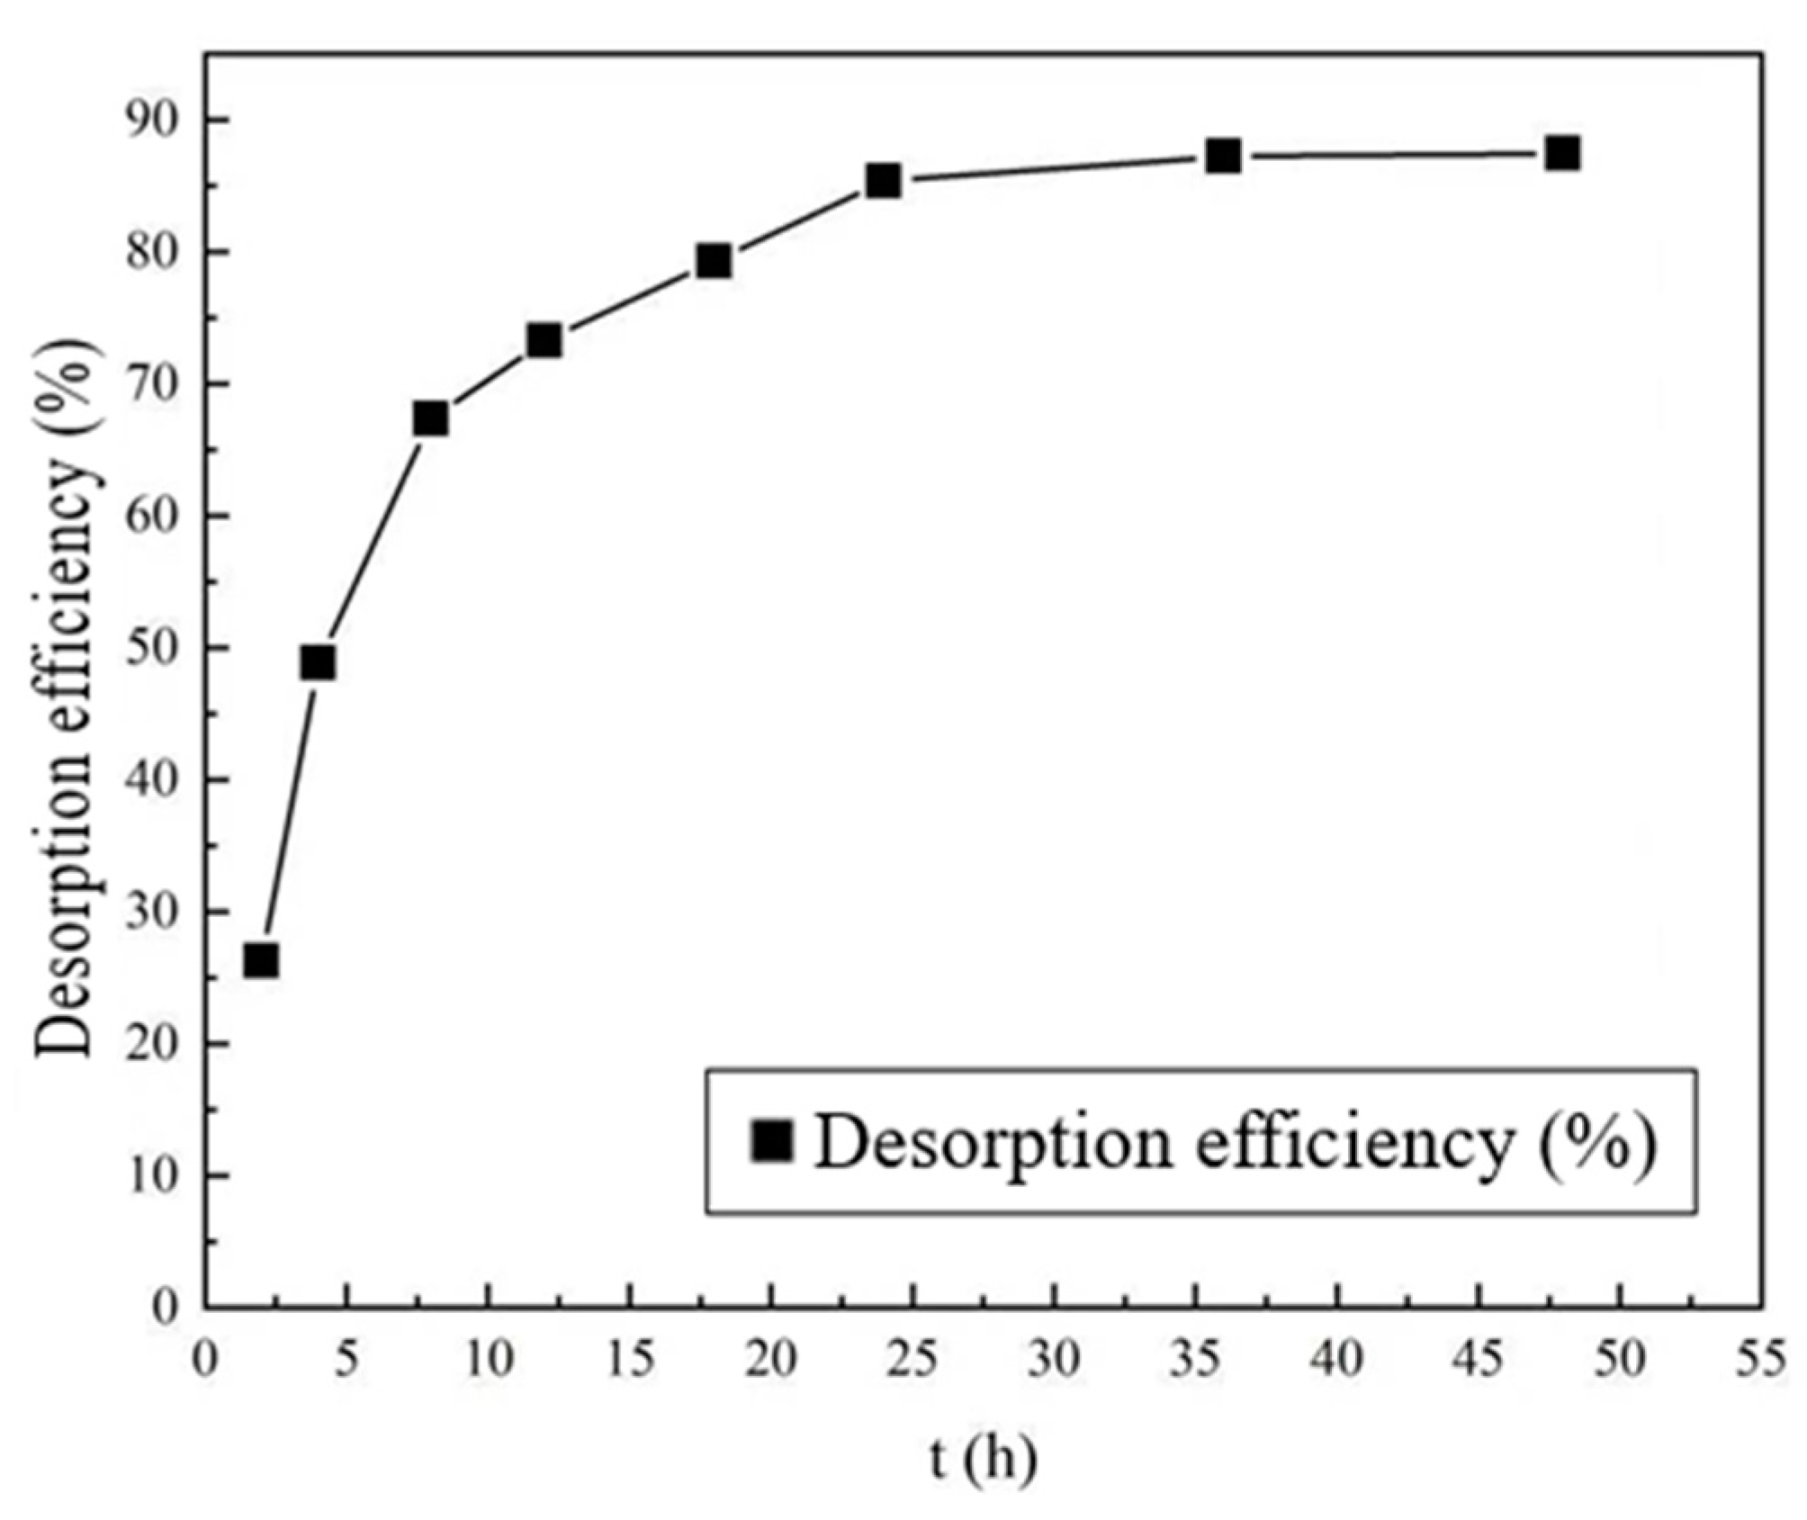
Examining the desorption time versus desorption rate curves in Figure 17, it is evident that the desorption rate of La-EPRC particles experiences a rapid initial increase, reaching 67.34% within 8 h. Subsequently, the rate of increase diminishes in the later stages of desorption, stabilizing around 24 h, where the desorption rate reaches approximately 85.38%. At 48 h, the desorption rate further stabilizes at about 87.5%. Considering the potential impact of prolonged impregnation of La-EPRC particles in a strong alkali solution on the material’s mechanical properties, the optimal desorption time for La-EPRC particles is determined to be 24 h.
3.
Three successive adsorption–desorption experiments
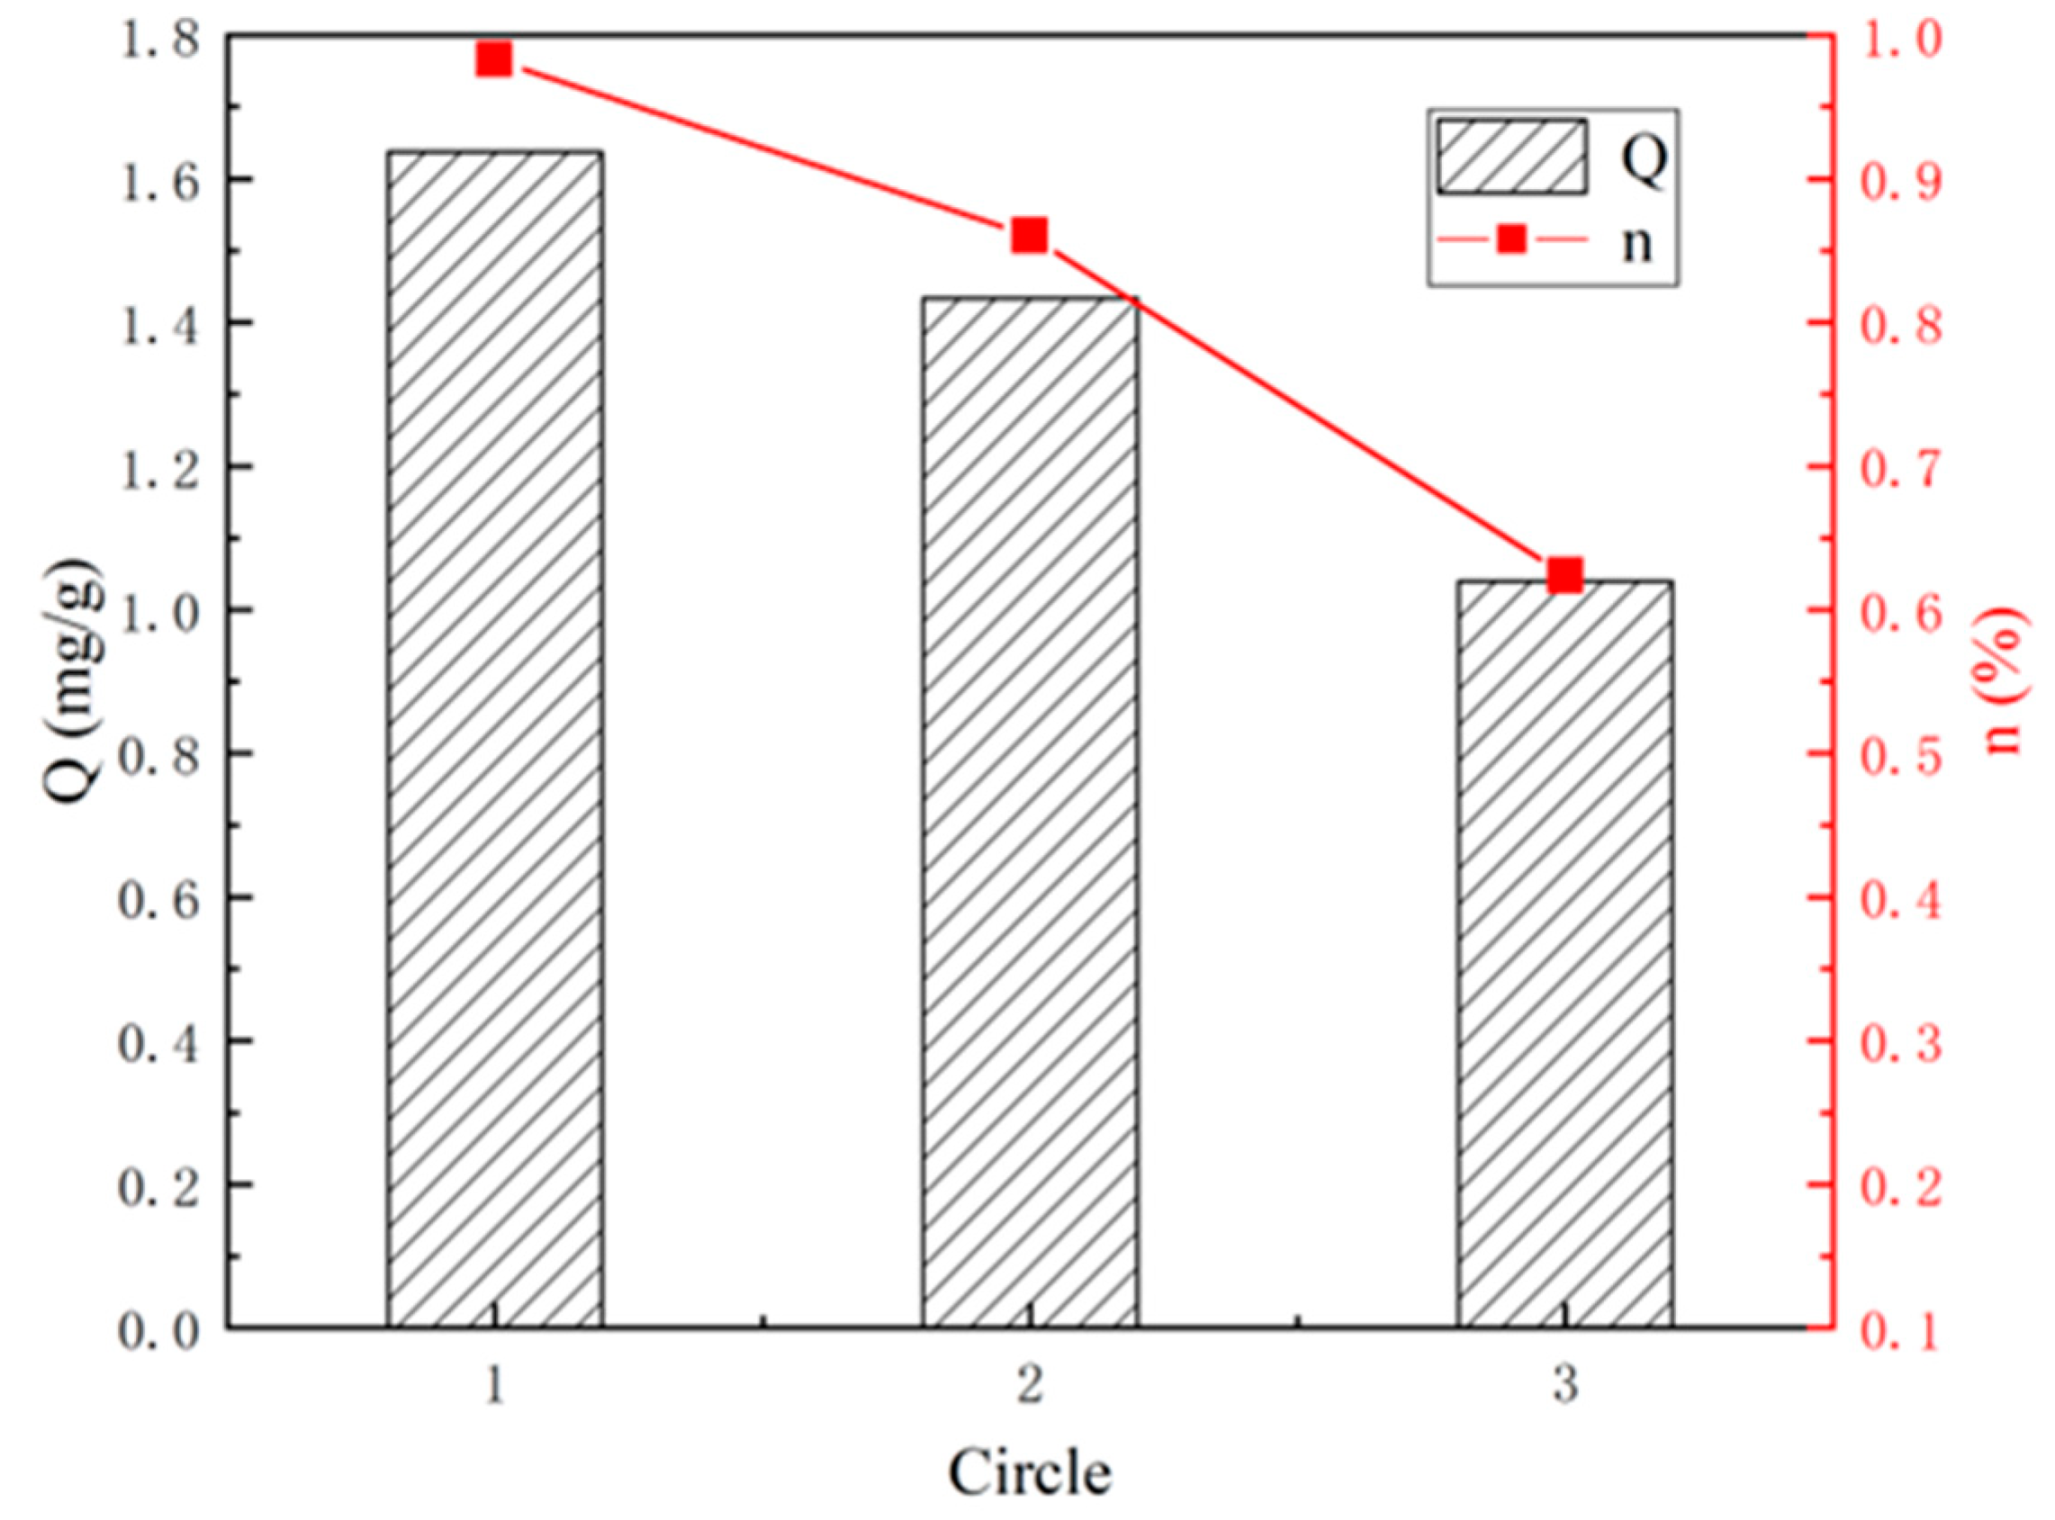
The outcomes from the three adsorption–desorption cycles of La-EPRC particles are illustrated in Figure 18. As the number of adsorption–desorption cycles increases, the adsorption capacity of La-EPRC particles gradually diminishes. Although the phosphate removal rate in the second adsorption cycle still exceeds 85%, it decreases to 62.37% in the third adsorption cycle after desorption. This decline could be attributed to incomplete desorption in the adsorption process, where certain binding sites remain occupied. Additionally, the impregnation of the adsorbent in the desorption solution contributes to its own loss, resulting in a reduction in adsorption capacity and phosphorus removal. The findings indicate that the regenerative properties of La-EPRC particles are effective for only a limited number of cycles, allowing for approximately two reuses.

4. Conclusions

Optimization experiments determined that lanthanum-modified steel slag and fly ash achieved optimal mass ratios of 0.4 and 0.3, respectively, with a 12 h impregnation time using lanthanum nitrate hexahydrate solution. Adjusting the system’s pH to 10 post impregnation enhanced lanthanum fixation in a 1 h reaction. La-EPRC particles, formulated with La-FA, La-SS, and binder in a 12:2:1.5 ratio, showed feasibility.
Static adsorption experiments revealed a Langmuir model fit, achieving a maximum saturated adsorption capacity of 20.395 mg P/g. Pseudo-second-order kinetic modeling indicated chemical adsorption as the primary rate-limiting factor, exhibiting a spontaneous endothermic reaction.
Investigation into solution pH, adsorbent dosage, and coexisting anions showed an efficiency exceeding 90% within the pH range of 4 to 10. La-EPRC particles were effective in weakly acidic, neutral, and weakly alkaline environments, with minimal influence of solution acidity and alkalinity. At 25 °C and an initial phosphorus concentration of 20 mg P/L, optimal particle dosage was 3 g/250 mL, achieving the highest adsorption rate. Common anions exhibited negligible effects, indicating selective adsorption of phosphate.
Desorption experiments revealed greater stability in water at room temperature and 80 °C, with lower desorption rates. In a sulfuric acid solution, desorption amounts were higher, suggesting susceptibility to mechanical damage. For elemental phosphorus recovery, a low-concentration sulfuric acid solution can be used, enabling material reuse for secondary purposes.
In regeneration experiments, optimal regeneration used a 2.5 mol/L NaOH solution with a 24 h desorption time. However, an improved reusability of La-EPRC particles is still necessary based on findings from the three adsorption–desorption experiments.

Author Contributions

Conceptualization, Y.L.; methodology, Y.L. and L.Z.; software, Y.L. and L.Z.; validation, Y.L. and L.Z.; formal analysis, L.Z.; investigation, L.Z.; resources, Y.L.; data curation, L.Z.; writing—original draft preparation, L.Z.; writing—review and editing, Y.L. and L.Z.; visualization, Y.L. and L.Z.; supervision, Y.L.; project administration, Y.L. All authors have read and agreed to the published version of the manuscript.

Funding

This research received no external funding.

Institutional Review Board Statement

Not applicable.

Informed Consent Statement

Informed consent was obtained from all subjects involved in the study.

Data Availability Statement

Data are contained within the article.

Acknowledgments

The authors express sincere gratitude to those who contributed to this manuscript. Special thanks to our mentor for invaluable guidance and collaborative efforts.

Conflicts of Interest

The authors declare no conflict of interest.

References

  1. Daneshgar, S.; Callegari, A.; Capodaglio, A.G.; Vaccari, D. The Potential Phosphorus Crisis: Resource Conservation and Possible Escape Technologies: A Review. Resources 2018, 7, 37. [Google Scholar] [CrossRef]
  2. Childers, D.L.; Corman, J.; Edwards, M.; Elser, J.J. Sustainability Challenges of Phosphorus and Food: Solutions from Closing the Human Phosphorus Cycle. Bioscience 2011, 61, 117–124. [Google Scholar] [CrossRef]
  3. Benammar, L.; Menasria, T.; Ayachi, A.; Benounis, M. Phosphate removal using aerobic bacterial consortium and pure cultures isolated from activated sludge. Process Saf. Environ. Prot. 2015, 95, 237–246. [Google Scholar] [CrossRef]
  4. Luo, D.C.; Yuan, L.J.; Liu, L.; Wang, Y.; Fan, W.W. The mechanism of biological phosphorus removal under anoxic-aerobic alternation condition with starch as sole carbon source and its biochemical pathway. Biochem. Eng. J. 2018, 132, 90–99. [Google Scholar] [CrossRef]
  5. Li, Y.J.; He, X.M.; Hu, H.M.; Zhang, T.T.; Qu, J.; Zhang, Q.W. Enhanced phosphate removal from wastewater by using in situ generated fresh trivalent Fe composition through the interaction of Fe(II) on CaCO3. J. Environ. Manag. 2018, 221, 38–44. [Google Scholar] [CrossRef] [PubMed]
  6. Wu, B.L.; Wan, J.; Zhang, Y.Y.; Pan, B.C.; Lo, I.M.C. Selective Phosphate Removal from Water and Wastewater using Sorption: Process Fundamentals and Removal Mechanisms. Environ. Sci. Technol. 2020, 54, 50–66. [Google Scholar] [CrossRef] [PubMed]
  7. Gao, Q.; Wang, C.Z.; Liu, S.; Hanigan, D.; Liu, S.T.; Zhao, H.Z. Ultrafiltration membrane microreactor (MMR) for simultaneous removal of nitrate and phosphate from water. Chem. Eng. J. 2019, 355, 238–246. [Google Scholar] [CrossRef]
  8. Yang, M.G.; Shi, J.; Xu, Z.W.; Zhu, S.Y.; Cui, Y.X. Phosphorus removal and recovery from fosfomycin pharmaceutical wastewater by the induced crystallization process. J. Environ. Manag. 2019, 231, 207–212. [Google Scholar] [CrossRef]
  9. Nielsen, L.; Bandosz, T.J. Analysis of sulfamethoxazole and trimethoprim adsorption on sewage sludge and fish waste derived adsorbents. Microporous Mesoporous Mater. 2016, 220, 58–72. [Google Scholar] [CrossRef]
  10. Purbasari, A.; Ariyanti, D.; Fitriani, E. Adsorption of anionic and cationic dyes from aqueous solutions on fly ash-based porous geopolymer. Glob. Nest J. 2023, 25, 146–152. [Google Scholar] [CrossRef]
  11. Loganathan, P.; Vigneswaran, S.; Kandasamy, J.; Bolan, N.S. Removal and Recovery of Phosphate From Water Using Sorption. Crit. Rev. Environ. Sci. Technol. 2014, 44, 847–907. [Google Scholar] [CrossRef]
  12. Copetti, D.; Finsterle, K.; Marziali, L.; Stefani, F.; Tartari, G.; Douglas, G.; Reitzel, K.; Spears, B.M.; Winfield, I.J.; Crosa, G.; et al. Eutrophication management in surface waters using lanthanum modified bentonite: A review. Water Res. 2016, 97, 162–174. [Google Scholar] [CrossRef]
  13. Capasso, I.; Iucolano, F. Production of lightweight gypsum using a vegetal protein as foaming agent. Mater. Struct. 2020, 53, 35. [Google Scholar] [CrossRef]
  14. Zhang, B.A.Q.; Chen, N.; Feng, C.P.; Zhang, Z.Y. Adsorption for phosphate by crosslinked/non-crosslinked-chitosan-Fe(III) complex sorbents: Characteristic and mechanism. Chem. Eng. J. 2018, 353, 361–372. [Google Scholar] [CrossRef]
  15. Hu, Q.L.; Lan, R.; He, L.R.; Liu, H.Y.; Pei, X.J. A critical review of adsorption isotherm models for aqueous contaminants: Curve characteristics, site energy distribution and common controversies. J. Environ. Manag. 2023, 329, 117104. [Google Scholar] [CrossRef] [PubMed]
  16. Moldovan, Z. A spectrophotometric method for captopril determination by using fluorescein natrium-bromine system. Rev. Roum. De Chim. 2012, 57, 721–727. [Google Scholar]
  17. Wang, P.; Niu, X.; Zhao, B. Study on Adsorption Mechanism for Phosphorus Removal with Spongy Iron. China Water Wastewater 2003, 19, 11–13. [Google Scholar]
  18. Zhu, R.H.; Zhu, Y.; Zhang, Y.M.; Yang, Y.; Ping, H.B. Removal of Phosphorus in Water by Modified Red Earth. Chin. J. Spectrosc. Lab. 2011, 28, 1483–1486. [Google Scholar]
  19. Eris, S.; Bashiri, H. Kinetic study of the adsorption of dyes onto activated carbon. Prog. React. Kinet. Mech. 2016, 41, 109–119. [Google Scholar] [CrossRef]
  20. Kumar, K.V. Pseudo-second order models for the adsorption of safranin onto activated carbon: Comparison of linear and non-linear regression methods. J. Hazard. Mater. 2007, 142, 564–567. [Google Scholar] [CrossRef]
  21. Liu, Y.; Li, L.; Zhang, S.J.; Wang, S.H. Kinetics and thermodynamics of efficient phosphorus removal by a complex material. Desalination Water Treat. 2015, 56, 1949–1954. [Google Scholar] [CrossRef]
  22. Kong, L.J.; Han, M.N.; Shih, K.M.; Su, M.H.; Diao, Z.H.; Long, J.Y.; Chen, D.Y.; Hou, L.A.; Peng, Y. Nano-rod Ca-decorated sludge derived carbon for removal of phosphorus. Environ. Pollut. 2018, 233, 698–705. [Google Scholar] [CrossRef] [PubMed]
  23. Emmanuelawati, I.; Yang, J.; Zhang, J.; Zhang, H.W.; Zhou, L.; Yu, C.Z. Low-cost and large-scale synthesis of functional porous materials for phosphate removal with high performance. Nanoscale 2013, 5, 6173–6180. [Google Scholar] [CrossRef] [PubMed]
  24. Xie, J.; Lai, L.; Lin, L.D.; Wu, D.Y.; Zhang, Z.J.; Kong, H.N. Phosphate removal from water by a novel zeolite/lanthanum hydroxide hybrid material prepared from coal fly ash. J. Environ. Sci. Health Part A 2015, 50, 1298–1305. [Google Scholar] [CrossRef]
Figure 1. Flow of La-EPRC particle preparation method.
Applsci 14 00135 g001
Figure 2. Effect of w(La)/w(FA) on phosphorus removal by adsorption.
Applsci 14 00135 g002
Figure 3. Effect of w(La)/w(SS) on phosphorus removal by adsorption.
Applsci 14 00135 g003
Figure 4. Effect of impregnation time of modified steel slag on the effect of phosphorus removal by adsorption.
Applsci 14 00135 g004
Figure 5. Effect of impregnation time of modified fly ash on the effect of adsorption for phosphorus removal.
Applsci 14 00135 g005
Figure 6. Effect of coprecipitation of modified steel slag on the effect of adsorption for phosphorus removal. (a) Impact of promptly adding sodium hydroxide to the suspension upon its preparation on the adsorption and phosphorus removal efficacy. (b) Influence of introducing sodium hydroxide to the suspension for 1 h after 12 h of impregnation on the adsorption and phosphorus removal effectiveness.
Applsci 14 00135 g006
Figure 7. Effect of coprecipitation of modified fly ash on the effect of adsorption for phosphorus removal. (a) Impact of immediately adding sodium hydroxide to the suspension upon preparation on adsorption and phosphorus removal efficacy. (b) Influence of adding sodium hydroxide to the suspension for 1 h after 12 h of impregnation on adsorption and phosphorus removal effectiveness.
Applsci 14 00135 g007
Figure 8. Results of adsorption isotherm fitting. (a) Langmuir isotherm model fitting results; (b) Freundlich isotherm model fitting results.
Applsci 14 00135 g008
Figure 9. Kinetic fitting results. (a) Results of fitting PFO adsorption kinetics. (b) Results of fitting PSO adsorption kinetics.
Applsci 14 00135 g009
Figure 10. Adsorption kinetics curves at different temperatures. (a) Adsorption kinetics at 15 °C. (b) Adsorption kinetics at 35 °C.
Applsci 14 00135 g010
Figure 11. Results of adsorption kinetics fitting at 15 °C. (a) Results of fitting PFO adsorption kinetics. (b) Results of fitting PSO adsorption kinetics.
Applsci 14 00135 g011
Figure 12. Results of adsorption kinetics fitting at 35 °C. (a) Results of fitting PFO adsorption kinetics. (b) Results of fitting PSO adsorption kinetics.
Applsci 14 00135 g012
Figure 13. La-EPRC dosage versus adsorption curve.
Applsci 14 00135 g013
Figure 14. Initial pH versus removal rate curve.
Applsci 14 00135 g014
Figure 15. Effect of coexisting anions on the adsorption capacity of La-EPRC particles.
Applsci 14 00135 g015
Figure 16. Effect of NaOH concentration on desorption rate of adsorbent.
Applsci 14 00135 g016
Figure 17. Effect of NaOH desorption time on the desorption rate of adsorbent.
Applsci 14 00135 g017
Figure 18. Results of adsorption–desorption experiments.
Applsci 14 00135 g018
Table 1. Physical properties of adsorbent substrates.
Adsorption
Substrates
Density (g/cm3)Specific Surface Area (m2/g)Color
Steel Slag3.100.3653Sepia
Coal Ash2.340.0580Grizzly
Table 2. Chemical composition of adsorbent substrates (%).
Chemical CompositionSteel SlagCoal Ash
CaO55.01.31
Fe2O321.54.39
Al2O31.5145.9
SiO213.444.4
MgO3.650.261
MnO1.750.026
SO30.5120.666
V2O50.4170.038
TiO21.260.296
Na2O0.0770.094
ZnO-0.021
CuO-0.02
Table 3. Main chemical composition of 525R ordinary silicate cement (%).
IngredientCaOFe2O3Al2O3SiO2MgOSO3
Quantity Contained63.54.525.1521.321.462.25
Table 4. Adsorption isotherm fitting results.
Temperature (°C)LangmuirFreundlich
KL (L/mg)QM (mg/g)R2KF1/nR2
150.0070517.167540.996530.199810.78920.9882
250.0089518.361180.996370.296930.74810.98699
350.0125120.395180.993380.504470.69460.97572
Table 5. Kinetics fitting results.
PFO Adsorption KineticsPSO Adsorption Kinetics
Initial Phosphorus
Concentration (mg P/L)
qe (mg/g)K1R2Initial Phosphorus
Concentration (mg P/L)
qe (mg/g)K2R2
50.569350.10280.970650.675770.17179 0.99366
101.070830.121350.96394101.262820.11048 0.99021
151.528340.126480.98207151.773730.08435 0.99186
202.029560.132640.97696202.33990.06823 0.99038
Table 6. Adsorption kinetics fitting results at different temperatures.
TemperaturePFO Adsorption KineticsPSO Adsorption Kinetics
Initial Phosphorus (Chemistry)qeK1R2Initial Phosphorus (Chemistry)qeK2R2
15 °C100.85610.08820.9875101.03890.09038 0.9908
151.33760.07720.9939151.64570.04879 0.9972
201.77680.09540.9870202.13160.04902 0.9945
35 °C101.23120.06620.9947101.53820.00455 0.9957
151.86740.05670.9957152.39840.02247 0.9951
202.31630.07680.9889202.82730.02914 0.9972
Table 7. Desorption of La-EPRC particles in room temperature water.
Adsorption (mg/g)Desorption (mg/g)Desorption Rate (%)Particle Surface State
0.6060.00070.115No change
1.1420.0010.087No change
2.1130.0030.142No change
2.5630.0050.195No change
2.7980.0090.321No change
3.1240.0120.384No change
3.4340.0180.524No change
Table 8. Desorption of La-EPRC particles in high-temperature hot water.
Adsorption (mg/g)Desorption (mg/g)Desorption Rate (%)Particle Surface State
0.6120.0010.163No change
1.1350.0030.264No change
2.3420.0050.213No change
2.5340.0090.355No change
2.8570.0130.455No change
3.2150.0180.559No change
3.4450.0210.609No change
Table 9. Desorption of La-EPRC particles in sulfuric acid solution.
Sulfuric Acid Concentration (mol/L)Adsorption (mg/g)Desorption (mg/g)Desorption Rate (%)Particle Surface State
0.12.1600.1235.694No change
0.52.1420.2019.383Small portion of surface material peeling off
12.1330.43620.44Further increase in solution turbidity
52.2040.87539.70The particles are eroded to a greater extent
102.1981.32960.46Pellets fall apart
Disclaimer/Publisher’s Note: The statements, opinions and data contained in all publications are solely those of the individual author(s) and contributor(s) and not of MDPI and/or the editor(s). MDPI and/or the editor(s) disclaim responsibility for any injury to people or property resulting from any ideas, methods, instructions or products referred to in the content.