Article

Investigation of Geometric and Hardness Parameters of Tank Track Grooves Equipped on Photovoltaic Cleaning Robot

1
Faculty of Electronics and Telecommunication, Sai Gon University, Ho Chi Minh City 700000, Vietnam
2
National Key Laboratory of Digital Control and System Engineering (DCSELab), Faculty of Mechanical Engineering, Ho Chi Minh City University of Technology (HCMUT), Linh Trung Ward, Thu Duc City, Ho Chi Minh City 700000, Vietnam
3
Vietnam National University Ho Chi Minh City, Linh Trung Ward, Thu Duc City, Ho Chi Minh City 700000, Vietnam
*
Author to whom correspondence should be addressed.
Appl. Sci. 2024, 14(1), 145; https://doi.org/10.3390/app14010145
Submission received: 24 October 2023 / Revised: 14 December 2023 / Accepted: 19 December 2023 / Published: 22 December 2023
(This article belongs to the Section Mechanical Engineering)

Abstract

:
The utilization of photovoltaic (PV) cleaning robots has proven to be an effective method for maintaining the conversion efficiency of utility-scale PV power plants by mitigating the impact of dust accumulation. However, ensuring the safe operation of these robots, resembling tanks in appearance, particularly in wet working conditions, relies heavily on their adherence to PV panels. This study focuses on assessing the slip resistance of candidate materials coated on endless polyurethane timing belts, which are equipped on PV cleaning robots to enable the efficient cleaning of uneven and misaligned PV arrays. A novel apparatus is proposed to evaluate the coefficient of static friction (COSF) of slip specimens, considering factors such as outsole patterns, area density, and shore hardness. The results highlight the significant influence of shore hardness and area density on the slip resistance of the specimens. Based on the findings, it is recommended to design track grooves with hexagon or zigzag patterns and maintain a low area density (e.g., 0.44 g·mm−2) to ensure the safe operation of PV cleaning robots, irrespective of the working conditions they encounter. By addressing the slip resistance challenge, this research contributes to the overall efficiency and reliability of PV cleaning robots, enhancing their performance in maintaining clean and optimal PV panel surfaces.

1. Introduction

Dust accumulation on the photovoltaic (PV) module, which can cause energy power loss in PV power generation of up to 85%, has been observed [1]. The observed PV output efficiency reduction corresponds to a dust accumulation density of 22 g·m−2, reaching up to 26% [2]. Moreover, it can induce the so-called “hot-spot” effect, where the short circuit current of the shaded cells of PV panels raises local heating [3]. For this reason, PV power plants require regular cleaning to wipe the dust from the panels. Due to geographical location [4], the dust might be of sand, silica, red soil, clay, bird droppings, and oil-contaminated soil, which has, in fact, a significant impact on PV cleaning solutions [5]. The state-of-the-art PV cleaning solutions, in general, include natural water/wind cleaning, manual cleaning, mechanical cleaning, electrical screens (EDS), super hydrophobic aircraft, super water jet, and self-cleaning ultrasonic that can be categorized as labor-driven, machine-driven, and coating methods [6]. Among these methods, the utilization of coating techniques incorporating super hydrophilic or superhydrophobic properties appears to offer promising cleaning solutions characterized by low labor and operational costs, minimal water waste, and reduced air pollution. However, they require sufficient precipitation [7] as well as a reduction in solar irradiance absorption, in turn degrading the electrical conversion efficiency. Portable robotic cleaning in relation to mechanical PV cleaning emerges as a reasonable and sustainable solution requiring minimal human intervention and enabling the effective removal of adhered dirt. An automatic cleaning system installed on the PV panel arrays to clean the sites regularly can increase the average annual energy up to 11.1% [8]. A synthesis of the advantages of existing PV cleaning methods is shown in Table 1.
In terms of mechanical PV cleaning, there are mainly two categories of automatic systems, both utilizing rotating brushes to wipe the dust off PV panels. The former requires guide rails permanently fixed on the PV panel arrays for horizontal motion [18,19]; otherwise, it runs on the edge of PV module arrays [20,21,22,23,24], namely module-mounted robotics. Consequently, this particular type of PV cleaning robot is typically well-suited for large-scale PV plants characterized by the continuous straight alignment of PV panels. The latter features a structural design similar to that of a mobile robot equipped with a suction cup [25], wheels [26,27,28], or belt-based tracks [29,30,31] to facilitate its movement. These are commonly employed for utility-scale PV plants where the adjacent PV panels might exhibit uneven planes, edge misalignment, or large gaps. The commercial PV cleaning robot [25], utilizing suction cups to adhere to PV panels, can achieve a maximum efficiency of 1040 m2 per hour, even on steep rooftops with inclinations of up to 45 . While PV cleaning mobile robots equipped with wheels are susceptible to disturbances caused by gaps between two adjacent PV panels and the PV array mounting brackets, those utilizing belt-based tracks, similar to tanks, are not affected [28]; in particular, some research indicates how to design the tank suspension in the PV cleaning mobile robots to decrease the impact on the PV panels [13,32]. Moreover, the commercial PV cleaning robot equipped with a belt-based track system [30] has the capability to achieve a maximum cleaning efficiency of up to 1600 m2 per hour, positioning it as a highly promising cleaning solution for distributed PV plants. However, this specific PV cleaning robot still faces challenges in terms of slipping and falling, threatening robot safety when operating on wet tilted PV surfaces. Slip resistance has been recognized as the key feature of the belt-based track, aiming to enhance the anti-slippage capability of this specific PV cleaning robot. Although numerous studies ([33,34,35,36] and references therein) have investigated the effects of rubber soling materials on floor surfaces, there has been limited research, except for our earlier study [37,38], regarding suitable material coatings for the belt-based track that can provide sufficient grip for the PV cleaning robot during the removal of dust from wet PV panels. It was observed that shore hardness and surface roughness significantly impact the slip resistance of rubber soles in both dry and wet flooring conditions [33]. The coefficient of friction (COF) for rubber soles with a hardness of A65 is 0.95 in dry flooring conditions, while for rubber soles with a shore hardness above 85, it is 0.50. In wet condition tests, the COF for rubber soles with a hardness of A65 is 0.88. However, the use of different types of slipmeters can result in varying friction indices on uniform surface roughness [34].
To tackle the aforementioned issues, extended from our previous study [38], this paper investigates the geometric and hardness parameters of tank track grooves equipped on PV cleaning robots via the novel slip resistance test apparatus. The proposed apparatus simulates both dry and wet working conditions ofn PV panels during dust removal by utilizing water sprayer nozzles supplied with controlled water flow. The tilt angle of PV panels is continuously adjusted through a hinged lever mechanism while simultaneously measuring the x-axis component of gravity force. Experiments are conducted to determine the relationship between the coefficient of static friction (COSF) and factors such as shore hardness, contact area, and outsole pattern. Referring to the relationship between these factors with respect to COSF, the suggested intrinsic parameters can be obtained to design the belt-based track for PV cleaning robots, with the aim of ensuring safety during the cleaning of tilt PV panels. Apart from our earlier study and the existing literature, the main contributions of this paper can be summarized as follows:
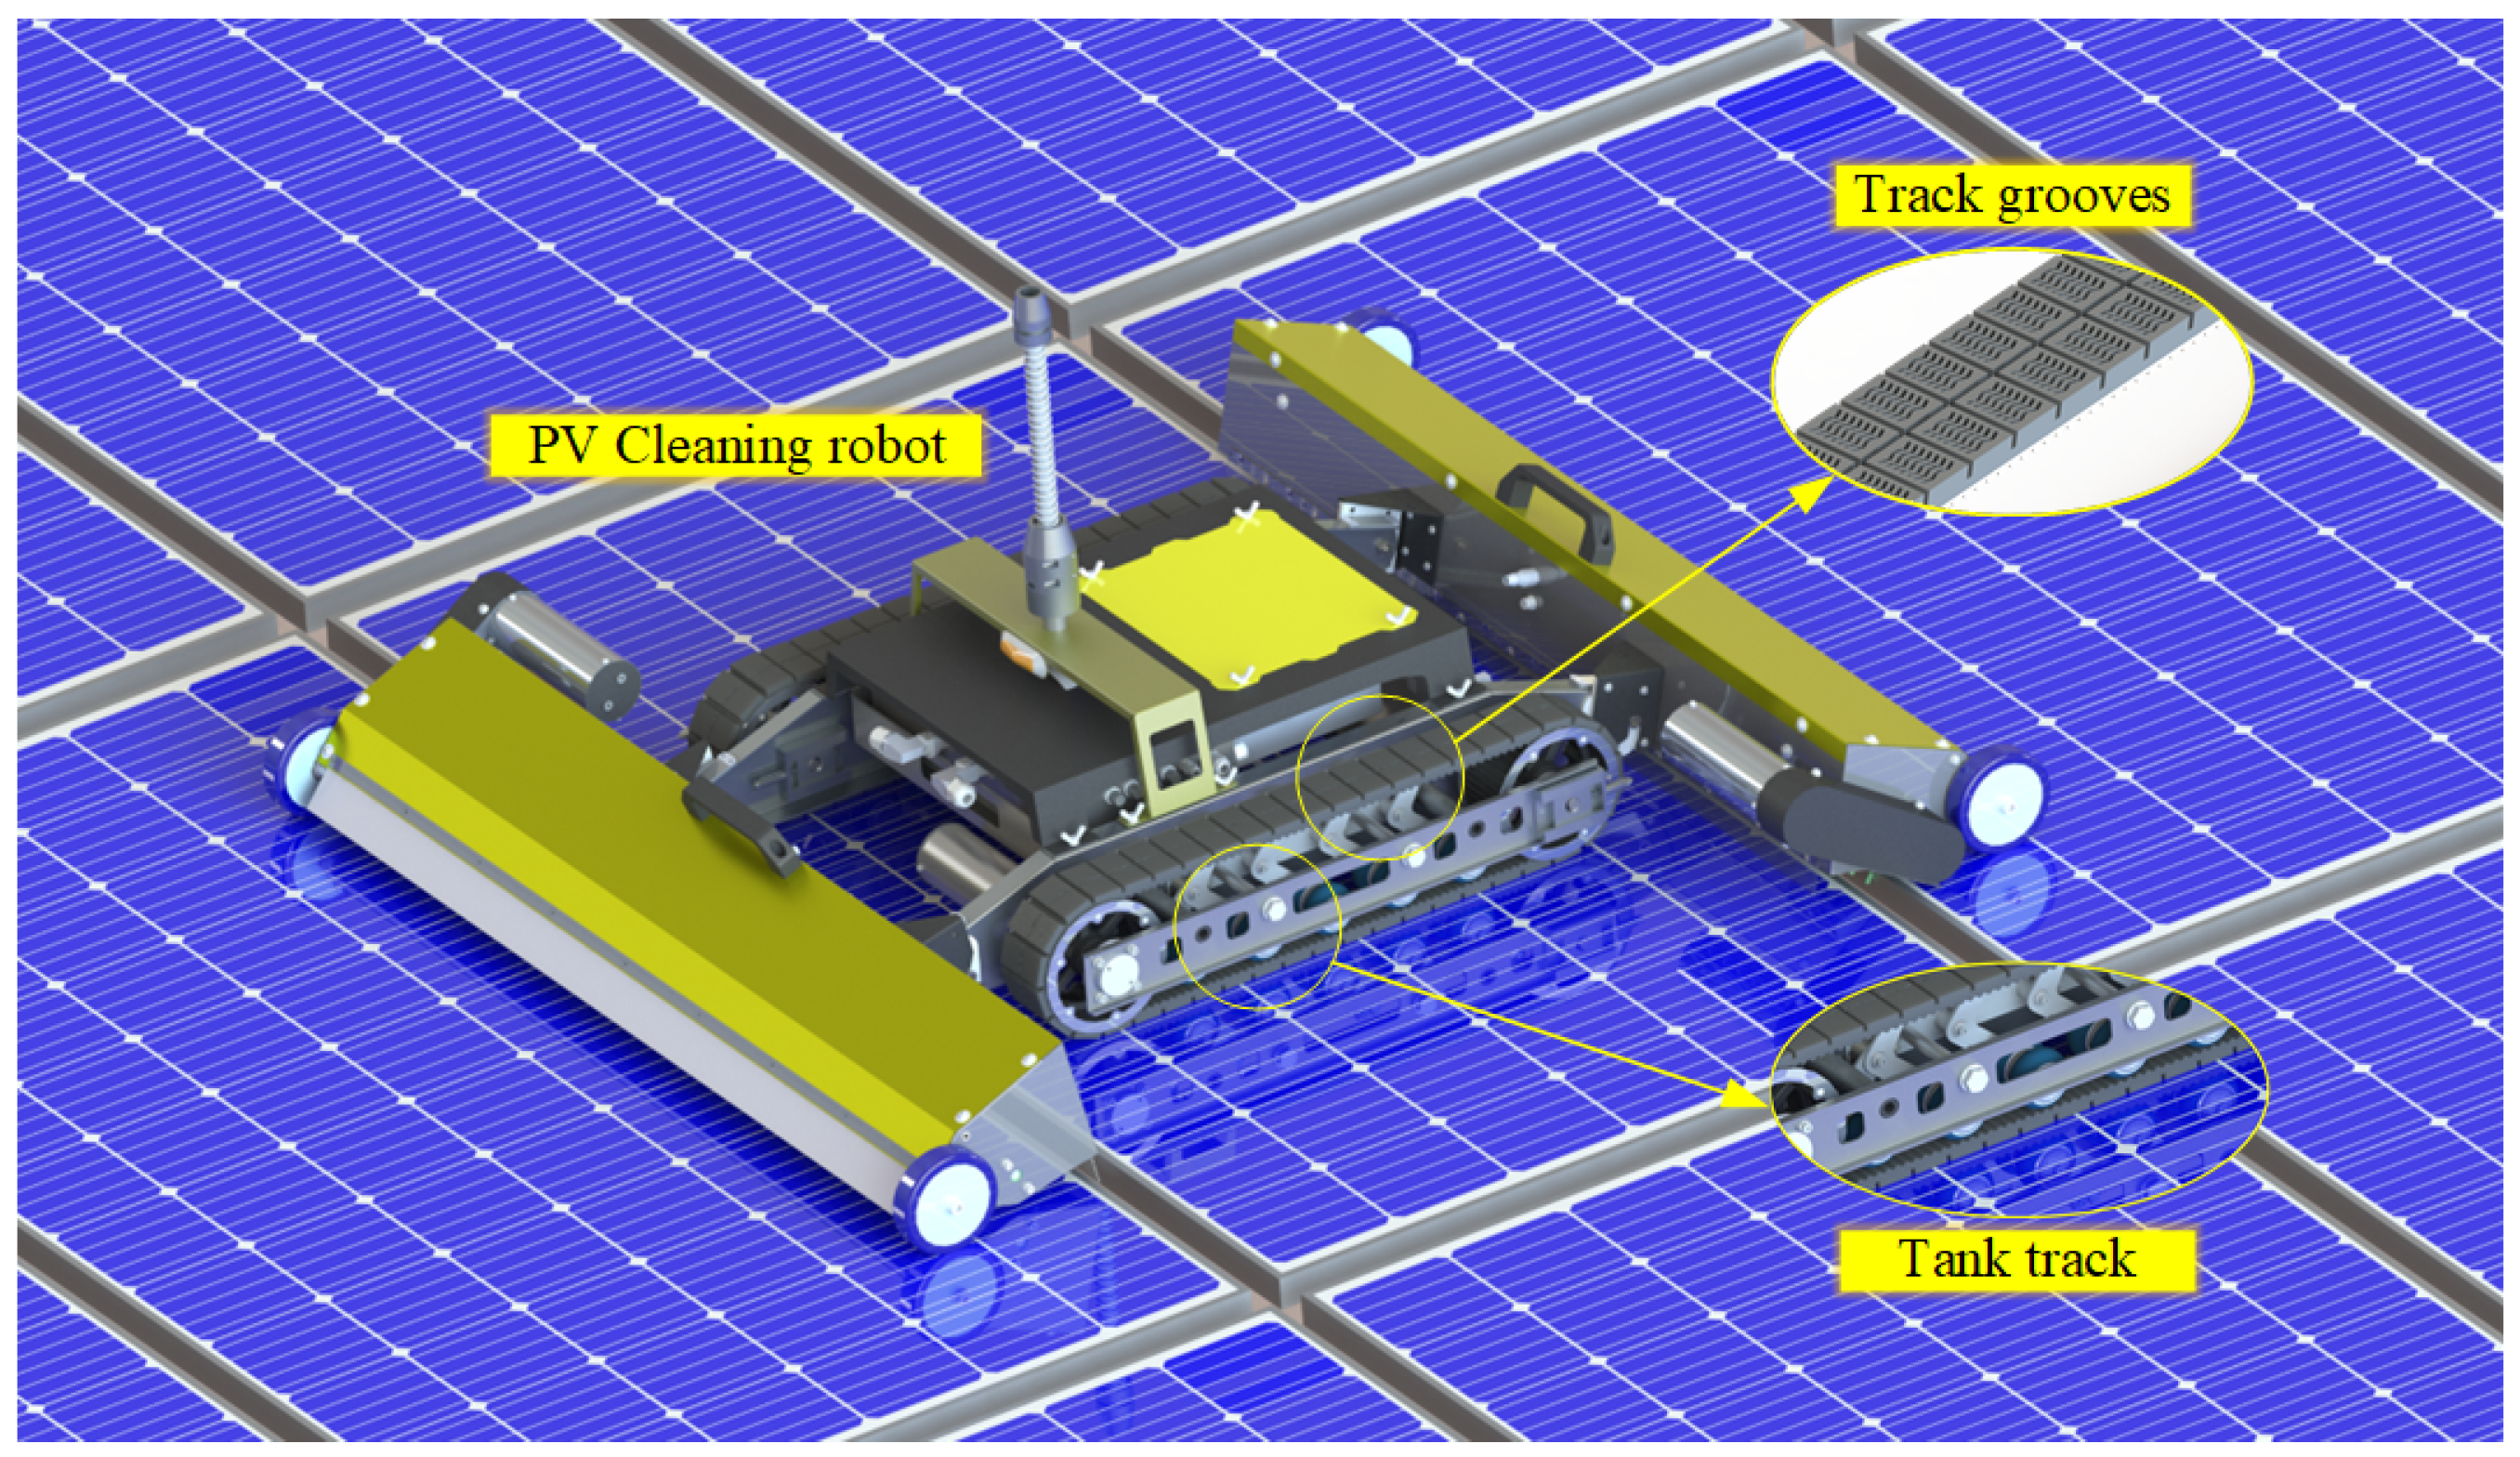
  • A novel slip resistance test apparatus is proposed to assess the friction index of material coatings for the belt-based track utilized by the PV cleaning robot;
  • The proposed apparatus investigates the relationship between COSF and various factors, including shore hardness, contact area, and outsole pattern;
  • The derived relationships provide proper suggestions relating to shore hardness, area density, and outsole pattern for the construction of belt-based tracks equipped to PV cleaning robots.
The rest of this paper is organized as follows: in Section 2, we provide an overview of the theoretical background, while, in Section 3, the instrumentation is introduced. Section 4 covers the experiment setup. The details of the results and discussion are given in Section 5, which comprises the relationship between shore hardness and COSF, the relationship between outsole pattern and COSF, and the relationship between area density and COSF. Finally, Section 6 concludes the paper.

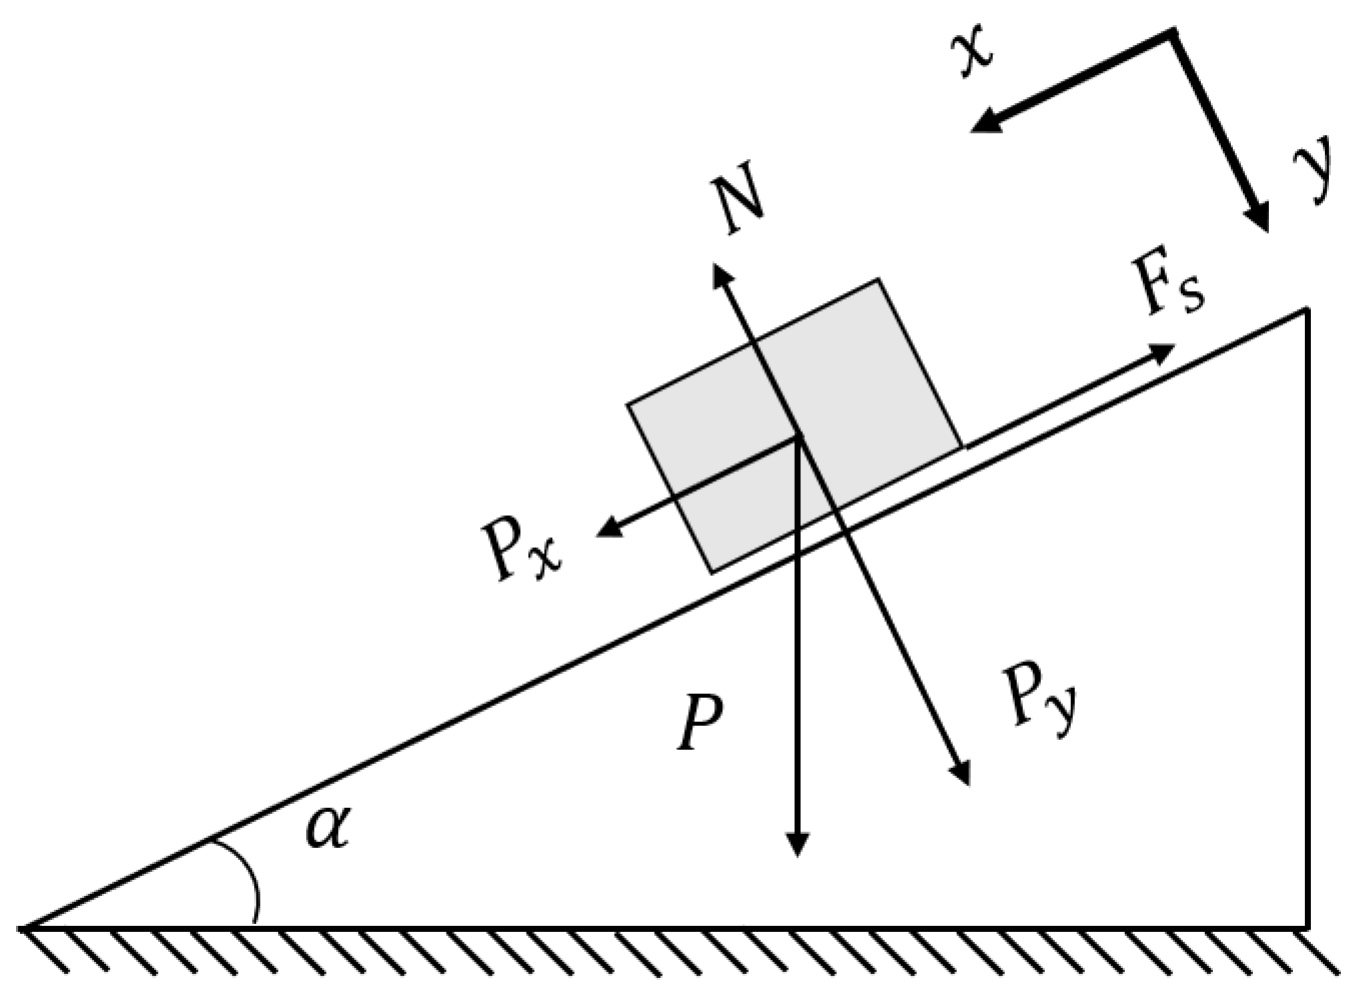
2. Theoretical Background
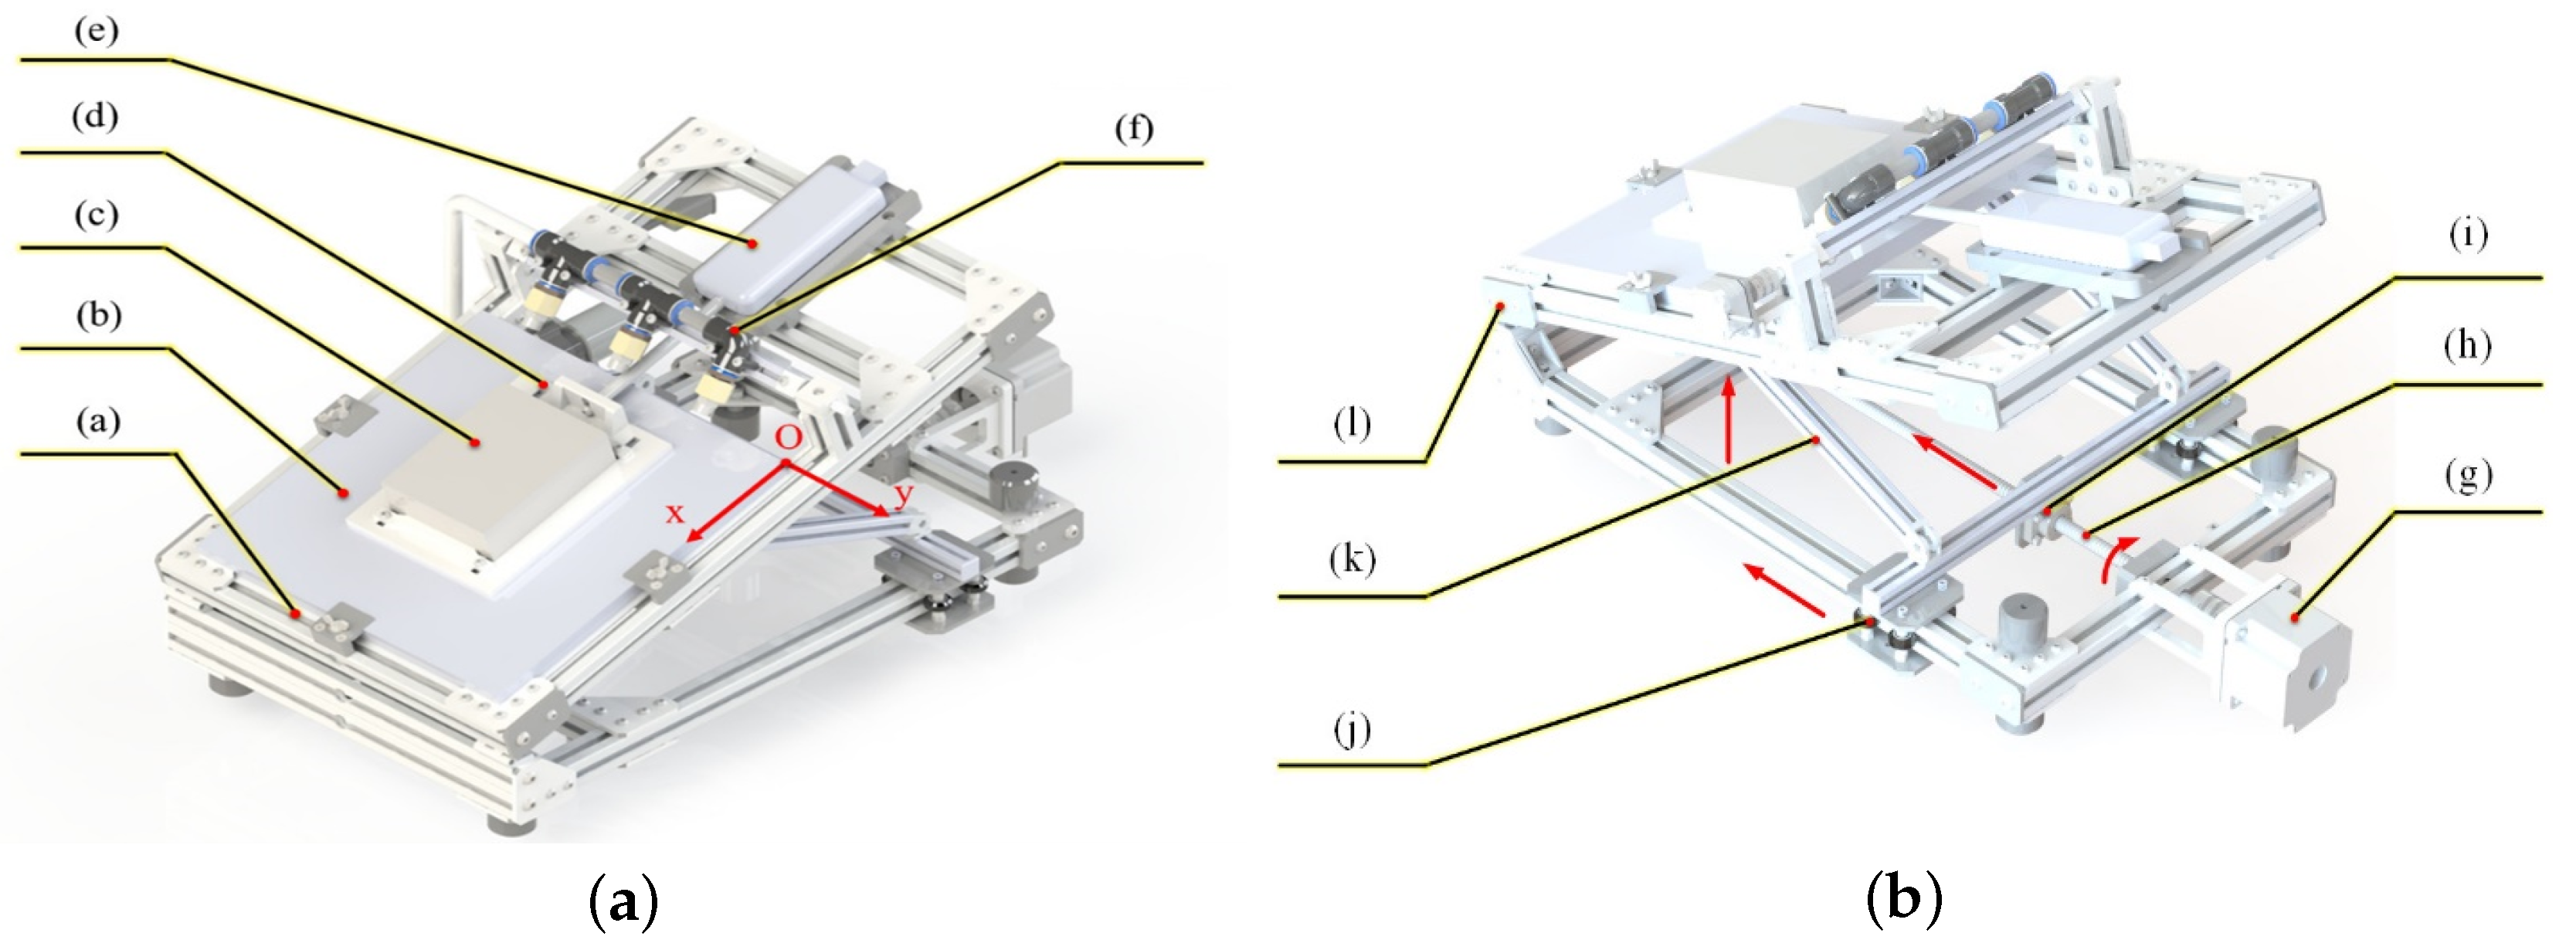
Figure 1 depicts a PV cleaning robot equipped with two belt-based track mechanisms operating on PV panels. The belt-based track comprises two timing pulleys interconnected by a polyurethane (PU) endless timing belt coated with slip-resistant material. The coating layer serves a crucial role in the preventing slippage of the PV cleaning robot on tilt PV panels and facilitating its movement across module-supporting brackets that are significantly higher than the PV panels’ aluminum edge. To enable the application of slip-resistant material, such as vulcanized rubber, on the PU belt, grooves are made on this layer, allowing for the easy bending of the belt-based track. The area, stiffness, pattern, and thickness of the track grooves formed by the adjacent grooves directly influence the slippage of PV cleaning robots. This research investigates these factors to provide valuable insights into the properties of track grooves reflected by the coefficient of friction.
To compute the coefficient of friction, we consider a displacement mass (m) placed on an adjustable tilt angle ( α ) floor surface, as depicted in Figure 2. The motion of the displacement mass on the floor surface is analyzed using the free-body diagram method. The force of gravity acting on the displacement mass is directly proportional to its weight, allowing for further analysis of the coefficient of friction. P x = P sin ( α ) , P y = P cos ( α ) are, respectively, the components of the force of gravity projected onto the x and y axis.
When the tilt angle is zero, it should be noted that the displacement mass is placed on the level surface, resulting in no frictional force. Increasing the tilt angle, the force of static friction F s is increased from zero to counteract the component of the force of gravity P x . According to Newton’s second law, while the displacement mass rests on the tilt surface, the forces that act on the displacement mass along the x-axis are in equilibrium F x ( = P x F s ) = 0 . Recall that the x-component of the force of gravity P x = m g s i n ( α ) and the force of static friction F s = μ s N can be obtained as follows:
m g s i n ( α ) = μ s N
where μ s is the coefficient of static friction (COSF) and N is the normal force.
Applying Newton’s second law and using the y-component of the force of gravity P y = m g cos ( α ) , the normal force N can be determined by
N = m g cos ( α )
By substituting Equation (2) into Equation (1) and solving for μ s , this yields
μ s = t a n ( α )
Equation (3) shows that the COSF can be obtained by analyzing the tilt angle of the floor surface. The tilt angle is incrementally increased until it reaches a specific value at which the displacement mass starts to slide off. This indicates that the x-component of the force of gravity surpasses the maximum static friction force.
An alternative method for measuring the COSF involves not incrementally increasing the tilt angle. That is, the displacement mass, which corresponds to the weight-bearing frame, is connected to an electronic load cell through an inextensible strut bar. When the x-component of the force of gravity is lower than the static friction ( P x < F s ), the weight-bearing frame remains stationary on the PV panel surface. Consequently, there is no tensile force exerted by the displacement mass, as indicated by an ideally constant value of the electronic load cell. Conversely, if the x-component of the force of gravity exceeds the static friction, the electronic load cell registers a tensile force, indicating that the weight-bearing frame has started to slide off the PV panel surface. This occurs when the tilt angle reaches a certain threshold. The magnitude of the tensile force corresponds to the x-component of the force of gravity. Therefore, the COSF can also be determined by
μ s = P x m P cos ( α )
where P x m is the measured x-component of the force of gravity indicated by the tensile force of the electronic load cell.
Building upon these theoretical perspectives, this study introduces a test rig aimed at exploring the correlation between the slip resistance of the photovoltaic surface and the COSF of track groove materials with varying hardnesses in both wet and dry working conditions.

3. Instrumentation

The test rig is specifically designed to replicate realistic working conditions on the PV surface, with the aim of assessing the slip resistance of the track groove material designed for the belt track of the PV cleaning robot. As depicted in Figure 3a, the apparatus consists of a chassis (a) supporting a PV panel (b) with an adjustable tilt angle. A displacement mass (c) of known weight is associated with a weight-bearing frame (d), which is equipped with multiple rubber sheets acting as the slip specimen. The weight-bearing frame is positioned on the PV panel to ensure the uniform distribution of gravitational forces through the displacement mass. An electronic load cell (e) is connected to the weight-bearing frame via an inelastic link to measure the x-component force of gravity.
To mimic a more realistic working environment, adjustable water sprayer nozzles (f) are installed to create a water curtain between the PV panel surface and the slip specimen surface, a primary factor contributing to track groove slippage. The water flow is controlled by a PID controller that incorporates feedback from a flow sensor, maintaining consistent trial conditions. Furthermore, the water flow is adjusted to a specific value, simulating PV panels being cleaned to evaluate its impact on the coefficient of static friction. The spray angle of the nozzle is adjusted to closely resemble actual working conditions.

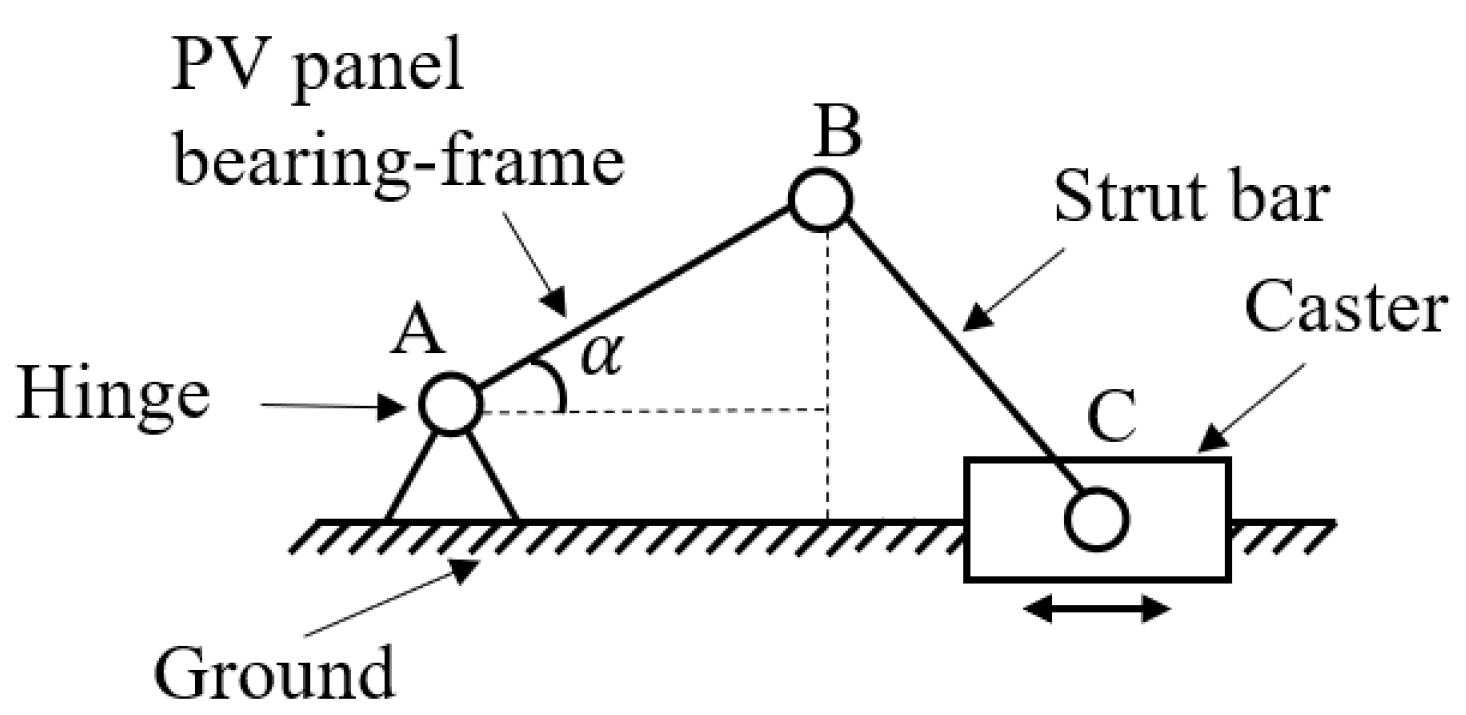
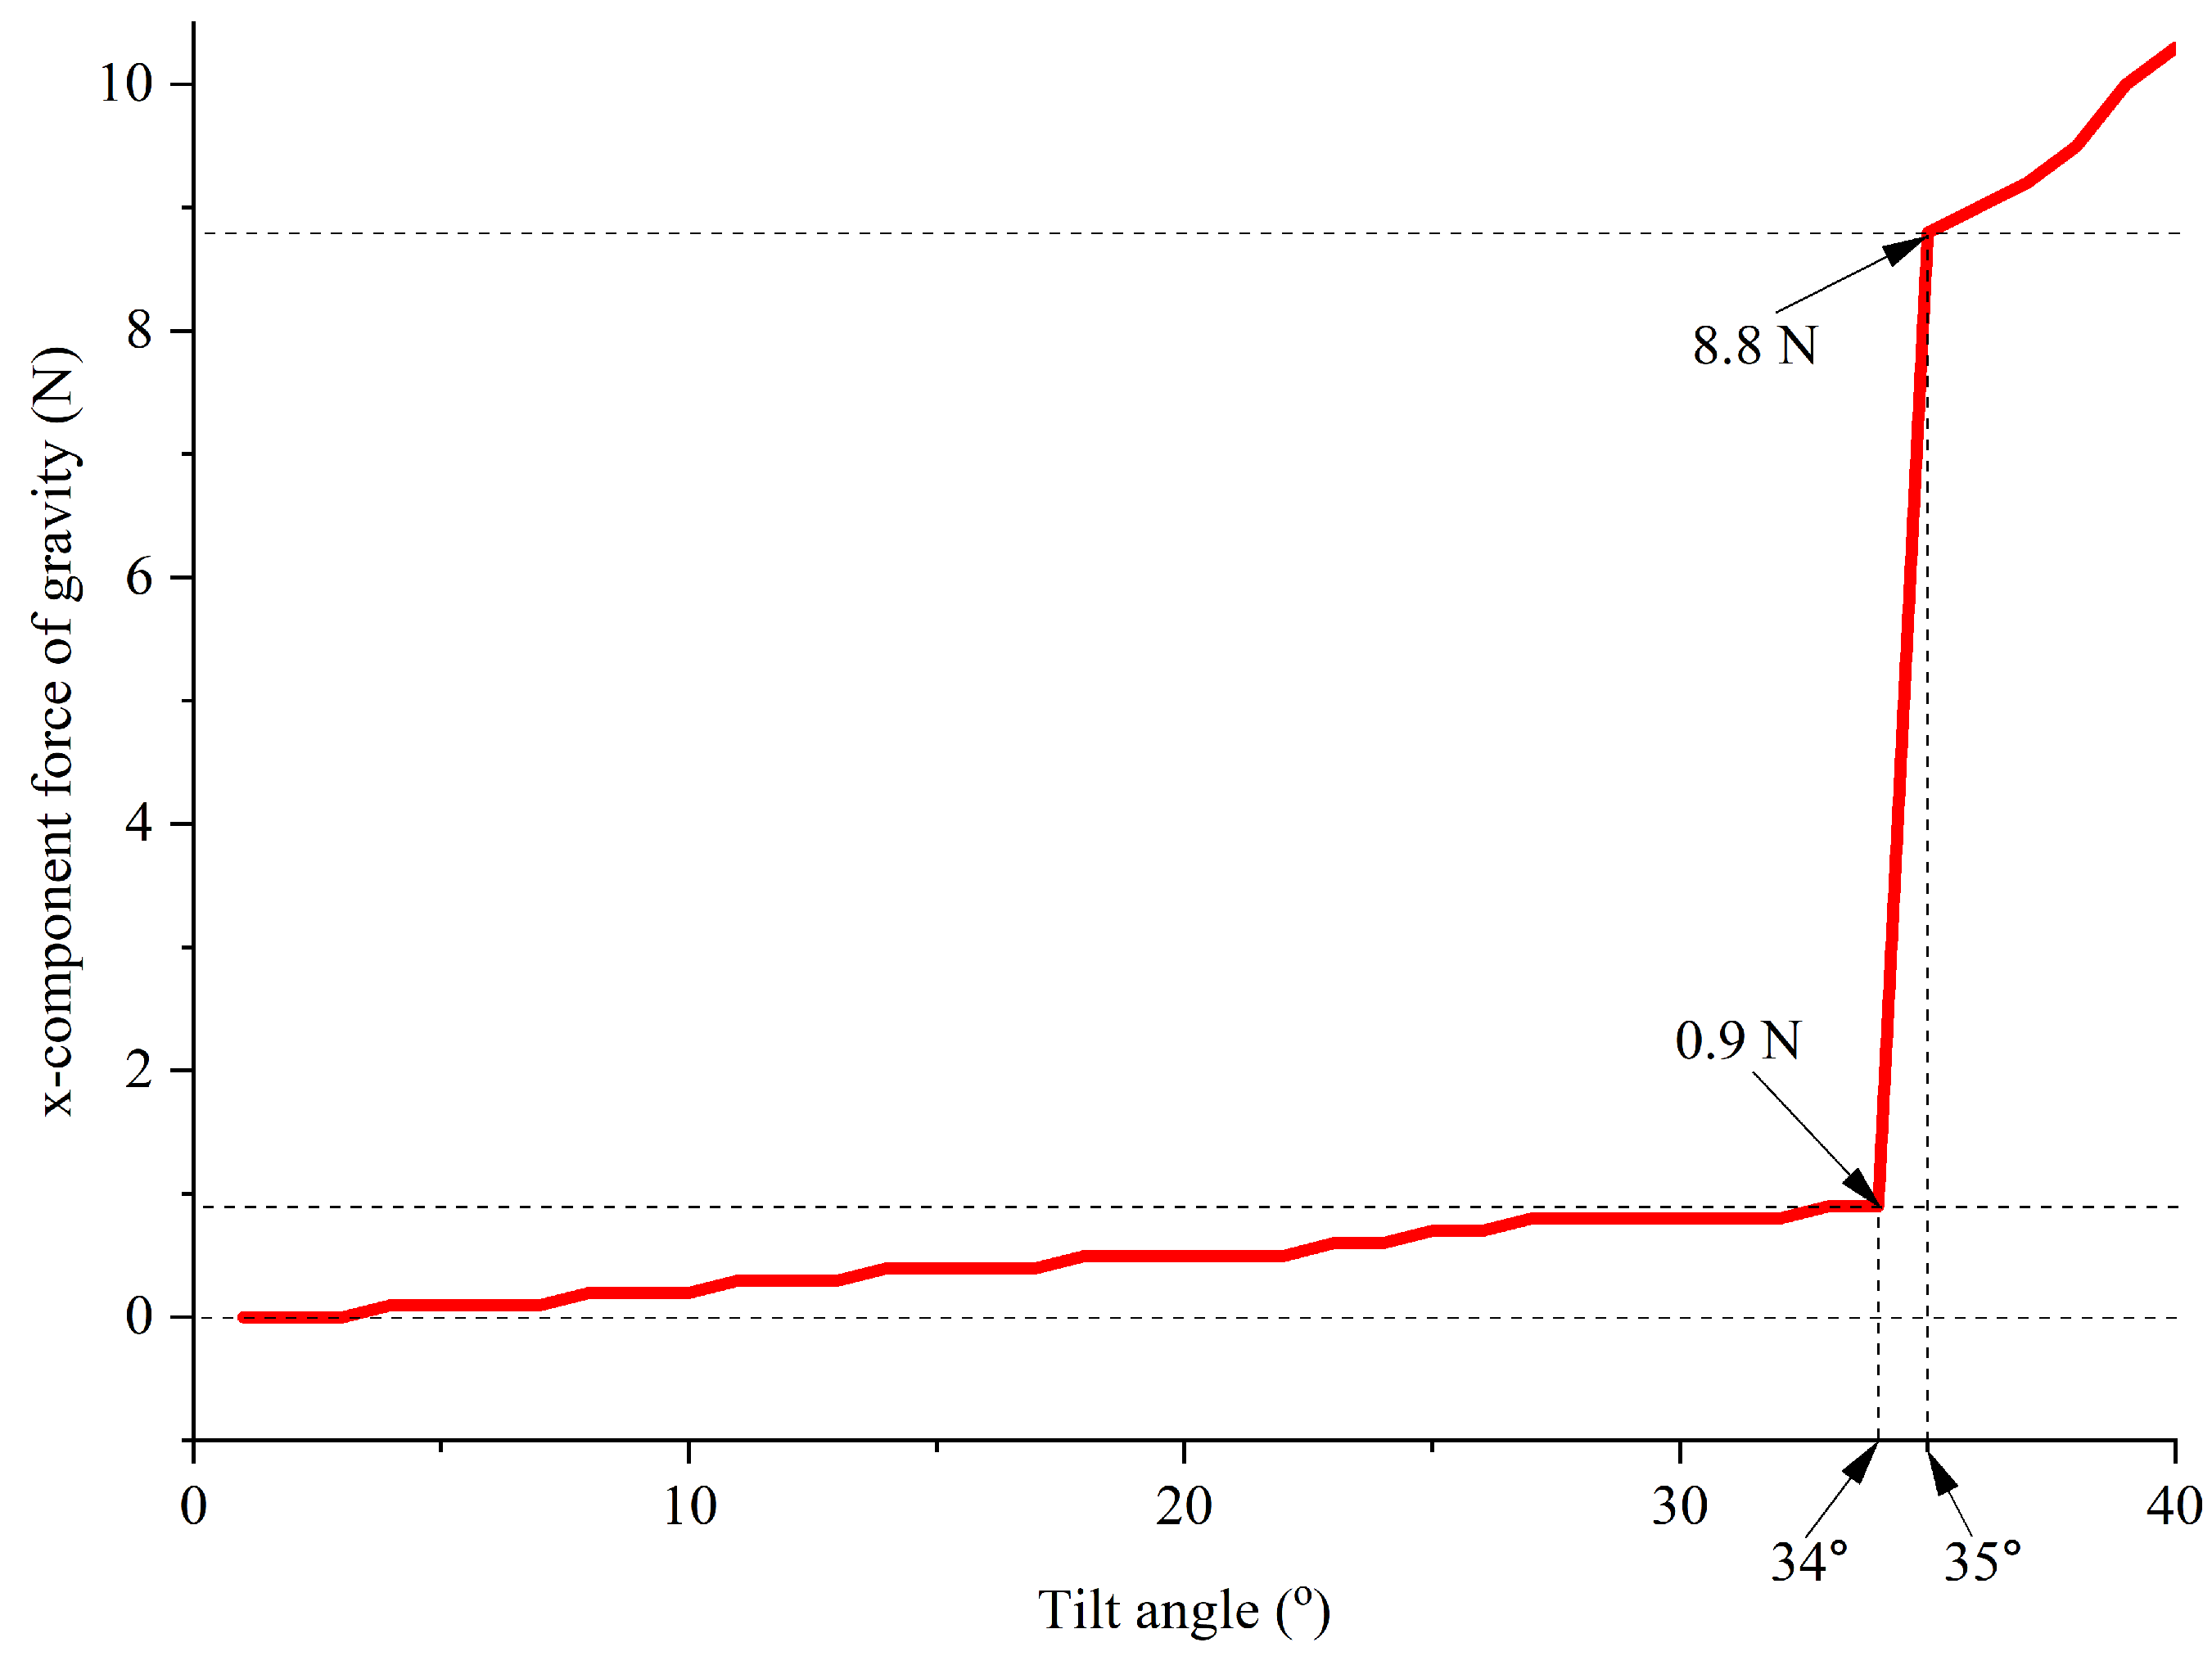
3.1. Tilt Angle Measurement

The tilt angle of the PV panel is controlled through a hinged lever mechanism. As illustrated in Figure 3b, a stepper motor (g) is utilized to drive the ball screw (h), which, in turn, moves its nut (i). The nut is connected to two casters (j) positioned on either side. These casters are linked to the PV panel via two strut bars (k), allowing for the vertical movement (lifting up or down) of the PV panel around two hinges (l).
The working principle of the hinged lever mechanism can be summarized as depicted in Figure 4. At each end of the strut bar, there are two hinges denoted as B and C points, which serve to assemble the PV panel and the casters. Meanwhile, the two hinges (l) that lever the PV panel by the chassis are denoted as point A.
The workspace of the hinged lever mechanism can be described using the following equation:
a cos α + b 2 ( a sin α + d ) 2 = c
where α is the tilt angle; a is the length of the PV panel-bearing frame, 245 mm; b is the length of the strut bars, 275 mm; d is the distance between of the hinges (l) and the caster (j) along the vertical axis, 7.5 mm; and c is the position of the caster along to horizontal axis with respect to the hinge (l), located at point A. It is important to note that the parameter c is a time variable depending on the tilt angle α while the others are all constants.
It can be seen from Equation (5) that the tilt angle can be adjusted by controlling the position of the caster and, in turn, the rotary position of the stepper motor. To avoid physical damage, proximity sensors are attached at the terminals of the ball screw to force an emergency stop in the stepper motor in case the position of the caster exceeds the limitation of the workspace. Figure 5 shows the relationship between the theoretical tilt angle and the experimental tilt angle of the PV panel. The theoretical tilt angle, shown by the squared-dot line, is obtained by using the rotary position feedback of the stepper motor, the ball screw pitch, and Equation (5) with given constants. The position of casters varied from 280 mm to 525 mm with an increment of 5 mm to achieve the tilt angle of the PV panel ranging from 5.9° to 53.3°. The experimental tilt angle, shown by the circle-dot line, is recorded by a calibrated inclinometer. The results showed that the theoretical values and the measured values are a good fit with an acceptable difference (MSE = 0.88).

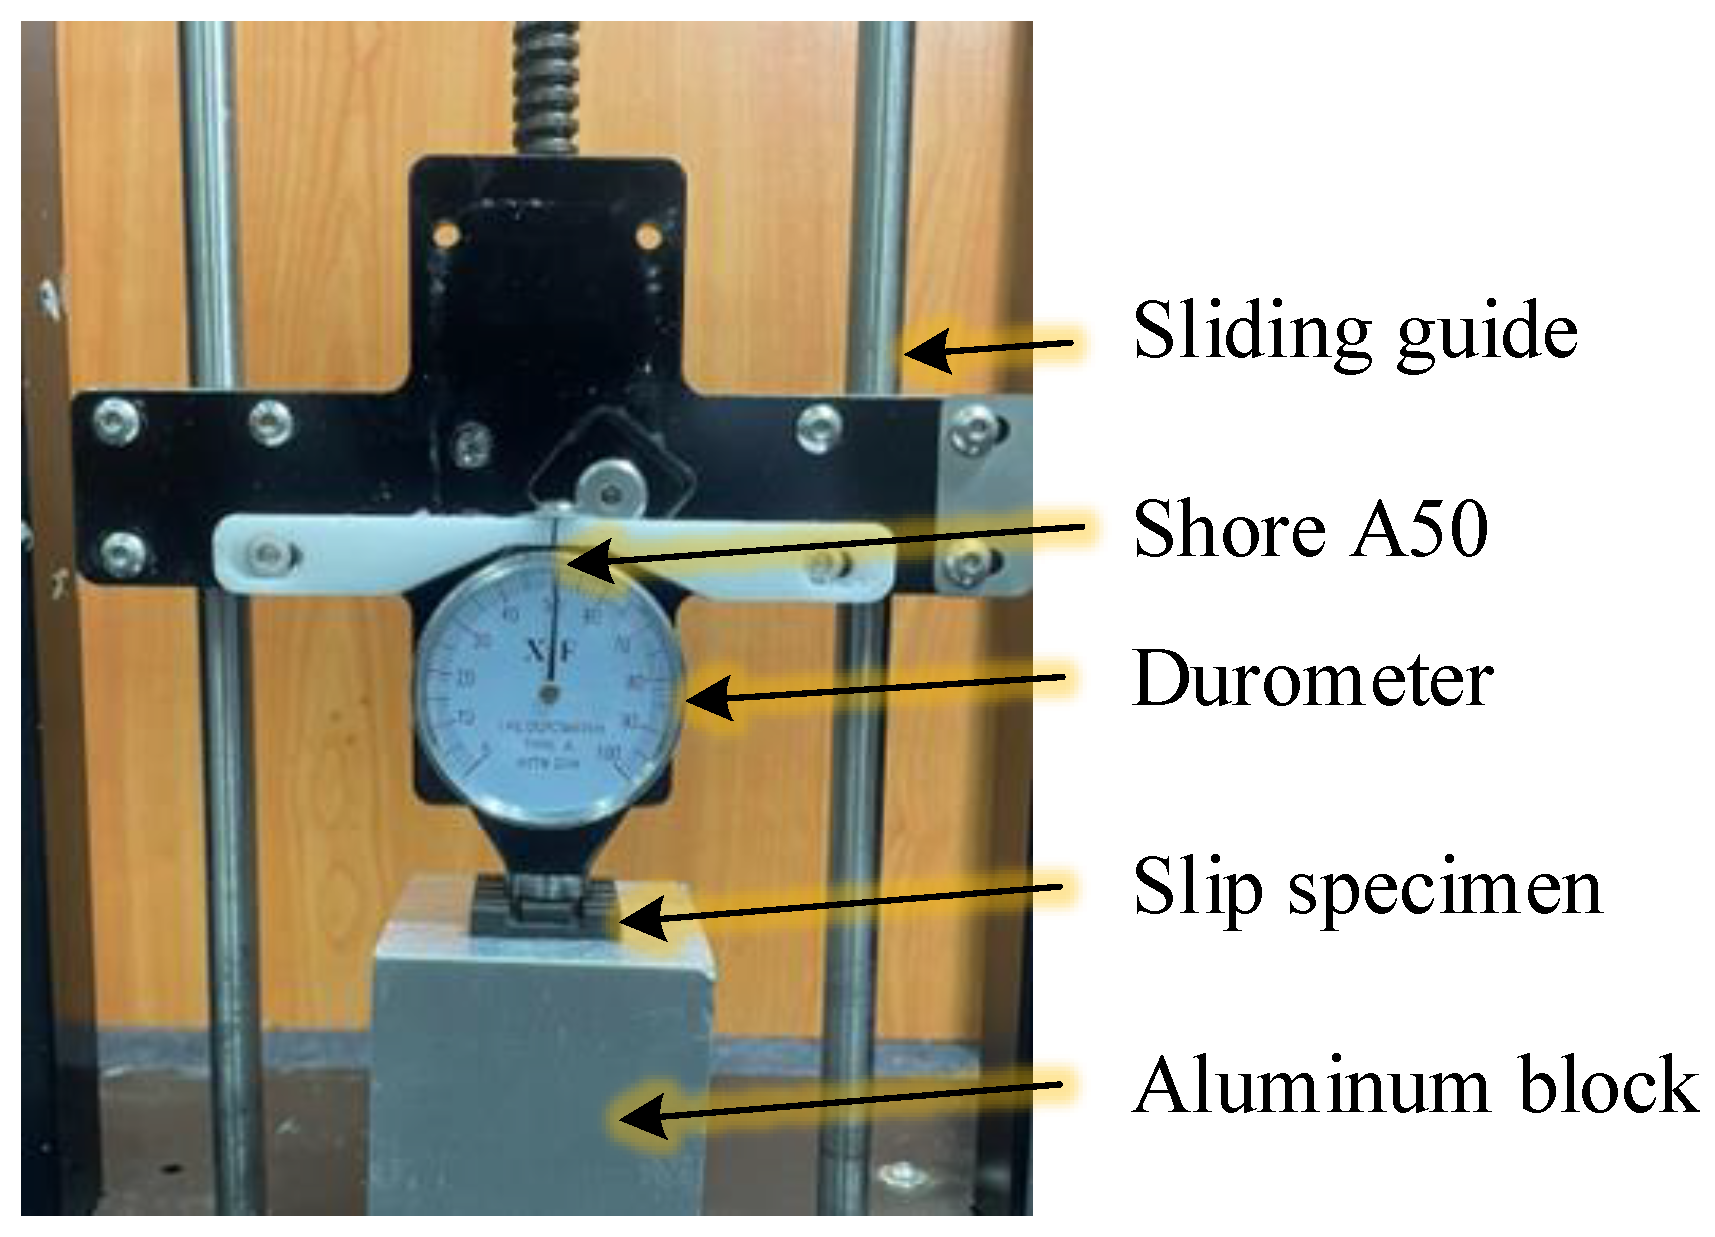
3.2. COSF Measurement
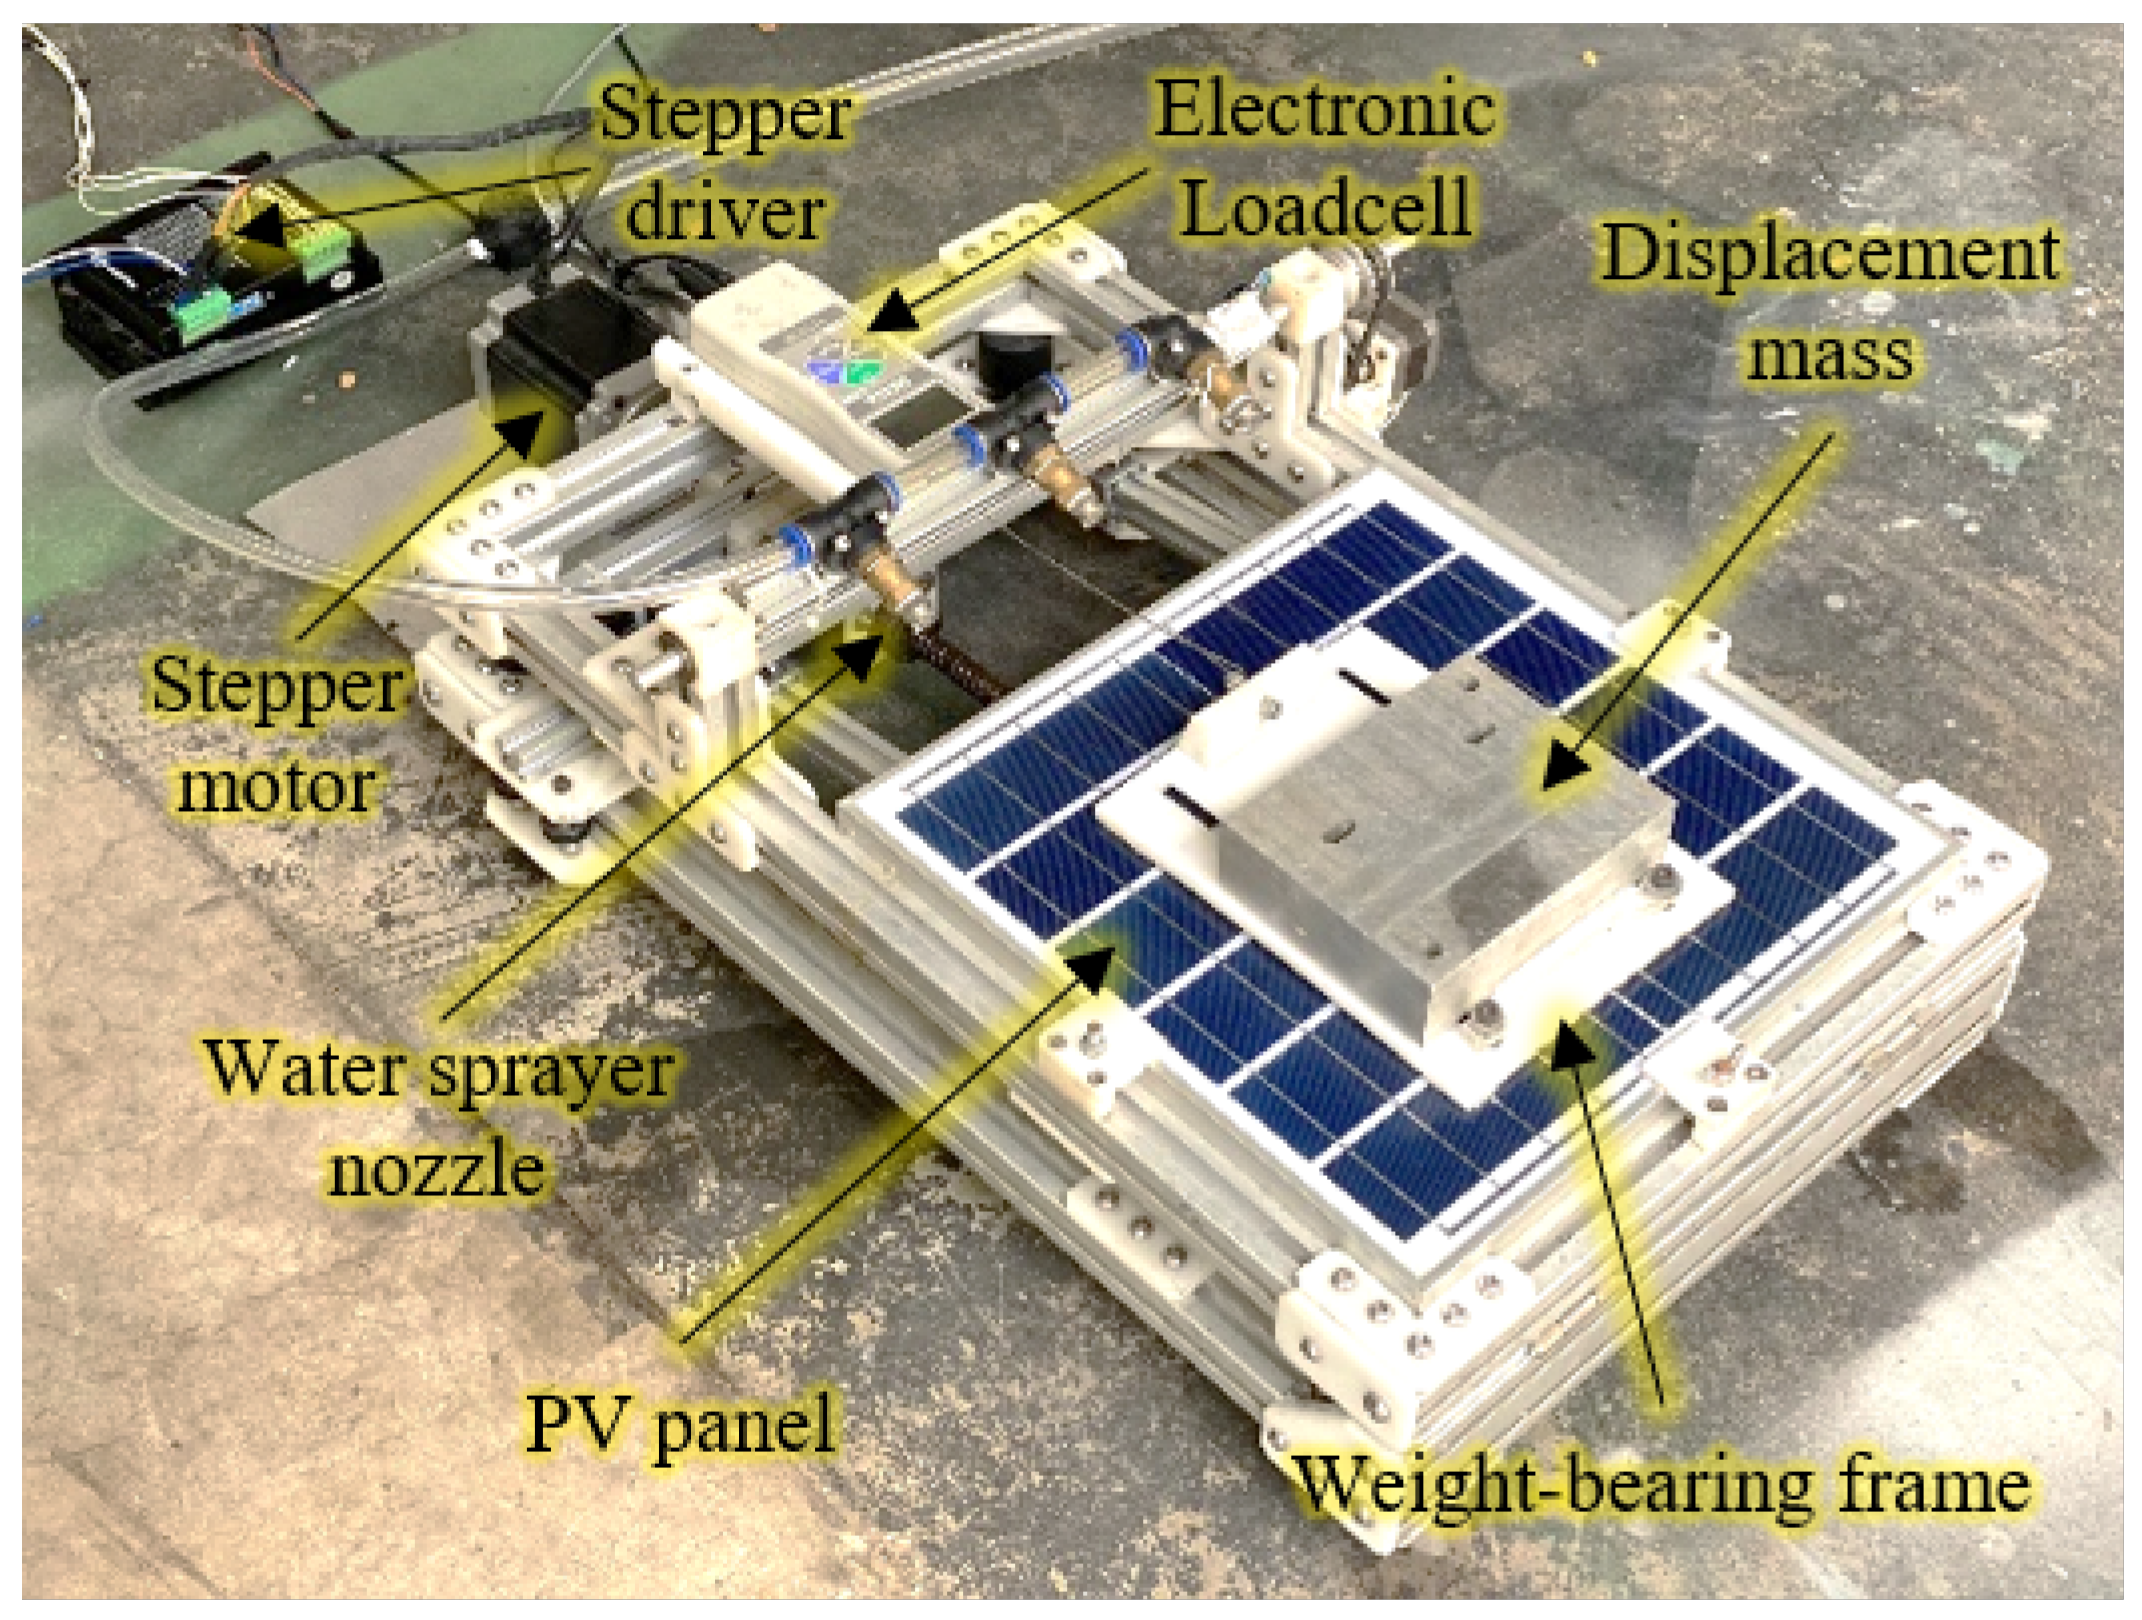
It is worth mentioning that the slip resistance characteristics of the investigated materials are determined by measuring the COSF, which can be obtained using two alternative methods. The first method involves increasing the tilt angle of the PV panel until the weight-bearing frame slides off. In the event of slipping, the abrupt changes in the tensile force indicated by the electronic load cell are significantly larger, serving as a clear indication. The second method involves measuring the x-component of the force of gravity using the electronic load cell when the weight-bearing frame slips on the PV panel surface while simultaneously determining the tilt angle of the PV panel. Furthermore, accurate knowledge of the lumped weight of the displacement mass and the weight-bearing frame is required. It is important to acknowledge that this method involves multiple parameters, each with its own level of uncertainty, resulting in potential sources of error.
We analyzed the COSF measurement event with the slip specimen, which has a shore hardness of A20 and a flat outsole pattern in dry working conditions; Figure 6 shows an example. The x-component force of gravity is linearly related to the tilt angle prior to slippage occurrence. As the tilt angle changes from 0 to 34°, the x-component force of gravity gradually increases from 0 N to 0.9 N. This force is likely caused by the weight of the water contaminant on the PV panel acting on the weight-bearing frame. When the tilt angle reaches 35°, this force abruptly changes from 0.9 N to 8.8 N, indicating the occurrence of slippage in the weight-bearing frame. The determination of the COSF using Equation (3) should be applied to a tilt angle ranging from 34° to 35°. The COSF, in this case, is therefore limited to the range: 0.67 μ s 0.7 (i.e., tan 34 μ s tan 35 ). By using the second method (i.e., Equation (4) with a lumped weight of 1600 g, a tilt angle of 35° and a measured x-component of the force of gravity P x m of 8.8 N, the COSF is calculated to be approximately 0.68. Consequently, the determination of the COSF is conducted through a two-step process as follows: first, the indication of a slip occurrence, and second, a calculation involving the recorded maximum tilt angle and the measured x-component of the force of gravity.

4. Experiment Setup

The purpose of the tests was to investigate the slip resistance properties of synthetic rubber track grooves under the tilt angle of the PV panel. Three factors, namely contact area (roughness), shore hardness, and outsole pattern, have been identified as influential factors affecting the slip resistance of synthetic rubber track grooves. Each experimental test run follows the procedure outlined below:
  • Attach numerous synthetic rubber track grooves with a specific shore hardness, outsole pattern, or contact area to the bottom side of the weight-bearing frame;
  • Position the weight-bearing frame on the PV panel and mount it to the electronic loadcell through the strut bar;
  • Gradually decrease the tilt angle of the PV panel until it reaches the minimum value;
  • The theoretical tilt angle is calibrated using an inclinometer;
  • Adjust the clamp position of the electronic load cell to provide the median tensile force, then zero-return the electronic load cell;
  • Supply water with a specific flow rate to simulate the wet working condition, or;
  • Clean water on the PV panel to facilitate the dry working condition;
  • Increase the tilt angle with the increment of 1° (approximately 10 mm of the caster) until slipping occurs;
  • A slip occurs when the electronic loadcell indicates an abruptly large change;
  • Record the tilt angle and the tensile force at the slipping occurrence;
  • Compute the COSF through the two-step procedure.
It is important to note that the tensile force indicated by the electronic load cell is influenced not only by the x-component of the force of gravity and the compression force of the synthetic rubber track groove exerted by the displacement mass but also by the water force and a certain level of elongation in the rubber thickness. Therefore, fluctuations in the indicated value of the electronic load cell may occur during the experimental process. However, these fluctuations are considered insignificant compared to those observed during slipping events.
The practical slip resistance test apparatus is depicted in Figure 7. The slip specimens used in the tests to determine the COSF are constructed from synthetic rubber, the same material utilized for the tank track groove of the PV cleaning robot. The slip specimens are securely attached to the underside of the weight-bearing frame during the tests, ensuring that they do not cause any scratches on the PV panel. Each specimen has dimensions of 30 mm in length, 30 mm in width, and 10 mm in thickness, resulting in a contact area of 900 mm 2 between the slip specimen and the PV panel. The shore hardness of each slip specimen is determined using a durometer mounted on a sliding guide frame, as depicted in Figure 8. This setup ensures the consistency of the trials. The evaluation of the geometric and hardness parameters of the specimens is carried out under both dry and wet working conditions, as outlined in Table 2.

5. Results and Discussion

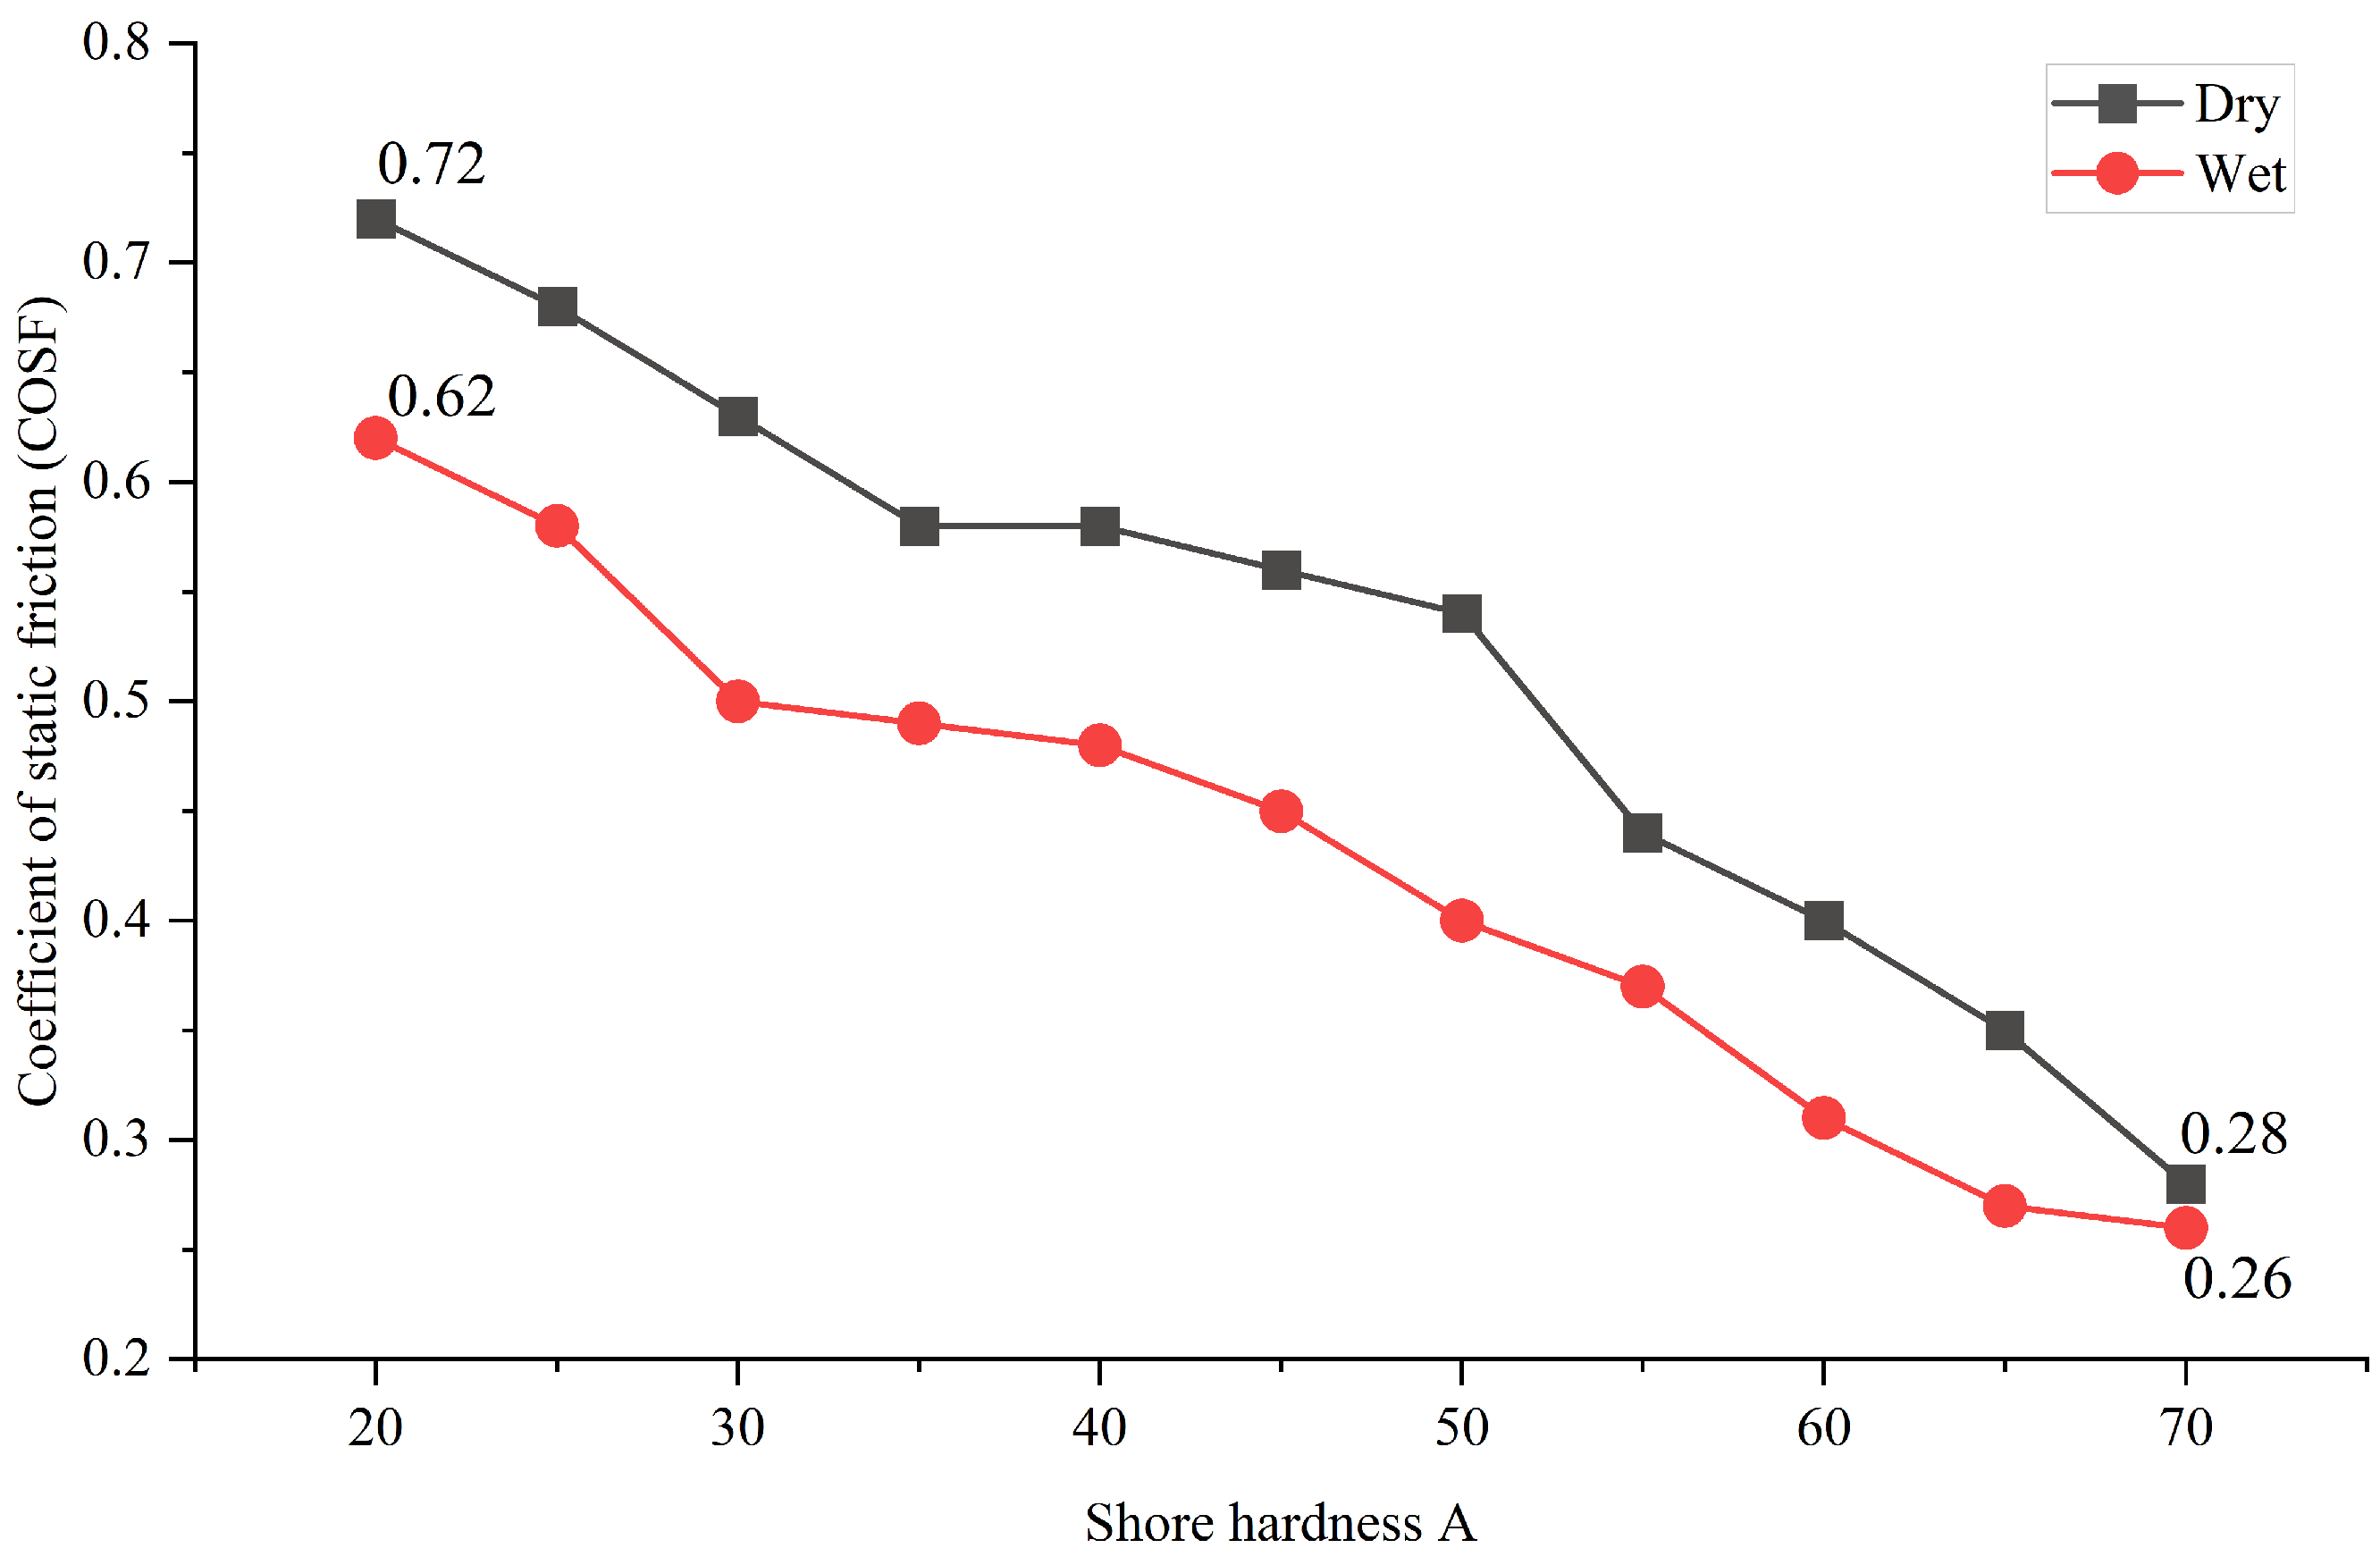
5.1. Relationship between Shore Hardness and COSF

The relationship between the shore hardness of slip specimens (A20, A25, A30, A35, A40, A45, A50, A55, A60, A65, A70), which have a flat pattern, and the COSF is shown in Figure 9. In this particular scenario, a flat pattern is employed to conduct the study, aiming for an evaluation of the relationship between shore hardness and COST. The selection of the flat pattern is based on its suitability, which is a brilliant candidate to effectively disregard the influence of the outsole patterns on slip resistance. The results indicate a significant correlation between the COSF and the shore hardness of slip specimens in both dry and wet working conditions. In the dry working condition, the COSF ranged from 0.72 for shore A20 to 0.28 for shore A70, while in the wet working condition, it ranged from 0.62 to 0.26. The differences in the COSF between dry and wet working conditions were significant as the shore hardness transitioned from A20 to A50. However, these differences became smaller as the shore hardness changed from A55 to A70. When the shore hardness was A70, an insignificant difference in the COSF was observed between dry and wet working conditions (i.e., 0.28 for dry and 0.26 for wet). This can be attributed to the high hardness of the specimens, which makes it difficult to expand and increase the contact area with the PV panel while reducing the level of water contamination. While slip specimens with lower shore hardness exhibit higher COSF features, materials with low shore hardness are not feasible for manufacturing the belt-based track due to their limited lifespan.
Another observation regarding the COSF is that the values were approximately the same for shore A35 and A40 in both working conditions. However, shore hardness A40 is likely prone to offer a longer lifespan for the belt-based track. Building upon these initial test findings, additional trials will be undertaken to explore the geometric characteristics of slip specimens, focusing specifically on those with shore hardness A40.

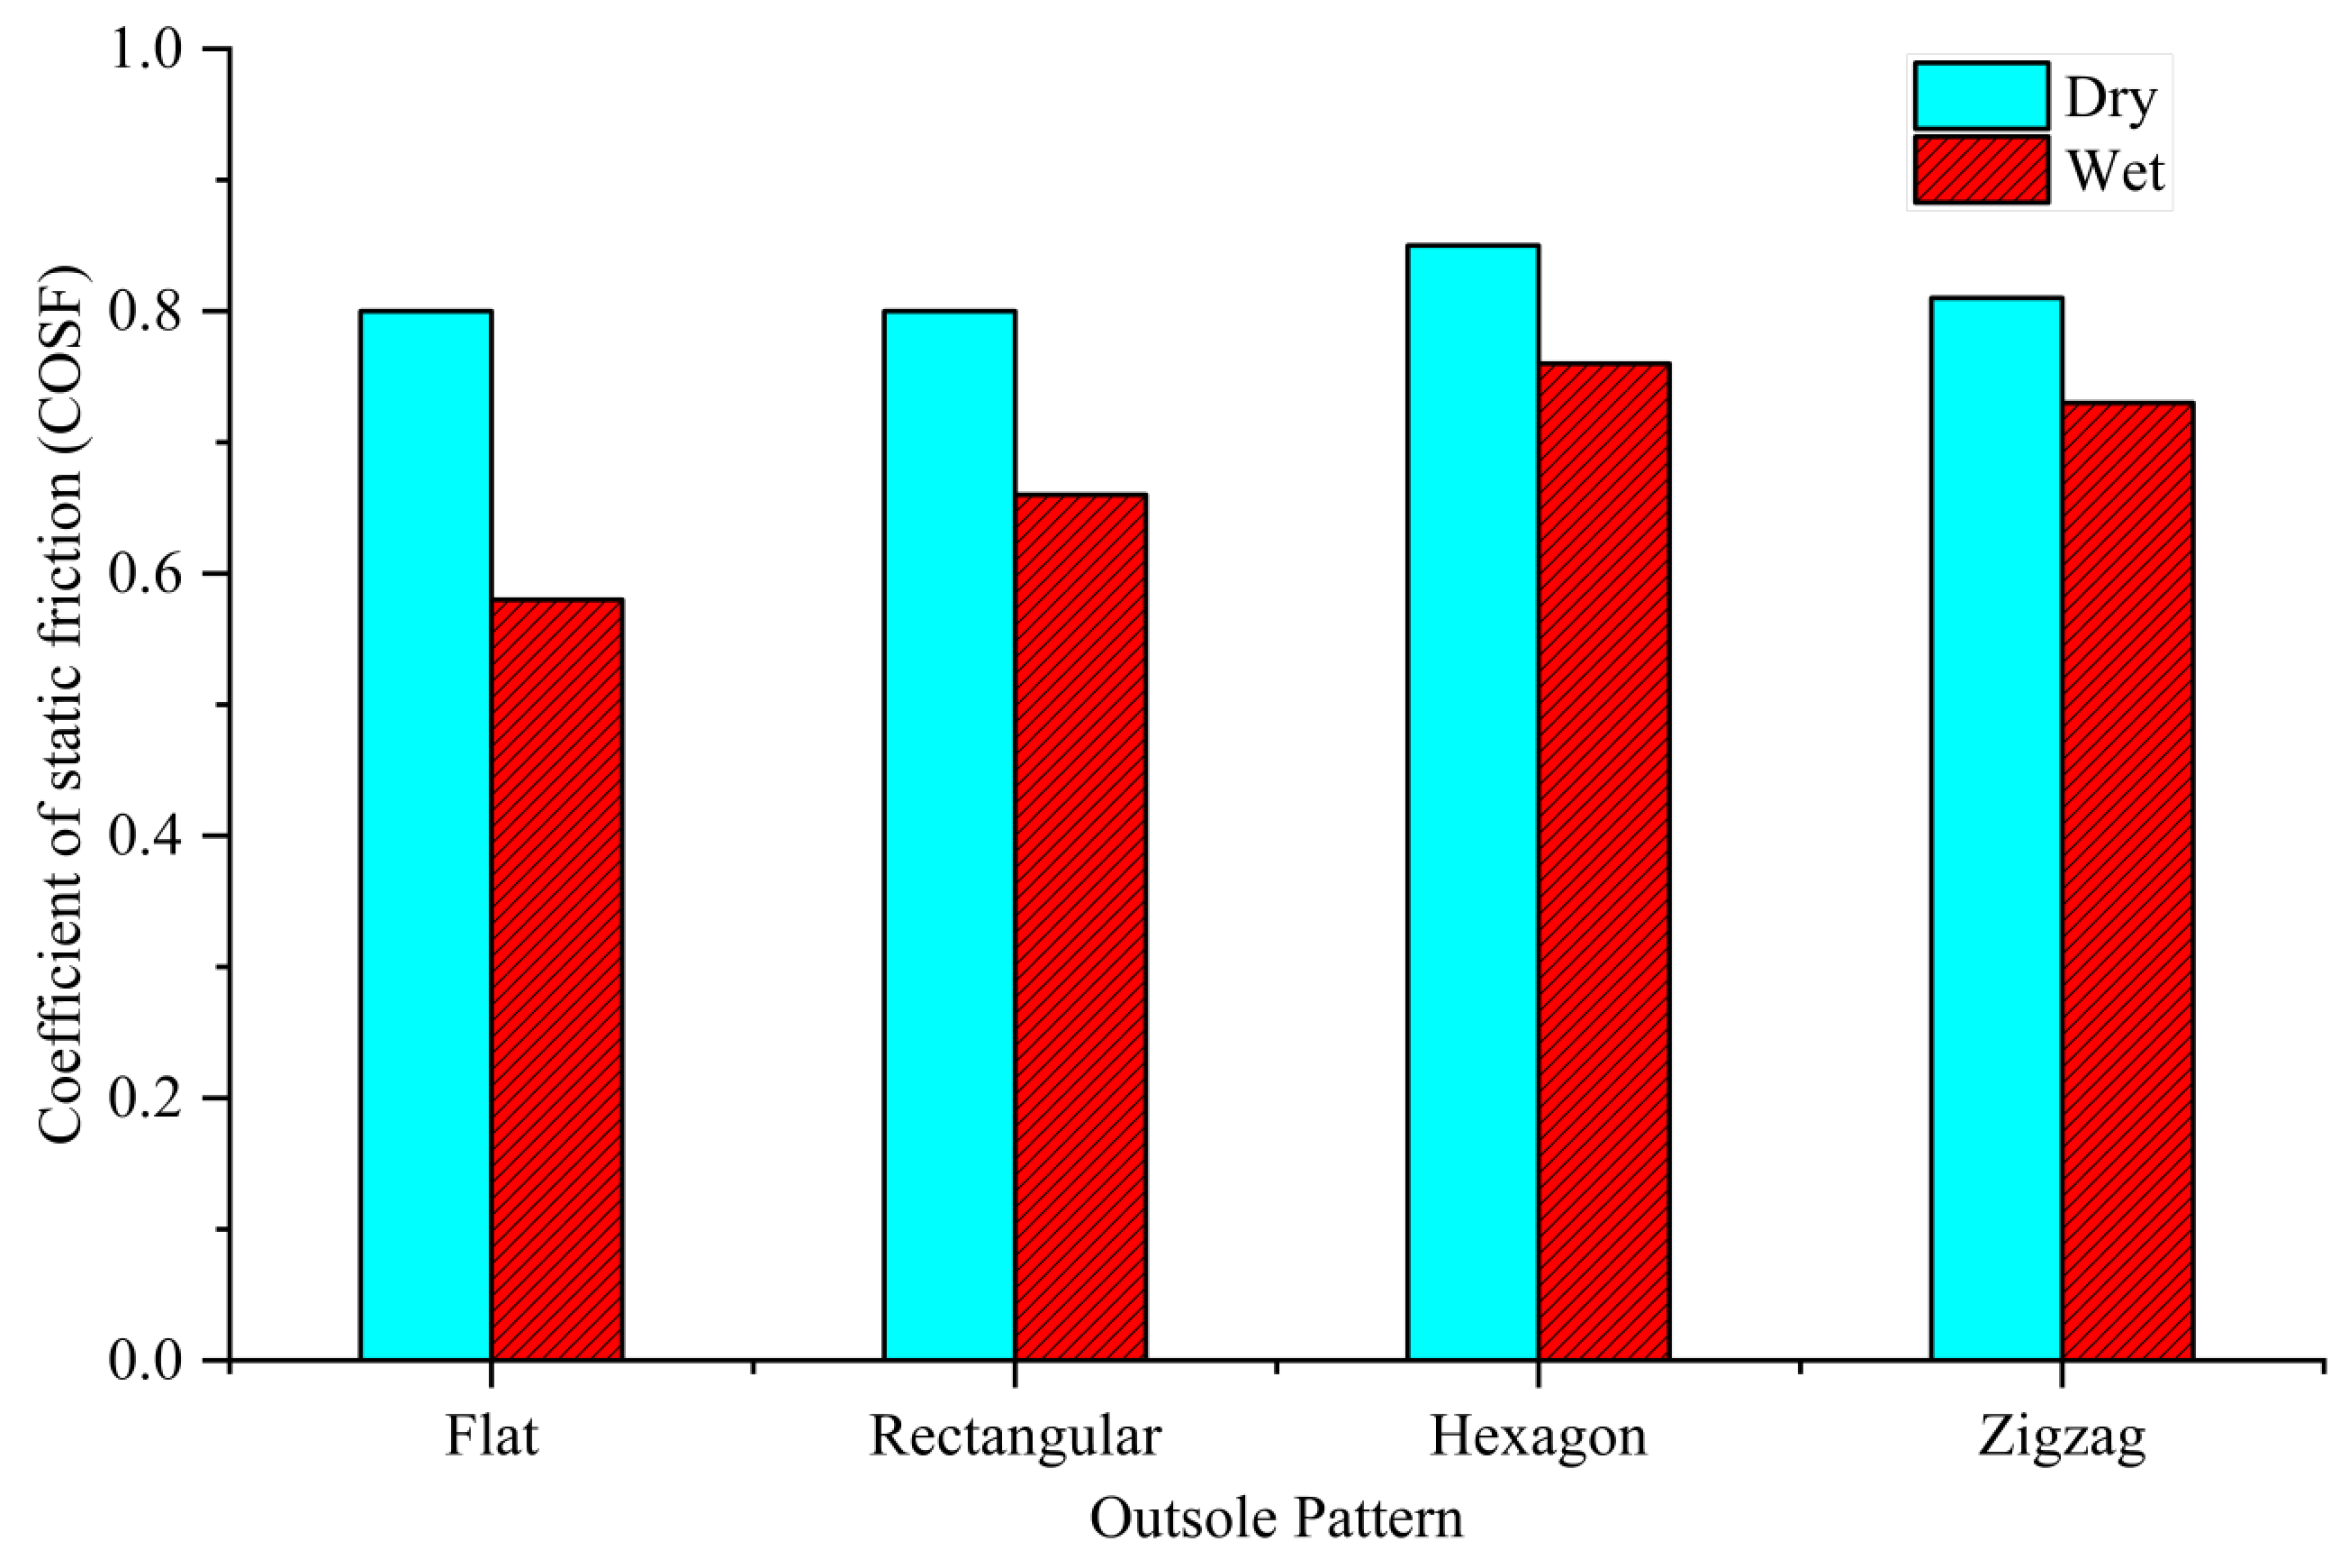
5.2. Relationship between Outsole Pattern and COSF

Four outsole patterns, namely flat, rectangular, hexagon, and zigzag with shore hardness A25 (as shown in Figure 10), were employed to investigate the relationship between the geometric parameters of slip specimens and the COSF. From Figure 11, it is evident that the smallest COSF value of 0.58 was observed for the flat pattern in wet conditions, while the largest COSF value of 0.85 was obtained for the hexagon pattern in dry conditions. There were no significant differences in COSF values among the outsole patterns in the dry working condition (0.8 for flat and rectangular, 0.85 for hexagons, and 0.81 for zigzag). However, these patterns had a strong impact on the wet working condition, with COSF values of 0.58 for flat, 0.66 for rectangular, 0.76 for hexagons, and 0.73 for zigzag. This can be attributed to the fact that patterns with open contours, which facilitate drainage, result in an enhanced COSF. Interestingly, the rectangular pattern did not provide the highest COSF as expected, suggesting that the ratio between the contact area and the open area of the outsole pattern may influence the COSF. Additionally, the COSF for the zigzag pattern exhibited a slight decrease from 0.81 to 0.73, representing a minimal decrease of 9.9%. This suggests that the zigzag pattern could be a suitable candidate for the outsole pattern.

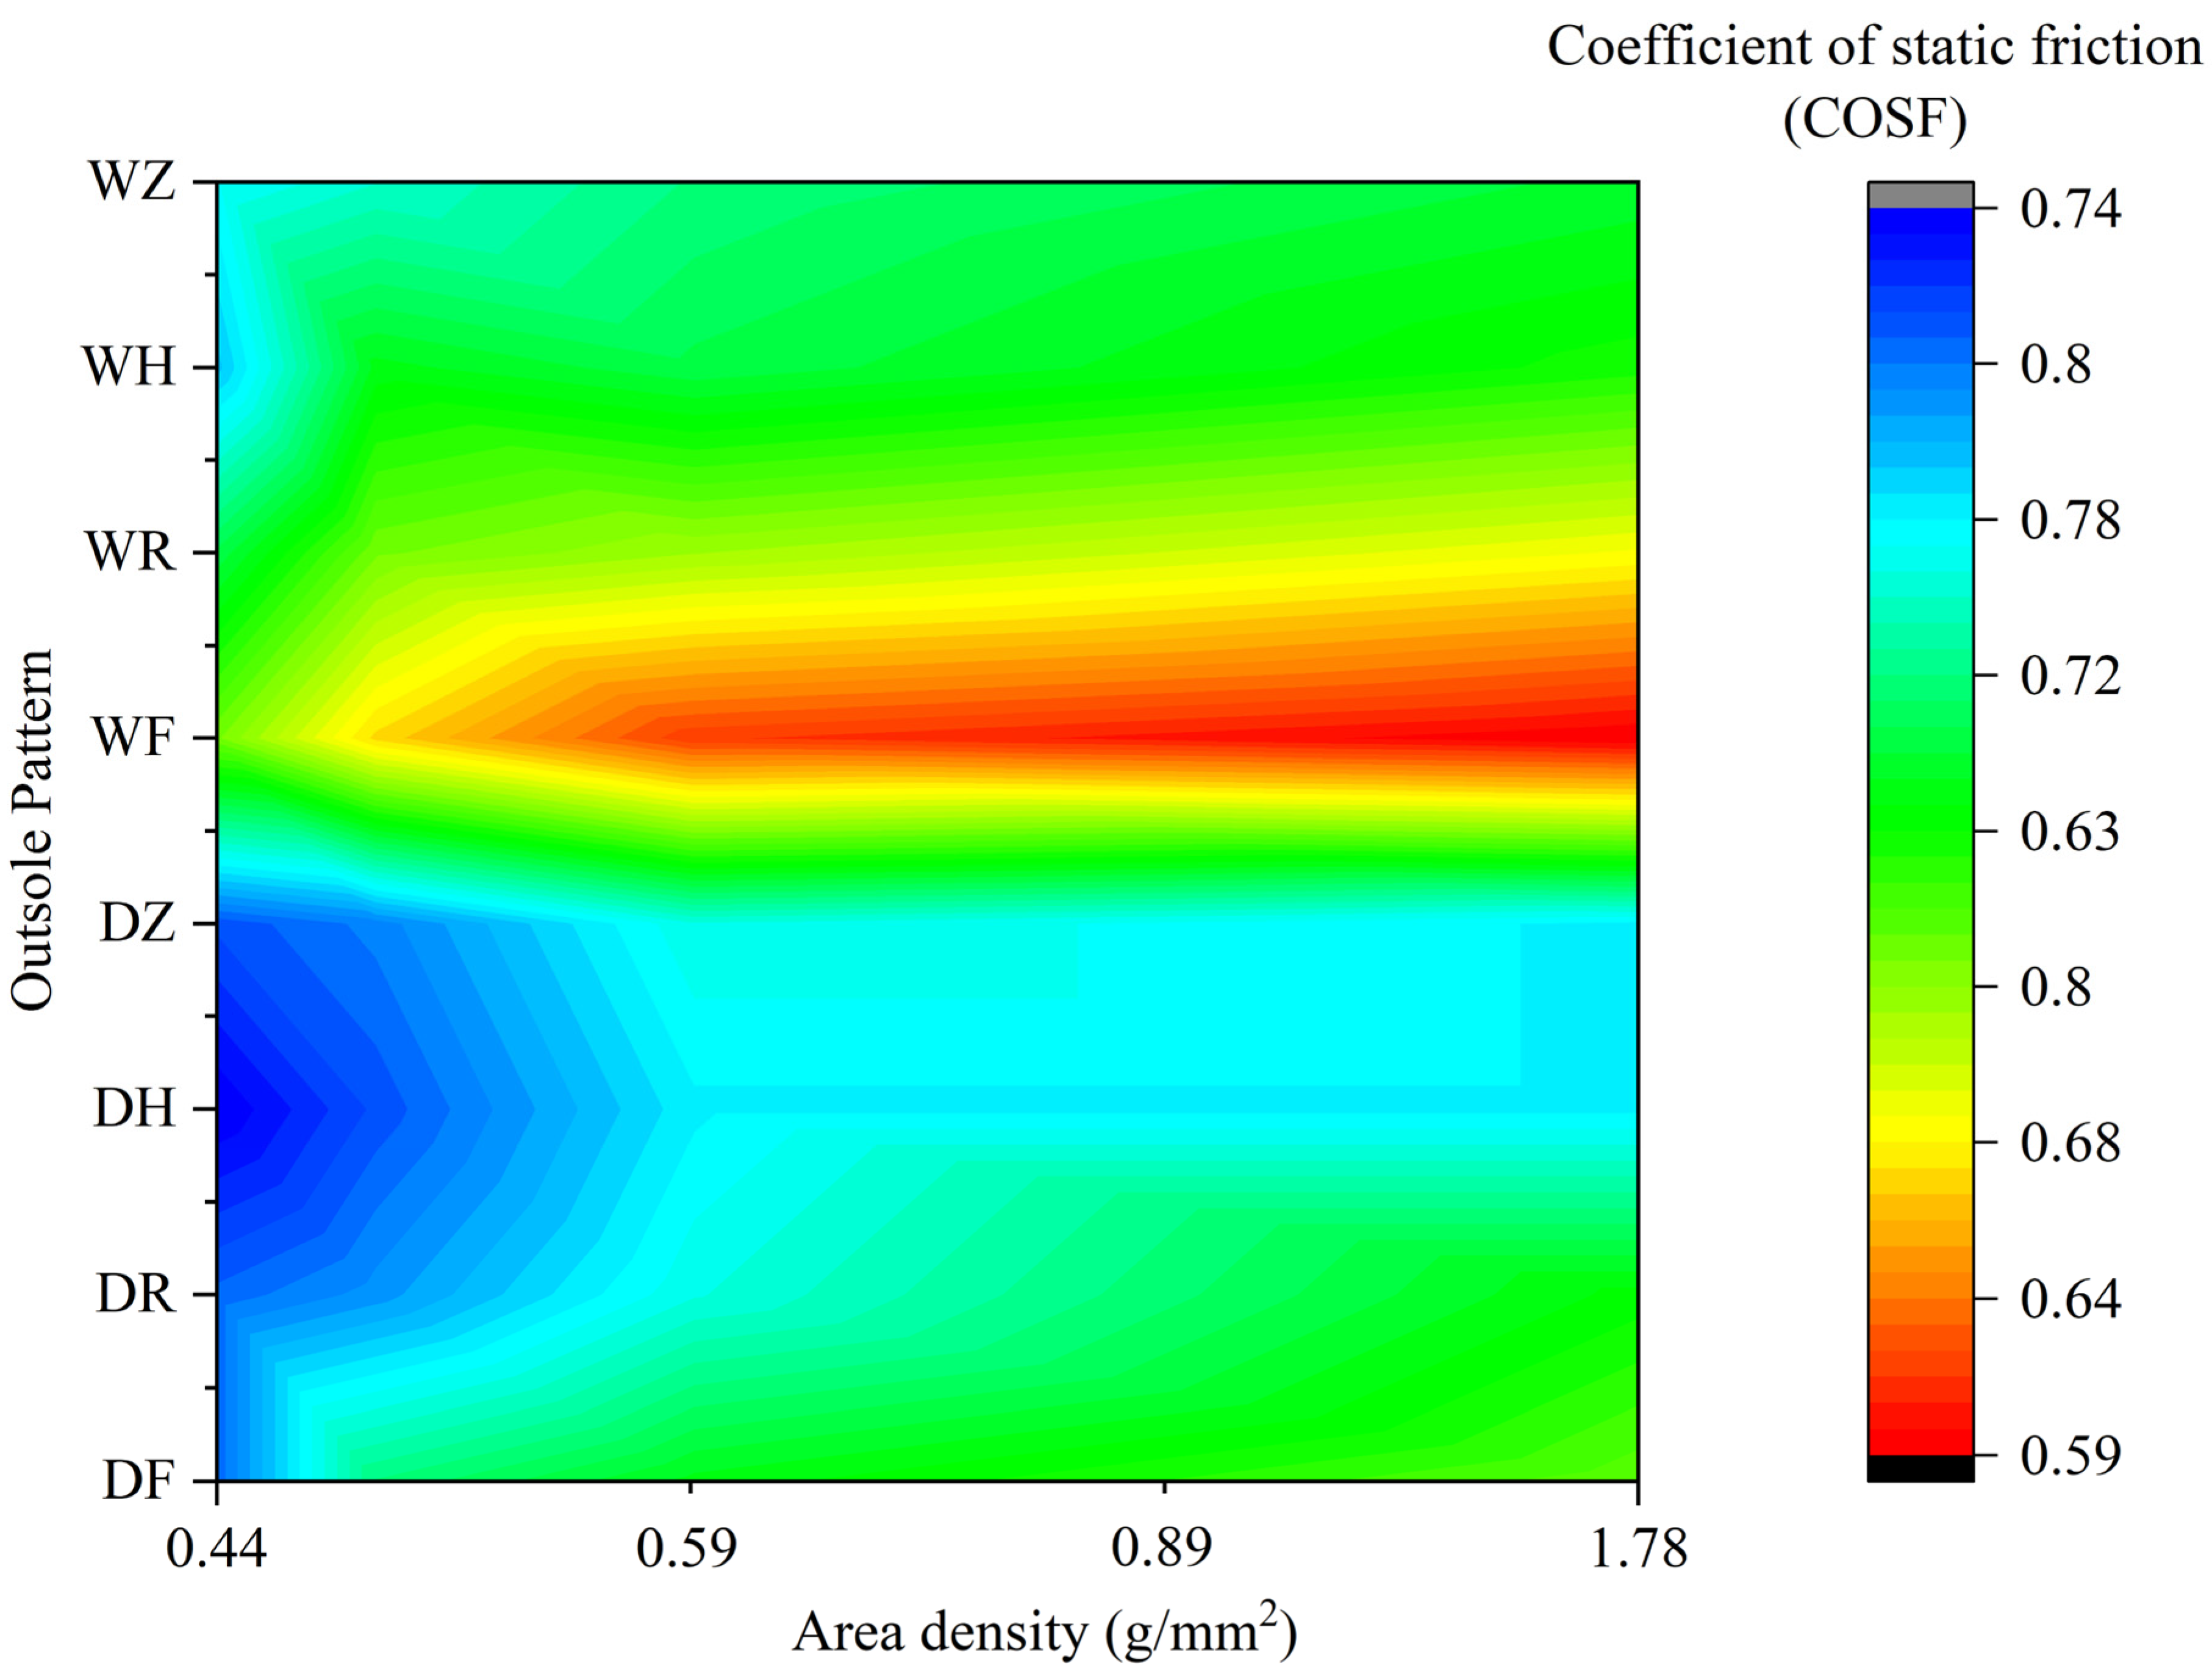
5.3. Relationship between Area Density and COSF

To conduct these tests, the number of slip specimens with the zigzag pattern attached to the underside of the weight-bearing frame was varied from 1 to 4 while ensuring that the PV panel was not scratched. The area density was calculated using the formula ρ = m / A , where ρ represents the area density (g·mm−2), m is the mass of the weight-bearing frame (1600 g), and A is the contact area corresponding to the number of slip specimens used (900 mm2 for each slip specimen). The relationship between the area density (0.44 g·mm−2, 0.59 g·mm−2, 0.89 g·mm−2, and 1.78 g·mm−2) and the COSF is depicted in Figure 12. It is evident that the COSFs showed an increasing trend as the area density decreased. It is worth noting that there were substantial differences in the COSF between the dry and wet working conditions. For instance, when the area density was 1.78 g·mm−2, the COSFs were 0.4 for wet and 0.59 for dry. Conversely, when the area density was 0.44 g·mm−2, the COSFs were 0.58 for wet and 0.8 for dry.
Figure 13 illustrates the correlation between area density, outsole pattern (flat—F, rectangular—R, hexagons—H, and zigzag—Z), and the COSF under wet (W) and dry (D) working conditions. The vertical axis represents the outsole patterns, while the horizontal axis represents the area density. This graph can be used to determine the suitable outsole pattern for a given area density, ensuring the safe operation of the PV cleaning robot equipped with the belt-based track and specific geometric grooves in either wet or dry conditions. For example, it is not recommended to use track grooves with a flat pattern in wet conditions, regardless of the area density, due to a low COSF range (<0.68). On the other hand, the track grooves with hexagon or zigzag patterns at low area densities (e.g., 0.44 g·mm−2) can provide the necessary safety for the PV cleaning robot to operate in wet conditions.
In summary, the results of the experiment may show that the unevenness of COSF in all cases is caused by the different sizes of specimens that were used for each scenario. However, the objective of this research was to evaluate the effectiveness of the proposed design of the testing apparatus; hence, it can be acceptable. Moreover, deep research on the several impacts of coated timing belts in preventing slipping for PV cleaning robots will be the focus of future work.

6. Conclusions

This study aimed to investigate the geometric and shore hardness parameters of tank track grooves manufactured for the belt-based track equipped on PV cleaning robots. A novel slip resistance test apparatus was developed to assess the coefficient of static friction (COSF) of slip specimens. The evaluation involved four outsole patterns (flat, rectangular, hexagons, and zigzag), four area densities (0.44 g·mm−2, 0.59 g·mm−2, 0.89 g·mm−2, and 1.78 g·mm−2), and eleven shore hardness levels (ranging from A20 to A70) under both dry and wet working conditions.
The results indicated that both shore hardness and area density were significant factors influencing the COSF. Changes in area density had a larger impact on the differences in COSF between dry and wet working conditions compared to shore hardness. Among the outsole patterns, no significant differences in COSF were observed in the dry working condition. However, the hexagon pattern exhibited the highest COSF ( μ s = 0.85 ) in the wet working condition, suggesting that the ratio of contact area to drainage area played a key role in slip resistance.
Based on the findings, it is recommended to design track grooves with hexagon or zigzag patterns and a low area density (e.g., 0.44 g·mm−2) to ensure the safety of PV cleaning robot operations in both dry and wet working conditions. However, it should be noted that this study focused solely on COSF measurement, and the coefficient of kinetic friction could also impact slip resistance. Further research is recommended to investigate the ratio of area density to drainage area, as well as the coefficient of kinetic friction, in order to understand their effects in real-world environments.

Author Contributions

Conceptualization, M.T.N. and C.T.T.; methodology, M.T.N. and H.H.N.; software, M.T.N.; validation, A.D.H.N., C.T.T. and V.T.D.; formal analysis, A.D.H.N. and H.H.N.; investigation, H.H.N.; resources, C.T.T.; data curation, M.T.N. and V.T.D.; writing—original draft preparation, H.H.N., M.T.N., and C.T.T.; writing—review and editing, V.T.D. and T.T.N.; visualization, M.T.N. and A.D.H.N.; supervision, H.H.N.; project administration, T.T.N.; funding acquisition, T.T.N. All authors have read and agreed to the published version of the manuscript.

Funding

This research was funded by the Vietnam National University, Ho Chi Minh City (VNU-HCM) under grant number TX2023-20b-01.

Institutional Review Board Statement

Not applicable.

Informed Consent Statement

Not applicable.

Data Availability Statement

The data presented in this study are available on request from the corresponding author. The data are not publicly available due to privacy.

Acknowledgments

This research was funded by the Vietnam National University, Ho Chi Minh City (VNU-HCM) under grant number TX2023-20b-01. We acknowledge the support, regarding time and facilities, provided by the National Key Laboratory of Digital Control and System Engineering (DCSELab), Ho Chi Minh City University of Technology (HCMUT), and VNU-HCM during this study.

Conflicts of Interest

The authors declare no conflict of interest.

References

  1. Sayyah, A.; Horenstein, M.; Mazumder, M. Energy yield loss caused by dust deposition on photovoltaic panels. Sol. Energy 2014, 107, 576–604. [Google Scholar] [CrossRef]
  2. Jiang, H.; Lu, L.; Sun, K. Experimental investigation of the impact of airborne dust deposition on the performance of solar photovoltaic (PV) modules. Atmos. Environ. 2011, 45, 4299–4304. [Google Scholar] [CrossRef]
  3. Abderrezek, M.; Fathi, M. Experimental study of the dust effect on photovoltaic panels’ energy yield. Sol. Energy 2017, 142, 308–320. [Google Scholar] [CrossRef]
  4. Sebbagh, T.; Kelaiaia, R.; Zaatri, A. An experimental validation of the effect of partial shade on the I-V characteristic of PV panel. Int. J. Adv. Manuf. Technol. 2018, 96, 4165–4172. [Google Scholar] [CrossRef]
  5. Ghazi, S.; Sayigh, A.; Ip, K. Dust effect on flat surfaces—A review paper. Renew. Sustain. Energy Rev. 2014, 33, 742–751. [Google Scholar] [CrossRef]
  6. Kazem, H.; Chaichan, M.; Al-Waeli, A.; Sopian, K. A review of dust accumulation and cleaning methods for solar photovoltaic systems. J. Clean. Prod. 2020, 276, 123–187. [Google Scholar] [CrossRef]
  7. Jesus, M.; Timò, G.; Agustín-Sáenz, C.; Braceras, I.; Cornelli, M.; Ferreira, A. Anti-soiling coatings for solar cell cover glass: Climate and surface properties influence. Sol. Energy Mater. Sol. Cells 2018, 299, 517–523. [Google Scholar] [CrossRef]
  8. Mejia, F.; Kleissl, J.; Bosch, J. The effect of dust on solar photovoltaic systems. Energy Procedia 2014, 49, 2370–2376. [Google Scholar] [CrossRef]
  9. Assi, A.; Hassan, A.; Al-Shamisi, M.; Hejase, H. Removal of air blown dust from photovoltaic arrays using forced air flow of return air from air conditioning systems. In Proceedings of the International Conference on Renewable Energies for Developing Countries (REDEC), Beirut, Lebanon, 28–29 November 2012; pp. 1–5. [Google Scholar]
  10. Tanesab, J.; Parlevliet, D.; Whale, J.; Urmee, T. Dust Effect and its Economic Analysis on PV Modules Deployed in a Temperate Climate Zone. Energy Procedia 2016, 100, 65–68. [Google Scholar] [CrossRef]
  11. Zorrilla-Casanova, J.; Piliougine, M.; Carretero, J.; Bernaola, P.; Carpena, P.; Mora-Lopez, L.; Sidrach-de-Cardona, M. Analysis of Dust Losses in Photovoltaic Modules. In Proceedings of the Linköping Electronic Conference, Linköping, Sweden, 8–13 May 2011; pp. 2985–2992. [Google Scholar]
  12. Al Shehri, A.; Parrott, B.; Carrasco, P.; Al Saiari, H.; Taie, I. Accelerated testbed for studying the wear, optical and electrical characteristics of dry cleaned PV solar panels. Sol. Energy 2017, 146, 8–19. [Google Scholar] [CrossRef]
  13. Le, N.T.; Nguyen, M.D.; Phan, T.D.; Truong, C.T.; Duong, V.T.; Nguyen, H.H.; Nguyen, T.T. Development of a Multi-Suspension Unit for Solar Cleaning Robots to Mitigate Vibration Impact on Photovoltaic Panels. Appl. Sci. 2023, 13, 12104. [Google Scholar] [CrossRef]
  14. Mazumder, M.K.; Sharma, R.; Biris, A.S.; Horenstein, M.N.; Zhang, J.; Ishihara, H.; Stark, J.W.; Blumenthal, S.; Sadder, O. Electrostatic Removal of Particles and its Applications to Self-Cleaning Solar Panels and Solar Concentrators. In Developments in Surface Contamination and Cleaning; William Andrew Publishing: Norwich, NY, USA, 2011; pp. 149–199. [Google Scholar]
  15. Park, B.; Im, H.; Im, M.; Choi, K. Self-cleaning effect of highly water-repellent microshell structures for solar cell applications. Mater. Chem. 2011, 21, 633–636. [Google Scholar] [CrossRef]
  16. Verma, K.; Sakhuja, M.; Son, J.; Danner, J.; Yang, H.; Zeng, C.; Bhatia, S. Self-cleaning and antireflective packaging glass for solar modules. Renew. Energy 2011, 36, 2489–2493. [Google Scholar] [CrossRef]
  17. Vasiljev, P.; Borodinas, S.; Bareikis, R.; Struckas, A. Ultrasonic system for solar panel cleaning. Sens. Actuators A Phys. 2013, 200, 74–78. [Google Scholar] [CrossRef]
  18. Figgis, B.; Bermudez, V.; Garcia, J. PV module vibration by robotic cleaning. Sol. Energy 2023, 250, 168–172. [Google Scholar] [CrossRef]
  19. Figgis, B.; Bermudez, V.; Garcia, J. Effect of cleaning Robot’s moving shadow on PV string. Sol. Energy 2023, 254, 1–7. [Google Scholar] [CrossRef]
  20. Anderson, M.; Grandy, A.; Hastie, J.; Sweezey, A.; Ranky, R.; Mavroidis, C.I.; Markopoulos, Y.P. Robotic device for cleaning photovoltaic panel arrays. In Mobile Robotics: Solutions and Challenges; World Scientific Publishing: Singapore, 2010; pp. 367–377. [Google Scholar]
  21. Hammoud, M.; Shokr, B.; Assi, A.; Hallal, J.; Khoury, P. Effect of dust cleaning on the enhancement of the power generation of a coastal PV-power plant at Zahrani Lebanon. Sol. Energy 2019, 184, 195–201. [Google Scholar] [CrossRef]
  22. Solar Panel Array Cleaning Robot. Available online: http://www.washpanel.com/en/prodotti.php (accessed on 31 May 2023).
  23. Kumar, N.; Sudhakar, K.; Samykano, M.; Sukumaran, S. Dust cleaning robots (DCR) for BIPV and BAPV solar power plants—A conceptual framework and research challenges. Procedia Comput. Sci. 2018, 133, 746–754. [Google Scholar] [CrossRef]
  24. Ecoppia’s Remote Automatic Solar Panel Cleaning System Reduces O&M Costs | Ecoppia. Available online: https://www.ecoppia.com/solutions (accessed on 31 May 2023).
  25. GEKKO Solar Hightec Robot. Available online: https://www.serbot.ch/en/solar-panels-cleaning/gekko-solar-robot (accessed on 31 May 2023).
  26. Sorndach, M.; Pudchuen, N.; Srisungsitthisunti, P. Rooftop Solar Panel Cleaning Robot Using Omni Wheels. In Proceedings of the 2nd International Conference on Engineering Innovation, Bangkok, Thailand, 5–6 July 2018; pp. 7–12. [Google Scholar]
  27. Fan, S.; Liang, W.; Wang, G.; Zhang, Y.; Cao, S. A novel water-free cleaning robot for dust removal from distributed photovoltaic (PV) in water-scarce areas. Sol. Energy 2022, 241, 553–563. [Google Scholar] [CrossRef]
  28. Ronnaronglit, N.; Maneerat, N. A cleaning robot for solar panels. In Proceedings of the 5th International Conference on Engineering, Applied Sciences and Technology, Luang Prabang, Laos, 2–5 July 2019; pp. 1–4. [Google Scholar]
  29. Antonelli, M.; Zobel, P.; Marcellis, A.; Palange, E. Autonomous robot for cleaning photovoltaic panels in desert zones. Mechatronics 2020, 68, 553–563. [Google Scholar] [CrossRef]
  30. Solar Panel Cleaning Robot. Available online: https://solarcleano.com/en/ (accessed on 31 May 2023).
  31. pvClean Robot. Available online: https://www.serbot.ch/en/solar-panels-cleaning/pvclean-robot (accessed on 31 May 2023).
  32. Phan, T.D.; Nguyen, M.D.; Auffray, M.; Le, N.T.; Truong, C.T.; Duong, V.T.; Nguyen, H.H.; Nguyen, T.T. Research Impact of Solar Panel Cleaning Robot on Photovoltaic Panel’s Deflection. arXiv 2023, arXiv:2306.05340. [Google Scholar]
  33. Mohan, R.; Das, B.; Sundaresan, R. Effect of hardness and surface roughness on slip resistance of rubber. J. Test. Eval. 2015, 43, 1574–1586. [Google Scholar] [CrossRef]
  34. Chang, W. The effect of surface roughness on the measurement of slip resistance. Int. J. Ind. Ergon. 1999, 24, 299–313. [Google Scholar] [CrossRef]
  35. Tsai, Y.; Powers, C. Increased shoe sole hardness results in compensatory changes in the utilized coefficient of friction during walking. Gait Posture 2009, 30, 303–306. [Google Scholar] [CrossRef]
  36. Kim, I. A study on wear development of floor surfaces: Impact on pedestrian walkway slip-resistance performance. Tribol. Int. 2016, 95, 316–323. [Google Scholar] [CrossRef]
  37. Nguyen, M.T.; Truong, C.T.; Nguyen, V.T.; Duong, V.T.; Nguyen, H.H.; Nguyen, T.T. Research on Adhesive Coefficient of Rubber Wheel Crawler on Wet Tilted Photovoltaic Panel. Appl. Sci. 2022, 12, 6605. [Google Scholar] [CrossRef]
  38. Hoang, N.A.D.; Truong, C.T.; Nguyen, M.T.; Nguyen, D.A.; Duong, V.T.; Nguyen, H.H.; Nguyen, T.T. Slip Resistance Test Apparatus of Synthetic Rubber Trackpad on Photovoltaic Surface. In Proceedings of the 20th International Conference on Ubiquitous Robots (UR), Honolulu, HI, USA, 25–28 June 2023; pp. 183–190. [Google Scholar]
Figure 1. PV cleaning robot equipped with two belt-based track mechanisms.
Applsci 14 00145 g001
Figure 2. Free body diagram of displacement mass on tilt surface.
Applsci 14 00145 g002
Figure 3. CAD model of slip resistance test apparatus with (a) a chassis, (b) a PV panel, (c) a displacement mass, (d) a weight-bearing frame, (e) an electronic load cell, (f) adjustable water sprayer nozzles (a), (g) a stepper motor, (h) a ball screw, (i) a ball screw nut, (j) casters, (k) strut bars, and (l) hinges (b).
Applsci 14 00145 g003
Figure 4. Kinematic diagram of hinged lever mechanism.
Applsci 14 00145 g004
Figure 5. Theoretical and measured tilted angle.
Applsci 14 00145 g005
Figure 6. Coefficient of static friction measurement.
Applsci 14 00145 g006
Figure 7. Practical slip resistance test apparatus.
Applsci 14 00145 g007
Figure 8. Shore hardness measurement on slip specimen using durometer.
Applsci 14 00145 g008
Figure 9. Relationship between shore hardness of slip specimens and COSF in dry/wet working conditions.
Applsci 14 00145 g009
Figure 10. Outsole patterns of track grooves exposed to slip resistance test apparatus.
Applsci 14 00145 g010
Figure 11. Relationship between outsole pattern of slip specimens and COSF.
Applsci 14 00145 g011
Figure 12. Relationship between area density and COSF.
Applsci 14 00145 g012
Figure 13. Correlation of area density, outsole patterns, and COSF.
Applsci 14 00145 g013
Table 1. Comparison of PV panel cleaning methods.
ApproachYearAuthorsDescriptionAdvantageDisadvantage
Forced air flow of air conditioning systems [9]2012Assi et al.The method uses available air conditioning systems in the proposed cleaning PV.Reduces the PV temperature in addition to PV cleaning.In areas without air conditioning systems, this method has a fatal limitation.
Natural cleaning using rain/wind [10]2016Tanesab et al.Natural conditions, which comprise wind, rainfall, etc., are mined to clean dirt from the PV surface.The accumulation of dust on the PV surface is effectively reduced.The PV surface is not comprehensively cleaned, which is affected by the environment and area of the solar farm.
Manual cleaning [11]2011Zorrilla-Casanova et al.The nozzle emits a high-pressure water flow to the PV surface to remove the accumulated dust particles.Enhances the effectiveness of cleaning and cooling the PV surface.Implementing this method in water-
scarce areas and expansive PV farms could be challenging and costly.
Mechanical cleaning (blowing or brushing) [12]2017Al Shehri et al.Manpower is the primary determinant in the resourceful removal of dust by using cloths or brushes.The cleaning quality of PV surfaces is remarkably effective.The performance of PV systems exhibits disparities across various regions.
Mechanical cleaning using PV cleaning robot [13]2023Le, N.T. et al.The robot forcefully removes the dust with a combination of water and a brush.The PV cleaning robot surpasses significantly in both flexibility and cleaning efficiency [8]The operator is required to possess proficient observation and control skills.
Electrical screens [14]2011Mazumder et al.The electro-dynamic display enables the automatic and uninterrupted elimination of accumulated dry dust.Dust particle removal is effective and straightforward.The conduct of this method necessitates elevated voltage, a converter, a digital signal device, and incurs significant costs in its implementation.
Super-hydrophobic aircraft (SHOP) [15]2011Park et al.The outer layer, which is a super hydrophobic aircraft, covered the PV surface and made the water not stick to it.The SHOP method maximizes natural conditions such as rain, dew, etc., and has no requirement for water or human involvement.The dry environments are unsuitable for the application of this technique.
Super water jet (SHIP) [16]2011Verma et al.The surface of the water is specially designed to reduce dust accumulation.This technique proves efficient in breaking down and dissolving dirt.The SHIP method does not improve the full recovery of PV panel efficiency; the protection layer on the PV surface deteriorates due to ultraviolet radiation.
Self-cleaning ultrasonic [17]2013Vasiljev et al.High-frequency standard ultrasound (up to 20 kHz) is used to remove some of the dust.The requirement for water and human involvement in this method is eliminated.The efficacy is reduced in humid conditions; moreover, the power supply requires dedicated.
Table 2. Definition of working condition states of PV panel.
StatesDescription
Dry (D)The PV panel surface is kept so that there is no water contamination
Wet (W)The PV panel surface is water contaminated with a water flow of 3 L per minute
Disclaimer/Publisher’s Note: The statements, opinions and data contained in all publications are solely those of the individual author(s) and contributor(s) and not of MDPI and/or the editor(s). MDPI and/or the editor(s) disclaim responsibility for any injury to people or property resulting from any ideas, methods, instructions or products referred to in the content.

