Article

Partial Discharge Inception Modelling of Insulating Materials and Systems: Contribution of Electrodes to Electric Field Profile Calculation

by
Giovanni Gardan
1 and
Gian Carlo Montanari
2,*
1
Dipartimento di Ingegneria Industriale, Università degli Studi di Padova, 35131 Padova, Italy
2
Center for Advanced Power Systems, Florida State University, Tallahassee, FL 32310, USA
*
Author to whom correspondence should be addressed.
Appl. Sci. 2024, 14(1), 201; https://doi.org/10.3390/app14010201
Submission received: 2 October 2023 / Revised: 11 December 2023 / Accepted: 20 December 2023 / Published: 25 December 2023
(This article belongs to the Section Materials Science and Engineering)

Abstract

:
Partial discharge inception modeling is a powerful tool for material investigation and insulation system design in order to achieve the objective of PD-free operation of insulation systems. Model validation, however, requires accurate and repeatable testing conditions, and the aim of this paper is to look at the influence of electrodes and electric field simulation on partial discharge inception model prediction accuracy. Awareness of the geometric electrode configuration is important to forecast both the typology of discharge and the corresponding partial discharge inception voltage value. It is shown, in fact, that inaccurate evaluation of electrode shape (e.g., its flat part and contour) might impact significantly on electric field estimation, the typology of incepted discharges, and, thus, on model accuracy, i.e., on partial discharge inception voltage prediction, which is the basis for the partial discharge-free design of insulating materials and systems. In particular, small electrode curvature radius variations do not significantly affect the PDIV value or PD typology identification. However, worsening electrode/insulation specimen contact can significantly impact PD inception and typology evaluation.

1. Introduction

Partial discharge (PD) measurement is a fundamental tool for quality evaluation and diagnostic assessment of insulation systems [1,2]. Indeed, PD is, at the same time, one of the most harmful accelerated degradation causes for organic insulation and a fundamental diagnostic property for condition maintenance planning [3,4,5,6].
Since incoming electrical asset technologies are going to subject insulation systems to extreme stress conditions (particularly due to the progressive replacement of conventional energy transformation with power electronics with higher voltage [7] and specific power [8,9]), care shall be taken to keep under control the acceleration of both intrinsic and extrinsic aging mechanisms [10,11]. As partially discussed in [4] and generally defined in [10], intrinsic aging is related to the effect of maximum stress (e.g., peak electric field) on bulk degradation processes. It is modeled by resorting to typical laws such as the inverse power model for electrical and mechanical stress and the Arrhenius model for thermal stress [4,12,13]. Extrinsic aging has to do with local phenomena, such as hot spots and partial discharges. Even if local, this aging can be the prevailing cause of premature failure because, in general, an insulation system should be seen, from a reliability point of view, as a parallel of infinite microcomponents: failure of one of those causes the failure of the whole system (indeed, the extreme values of failure distributions, such as the Weibull one, stem from this reasoning [14]).
Based on the common consideration that PD is the prevailing cause of premature electrical failure of insulation systems, care should be taken in the design of insulation to ensure that PD is not incepted both at time zero (quality control and commissioning) and during the whole specified life. A fundamental tool should then be made available to insulation designers, that is, partial discharge inception models. A simple, deterministic, but experimentally proven approach to PD inception modeling was provided by Niemeyer [15], and a generalization of his work to cover heuristically both PD incepting in internal defects and surface discharges has been recently presented in [16]. Validation of these models is of utmost importance, whether their broad use at the design stage of an insulation system is foreseen.
This paper deals with a key potential issue, that is, the influence of electrode shape and the relevant electric field calculation on discharge model application and on PD phenomenology, i.e., PD source typology identification. The main purpose is to show, through field simulations, the PD inception model, and experimental tests, how inaccurate modeling of the electrode geometry could lead to wrong/misleading predictions in terms of the PD inception threshold and PD identification. In Section 2, PD inception model results and electric field simulations applied to the test object chosen for this assessment are presented. This section also recalls the “three-leg” approach, i.e., a methodology exploited in this paper, which has been recently proposed to achieve PD-free design of insulation systems. Section 3 shows how geometrical variations of electrode shape impact the inception field and partial discharge inception voltage (PDIV) estimation. This is made by considering two typologies of electrodes, namely electrode A and electrode B, triggering PD on the same dielectric specimens. Eventually, Section 4 validates the forecasts made in Section 3 by means of experimental tests using Electrodes A and B.

2. Background: Partial Discharge Inception Field Modeling and “Three-Leg” Approach

Recently, a new procedure, named the “three-leg” approach, has been proposed to achieve PD-free design of insulation systems. It holds for both AC and DC, and it is based on the following three steps (legs):
  • electric field (and thermal stress) simulation,
  • extrinsic aging threshold modeling (PD inception field and voltage in combination with leg 1),
  • PD measurements for validation of the first two legs.
When the maximum field calculated under leg 1 matches the inception PD field estimated by the model from leg 2, then PD will be triggered in the insulation system under consideration. The voltage at which this occurs is the partial discharge inception voltage (PDIV), which can be validated by proper PD detection. An experimental validation is performed (leg 3) to support the PDIV estimation thus obtained. However, since PD is not just magnitude and repetition rate, PDIV measurements must be carried out with the support of proper hardware/software tools, allowing separation, recognition, and, eventually, identification of the different typologies of source-generating PD, i.e., internal, surface, and corona discharge (according to the descending order of harmfulness).
The most recent innovative approach (described, e.g., in [17]) possesses software for PD acquisition and analysis that is fully automatic and outputs the identification of the type of source-generating PD [18].

2.1. A Model for PD Inception

A simple (even if approximate, being deterministic) general model for PD inception, taken from [15], which is valid for both discharges in gas (due to the orthogonal field component) and discharges on insulation surface/interfaces (due to the tangential field component) is [16]:
E i = E / p c r   p 1 + B p k s d 1 / β
where Ei is the inception field, d is the distance from HV to ground (creepage) or defect height (for surface and gas discharges, respectively), and p is the pressure of the surrounding gas. (E/p)cr, B, and β are empirical parameters whose values change from internal to surface discharges, as shown in Table 1. k s is a scale parameter, taking into account the effective streamer length, that becomes = 1 for a uniform field but <1 in the presence of a field gradient. It sets a sort of uniform field volume around the triple point in which partial discharges can occur at an almost uniform field, near to the peak field value. In the case of internal discharges, k s = 1. If k s = 1 also for surface discharges, then the classic, standardized concept of creepage keeps working, but for k s < 1 (which is the most likely case in power modules and high-energy density assets), PD-free insulation system design must resort to (1) since localized PD (at triple points) is a fundamental cause of premature failure.
An expression for k s , based on the extent of field gradient [16], could be given by:
k s = l 0.9 E m a x + l 0.9 E m a x d
being E m a x the maximum value of tangential surface field obtained from the electric field profile calculation (if it is not monotone), l (0.9Emax)+ and l (0.9Emax) are the horizontal distances on the test object surface, where the tangential fields are 90% of E m a x , considering the negative and positive slopes of the field profile.
To estimate approximately the partial discharge inception voltage, PDIVm, based on the inception field Ei value computed with (1), the linearity of the Laplace equation can be exploited, starting from the relationship between the applied voltage (Vsim) and the resulting peak field, Ep,sim (computed by a FEM software, 1st leg, where, e.g., Vsim = 1 kV) [15]:
V s i m E p , s i m = P D I V m E i .

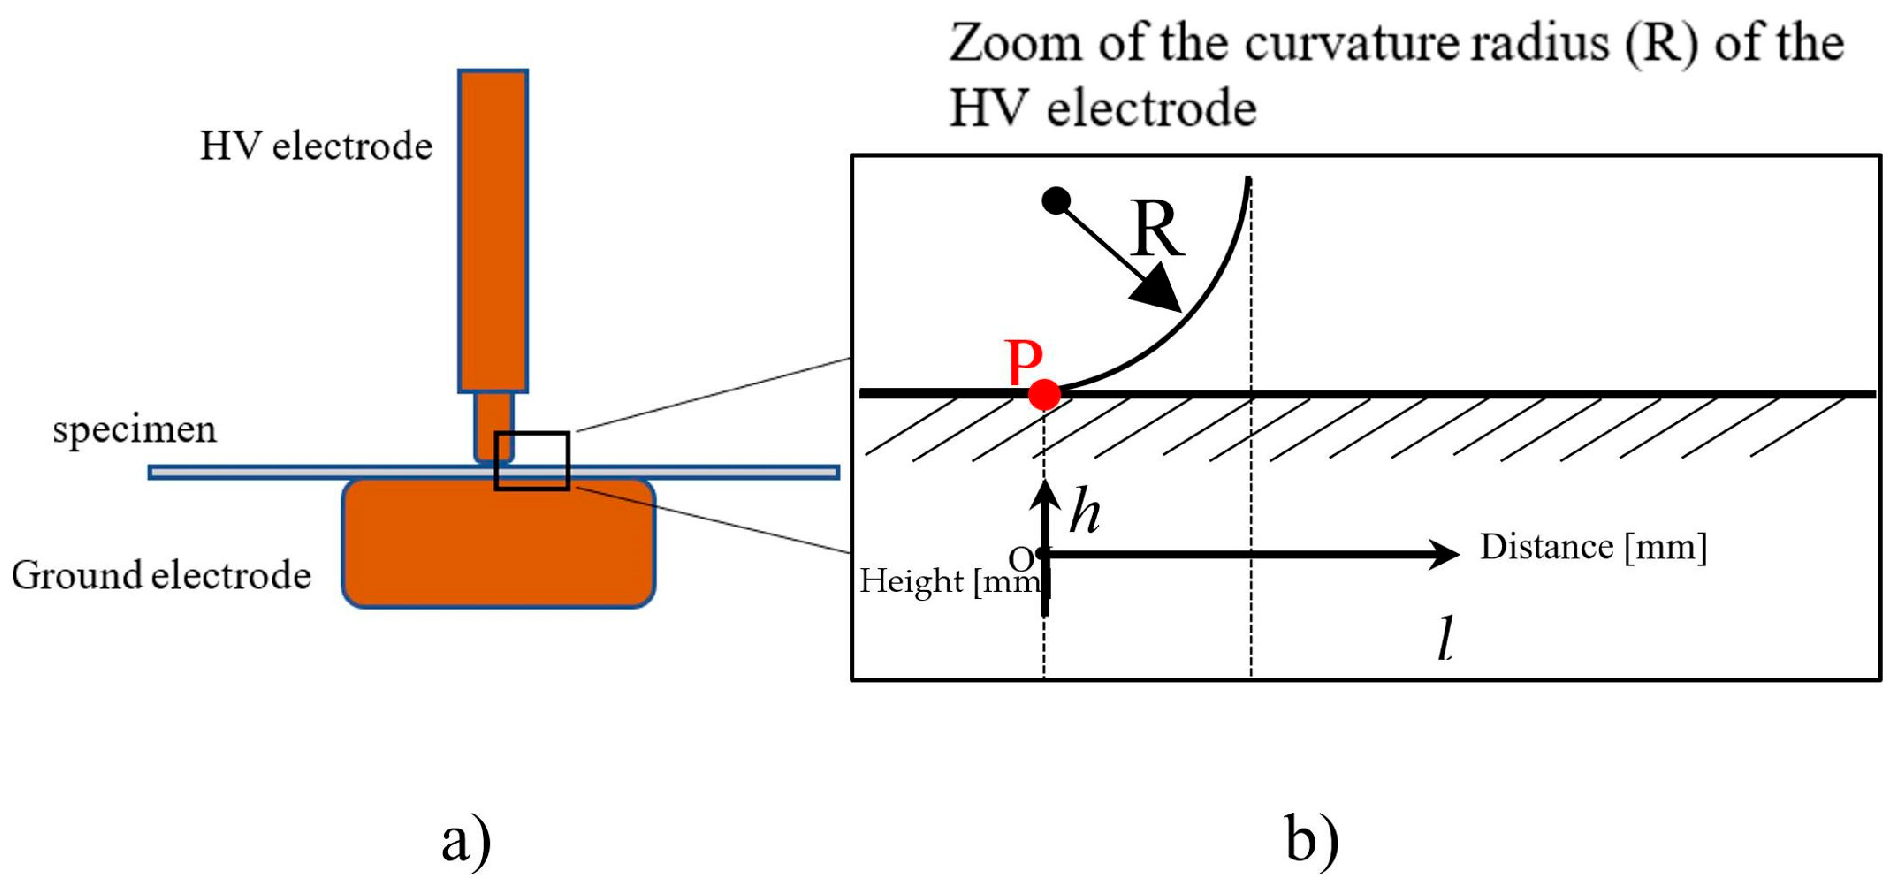
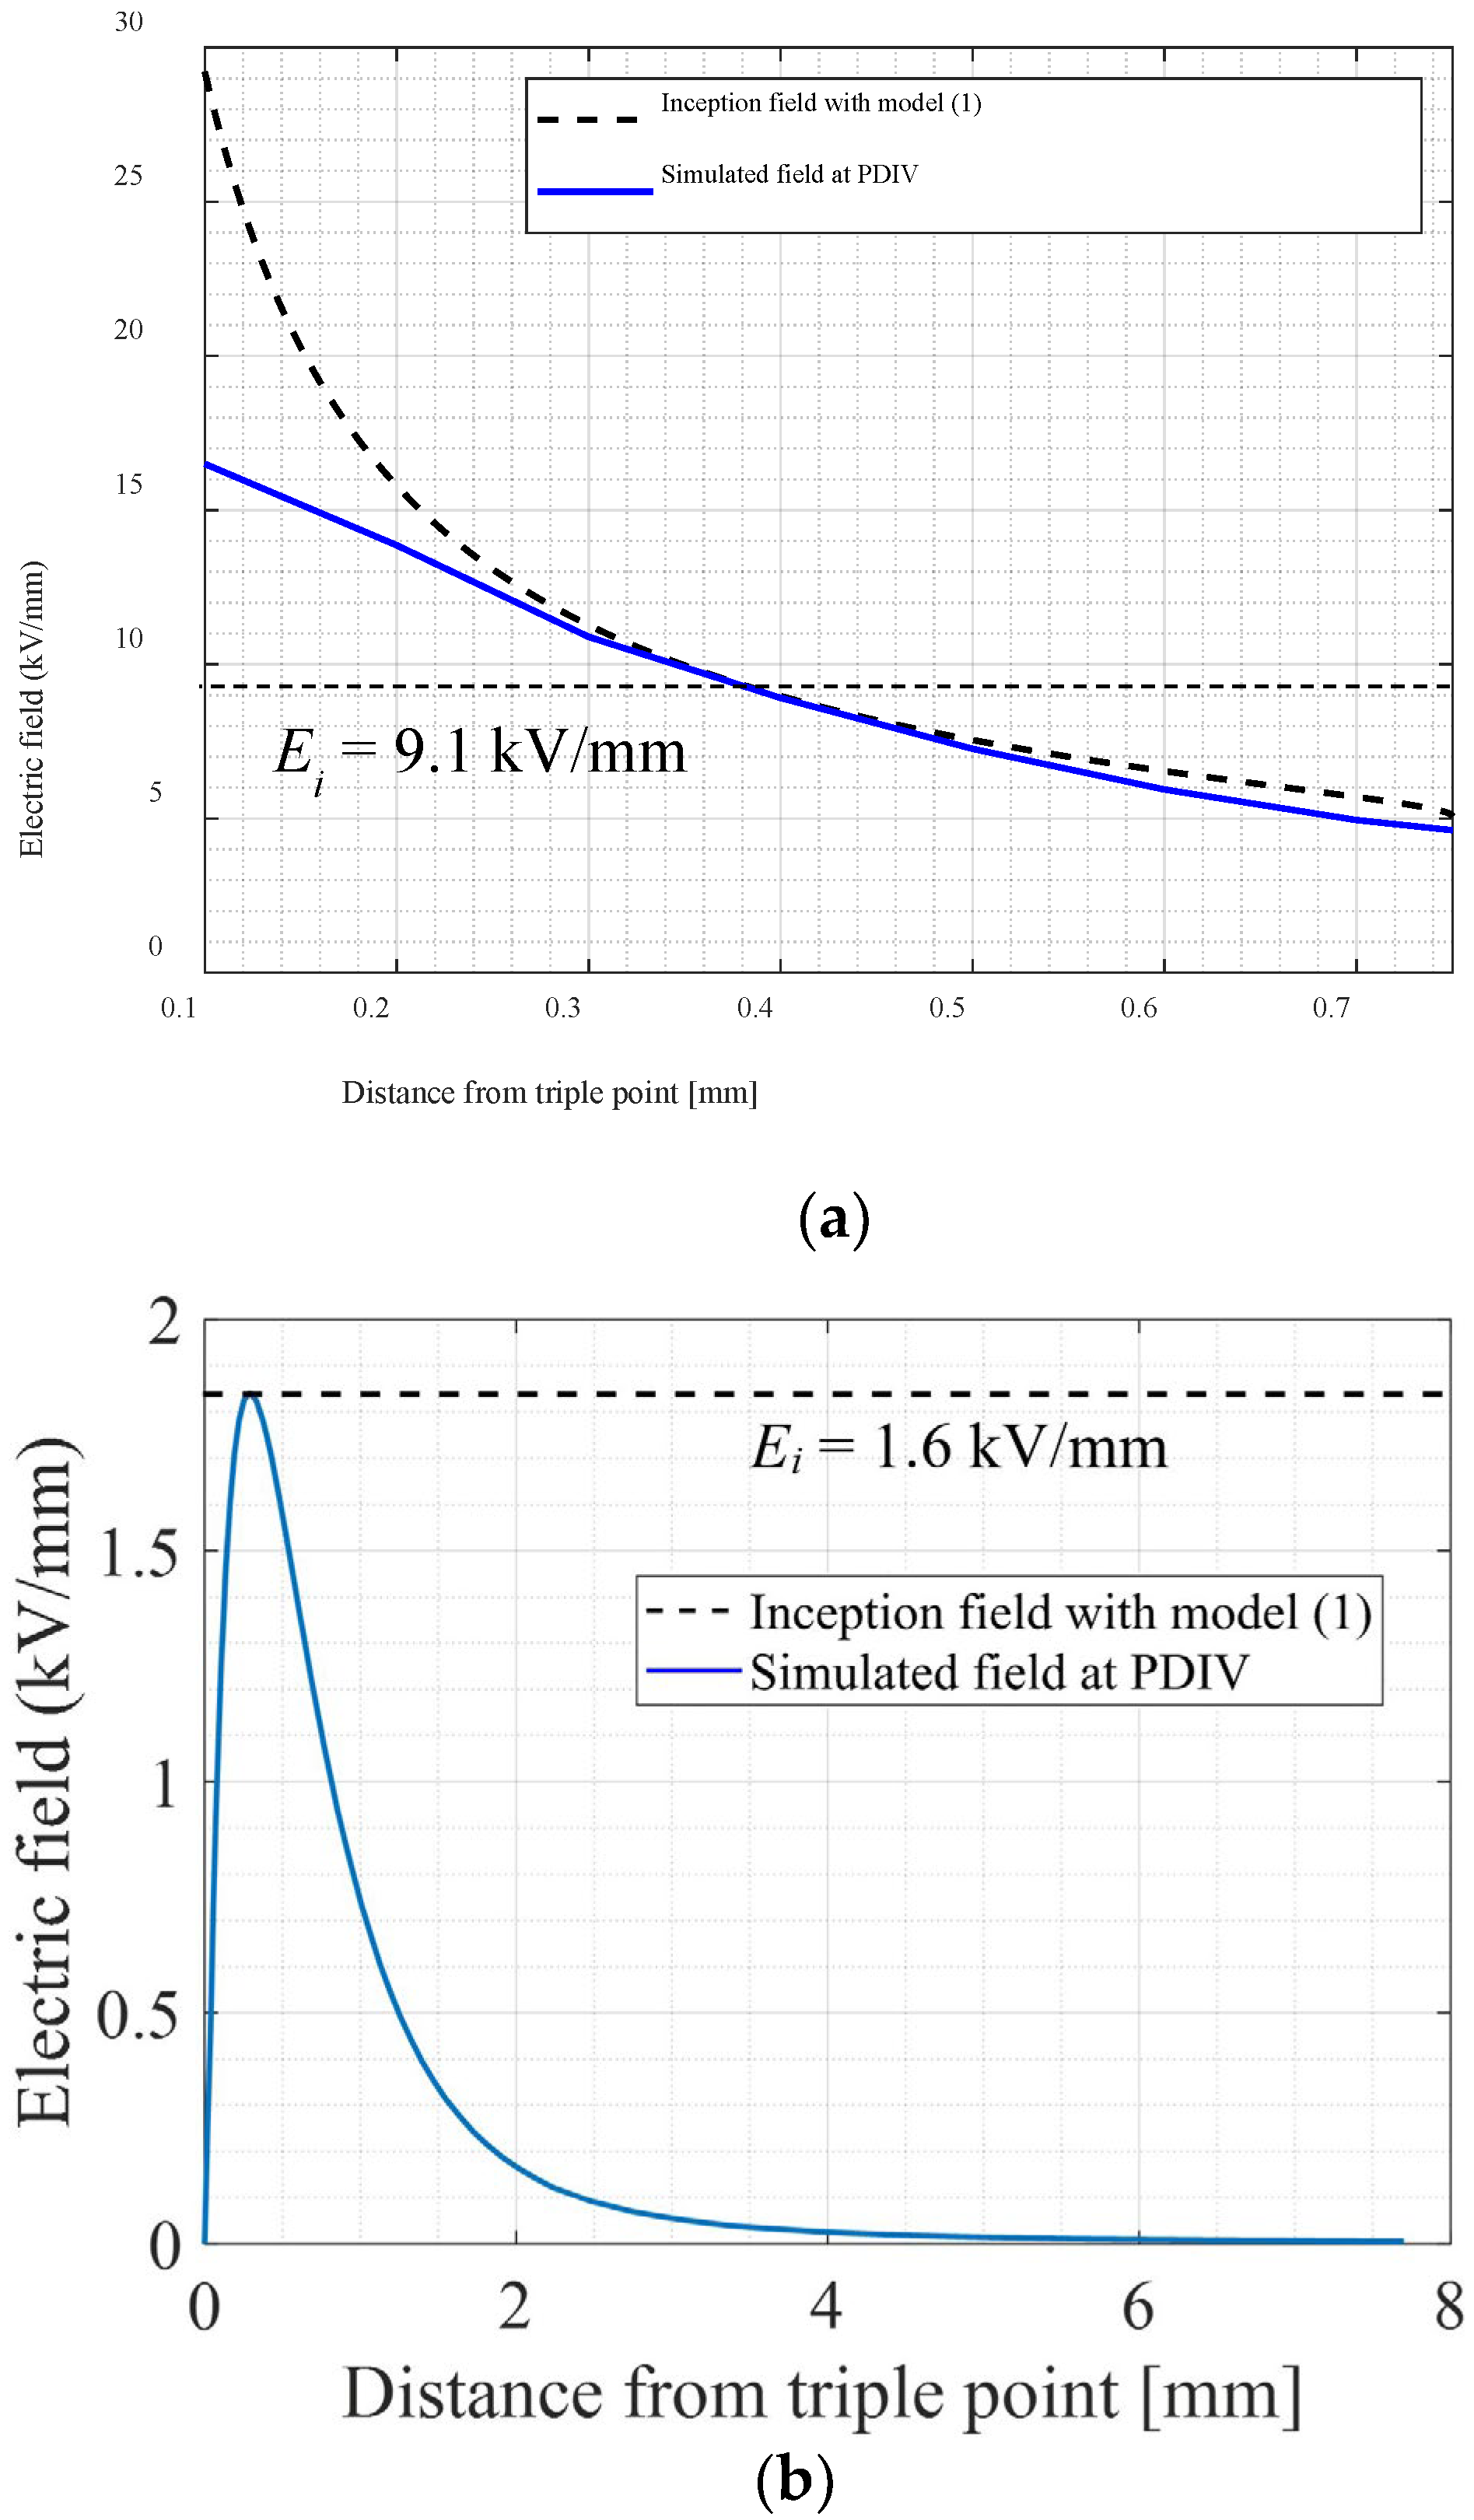
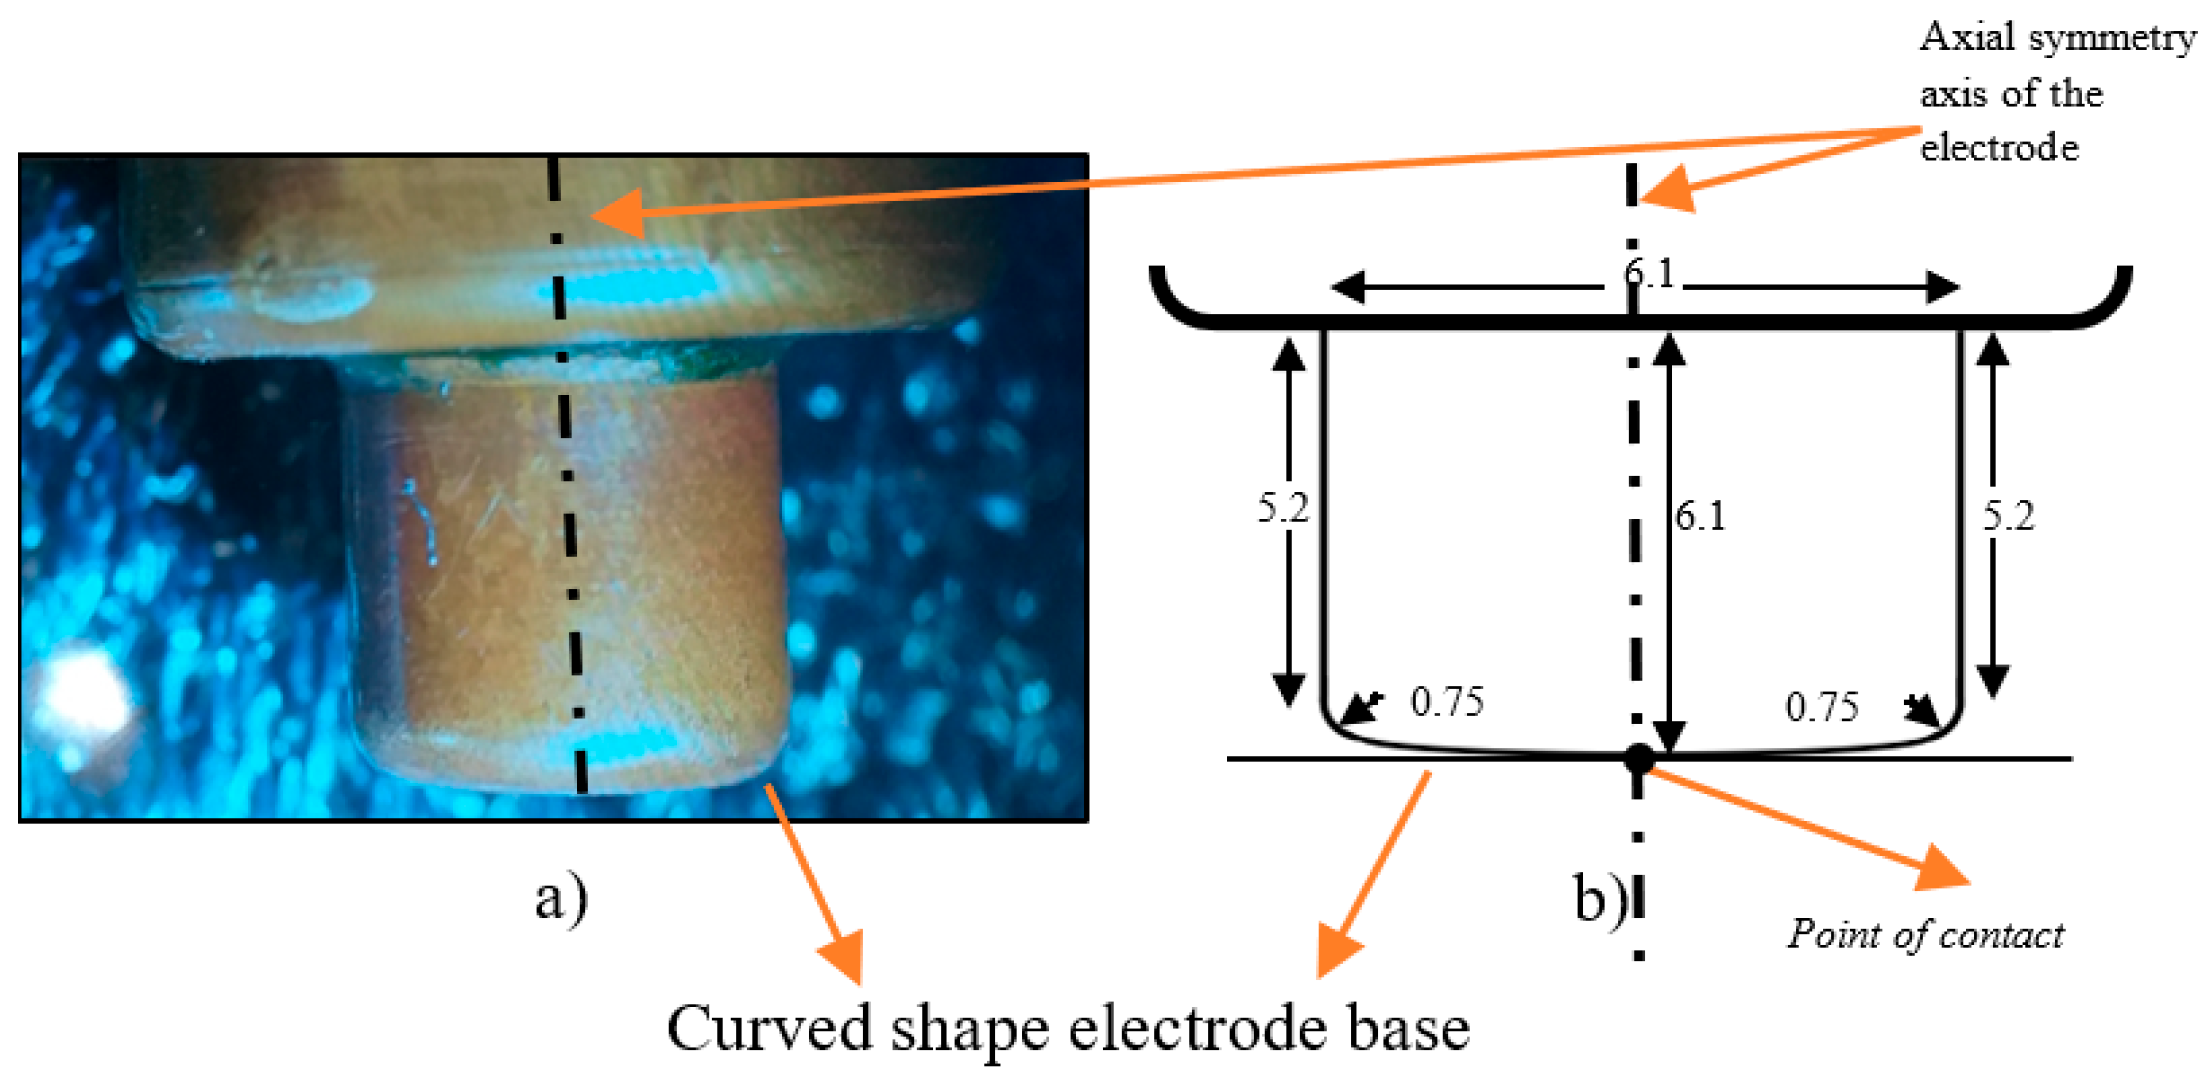
2.2. Electrode Design and Field Calculation

To validate the PD inception model and, thus, be able to carry out PD-free insulation design, the test object must be able to trigger exactly the type of PD (i.e., internal or surface), which is the potential issue in the designed insulation system. Focusing on electrodes and, e.g., surface discharges, the chosen electrode shape must be able to trigger PD on the surface, driven mostly by the tangential field rather than the orthogonal one, at the triple point (i.e., the point involving electrode contour, insulation surface, and surrounding gas). The focus here is on the test cell, represented in Figure 1, which is able to trigger surface discharges in order to characterize the PD surface resistance of insulating materials, which is of paramount importance to the design of insulation systems based on the redundancy concept. The purpose would be to allow an insulation system to withstand PD for all or part of its operation, still providing the specified life at a selected failure probability.
The electrode system and test sample adopted in this study are sketched in Figure 2a. The contact between the electrode and insulation specimen is flat (i.e., perfectly adhering to the surface of the sample), and the curvature radius of the electrode is 750 μm. A zoom of the electrode contour is highlighted in Figure 2b, being l the distance along the horizontal direction from the triple point and h the corresponding orthogonal distance from the sample to the electrode surface, so that in (1) d ≡ l or d ≡ h for surface and internal discharges, respectively.
Electric field calculations can be carried out, e.g., by the commercial FEM software COMSOL Multiphysics©, for an AC sinusoidal (60 Hz) excitation voltage, Vsim, of 1 kV. Let us note that field profiles do not change (for this test object) with increasing frequency (thus they would also hold for the PWM modulation waveform, referring to peak voltage).
Typically, the orthogonal field is predominant over the tangential one at the same excitation voltage Vsim. However, this does not mean that gas discharges are preferred over surface discharges, because the models for the inception of surface and gas PD have the same expression but different parameter values (see Table 1), leading to different inception field thresholds for gas and surface discharges.
In order to estimate the PD inception field and voltage, field simulations (1st leg) are correlated to the inception field models (2nd leg). Indeed, the correspondence of the maximum field value (or close to it, see (2)) and relevant voltage with the inception field will provide the inception voltage, which can be calculated approximately by (3). To clarify this, Figure 3 shows an example of PDIV computation (exploiting the 1st and 2nd legs): PDIV is the voltage value at which the resulting field intercepts the PD inception field, obtained by (1). This holds for both surface (along the l direction) and gas discharge (along the h direction); see Figure 3a and Figure 3b, respectively. Referring to Figure 3, intercepts occur at 9.1 kV/mm and 1.6 kV/mm for orthogonal and tangential fields, respectively, that correspond to PDIV = 3.3 kV for gas discharge and PDIV = 1.7 kV for surface discharge. Hence, surface PD is present at a lower voltage, which indicates that the considered electrode system is appropriate to test surface discharge phenomenology and to carry out PD-free design of the insulation system surface/interfaces.

3. Impact of the Electrode Shape on the Electric Field Computation and PD Inception Field Estimation

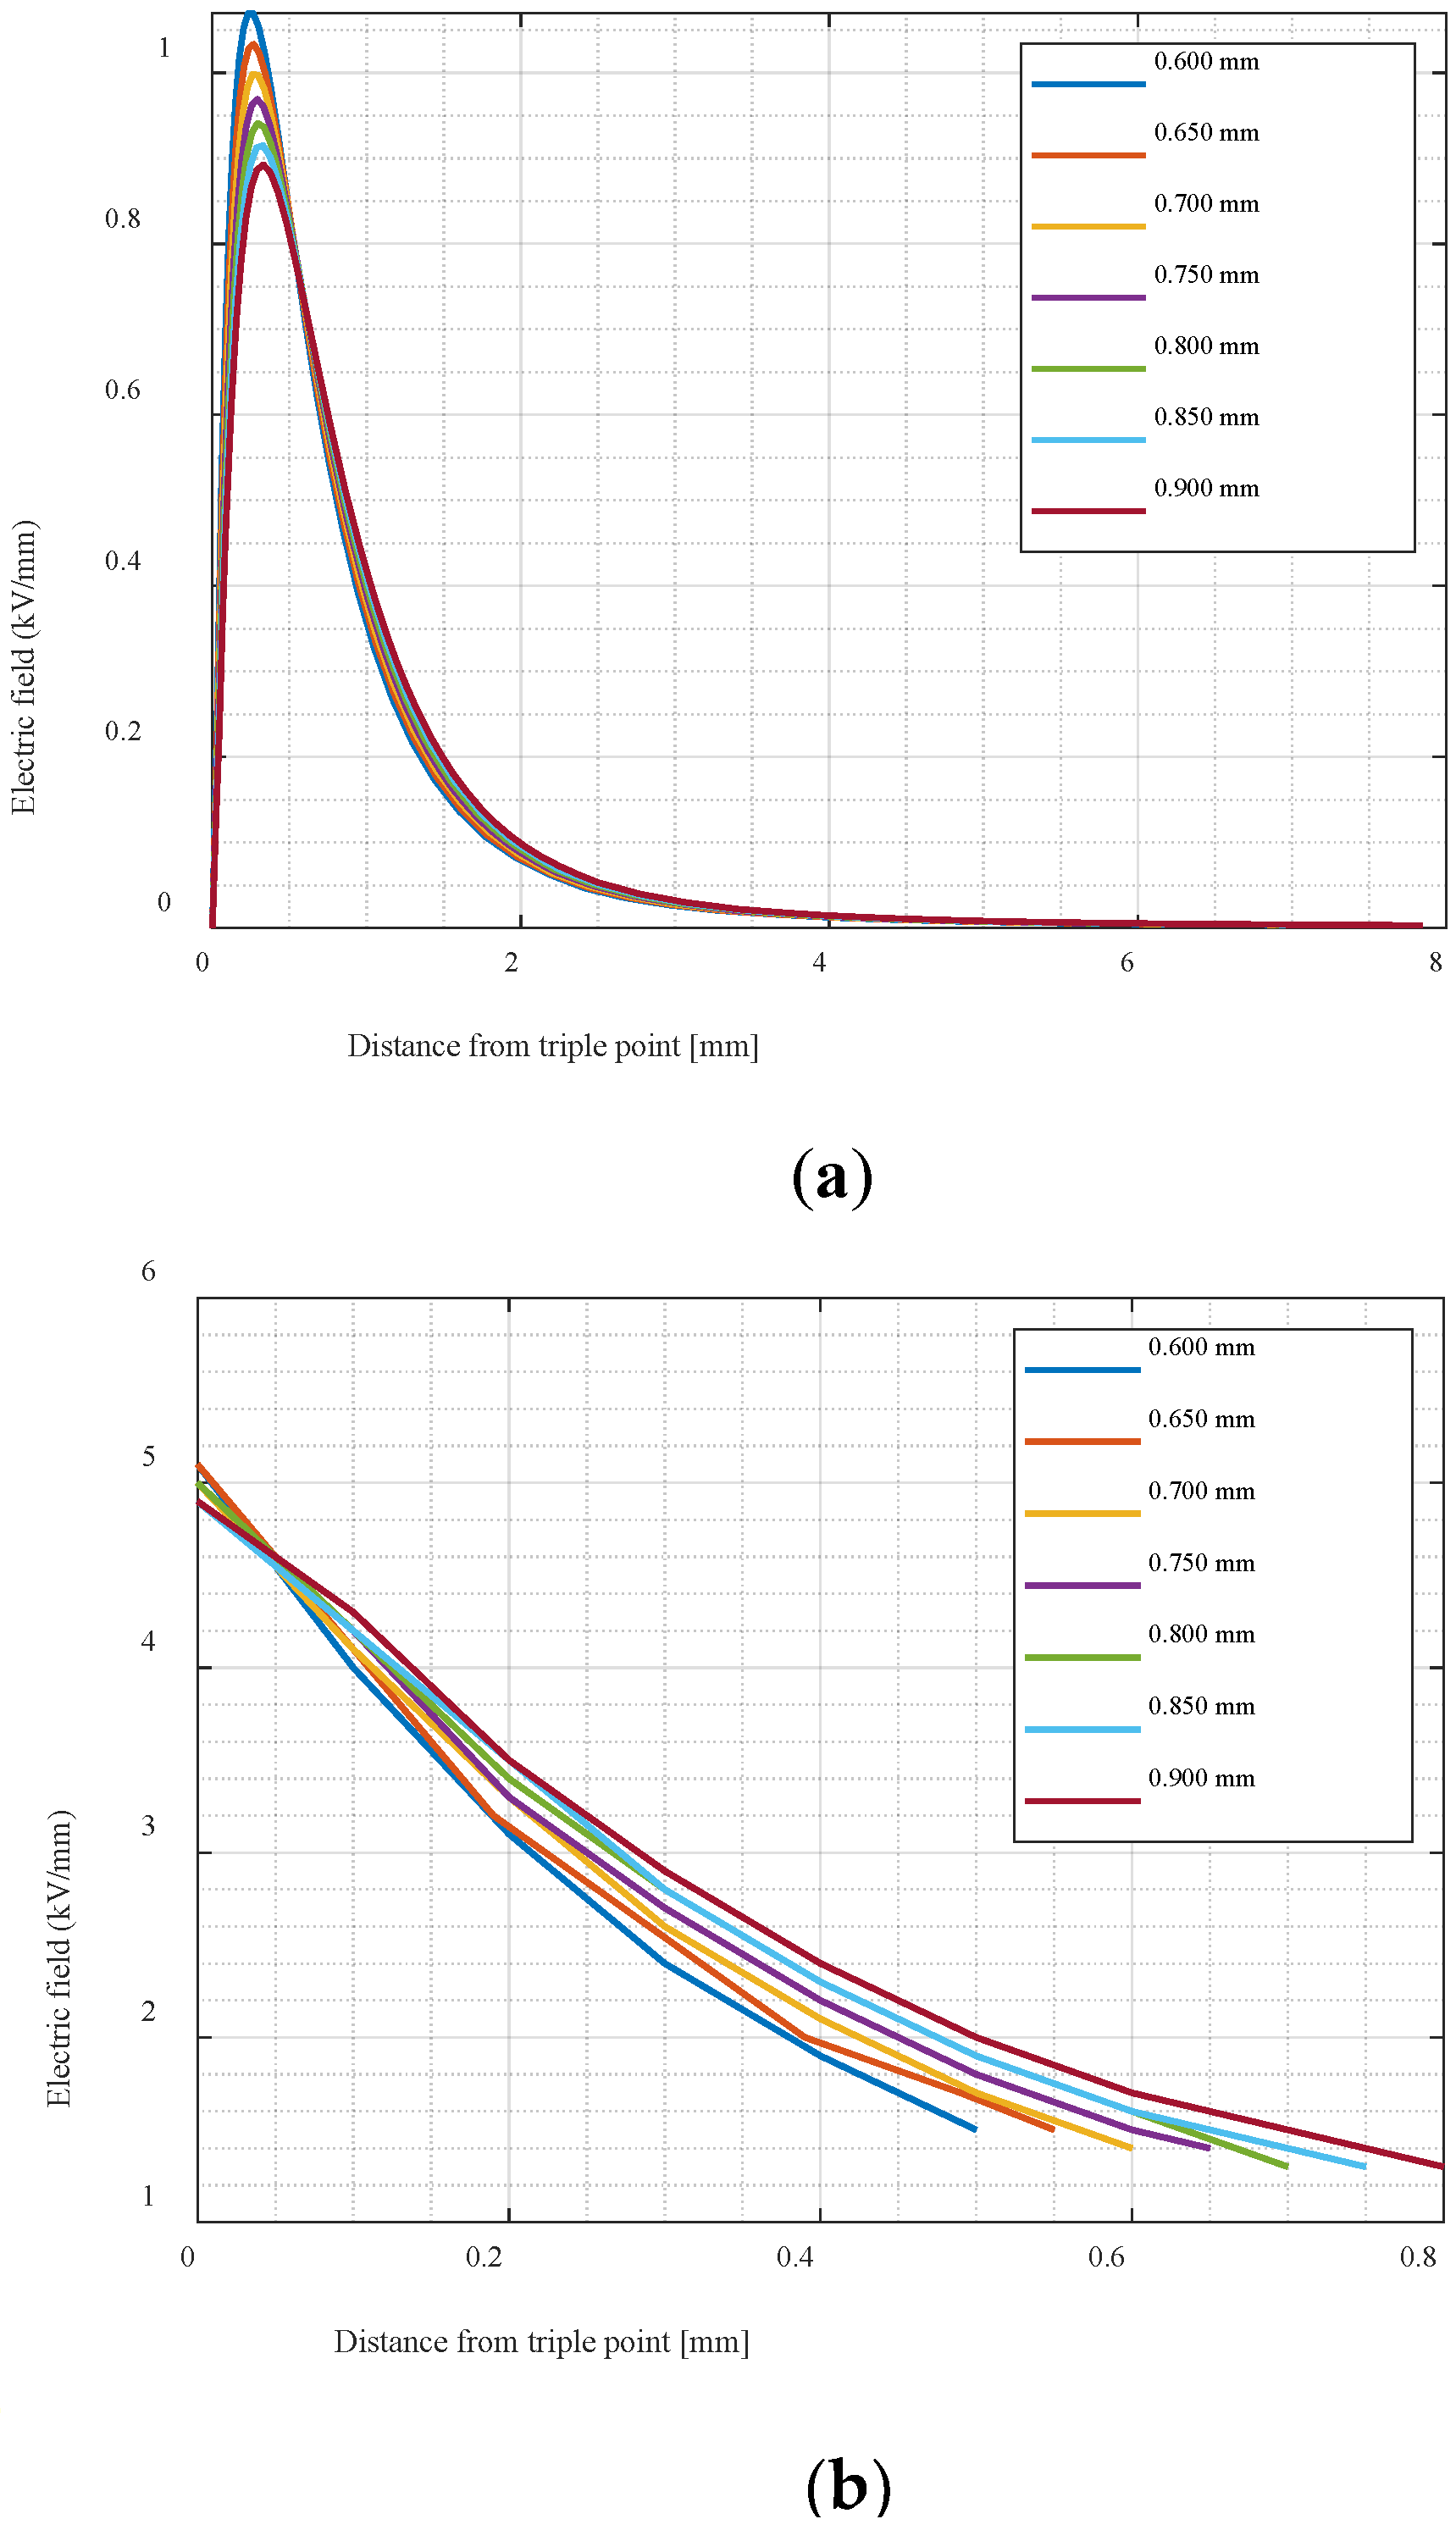
3.1. Influence of Electrode Curvature Radius

Inaccurate evaluations of electrode shape (i.e., their curvature radius and contour shape) can have a significant impact on the computation of electric field in the space surrounding electrode contours, which could affect the estimation of the PD inception field, the typology of incepted PD, and, due to their influence on ks and d, the accuracy of model (1).
In this section, parametric simulations quantify the effect of small geometrical variations of the HV electrode contour of Figure 2b on the estimation of electric field profiles (both orthogonal and tangential to the insulation surfaces) and on surface and gas PD inception field and voltage. Practically, such variations (shape and curvature radius of the HV electrode) could be due to manufacturing defects, usage deterioration, or electrode surface machining to remove tracks from previous discharges.
A 0.6 mm single-layer XLPE specimen is used in the simulation (and validation experiments described in the next section). The reference curvature radius, R, of the high voltage electrode (zoomed in Figure 2b), i.e., 750 μm, is varied by steps of 25 µm, from a minimum of 600 µm to a maximum of 900 µm. For each curvature radius, both the surface and gas inception fields (see (1)) and the relevant inception voltages (see (3)), are computed. The results are summarized in Table 2 and graphically represented in Figure 4.
Regarding surface discharges, Table 2 shows a slight decrease in the value of the inception field with the increment of the curvature radius, R. This is due to the increase in the scale parameter ks (see (2)) which in turn depends on the tangent field profile shape (see Figure 4a). On the contrary, surface PDIV increases with the curvature radius (R), since the peak of the field profile decreases slightly with the increment of R (see Figure 4a). Hence, Table 2 shows that a variation of 300 µm in the HV curvature radius causes a difference of 0.07 kV/mm for the inception field of the tangential component and a difference of 0.2 kV in the surface PDIV estimation.
Referring to gas discharges, Figure 4b highlights that changes in the electrode curvature radius shift the orthogonal field curves, thus varying the intersection point between the computed and PD inception fields. However, Table 2 indicates that gas PDIV values are always very close to 3.3 kV, thus being reasonably stable with electrode curvature radius.
This quantitative discussion holds as simulations and inception field models are considered (first and second legs, see Section 2), showing that only slight variations of PDIV values come from a variation of the curvature radius <300 μm. Regarding PD detection, it can therefore be argued that such curvature radius variations do not noticeably affect measurement accuracy.

3.2. Influence of Electrode-Specimen Contact Area

The electrode configuration used to trigger surface PD, Figure 1 and Figure 2, is geometrically modeled by considering its zoomed image taken by a microscope (see Figure 5a); this allows the accurate geometrical profile sketched in Figure 5b to be achieved. In particular, it is noteworthy that the contour of the base touching the tested specimen would present a curved shape (which can be modeled by a quadratic law) rather than straight. The cause of this curvature could be a design purposely developed to reduce electric field concentration along its contour (as for pseudo-Rogowski electrodes) or, practically, a manufacturing defect or usage deterioration. Ideally, in fact, such electrodes should be thought to have a straight, flat base, as in the example represented in Figure 6, where both a particular HV electrode (Figure 6a) and the derived accurate geometrical profile (Figure 6b) are shown.
From now on, let us define the electrode with the curve-shaped contact surface as electrode A and the electrode with the perfect flat-shaped contact surface as electrode B.
Calculations shall then be made to evaluate whether electrode A provides significantly different values of the PD inception field compared to electrode B. This, indeed, could affect the discharge model validation and, thus, the application of the three-leg approach for the insulation system’s PD-free design. Eventually (see Section 4), an experimental validation will be performed to verify the validity of the computations made with electrodes A and B.
As regards simulations relevant to electrodes A and B, the electric field computations start at the intersection of the electrode profile with the horizontal line at 40 µm (at 2.1 mm from the symmetry axis for electrode A and 0.24 mm for electrode B, Figure 7). This choice comes to avoid unrealistic electric field values at the triple points, and it is supported by PD physics: it has been shown, indeed, that distances between the surface electrodes and specimens lower than 30–40 μm are unlikely to generate significant PD even at relatively high fields.
Table 3 summarizes the estimates of PD inception field and voltage for gas and tangential discharges, referring to electrodes A and B. Computations made by means of (1)–(3) show there is a significant incremental factor of 2.5 between the gas PDIV values for electrodes A and B, while the surface PDIV is not affected as much by the slight rounding of the contact surface (A vs. B). In practice, this means that for electrode A, gas discharges have a lower PDIV value compared to surface ones; thus, the cell designed to generate surface discharges (Figure 1 and Figure 2), with the purpose of establishing criteria for a PD-free design of the insulation surface, might not work properly if electrode B is replaced by electrode A.
To go more in detail, Figure 8 and Figure 9 display the orthogonal electric fields computed at Vsim =1 kV AC and at the PDIV values, together with the gas PD inception field from (1), for electrodes A and B. It can be seen (from curve intersections) that the gas discharge PDIV is 1.3 kV for electrode A (Figure 8b), but 3.3 kV for B (Figure 9b), which supports the estimates in Table 3. Noticeably, the intersection of the electric field profile and gas discharge model for electrodes A and B is at 2.45 and 0.38 mm from the axial symmetry axis, respectively.

4. Experimental Validation

4.1. Test Set-Up

The experimental set-up is sketched in Figure 10. This arrangement is designed to trigger surface PD on a single-layer specimen (see sample in Figure 10) placed between two electrodes (high voltage, HV, and ground, GRD, both made of brass). In this study, 0.6 mm single-layer XLPE specimens are considered.
The AC power supply is connected to an HV transformer, controlled by a variac. The low-voltage electrode is connected to the ground by means of a wire passing through a high-frequency current transformer (HFCT, bandwidth 100 kHz–50 MHz), which serves as the sensor for PD measurement. The HFCT is then connected to the above-described PD detector (PDA) interfaced to a PC running the innovative SRI (Separation, Recognition, Identification) software [5,18,19].
Experiments were conducted in a climatized room (average temperature of 20 °C) under constant atmospheric pressure and humidity.

4.2. PDIV Measurements and Discussion

Repeated PDIVAC measurements were performed on XLPE specimens using electrodes A (Figure 5) and B (Figure 6). The purpose was to validate the PDIV estimations summarized in Table 3.
The PDIVAC measurement procedure was the same for both electrodes. The AC voltage at the HV electrode was slowly increased by steps lasting 30 s to record and analyze PD at each voltage step by means of the SRI software. The procedure was continued till the PDIVAC value was reached, which is the voltage level at which the PD activity starts persistently [20]. Five measurements were conducted for the same test arrangement after de-energizing the sample and waiting for enough time (approximately 5 min) to make sure that PD-generated space charge was not able to affect successive PD measurements.
Table 4 reports the PDIVAC measurement values for each acquisition with electrodes A and B. Besides the PDIVAC values obtained from each measurement, the mean values within the 95% confidence intervals, considering a Gaussian distribution for the measurement data, are reported [21]. For electrode A, PDIVAC is 1.2 ± 0.3 kV (PD identified as internal), whereas for electrode B, it is 1.7 ± 0.3 kV (PD identified as surface). It is noteworthy that PD are identified as internal with a likelihood of 0.9 to 1 for electrode A, and surface with a likelihood of 0.8 to 1 for electrode B. The likelihood level is a number between 0 and 1, and it comes as an output of the fuzzy engine used for automatic identification [18]. For example, a likelihood 1 of surface PD means that the collected PD signals certainly come from surface discharges, whereas a likelihood 0.5 internal and 0.5 surface means that most likely both gas and surface sources contribute to generating the detected PD signals.
This result is consistent with the observation made in Section 3 (see Table 3), referring to the simulations and the inception models. The PDIV values of Table 3 to be considered are 1.2 ± 0.3 kV for electrode A, for which gas PD are triggered for a voltage threshold lower than the one for surface discharges, and 1.7 ± 0.3 kV for electrode B, for which surface PD are triggered for a voltage threshold lower than that for gas discharges. Indeed, comparing the measured PDIV of Table 4 with those in Table 3, a good fit between the experimental results and the predicted values is observed since the estimated PDIV values are placed inside the uncertainty interval of the measured quantities. Therefore, the three-leg approach is validated in the experiments involving both electrodes. Notably, correct surface discharge testing is achieved only by electrode B, since A triggers more likely gas discharges (identified as internal) than surface discharges.
Figure 11 and Figure 12 show two examples of graphical outcomes produced by the SRI software by using electrode A (Figure 12) and electrode B (Figure 12). They refer to the first acquisitions of Table 4 of electrode A (applied voltage of 1.3 kV, IDinternal = 1) and electrode B (applied voltage of 1.6 kV, IDsurface = 1).

5. Conclusions

It is known that characterizing the PD inception and endurance of insulating materials and systems must take real electrode geometrical characteristics carefully into account. To quantify this speculation, a specific electrode configuration meant to trigger surface PD on polymeric specimens was considered. Electrode geometrical characteristics (contour curvature radius and electrode contact shape/dimensions) were varied to assess their impact on the computation of the electric field profile and PD inception field estimates, the latter based on the three-leg approach (methodology that gathers coherent field computations, inception modeling, and experimental activity supported by SRI software).
Simulation and parametric analysis results, validated by experimental testing, show that small electrode curvature radius variations (lower than 300 μm) do not impact significantly on the estimated and measured PDIV, as well as on PD typology identification. However, small deviations in the shape of the electrode contact area that lies on the specimen from the theoretically flat one can impact drastically on PD inception evaluation. This affects insulation system design, which must be based on criteria that allow PD-free insulation system operation as well as the type of defect generating PD and, thus, its harmfulness (thus diagnosis). As an example, if the purpose of testing is to characterize surface discharge inception and surface PD resistance, a lack of accuracy in electrode profile can trigger gas discharges rather than surface ones, which will provide misleading results for both design and diagnostic purposes.

Author Contributions

Conceptualization, G.C.M.; Methodology, G.C.M.; Software, G.G.; Investigation, G.G.; Writing—original draft, G.G.; Writing—review & editing, G.C.M. All authors have read and agreed to the published version of the manuscript.

Funding

This research received no external funding.

Institutional Review Board Statement

Not applicable.

Informed Consent Statement

Not applicable.

Data Availability Statement

The data presented in this study are available on request from the corresponding author. The data are not publicly available due to restrictions.

Conflicts of Interest

The authors declare no conflicts of interest.

References

  1. Stone, G.C. Partial discharge diagnostics and electrical equipment insulation condition assessment. IEEE Trans. Dielectr. Electr. Insul. 2005, 12, 891–903. [Google Scholar] [CrossRef]
  2. Hudon, C.; Belec, M. Partial discharge signal interpretation for generator diagnostics. IEEE Trans. Dielectr. Electr. Insul. 2005, 12, 297–319. [Google Scholar] [CrossRef]
  3. Kreuger, F.H. Partial Discharge Detection in High-Voltage Equipment; Butterworth-Heinemann: Oxford, UK, 1990. [Google Scholar]
  4. IEC 60505; Evaluation and Qualification of Electrical Insulation Systems. 4th ed. International Electrotechnical Commission: Geneva, Switzerland, 2011.
  5. IEC 60034-18-41; Partial Discharge Free Electrical Insulation Systems (Type I) Used in Rotating Electrical Machines Fed from Voltage Converters—Qualification and Quality Control Tests. International Electrotechnical Commission: Geneva, Switzerland, 2018.
  6. IEC 60034-27-5; Off-Line Measurement of Partial Discharge Inception Voltage on Winding Insulation under Repetitive Impulse Voltage. International Electrotechnical Commission: Geneva, Switzerland, 2017.
  7. Nya, B.H.; Brombach, J.; Schulz, D. Benefits of Higher Voltage Levels in Aircraft Electrical Power Systems. In Proceedings of the 2012 Electrical Systems for Aircraft, Railway and Ship Propulsion, Bologna, Italy, 16–18 October 2012. [Google Scholar]
  8. Zhang, X.; Haran, K.S. High-specific-power electric machines for electrified transportation applications-technology options. In Proceedings of the IEEE Energy Conversion Congress and Exposition (ECCE), Milwaukee, WI, USA, 18–22 September 2016. [Google Scholar]
  9. Catalán, P.; Wang, Y.; Arza, J.; Chen, Z. A Comprehensive Overview of Power Converter Applied in High-Power Wind Turbine: Key Challenges and Potential Solutions. IEEE Trans. Power Electr. 2023, 38, 6169–6195. [Google Scholar] [CrossRef]
  10. Montanari, G.C.; Nath, D.; Cambareri, P. A new approach to the design of surface subsystems of polymeric insulators for HV and MV apparatus under AC voltage. High Volt. 2023, 8, 651–658. [Google Scholar] [CrossRef]
  11. Lizcano, M.; Williams, T.S.; Shin, E.E.; Santiago, D.; Nguyen, D. Aerospace Environmental Challenges for Electrical Insulation and Recent Developments for Electrified Aircraft. Materials 2022, 15, 8121. [Google Scholar] [CrossRef]
  12. IEC 61251; Electrical Insulating Materials—A.C. Voltage Endurance Evaluation. International Electrotechnical Commission: Geneva, Switzerland, 2014.
  13. IEC 60216; Parts 1–7, Guide for the Determination of Thermal Endurance Properties of Electrical Insulating Materials. International Electrotechnical Commission: Geneva, Switzerland, 2013.
  14. IEC 62539; Guide for the Statistical Analysis of Electrical Insulation Breakdown Data. International Electrotechnical Commission: Geneva, Switzerland, 2007.
  15. Niemeyer, L. A generalized approach to partial discharge modeling. IEEE Trans. Dielectr. Electr. Insul. 1995, 2, 510–528. [Google Scholar] [CrossRef]
  16. Cambareri, P.; Montanari, G.C. Derivation of a Surface Discharge Model for the Design of the Surface Components of Insulation Systems used in Industrial Electronics Environments. IEEE Journ. Emerg. Select. Topics Ind. Electron. 2022, 4, 698–706. [Google Scholar] [CrossRef]
  17. Montanari, G.C.; Schwartz, S.; Yang, Q.; Nath, D.; Ghosh, R.; Cuzner, R. Towards Partial Discharge Automatic and Unsupervised Monitoring: A Technological Breakthrough for MV Electrical Asset Condition Monitoring and Diagnostics. In Proceedings of the 2022 9th International Conference on Condition Monitoring and Diagnosis (CMD), Kitakiushu, Japan, 13–18 November 2022. [Google Scholar]
  18. Contin, A.; Cavallini, A.; Montanari, G.C.; Pasini, G.; Puletti, F. Digital detection and fuzzy classification of partial discharge signals. IEEE Trans. Dielectr. Electr. Insul. 2022, 9, 335–348. [Google Scholar] [CrossRef]
  19. Ghosh, R.; Seri, P.; Montanari, G.C. Partial discharges in DC electrical insulation during voltage transients and steady state: Noise rejection, discharge source identification and life estimation. Electric Power Syst. Res. 2021, 194, 107117. [Google Scholar] [CrossRef]
  20. IEC 60270; High-Voltage Test Techniques—Partial Discharge Measurements. 3.1 ed. International Electrotechnical Commission: Geneva, Switzerland, 2015.
  21. BIPM; IEC; IFCC; ILAC; ISO; IUPAC; IUPAP; OIML. Guide to the Expression of Uncertainty in Measurement; GUM 1995 with Minor Corrections; Joint Committee for Guides in Metrology, JCGM 100:2008; Morgan & Claypool Publishers: San Rafael, CA, USA, 2011. [Google Scholar]
Figure 1. Photos of the test cell considered for the surface discharge testing experiments.
Applsci 14 00201 g001
Figure 2. (a) Electrode test arrangement for surface discharge testing, and (b) zoom of the reference curvature radius (R = 750 μm) of the HV electrode at its triple point (P). The vertical component h, orthogonal to the specimen surface, and the horizontal component l, tangent to the specimen surface, are highlighted; these components represent the directions where the electric fields must be evaluated for the application of the generalized inception model (1).
Applsci 14 00201 g002
Figure 3. Simulated electric field profiles, relevant to the electrode configuration of Figure 1, intersect the PD inception fields estimated according to (1) and Table 1. The x-axis zero is the triple point P (see Figure 1). (a) Simulated orthogonal field (in gas) intersecting the PD inception field curve at 0.38 mm from the triple point with an inception field equal to 9.1 kV/mm. (b) Simulated tangent field (on the specimen surface), with ks = 0.0018, intersecting the PD inception field of 1.60 kV/mm at about 0.3 mm from the triple point.
Applsci 14 00201 g003
Figure 4. Parametric profiles of electric field at the HV electrode of the cell in Figure 1, with variation of the curvature radius, R. The x-axis zero is the triple point P. (a) Tangential surface field: peak field decreases and the value of ks increases as long as R goes up (this causes a slight increase in surface PDIV); and (b) Orthogonal electric field: the higher curvature radius, the larger electric field, above 0.05 mm (and the opposite below 0.05 mm).
Applsci 14 00201 g004
Figure 5. (a) Zoom of the high-voltage electrode (Electrode A) touching the polymeric specimen under test: its axial symmetry axis is highlighted; (b) geometrical dimensions (taken in mm) of the actual curved shape of the electrode A base. It is noteworthy that the electrode touches the surface specimen at one “point of contact” on its axial symmetry axis. The curvature of the contour can be modeled by means of a quadratic law.
Applsci 14 00201 g005
Figure 6. (a) Zoom of the high-voltage electrode (Electrode B) touching the polymeric specimen under test; (b) geometrical dimensions (taken in mm) of the actual flat-shaped contact surface of electrode B.
Applsci 14 00201 g006
Figure 7. Zoom of the contact surfaces of electrode A (a), and electrode B (b). For both contact surfaces, the horizontal reference system (with its origin) for the computation of the electric field is represented. The intersection with the horizontal line at 40 µm (being 2.1 mm from the symmetry axis for electrode A and 0.24 mm for electrode B) determines the domain of the electric field calculation.
Applsci 14 00201 g007
Figure 8. Electrode A: (a) PD inception and calculated fields for gas discharges under the application of the simulation voltage Vsim of 1 kV, and (b) PD inception and calculated fields at the PDIV voltage of 1.3 kV. It can be seen that the intersection of the electric field profile and gas discharge model for electrode A is at 2.45 mm from the axial symmetry axis.
Applsci 14 00201 g008
Figure 9. Electrode B: (a) PD inception and calculated fields for the gas model under the application of the normalized voltage Vsim of 1 kV, and (b) PD inception and calculated fields at the PDIV voltage equal to 3.3 kV. It can be seen that the intersection of the electric field profile and gas discharge model for electrode B is 0.38 mm from its triple point.
Applsci 14 00201 g009
Figure 10. Scheme of the PD measurement set-up. On the left, the main components of the supply circuit are represented (AC power supply feeding the HV transformer, controlled by a variac, which energizes the HV electrode). On the right, the components of the signal circuit are sketched: the HFCT sensor acquiring the PD signals coming from the ground electrode (GRD), connected to PD detector (PDA), and a PC running the SRI software.
Applsci 14 00201 g010
Figure 11. Electrode A: PD acquisition for the first measurement of Table 4 (applied voltage of 1.3 kV). (a) Global cluster and automatic separation map; (b) Noise cluster with the relevant sub-pattern for recognition; (c) PD cluster with the relevant sub-pattern for recognition and identification: the PD are identified as 100% internal discharges.
Applsci 14 00201 g011
Figure 12. Electrode B: PD acquisition for the first measurement of Table 4 (applied voltage of 1.6 kV). (a) Global cluster and automatic separation map; (b) Noise cluster with the relevant sub-pattern for recognition; (c) PD cluster with the relevant sub-pattern for recognition and identification: the PD are identified as 100% surface discharges.
Applsci 14 00201 g012
Table 1. Parameter values of the generalized partial discharge inception model (1), function of the type of discharge.
Discharge Type E / p c r B β ks
Gas discharge25.28.621
Surface discharge8.04.32≤1
Table 2. Variation in surface, gas inception fields, and PDIV with the curvature radius R of the HV electrode. The insulation test object is a single-layer XLPE specimen with a mean thickness of 0.6 mm (refer to Figure 2 for the geometrical model).
Radius R (mm)Surface Inception Field (kV/mm)Surface PDIV (kV)Gas Inception Field (kV/mm)Gas PDIV (kV)
0.6001.641.549.13.3
0.6251.641.5610.13.4
0.6501.641.589.53.3
0.6751.621.609.43.3
0.7001.611.619.93.3
0.7251.601.639.83.1
0.7501.601.669.13.3
0.7751.601.679.53.4
0.8001.591.719.23.3
0.8251.581.7010.23.3
0.8501.571.7210.53.3
0.8751.571.749.63.3
0.9001.571.759.43.3
Table 3. Surface and gas inception fields and voltage for Electrode A and B configurations.
Surface Inception Field (kV/mm)Gas Inception Field (kV/mm)Surface PDIV (kV)Gas PDIV (kV)
Electrode A1.32.91.91.3
Electrode B1.69.11.73.3
Table 4. Repeated PDIV measurements performed by electrodes A and B: each measurement is associated with its PD identification likelihood (ID) obtained by the SRI software. The final results are given in terms of the mean PDIV within its 95% confidence intervals.
Electrode AElectrode B
N. of
Acquisition
PDIV (kV)IDPDIV (kV)ID
11.3Internal 11.6Surface 1
21.1Internal 11.7Surface 1
31.2Internal 11.6Surface 0.8
41.1Internal 11.8Surface 0.9
51.3Internal 0.91.8Surface 1
PDIVAC = (1.2 ± 0.3) kV
Predominantly internal
PDIVAC = (1.7 ± 0.3) kV
Predominantly surface
Disclaimer/Publisher’s Note: The statements, opinions and data contained in all publications are solely those of the individual author(s) and contributor(s) and not of MDPI and/or the editor(s). MDPI and/or the editor(s) disclaim responsibility for any injury to people or property resulting from any ideas, methods, instructions or products referred to in the content.

