
Experimental Study and Numerical Analysis of Temperature Stress in Carbon Fiber-Heated Concrete Pavement


Abstract
:1. Introduction
2. Test Introduction
2.1. Test Materials
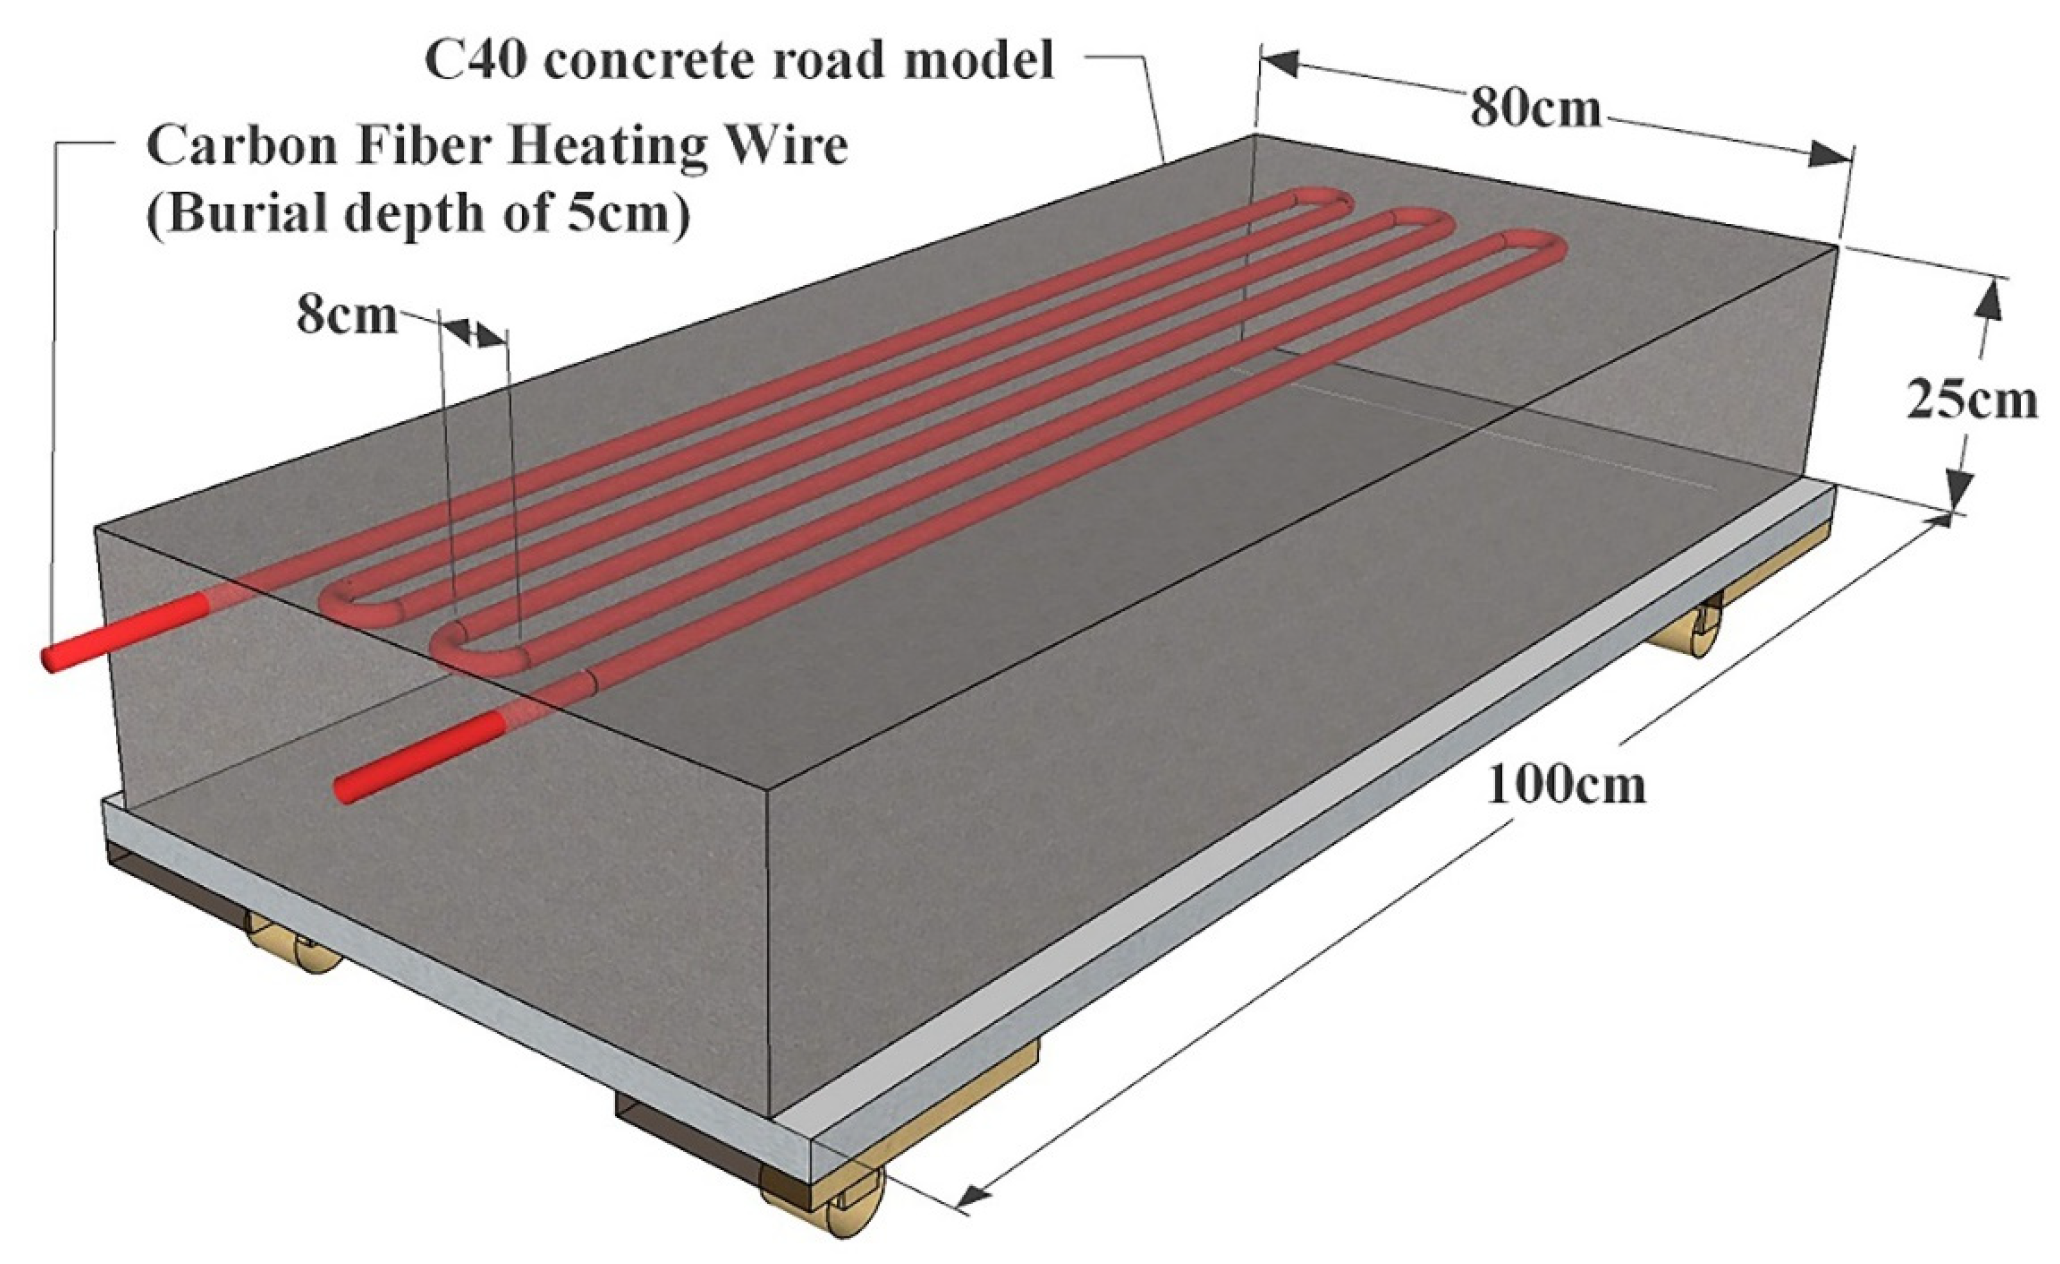
2.2. Test Design
2.3. Test Data Acquisition
3. Test Results and Analysis
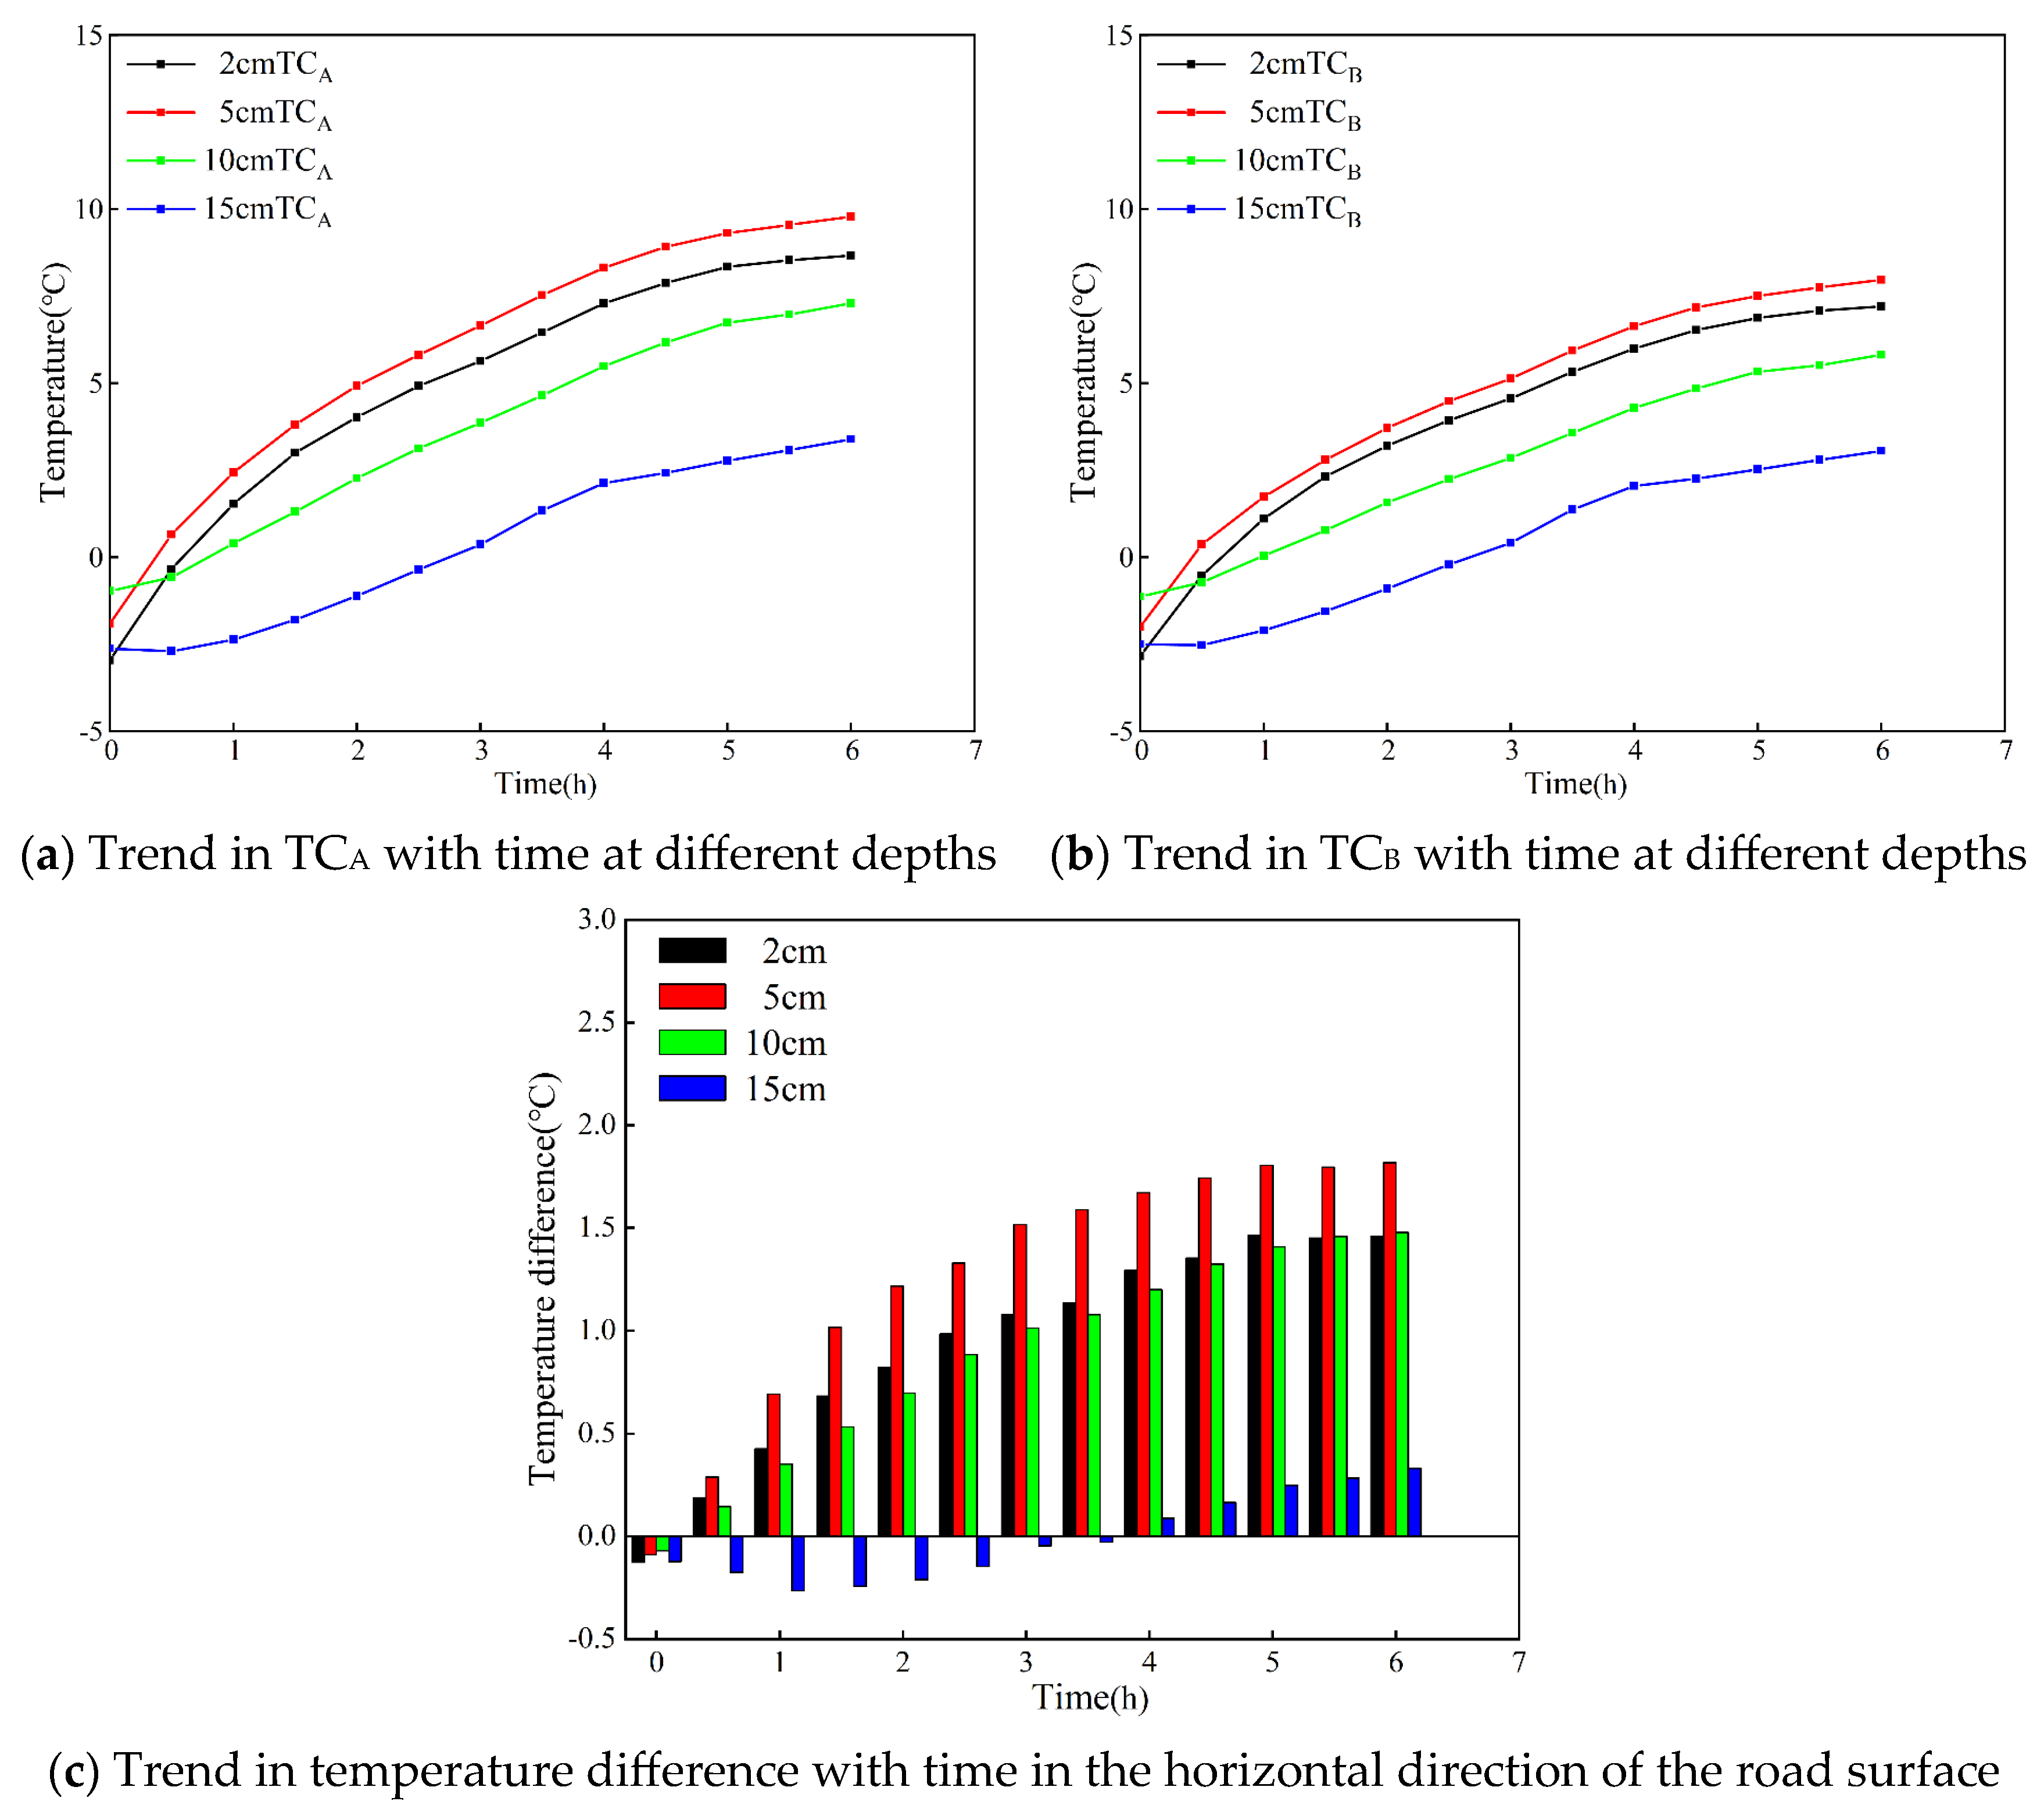
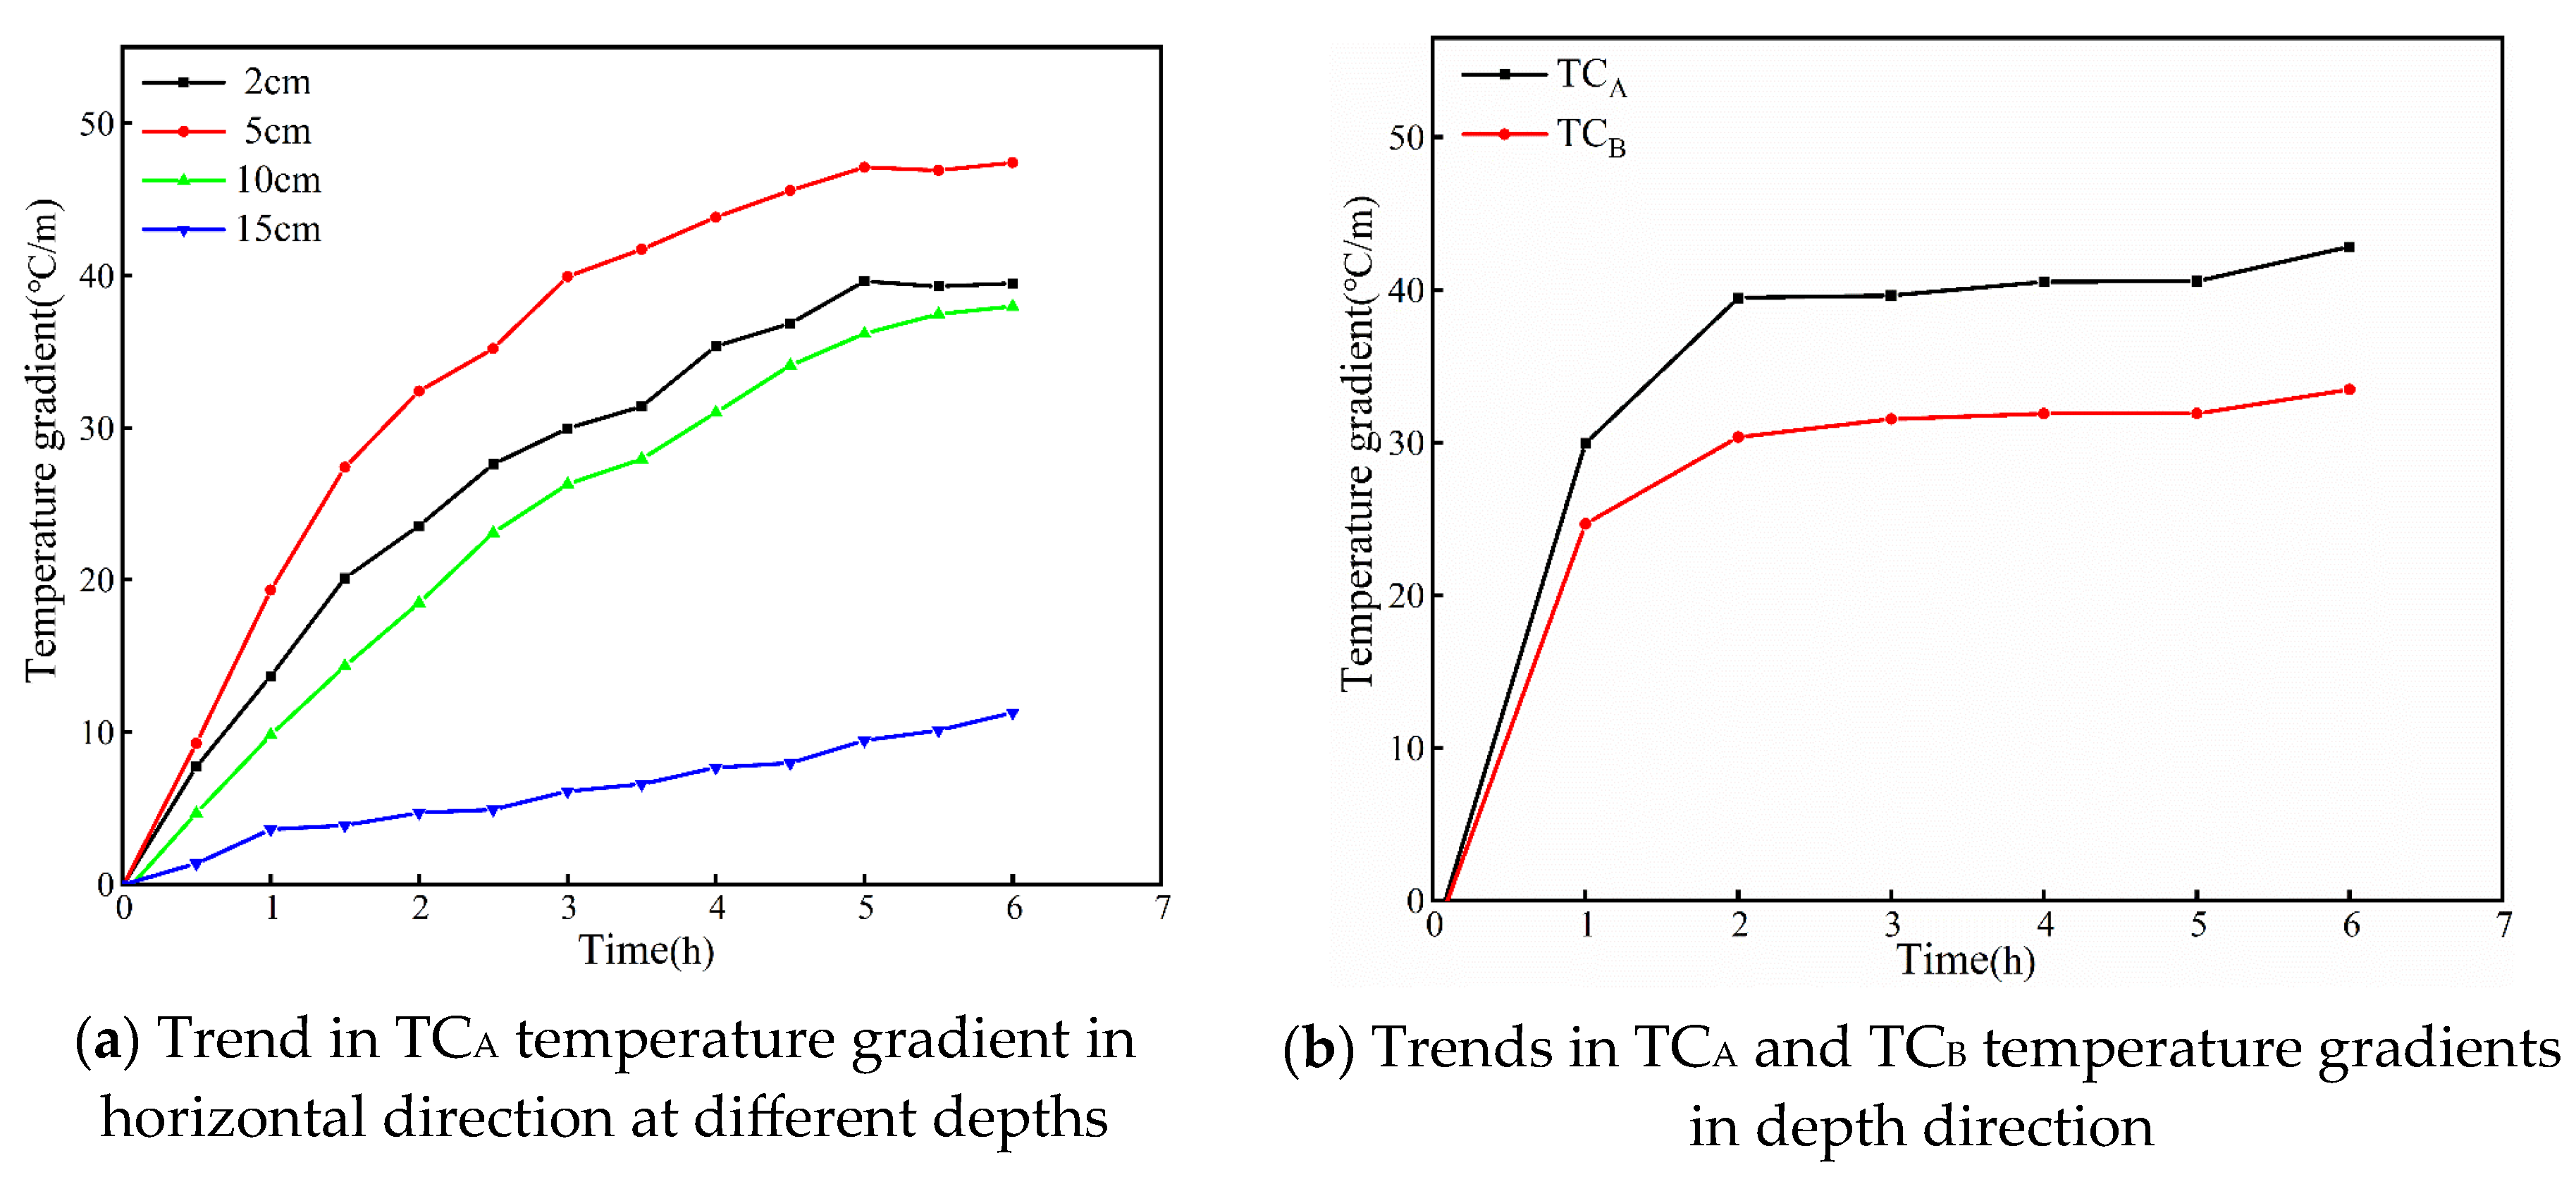
3.1. Temperature Distribution of Pavement Model Test
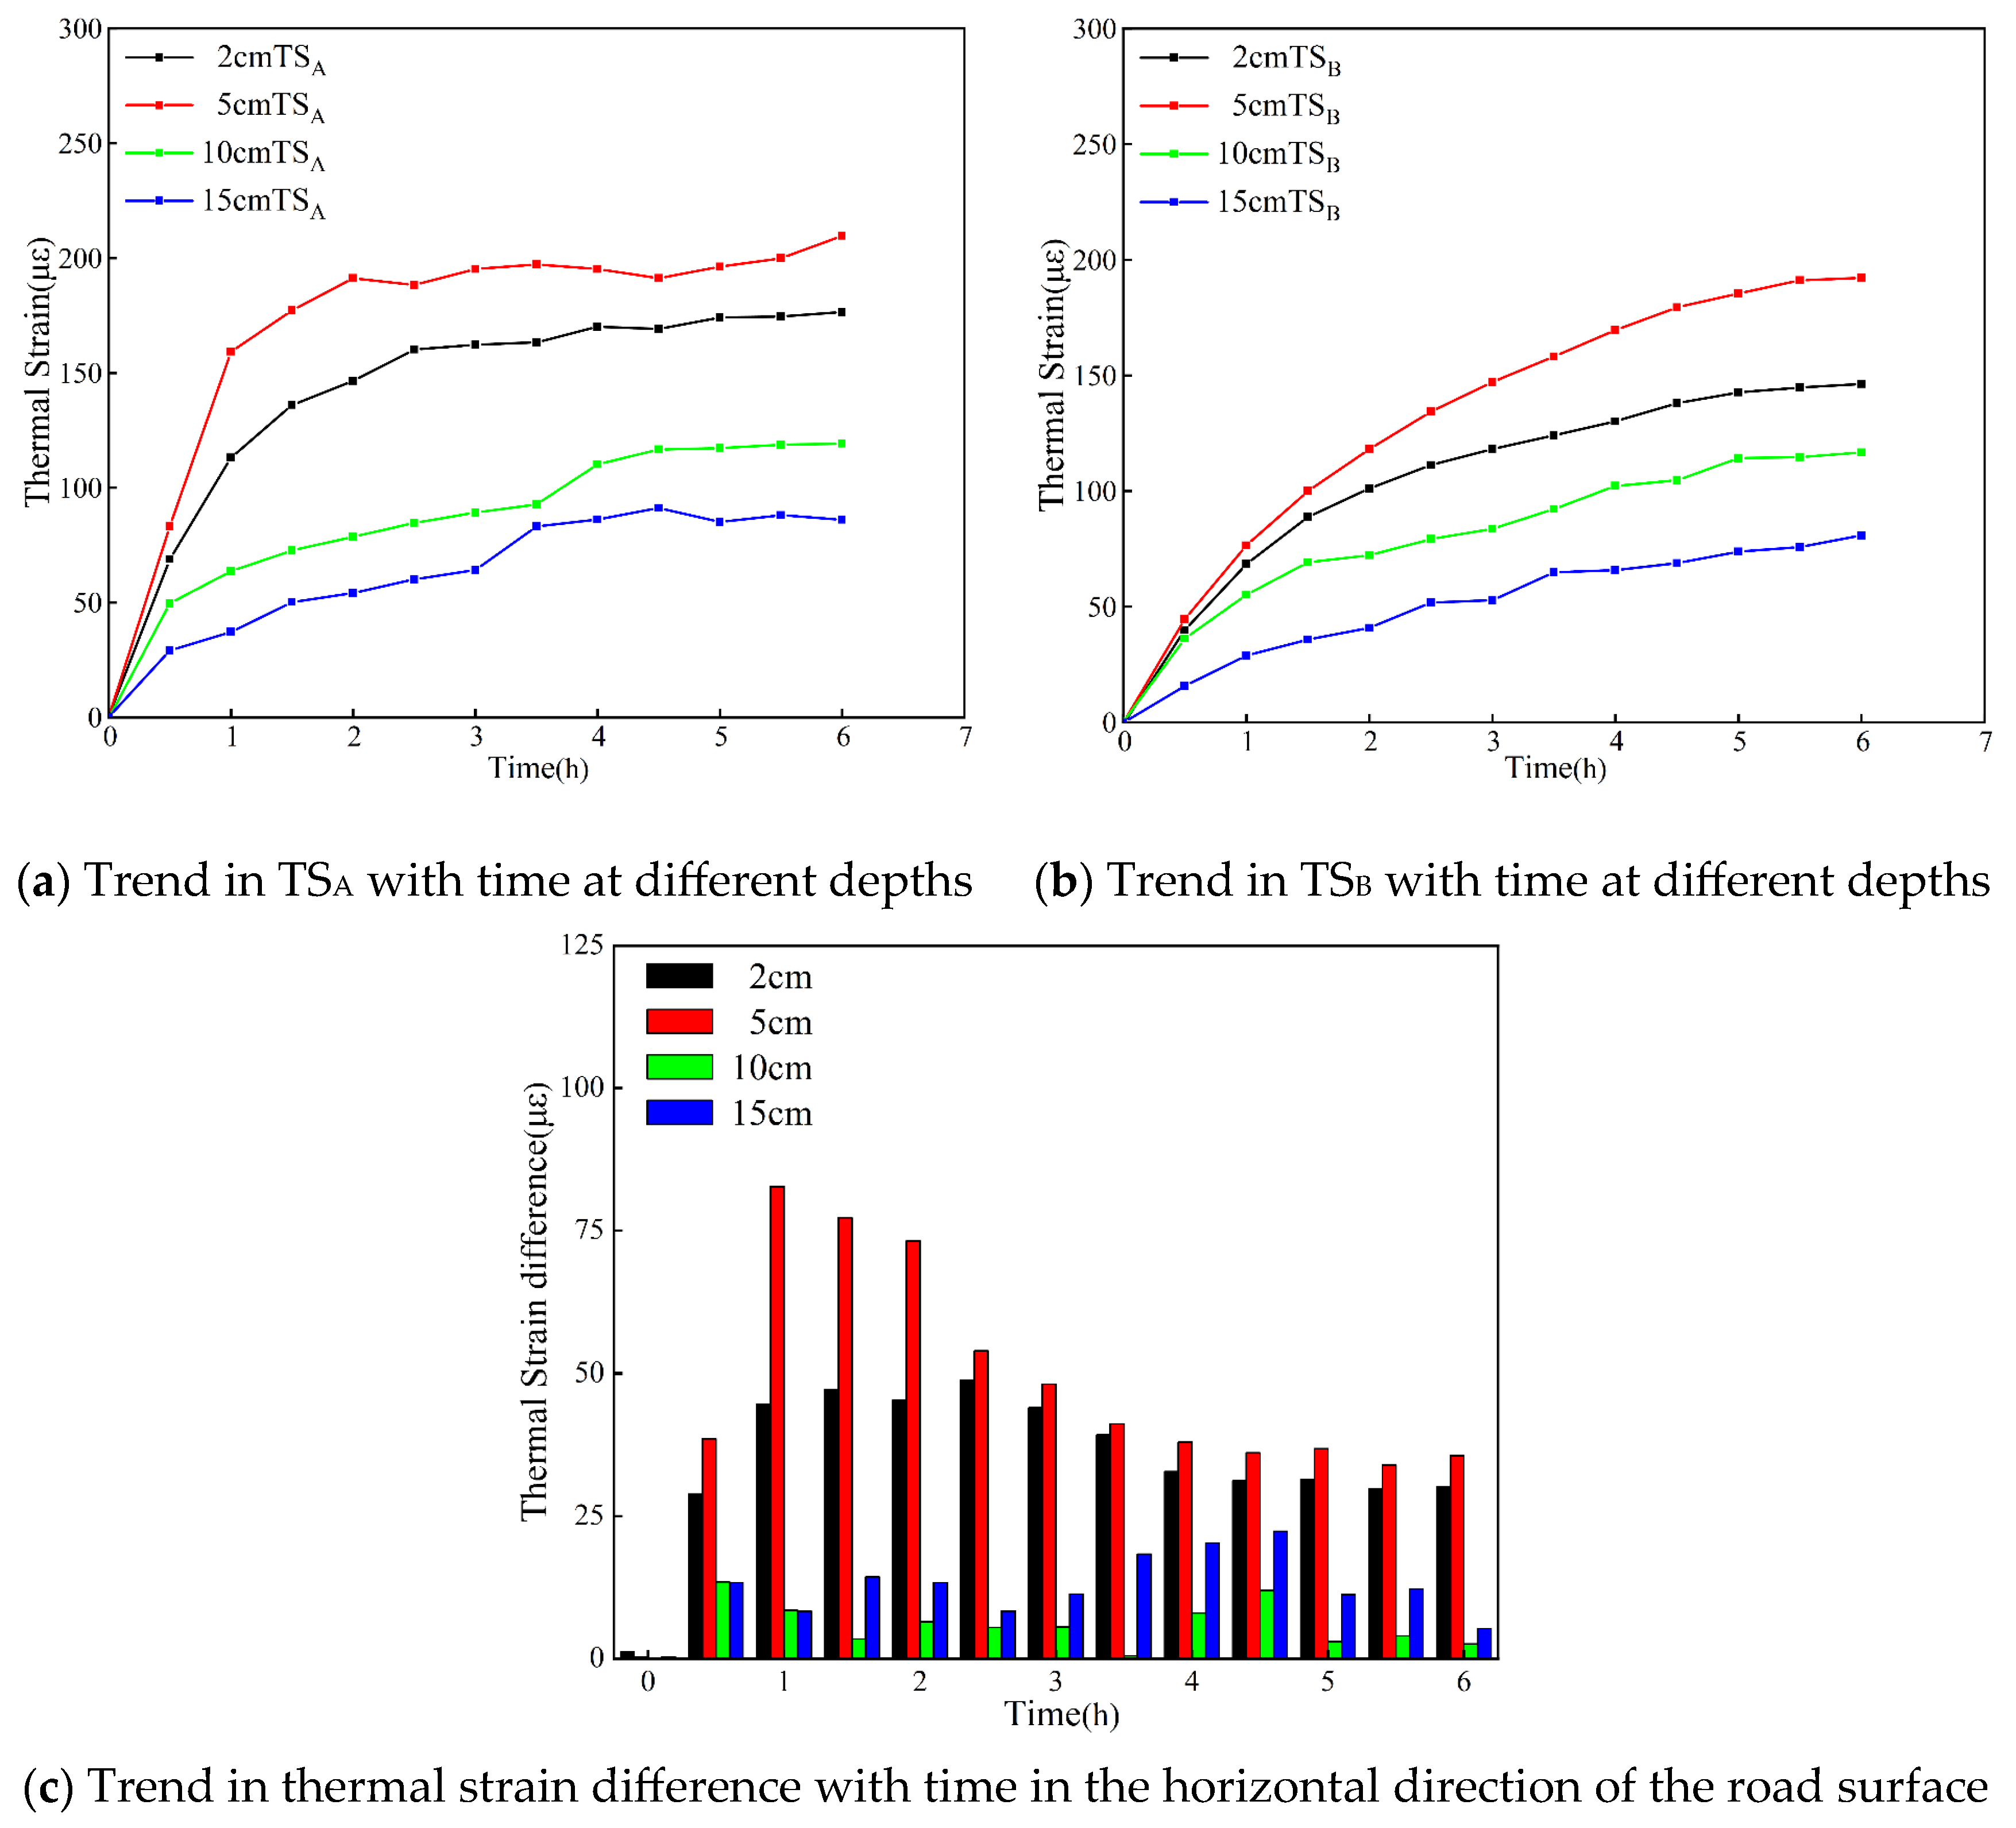
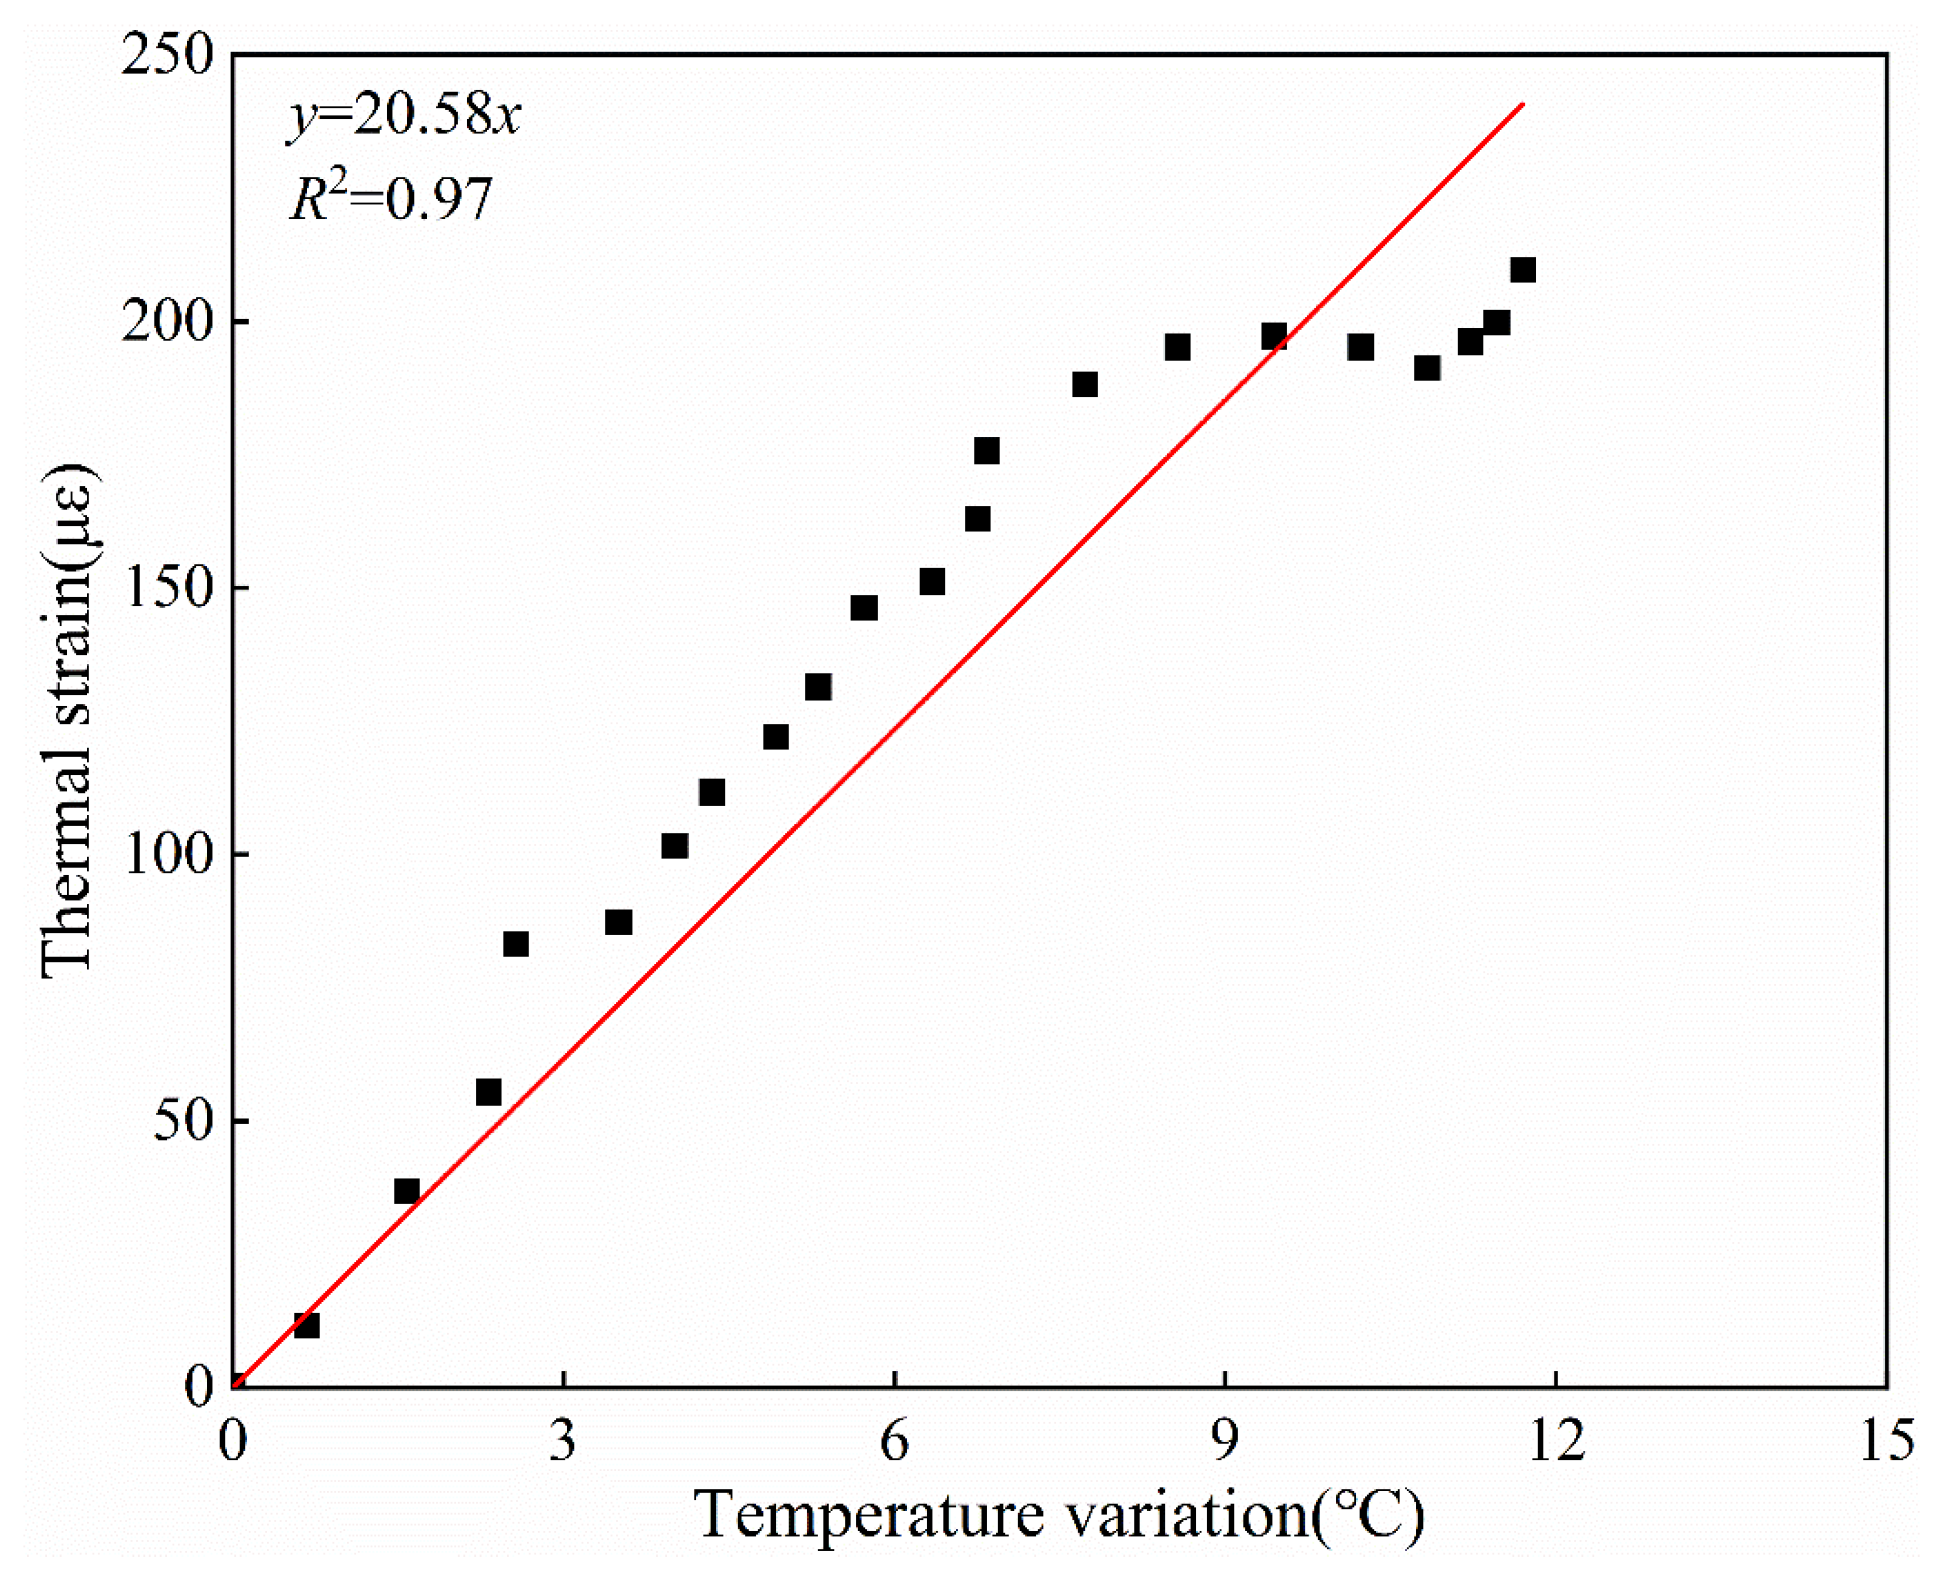
3.2. Thermal Strain Distribution of Pavement Model Test
4. Numerical Analysis
4.1. Numerical Analysis of Governing Equations for Carbon Fiber-Heated Pavement
4.1.1. Heat Transfer Process Governing Equations
4.1.2. Temperature Stress Transfer Process Governing Equations
4.2. Numerical Modeling
4.2.1. Three-Dimensional Numerical Analysis Model
4.2.2. Material Parameters Setting
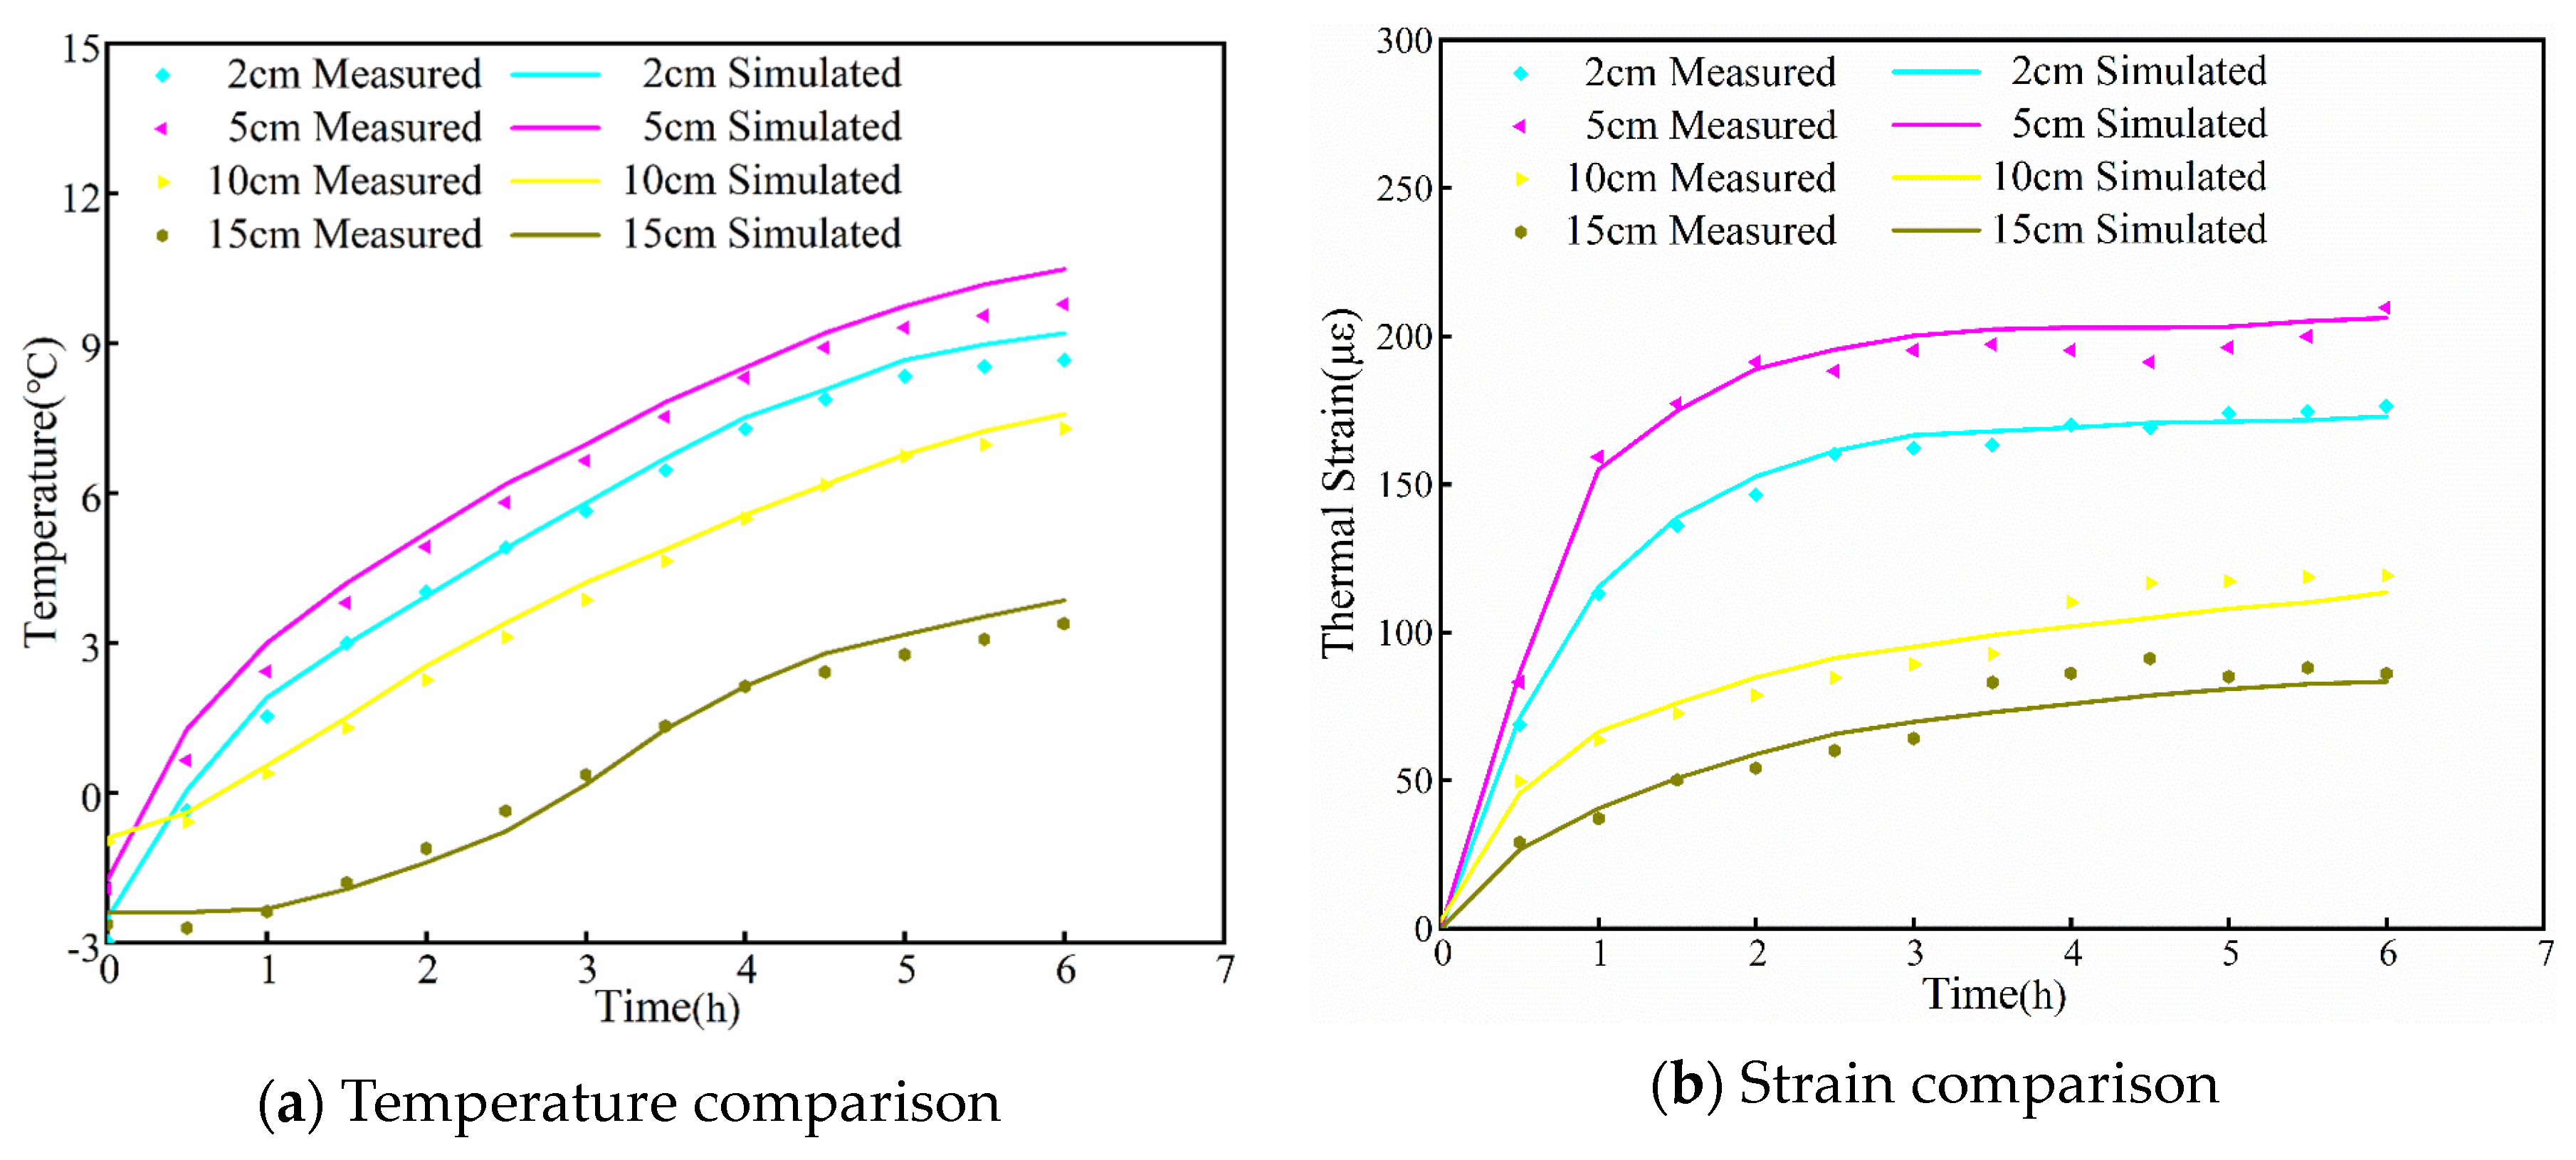
4.3. Numerical Analysis Verification
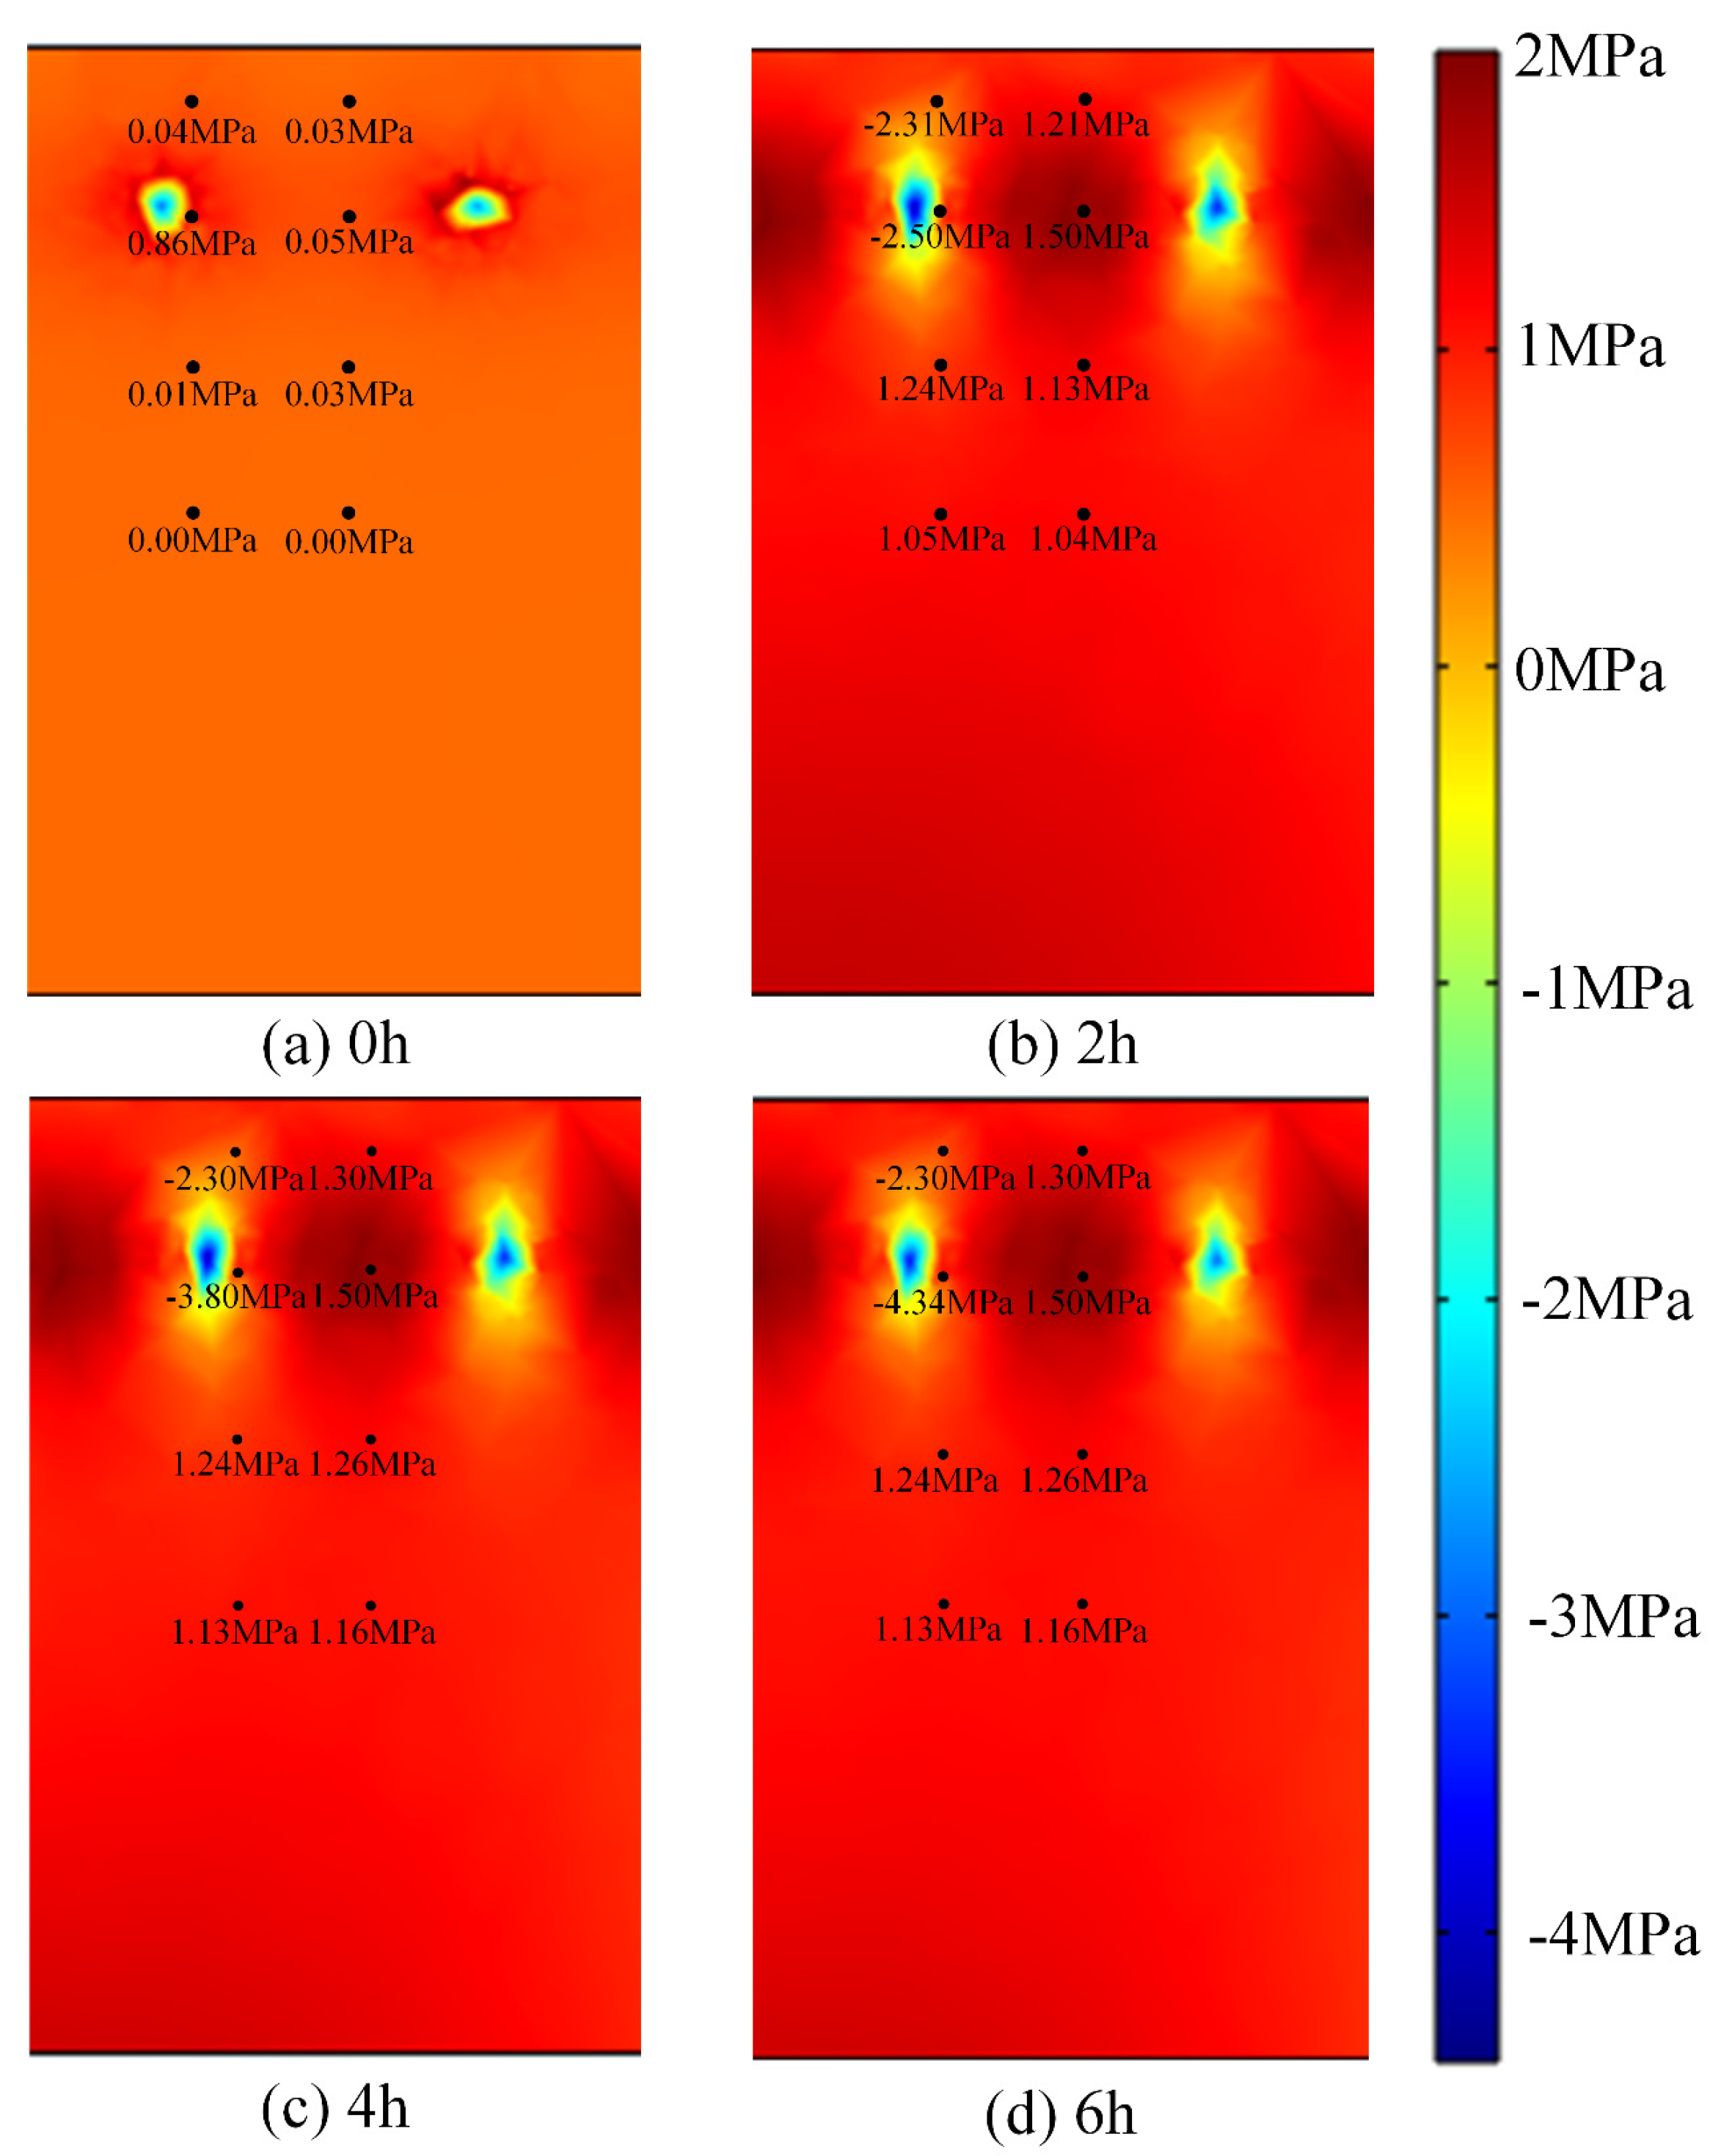
4.4. Distribution of Temperature Stress Field in Carbon Fiber-Heated Pavement
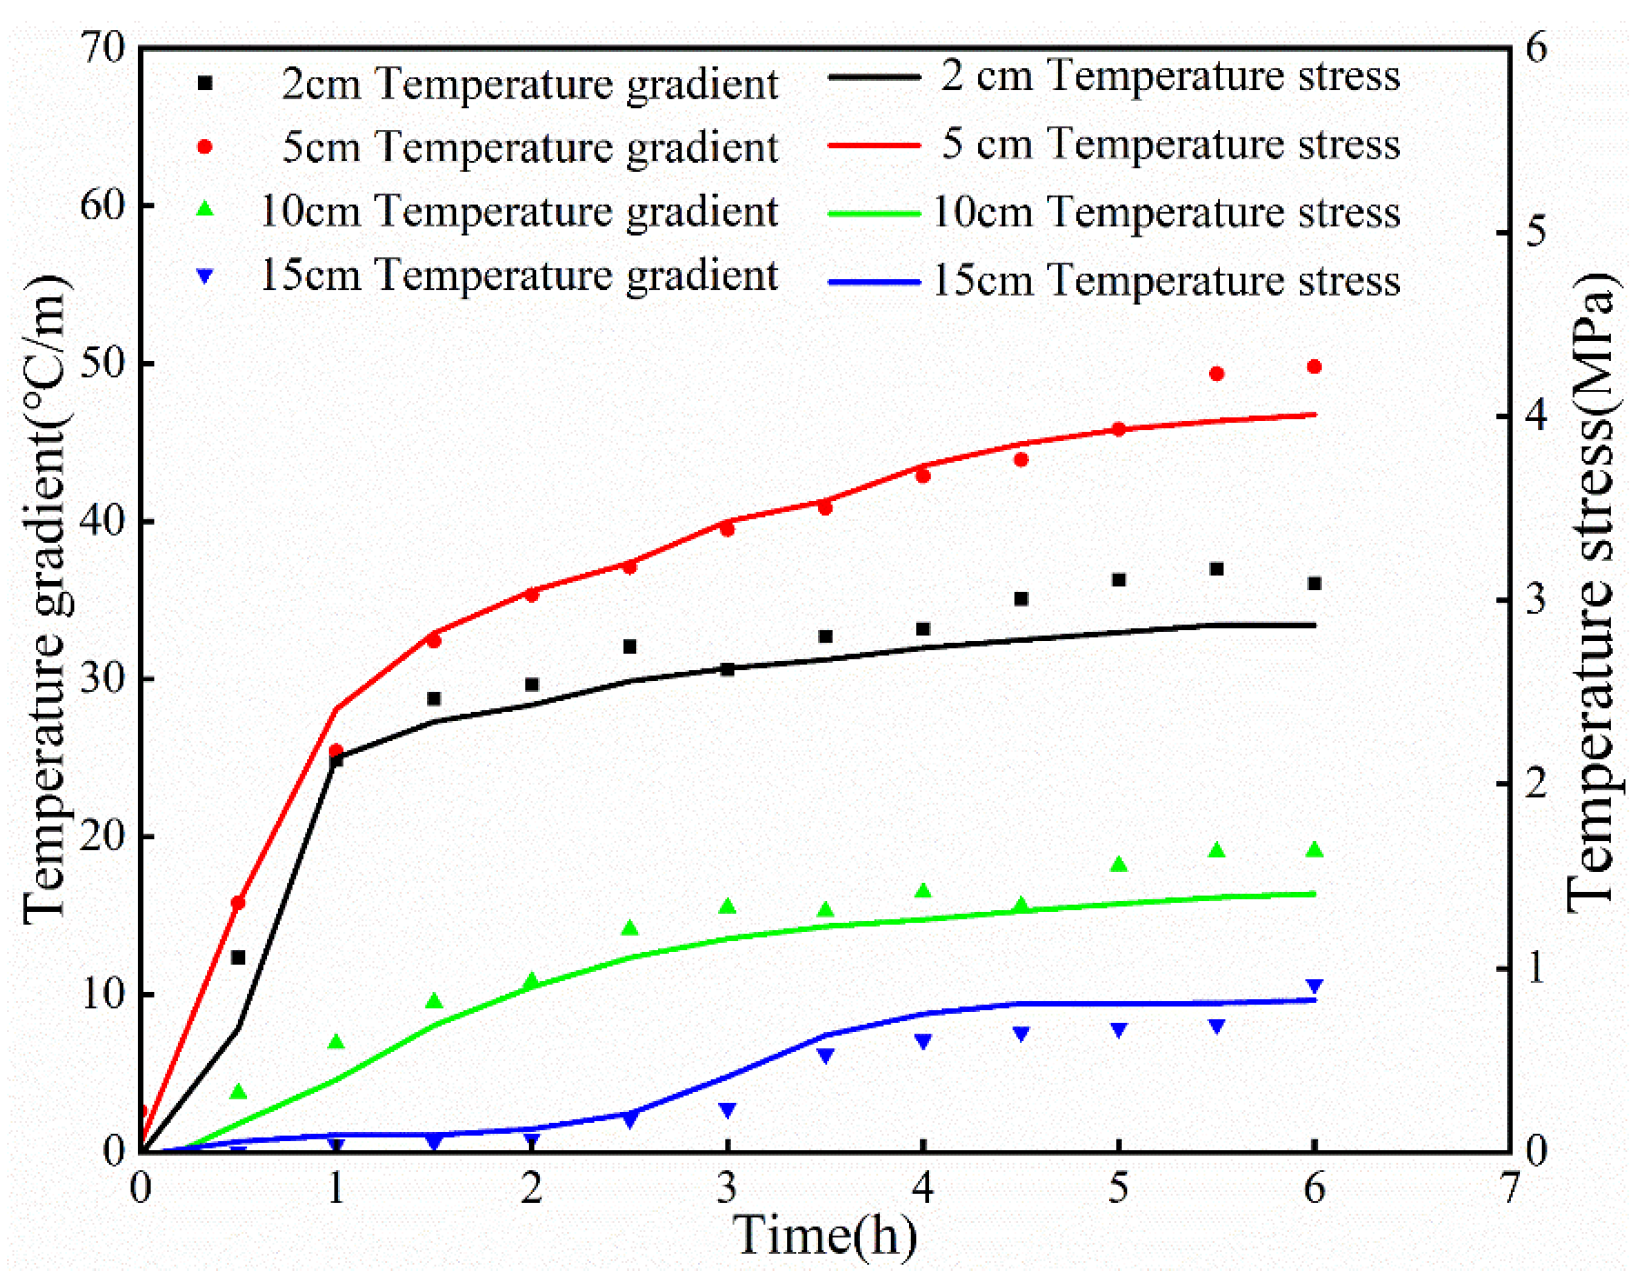
4.5. Analysis of Temperature Gradients and Temperature Stresses in Carbon Fiber-Heated Pavement
5. Conclusions
- The trends in the thermal strain field and temperature field from the model tests are typically similar, and the fitted correlation between the two implies that temperature changes cause thermal strains to occur.
- The temperature gradient of carbon fiber-heated pavement is significantly greater than the value stated in the concrete pavement design standard. The horizontal temperature gradient is greater than the vertical temperature gradient. This demonstrates the importance of studying the temperature stress of carbon fiber-heated pavement.
- The temperature stresses within carbon fiber-heated pavement were investigated along the depth direction in the numerical model testing. Root mean square error (RMSE) analysis of the model test results and numerical test results proved the accuracy of the numerical model of carbon fiber-heated pavement.
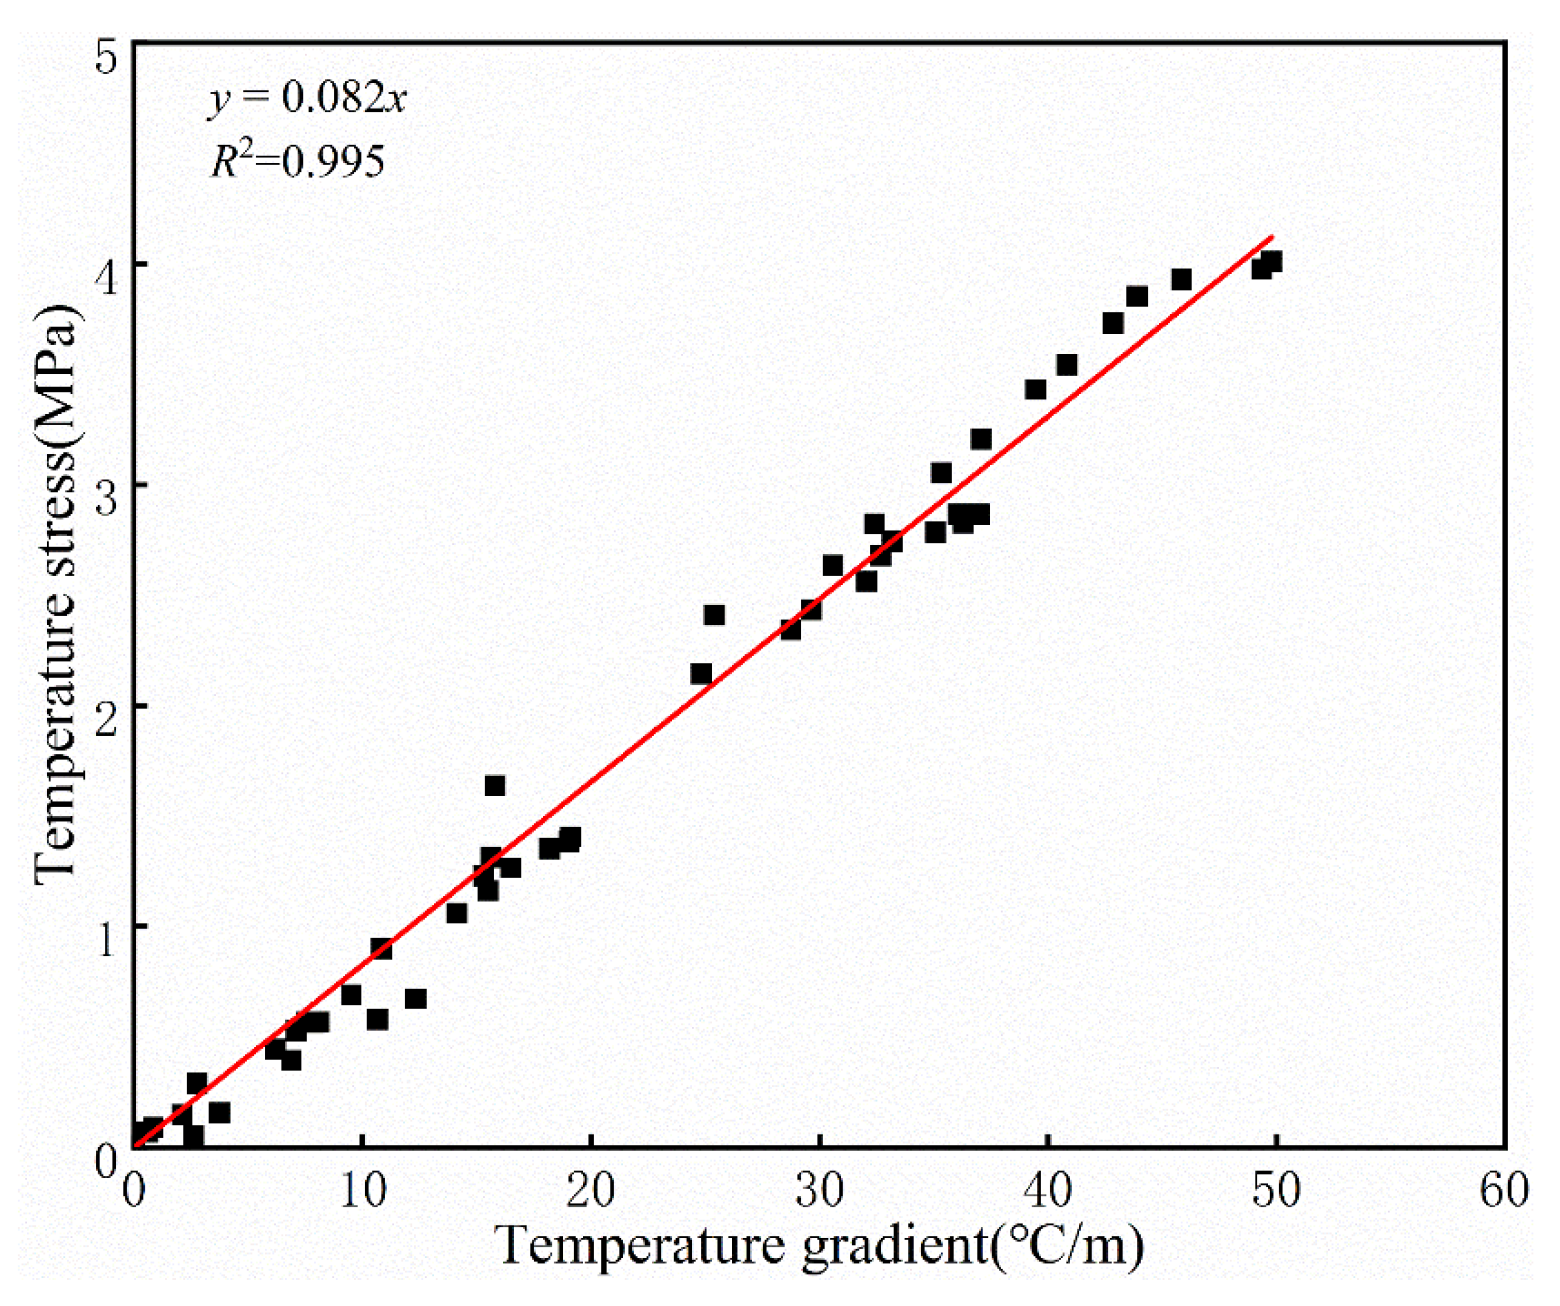
- It was shown that the temperature gradient causes the temperature stress by fitting the relationship between the temperature gradient and temperature stress for pavement at various depths. Furthermore, to offer recommendations for real-world engineering applications, a linear equation for the temperature gradient and temperature stress in the depth direction is offered.
Author Contributions
Funding
Institutional Review Board Statement
Informed Consent Statement
Data Availability Statement
Conflicts of Interest
References
- Arvidsson; Anna, K. The Winter Model—A new way to calculate socio-economic costs depending on winter maintenance strategy. Cold Reg. Sci. Technol. 2017, 136, 30–36. [Google Scholar] [CrossRef]
- Gutchess, K.; Jin, L.; Lautz, L.; Shaw, S.B.; Zhou, X.; Lu, Z. Chloride sources in urban and rural headwater catchments, central New York. Sci. Total Environ. 2016, 565, 462–472. [Google Scholar] [CrossRef] [PubMed]
- Balbay, A.; Esen, M. Experimental investigation of using ground source heat pump system for snow melting on pavements and bridge decks. Sci. Res. Essays 2010, 5, 3955–3966. [Google Scholar]
- Yu, X.; Hurley, M.T.; Li, T.; Lei, G.; Pedarla, A.; Puppala, A.J. Experimental feasibility study of a new attached hydronic loop design for geothermal heating of bridge decks—ScienceDirect. Appl. Therm. Eng. 2019, 164, 114507. [Google Scholar] [CrossRef]
- Kim, H.S.; Ban, H.; Park, W.J. Deicing Concrete Pavements and Roads with Carbon Nanotubes (CNTs) as Heating Elements. Materials 2020, 13, 2504. [Google Scholar] [CrossRef]
- Lai, J.X.; Liu, C.; Gong, C.B. Research Situation and Prospect for Highway Snowmelt Deicing Technology with Electric Heat Tracing. Appl. Mech. Mater. 2011, 71–78, 1865–1869. [Google Scholar] [CrossRef]
- Wang, K.; Nelsen, D.E.; Nixon, W.A. Damaging effects of deicing chemicals on concrete materials. Cement Concrete Comp. 2006, 28, 173–188. [Google Scholar] [CrossRef]
- Thunqvist, E.L. Regional Increase of Mean Chloride Concentration in Water Due to the Application of Deicing Salt. Sci. Total Environ. 2004, 325, 29–37. [Google Scholar] [CrossRef]
- Buss, N.; Nelson, K.N.; Hua, J.; Relyea, R.A. Effects of different roadway deicing salts on host-parasite interactions: The importance of salt type. Environ. Pollut. 2020, 266, 115244. [Google Scholar] [CrossRef]
- Liu, K.; Huang, S.; Xie, H.; Wang, F. Multi-objective optimization of the design and operation for snow-melting pavement with electric heating pipes. Appl. Therm. Eng. 2017, 122, 359–367. [Google Scholar] [CrossRef]
- Vignisdóttir, H.R.; Booto, G.K.; Bohne, R.A.; Bratteb, H.; O’Born, R. A review of environmental impacts of winter road maintenance. Cold Reg. Sci. Technol. 2018, 158, 143–153. [Google Scholar] [CrossRef]
- Zhao, H.; Wu, Z.; Wang, S.; Zheng, J.; Che, G. Concrete pavement deicing with carbon fiber heating wires. Cold Reg. Sci. Technol. 2011, 65, 413–420. [Google Scholar] [CrossRef]
- Lai, Y.; Liu, Y.; Su, X.; Ma, D.X.; Wang, P. The influence of heat flux on melting ice on concrete pavement with carbon fibre heating wire. IOP Conf. 2018, 392, 022021. [Google Scholar] [CrossRef]
- Lai, Y.; Liu, Y.; Ma, D. Automatically melting snow on airport cement concrete pavement with carbon fiber grille. Cold Reg. Sci. Technol. 2014, 103, 57–62. [Google Scholar] [CrossRef]
- Liu, K.; Huang, S.; Jin, C.; Xie, H.; Wang, F. Prediction models of the thermal field on ice-snow melting pavement with electric heating pipes. Appl. Therm. Eng. 2017, 120, 269–276. [Google Scholar] [CrossRef]
- Qin, Y.; Hiller, J.E. Modeling temperature distribution in rigid pavement slabs: Impact of air temperature. Construct. Build. Mater. 2011, 25, 3753–3761. [Google Scholar] [CrossRef]
- Gao, W.Y.; Dai, J.G.; Teng, J.G.; Chen, G.M. Finite element modeling of reinforced concrete beams exposed to fire—ScienceDirect. Eng. Struct. 2013, 52, 488–501. [Google Scholar] [CrossRef]
- Liu, K.; Huang, S.; Wang, F.; Xie, H.; Lu, X. Energy consumption and utilization rate analysis of automatically snow-melting system in infrastructures by thermal simulation and melting experiments—ScienceDirect. Cold Reg. Sci. Technol. 2017, 138, 73–83. [Google Scholar] [CrossRef]
- Nuijten, A.D.W.; Hoyland, K.V. Comparison of melting processes of dry uncompressed and compressed snow on heated pavements. Cold Reg. Sci. Technol. 2016, 129, 69–76. [Google Scholar] [CrossRef]
- Nilimaa, J.; Zhaka, V. Material and Environmental Aspects of Concrete Flooring in Cold Climate. Construct. Mater. 2023, 3, 180–201. [Google Scholar] [CrossRef]
- Nishizawa, T.; Ozeki, T.; Katoh, K.; Matsui, K. Finite Element Model Analysis of Thermal Stresses of Thick Airport Concrete Pavement Slabs. Transp. Res. Record J. Transp. Res. Board. 2009, 2095, 3–12. [Google Scholar] [CrossRef]
- Luccioni, B.M.; Figueroa, M.I.; Danesi, R.F. Thermo-mechanic model for concrete exposed to elevated temperatures. Eng. Struct. 2003, 25, 729–742. [Google Scholar] [CrossRef]
- Neuenschwander, M.; Knobloch, M.; Fontana, M. Suitability of the damage-plasticity modelling concept for concrete at elevated temperatures: Experimental validation with uniaxial cyclic compression tests. Cement Concrete Res. 2016, 79, 57–75. [Google Scholar] [CrossRef]
- Ruan, Z.; Chen, L.; Fang, Q. Numerical investigation into dynamic responses of RC columns subjected for fire and blast. J. Loss Prevent Proc. 2015, 34, 10–21. [Google Scholar] [CrossRef]
- Chen, L.; Fang, Q.; Jiang, X.; Ruan, Z.; Hong, J. Combined effects of high temperature and high strain rate on normal weight concrete. Int. J. Impact Eng. 2015, 86, 40–56. [Google Scholar] [CrossRef]
- Gawin, D.; Pesavento, F.; Schrefler, B.A. Modelling of deformations of high strength concrete at elevated temperatures. Mater. Struct. 2004, 37, 218–236. [Google Scholar] [CrossRef]
- Ripani, M.; Etse, G.; Vrech, S.; Mroginski, J. Thermodynamic gradient-based poroplastic theory for concrete under high temperatures. Int. J. Plasticity 2014, 61, 157–177. [Google Scholar] [CrossRef]
- Sharifi, N.P.; Askarinejad, S.; Mahboub, K.C. Fracture performance of a PCM-Rich concrete pavement under thermal stresses. Int. J. Pavement Eng. 2020, 23, 221–230. [Google Scholar] [CrossRef]
- Nilimaa, J.; Hsthagen, A.; Emborg, M. Thermal Crack Risk of Concrete Structures–Evaluation of Theoretical Models for Tunnels and Bridges. Nordic Concrete Res. 2017, 56, 55–69. [Google Scholar]
- Nowoświat, A.; Olechowska, M. Experimental Validation of the Model of Reverberation Time Prediction in a Room. Buildings 2022, 12, 347. [Google Scholar] [CrossRef]


| Diameter | Heating Power | Resistance | Tensile Strength | Compressive Strength |
|---|---|---|---|---|
| 8 mm | 20 W/m | 13 Ω/m | 1.7 GPa | 1.2 GPa |
| Index | Unit | Concrete Pavement | Carbon Fiber Heating Wire |
|---|---|---|---|
| Young’s modulus (E) | MPa | 3.25 × 10⁴ | 1.2 × 10⁶ |
| Poisson’s ratio (μ) | – | 0.2 | 0.2 |
| Density (ρ) | kg/m3 | 2440 | 1800 |
| Thermal conductivity (λ) | W/(m·°C) | 2.2 | 0.09 |
| Heat capacity (c) | J/(kg·°C) | 1100 | 900 |
| Coefficient of linear expansion (α) | 1/°C | 10−6 | 3.5 × 10⁻⁵ |
| Compressive strength (σc) | MPa | 45 | 1.2 × 10³ |
| Tensile strength (σb) | MPa | 5.0 | 1.7 × 10³ |
| Depth (cm) | RMSE | |
|---|---|---|
| Temperature (°C) | Thermal Strain (με) | |
| 2 | 0.53 | 23.82 |
| 5 | 0.70 | 22.64 |
| 10 | 0.29 | 20.74 |
| 15 | 0.47 | 2.99 |
Disclaimer/Publisher’s Note: The statements, opinions and data contained in all publications are solely those of the individual author(s) and contributor(s) and not of MDPI and/or the editor(s). MDPI and/or the editor(s) disclaim responsibility for any injury to people or property resulting from any ideas, methods, instructions or products referred to in the content. |
© 2023 by the authors. Licensee MDPI, Basel, Switzerland. This article is an open access article distributed under the terms and conditions of the Creative Commons Attribution (CC BY) license (https://creativecommons.org/licenses/by/4.0/).
Share and Cite
Zhang, N.; Chen, Z.; Xiao, H.; Zheng, L.; Ma, Q. Experimental Study and Numerical Analysis of Temperature Stress in Carbon Fiber-Heated Concrete Pavement. Appl. Sci. 2024, 14, 359. https://doi.org/10.3390/app14010359
Zhang N, Chen Z, Xiao H, Zheng L, Ma Q. Experimental Study and Numerical Analysis of Temperature Stress in Carbon Fiber-Heated Concrete Pavement. Applied Sciences. 2024; 14(1):359. https://doi.org/10.3390/app14010359
Chicago/Turabian StyleZhang, Nengqi, Zhi Chen, Henglin Xiao, Lifei Zheng, and Qiang Ma. 2024. "Experimental Study and Numerical Analysis of Temperature Stress in Carbon Fiber-Heated Concrete Pavement" Applied Sciences 14, no. 1: 359. https://doi.org/10.3390/app14010359
APA StyleZhang, N., Chen, Z., Xiao, H., Zheng, L., & Ma, Q. (2024). Experimental Study and Numerical Analysis of Temperature Stress in Carbon Fiber-Heated Concrete Pavement. Applied Sciences, 14(1), 359. https://doi.org/10.3390/app14010359