Article

A 3D-0D Computational Model of the Left Ventricle for Investigating Blood Flow Patterns for Cases of Systolic Anterior Motion and after Anterior Mitral Leaflet Splitting

College of Applied Medical Sciences, Prince Sattam Bin Abdulaziz University, Al-Kharj 11942, Saudi Arabia
Appl. Sci. 2024, 14(1), 466; https://doi.org/10.3390/app14010466
Submission received: 27 October 2023 / Revised: 23 December 2023 / Accepted: 3 January 2024 / Published: 4 January 2024
(This article belongs to the Section Biomedical Engineering)

Abstract

:
Valvular heart conditions significantly contribute to the occurrence of cardiovascular disease, affecting around 2–3 million people in the United States. The anatomical characteristics of cardiac muscles and valves can significantly influence blood flow patterns inside the ventricles. Understanding the interaction between the mitral valve and left ventricle structures enables using fluid–structure interaction simulations as a precise and user-friendly approach to investigating outcomes that cannot be captured using experimental approaches. This study aims to develop a 3D-0D computational model to simulate the consequences of extending the anterior mitral leaflet towards the left ventricle in the presence of the thickness of the left ventricular septum and the mitral valve device. The simulations presented in this paper successfully showcased the ability of the model to replicate occlusion occurring at the left ventricular outflow tract and illustrated the impact of this blockage on the flow pattern and pressure gradient. Furthermore, these simulations conducted following anterior mitral leaflet splitting can emphasize the significance of this technique in reducing the obstruction at the left ventricle outflow tract. The computational model presented in this study, combining 3D and 0D elements, provides significant insights into the flow patterns occurring in the left ventricle before and after anterior leaflet splitting. Thus, expanding this model can help explore other cardiac phenomena and investigate potential post-procedural complications.

1. Introduction

Valvular disorders of the heart are a prominent contributor to cardiovascular disease, impacting around 2–3 million individuals in the United States only [1]. Approximately 0.2% of the United States population is afflicted with hypertrophic cardiomyopathy (HCM), the predominant form of genetic heart disease [2,3]. This condition increases the susceptibility to heart failure, stroke, and many types of abnormal heart rhythms, including sudden cardiac death. HCM is a hereditary condition characterized by abnormal thickening of the heart muscle. Notably, more than two-thirds of HCM patients have an obstruction [4]. Hypertrophic Obstructive Cardiomyopathy (HOCM) is a significant cause of sudden cardiac deaths in young individuals, including highly skilled athletes, and affects both genders [5]. In most cases, the condition arises from an irregular enlargement of the interventricular septum, which leads to a narrowing that may impede or reduce the blood flow from the left ventricle (LV) to the aorta (Ao) [2,4,6]. Moreover, roughly 60% to 70% of these instances are characterized by the presence of systolic anterior motion (SAM) of the mitral valve (MV) and obstruction of the left ventricular outflow tract (LVOT) [7]. In addition to the thickening of the interventricular septum, the LVOT might experience a reduction in size either during or after cardiac valve surgeries. For example, therapies targeting mitral regurgitation (MR) may entail replacing the natural MV leaflet with either a metallic prosthetic valve or bioprostheses. These substitutions have the capacity to extend into the LVOT, potentially resulting in blockage [8].
In many cases, open MV surgery and the use of cardiopulmonary bypass are not viable due to a heightened surgical risk. Consequently, transcatheter MV implantation (TMVI) has emerged as an innovative alternative strategy for treating MR. TMVI is frequently performed in patients with irreparable MV disease, with a particular emphasis on preserving the intact mitral subvalvular apparatus [8]. Prior TMVI, all patients receive a contrast-dyed cardiac computed tomography (CT) scan to assess the LVOT and MV annulus. The obstruction of blood flow in the LVOT after TMVI can be caused by many reasons [9]. An example of a contributing component is the aorto-mitral-annular (AMA) angle, which denotes the angle created by the aortic and mitral valves. The angle influences the degree and orientation of the artificial mitral valve’s projection into the outflow tract [10]. Individuals diagnosed with HCM may increase the likelihood of encountering issues related to the Left Ventricular Outflow Tract (LVOT), which involve the thickening of the wall that separates the ventricles, a condition known as interventricular septal hypertrophy [11]. Additionally, having a smaller left ventricular chamber is considered a risk factor, as a bigger left ventricular cavity is normally more suitable for accommodating an artificial prosthetic MV [12].
Preserving the anterior mitral leaflet (AML) after TMVI might result in the narrowing of the LVOT [13,14]. Flow obstruction at LVOT may occur because of struts from the artificial valve protruding into the LVOT, or due to the AML being excessively elongated and protruding into the outflow tract. Placing a transcatheter heart valve into the native MV necessitates the AML planes to be in an open position, which may possibly obstruct the LVOT. The displacement of the AML towards the septum is more pronounced in specific situations, such as when the AMA planes are sharply angled, the septum between the ventricles bulges into the LVOT, and the AML is elongated. This shift can cause a considerable blockage in the LVOT, especially during TMVI. Moreover, after TMVI, a very enlarged AML may protrude forward into a narrowed LVOT, resembling situations seen in hypertrophic cardiomyopathy. To address this problem, a clinical approach involves surgically dividing the AML to alleviate the blockage in the residual space in the LVOT following the TMVI implantation (neo-LVOT), hence preventing the obstruction of the LVOT [15,16]. LVOT obstruction poses a substantial potential concern with TMVI, limiting its use in many patients [17,18]. By employing pre-procedural CT scans, it is possible to create customized models of the LV, which may then be used to mimic TMVI surgeries. Additionally, computational flow dynamic simulations can help in predicting the LVOT gradient after the surgery and can be considered as cost-effective tools for aiding clinical decisions and planning procedures before MV replacement.
Comprehending the interaction between the MV and the structure of the left heart enables the use of fluid–structure interaction (FSI) simulations as a precise and user-friendly approach to investigate outcomes that cannot be measured using clinical or experimental approaches. FSI modeling also emerges as a potent technique that could navigate structural heart interventions and facilitate the extended, more precise, and prevalent utilization of TMVI methodologies [15,19,20]. The objective of this study was to develop a computer model that use 3D FSI to simulate the consequences of moving the anterior leaflet of the MV towards the LV, taking into account the thickness of the left ventricular septum and the existence of a MV device. The model integrates geometrically ideal AML into a similarly idealized LV. The dimensions of the mitral annulus and anterior leaflet were obtained from anatomical measurements. The flow of blood was described using an incompressible Navier–Stokes fluid formulation. The Arbitrary Lagrangian–Eulerian (ALE) approach was utilized to compute the mesh deformation in both the fluid and solid areas. Furthermore, the inlet and outlet boundaries are connected to a 0D closed-loop circulatory circuit that inherently preserves blood volume. This 0D model offers a more precise representation of the cardiovascular system, thereby enhancing the accuracy of simulating cardiovascular dynamics.

2. Materials and Methods

2.1. Model Geometry

A 3D idealized model of the LV and anterior leaflet of MV was developed based on the clinical measurements obtained from previous studies. The long and short lengths of LV were derived from Schnittger et al. [21], while the dimensions of the AML were based on the model given by [22]. In this model, the junction of the MV and AoV planes was assumed to remain constant at 140 degrees [23]. MV prosthesis is comprising an atrial skirt to prevent leaking around the valve and a ventricular part for stability. In this model, a comprehensive depiction of the MV prosthesis was excluded. A simpler D-shaped prosthesis was inserted into the LV, with its length selected to be smaller than the MV posterior native leaflets (11 mm); see Figure 1a,b.
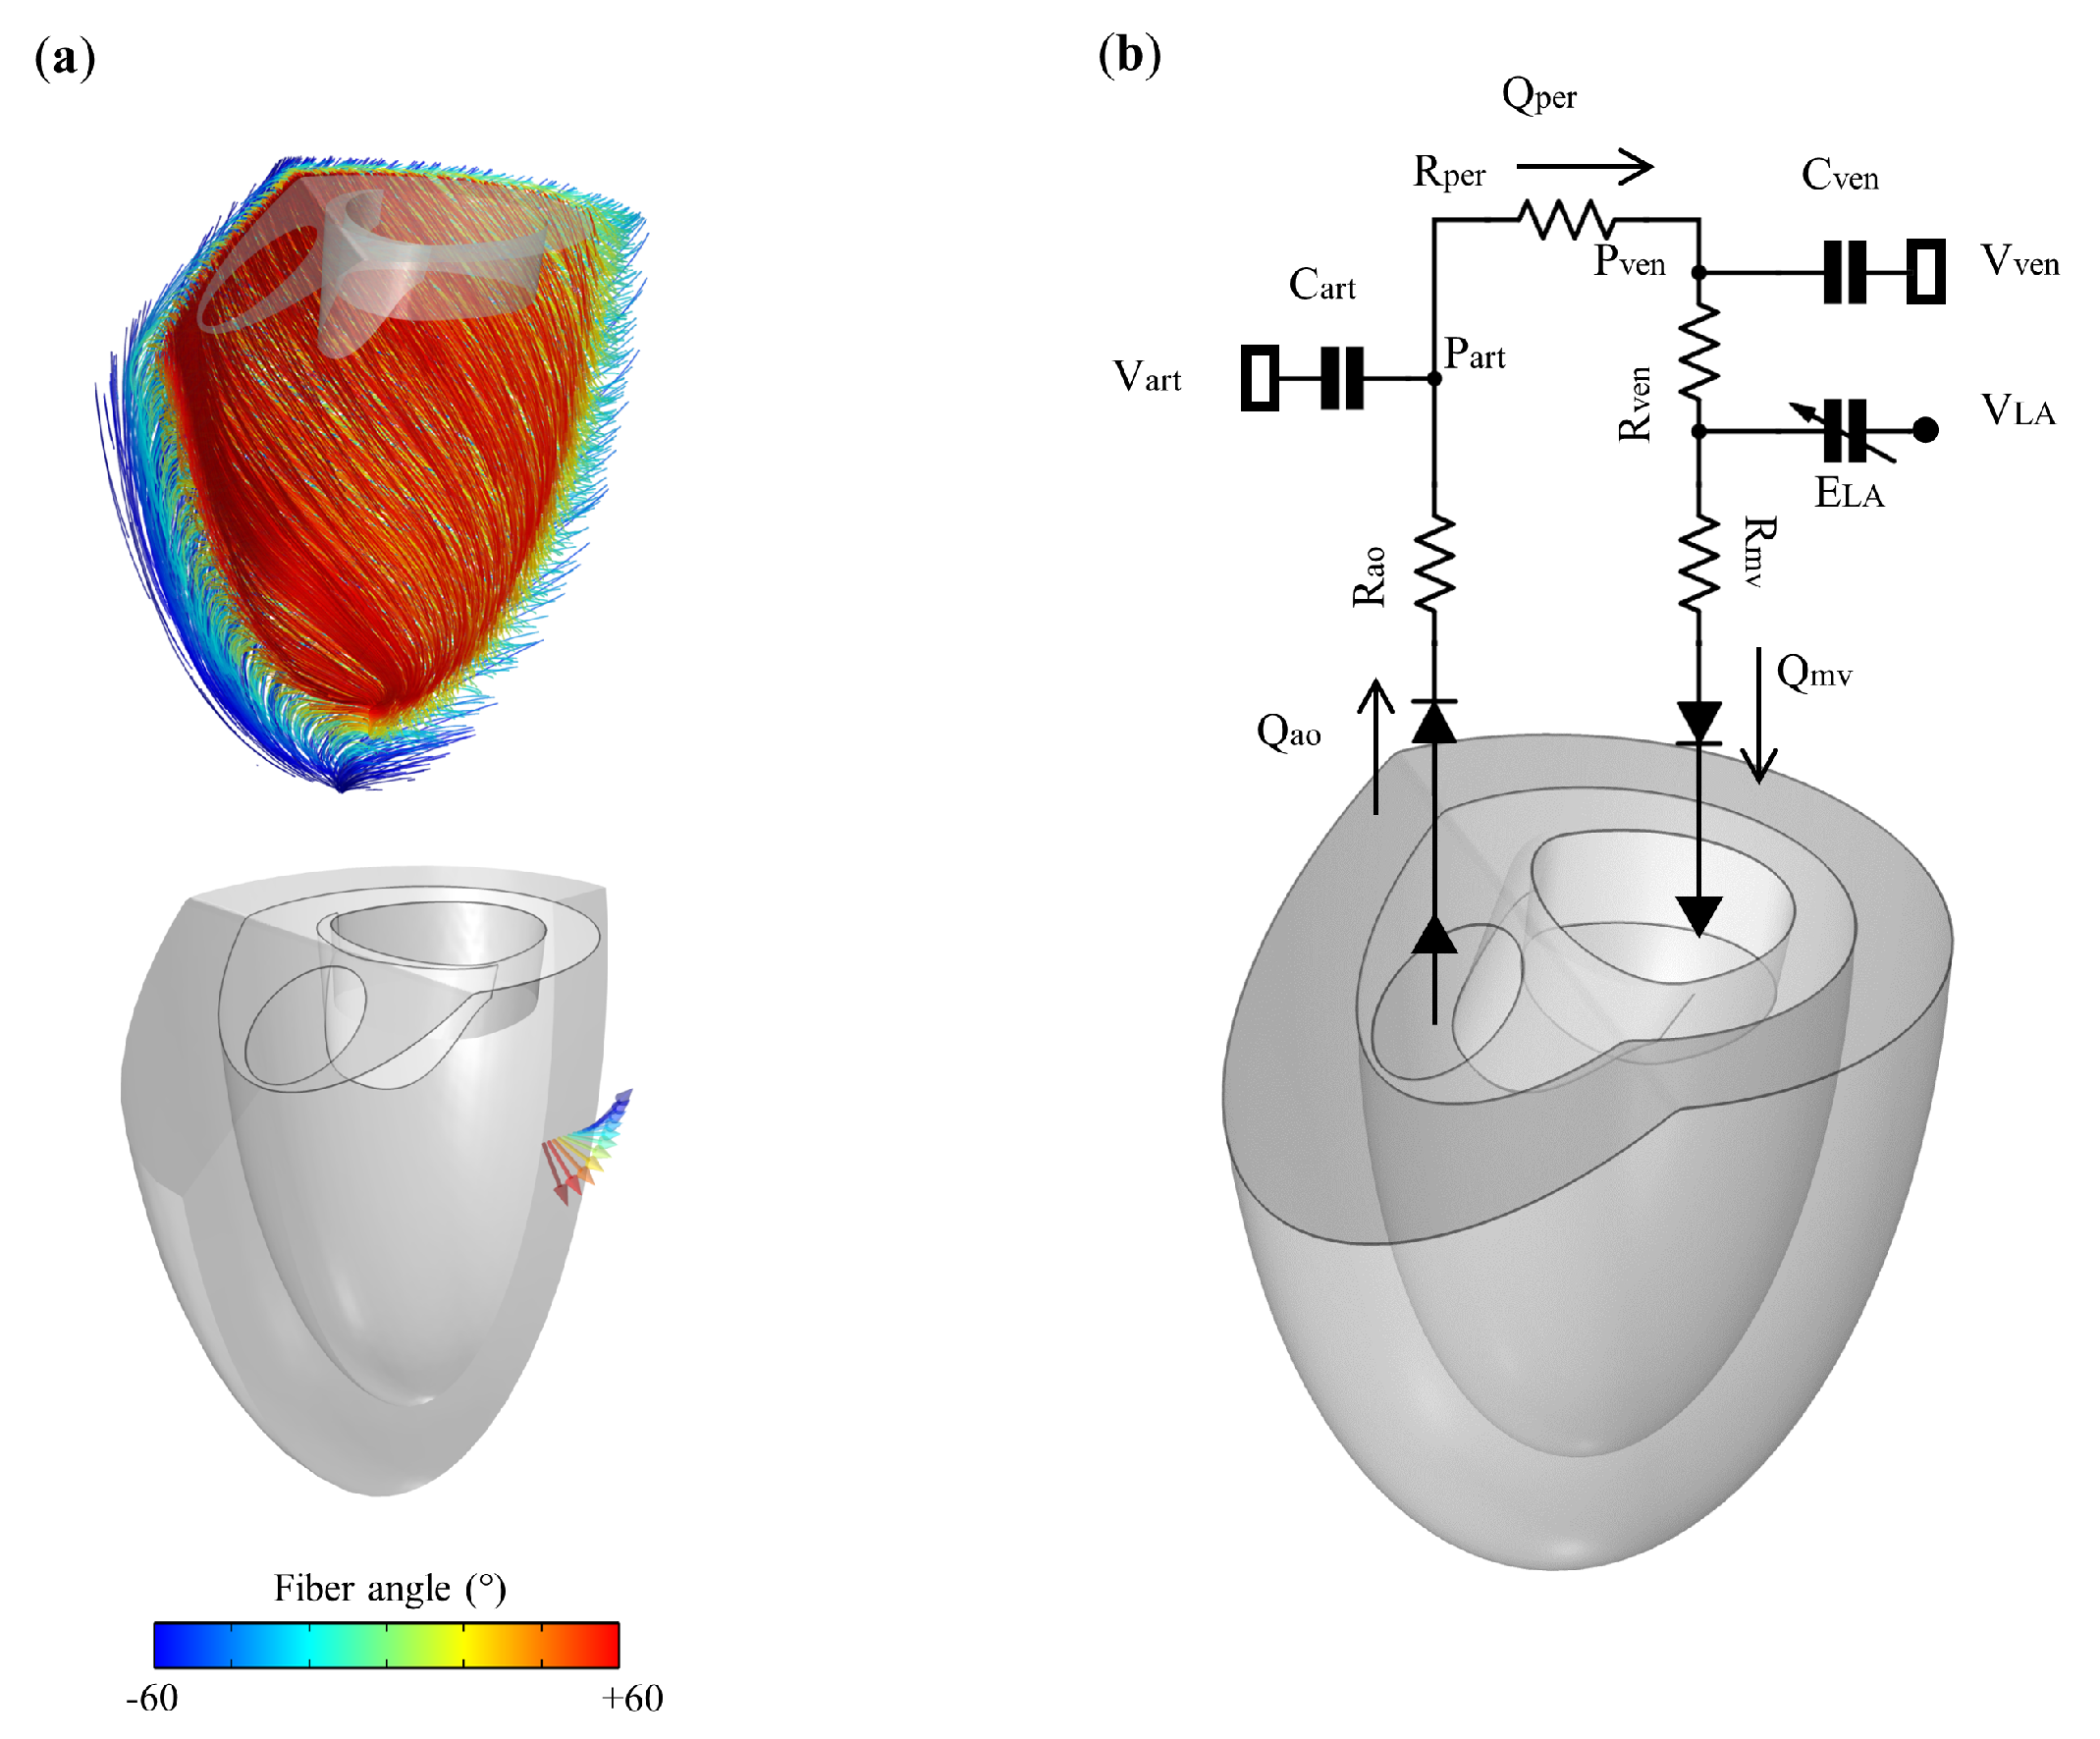
The left ventricular myocardial fibers have three distinct orientations in their architecture: local fiber, sheet, and normal-to-sheet, as detailed by Legrice et al. [24]. The developed 3D LV model specifies that the muscle fibers have a direction of −60° at the epicardium and +60° at the endocardium, relative to the circumferential plane that is perpendicular to the long axis of the LV [24] (see Figure 2a). The myocardium’s fiber orientation was estimated by using interpolation, which considered the proximity of each point to adjacent locations on the epicardial and endocardial surfaces [25]. Additional in-depth information explaining the process of reconstructing LV myocardial fiber orientation can be found in [25,26].

2.2. LV Mechanics and Fluid Formulation

The transverse isotropic hyperelastic model proposed by Holzapfel and Ogden [27] was utilized to describe the passive reaction of the LV (see Equation (1)).
ψ = a i 2 b i e x p ( b ( I 1 3 ) ) ψ i s o + a f 2 b f e x p ( b f ( I 4 f 1 ) 2 1 ) ψ f + 1 2 k ( J 1 ) l n ( J ) ) ) ψ v o l
The strain energy function ψ can be divided into three components: ψ i s o for isotropic behavior, ψ f for fiber behavior, and ψ v o l for volumetric behavior. Additionally, the first isochoric invariant of the right Cauchy–Green tensor, C , is denoted by I 1 . The fourth isochoric invariant, I 4 f , accounts for transverse isotropy and is defined as F · ( C F ) . Here, F represents the orientation of the local fiber unit vector. The determinant of the deformation gradient tensor is symbolized as J in the ψ v o l component. It should be emphasized that cardiac fibers have an impact on the overall strain-energy function, ψ , only when the value of I 4 f > 1 [27]. Small portion of LV apex, as shown in Figure 1a, were designated to have isotropic characteristics. Therefore, only the strain-energy associated with isotropic deformation, denoted as ψ i s o , was applied to this segment. The parameters utilized in ψ are adopted from [27], where the isotropic parameters, a i and b i , are set to 2.280 KPa and 9.726, respectively. ψ f , a f and b f in ψ f are set to 1.685 KPa and 15.779, respectively. k in the volumetric part is set to 250 KPa.
The active stress associated with muscular contraction, denoted as T A (Equation (3)) and integrated into the second Piola–Kirchhoff stress tensor, S , as follows:
T A = K T A e [ ( 6 t 1.8 ) 4 ] t < 0.28 s e [ ( 1.8 t 0.504 ) 2 ] t 0.28 s
T = ψ E + T A [ S S 2.5 + N N 2.5 + F F ]
where E in Equation (3) corresponds to the Green–Lagrange strain tensor, K T A in Equation (2) denotes the amplitude of contractile strength and was set to 100 kPa [27,28]. The ventricular systole begins at a time of 0.28 s. Based on the results of [29], it is significant to notice that the active stress K T A contributes only 40% in S and N compared to the active tension in the F , as shown in Equation (3). The velocity and pressure of the blood flow were determined by solving the incompressible Navier–Stokes equation (Equation (4)) and the mass continuity equation (Equation (5)), respectively.
ρ f u f t + ρ f ( u f · x ) u f = x · ( p I + μ f ( x u f + ( x u f ) T ) )
x u f = 0
The velocity of the fluid in the LV cavity is represented by u f , while the pressure is denoted by the symbol p. In Equations (4) and (5), the symbol I denotes the identity matrix, while x represents the spatial gradient, defined as x = ( x , y ) T . The blood’s density and viscosity, represented as ρ f and μ f , respectively, were set to 1060 kg/m 3 and 4.71 × 10 3 Pa s. The two-way coupling framework accurately captured the interaction between blood and LV structure. More precisely, the velocity of the fluid, denoted as u f , was made equal to u s t (velocity at the LV structure surfaces). The Yeoh smoothing method was utilized to determine the displacement of the deformed mesh, thus facilitating a more consistent deformation of the mesh.

2.3. 0D Closed-Loop Windkessel Circulatory

To integrate the pre- and after-load circulatory systems into the 3D LV model, the outlet and inlet boundaries were linked to a 0D closed-loop circulatory circuit (Figure 2b), which was developed by [30]. The preservation of the overall blood volume was achieved by solving Equations (6)–(8) that describe the rate at which the volume changes in each compartment of the closed-loop analogue circuit.
d V L A d t = Q v e n ( t ) Q i n ( t )
d V a r t d t = Q a o ( t ) Q p e r ( t )
d V v e n d t = Q p e r ( t ) Q v e n ( t )
The inflow into the LV, represented as Q m v , was determined by integrating the velocity of the normal flow across the boundary of the inlet (MV annular plane). Moreover, the volume of the LV, denoted as V L V , was calculated by integrating the fluid domain inside the ventricle. The flow rates of blood volume within various compartments of the circulatory model were represented as follows:
Q a o = P L V , a o P a r t R a o P l v , a o P a r t 0 P L V , a o < P a r t
Q p e r = P a r t P v e n R p e r
Q v e n = P v e n P L A R v e n
The venous pressure, P v e n , and arterial pressure, P a r t , were calculated based on the venous and arterial volumes using Equations (12) and (13). In addition, P L V , a o denoted the outlet boundary pressure.
P v e n = V v e n V v e n , 0 C v e n
P a r t = V a r t V a r t , 0 C a r t
The initial volumes of the venous and arterial systems are represented as V v e n , 0 and V a r t , 0 , respectively. The venous system’s compliance is denoted as C v e n , while the arterial system’s compliance is denoted as C a r t . The pressure of the LA, P L A , was calculated using a prescribed function based on its volume V L A :
P L A = P l a , 0 + E L A ( V L A V L A , 0 )
where
E L A = E L A , m i n + e ( t ) ( E L A , m a x E L A , m i n )
and
e ( t ) = 1 2 1 cos ( π ( t 0.74 ) 0.16 ) , 0.74 s < t 0.90 s 1 2 1 + cos ( π ( t 0.90 ) 0.16 ) , t > 0.90 s 1 2 1 + cos ( π ( t 0.90 ) 0.16 ) , 0 t < 0.10 s
The function e ( t ) denotes a normalized time-varying elastance function that characterizes the contraction of the LA. The parameters of the 0D closed-loop circulatory circuit, originally proposed by [30], have been utilized with certain modifications for this study (see Table 1).
The generated 3D generic model utilized a fully coupled direct solver (PARDISO) and an automated Newton technique. In order to achieve stability in the Navier–Stokes equations, a hybrid approach using both streamline and crosswind diffusion numerical approaches is employed [31]. The simulation results were recorded at 2 ms intervals. The solution for time-dependent problems was configured with absolute and relative tolerances both set to 0.01. The mesh elements of the 3D model were created using a combination of prism, tetrahedral and pyramidal elements using COMSOL Multiphysics software (COMSOL AB, Stockholm, Sweden). To accurately capture the fluid-wall interactions near the myocardium, boundary layers consisting of two thickness elements were applied. Using the same configuration for the model, simulations were conducted using two different meshes, each with a maximum element size of 3 mm and 1.5 mm. The discrepancies in the measurements of pressure and velocity were found to be less than 5%. Consequently, our analysis led us to determine that a mesh with a maximum element size of 3 mm would be appropriate for all simulations pertaining to this 3D model.

2.4. Model Setting for SAM Simulations

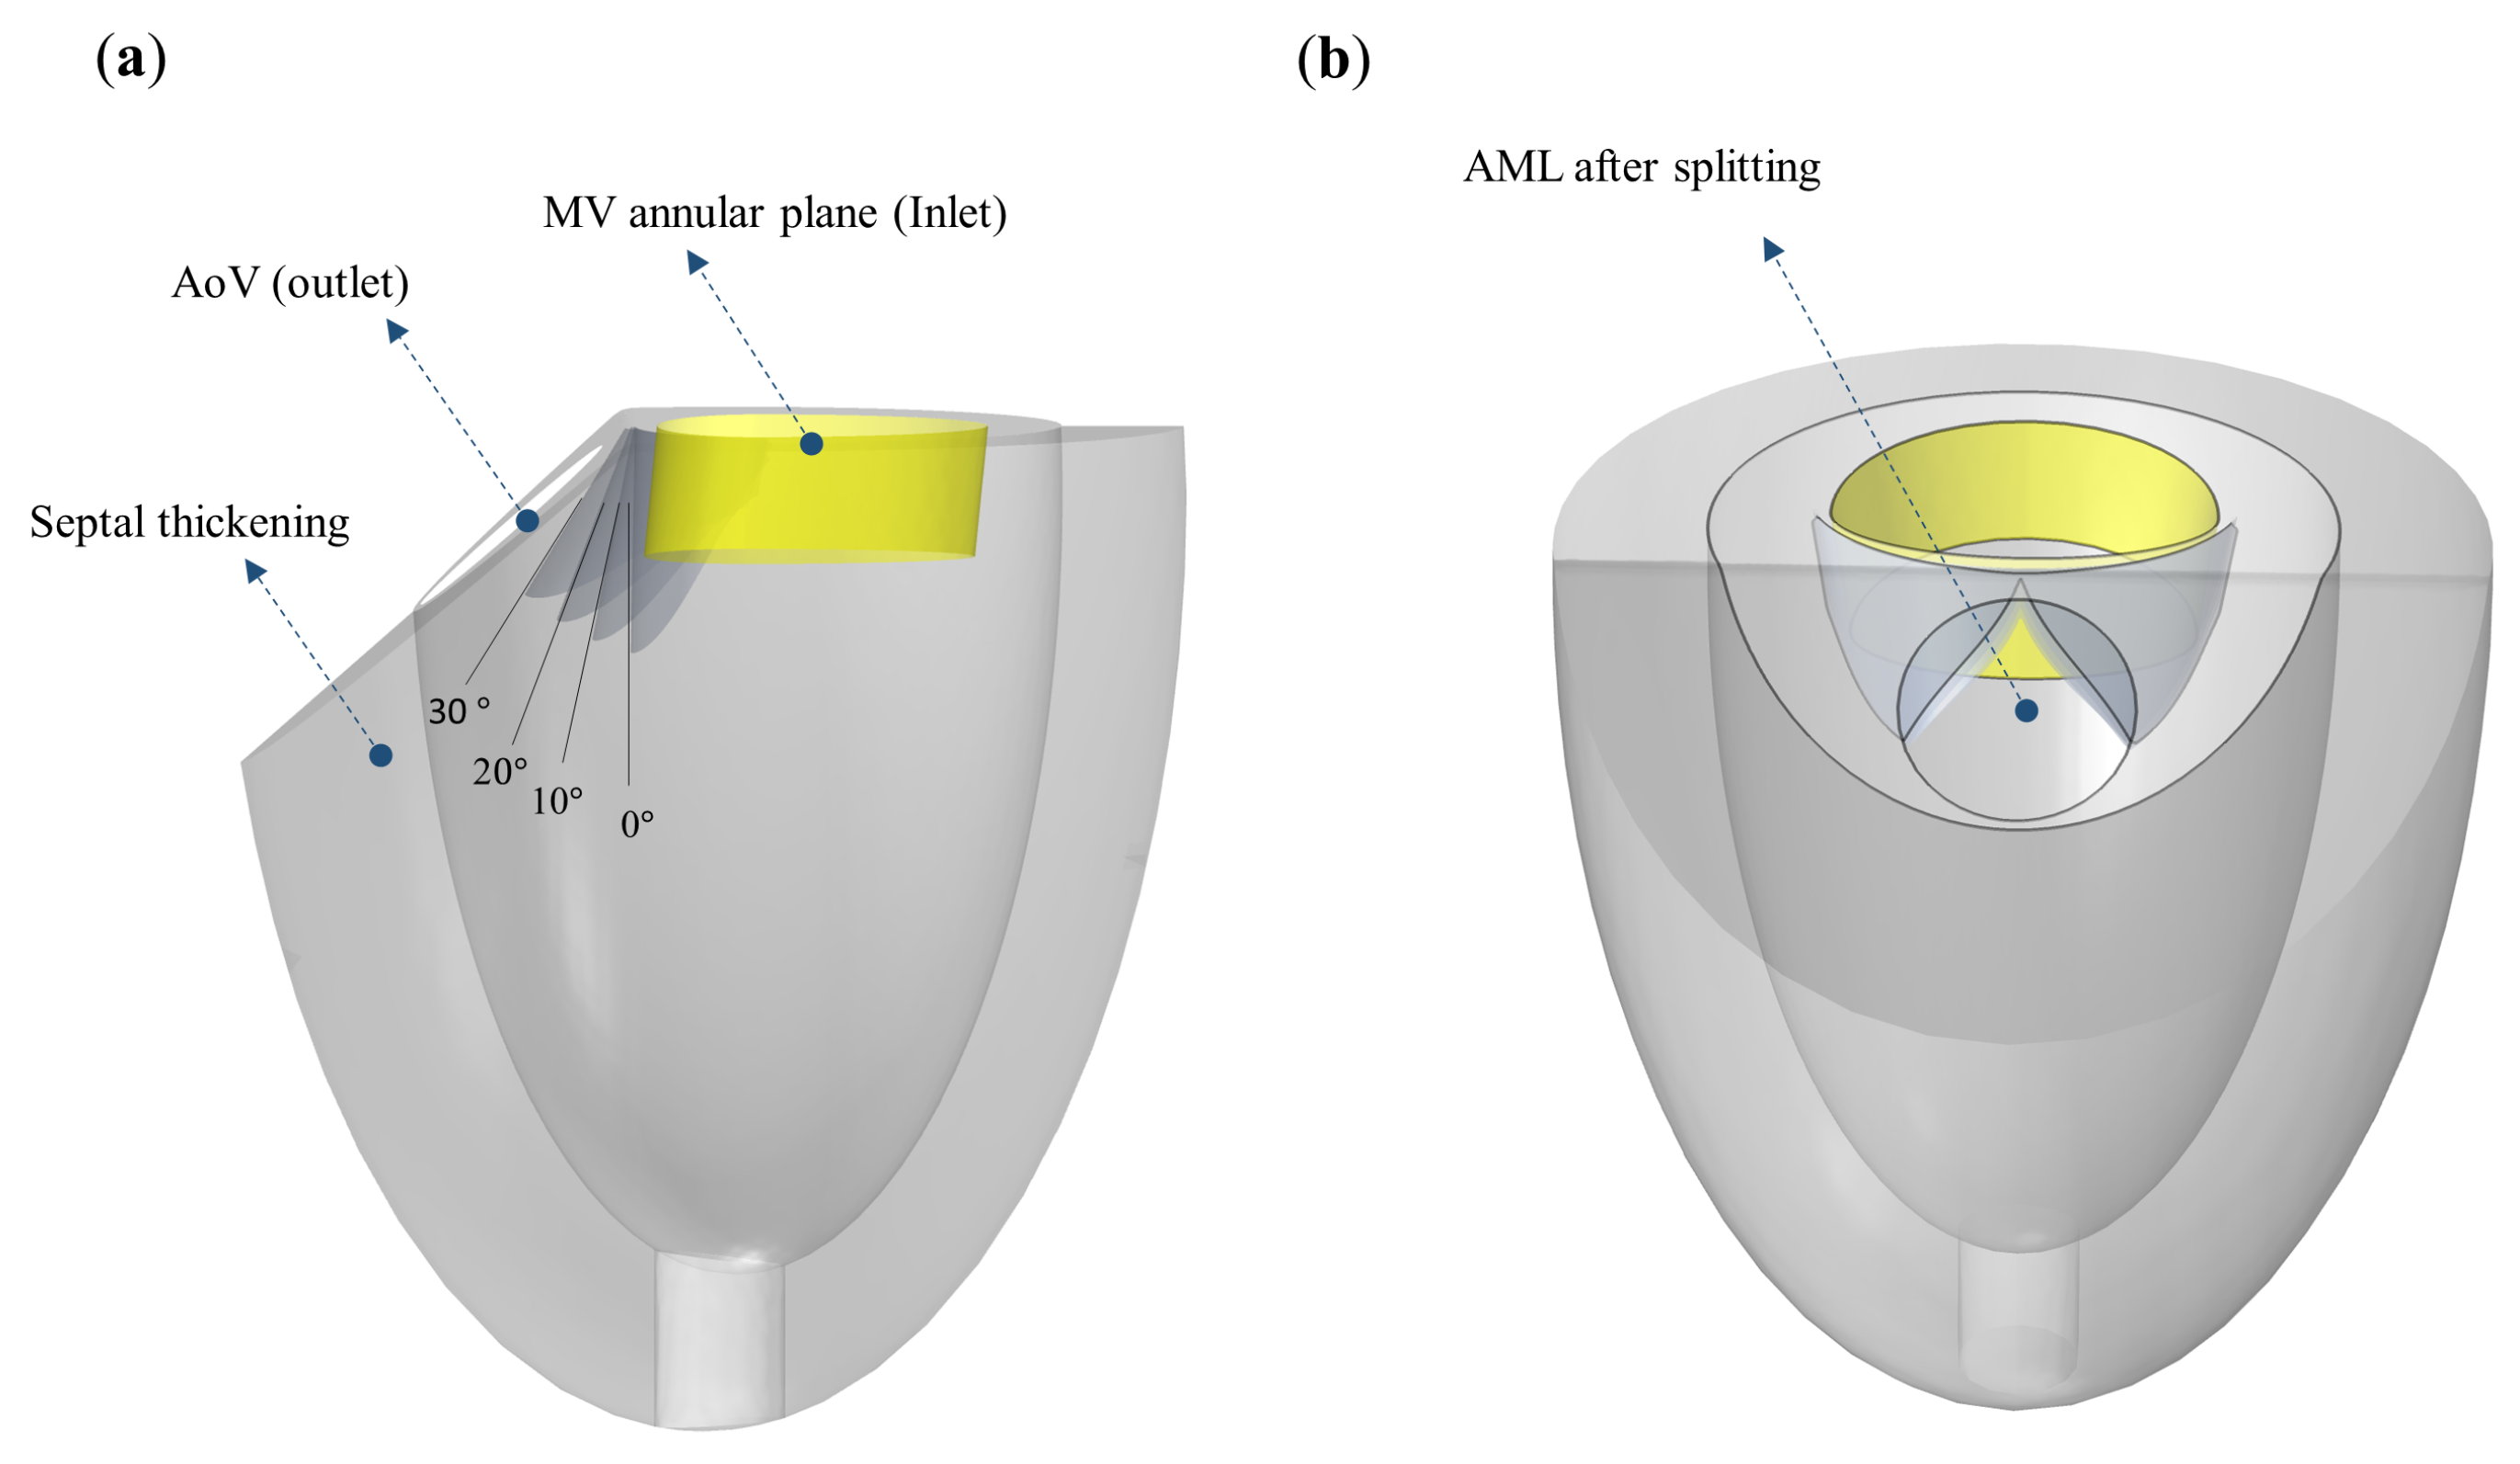
In this 3D model, the anterior leaflet of MV was simulated as rigid part. Furthermore, a no-slip boundary conditions was applied on both the anterior leaflet and the artificial mitral valve boundary, as the latter is indicated in yellow in Figure 3. The MV anterior leaflet was rotated at various angles ranging from 0° (original position) to 30° towards the outflow tract, with increment of 10° (see Figure 3a). Additionally, the laceration (splitting) of the anterior MV leaflet at these different angles are illustrated in Figure 3b.

3. Results and Discussion

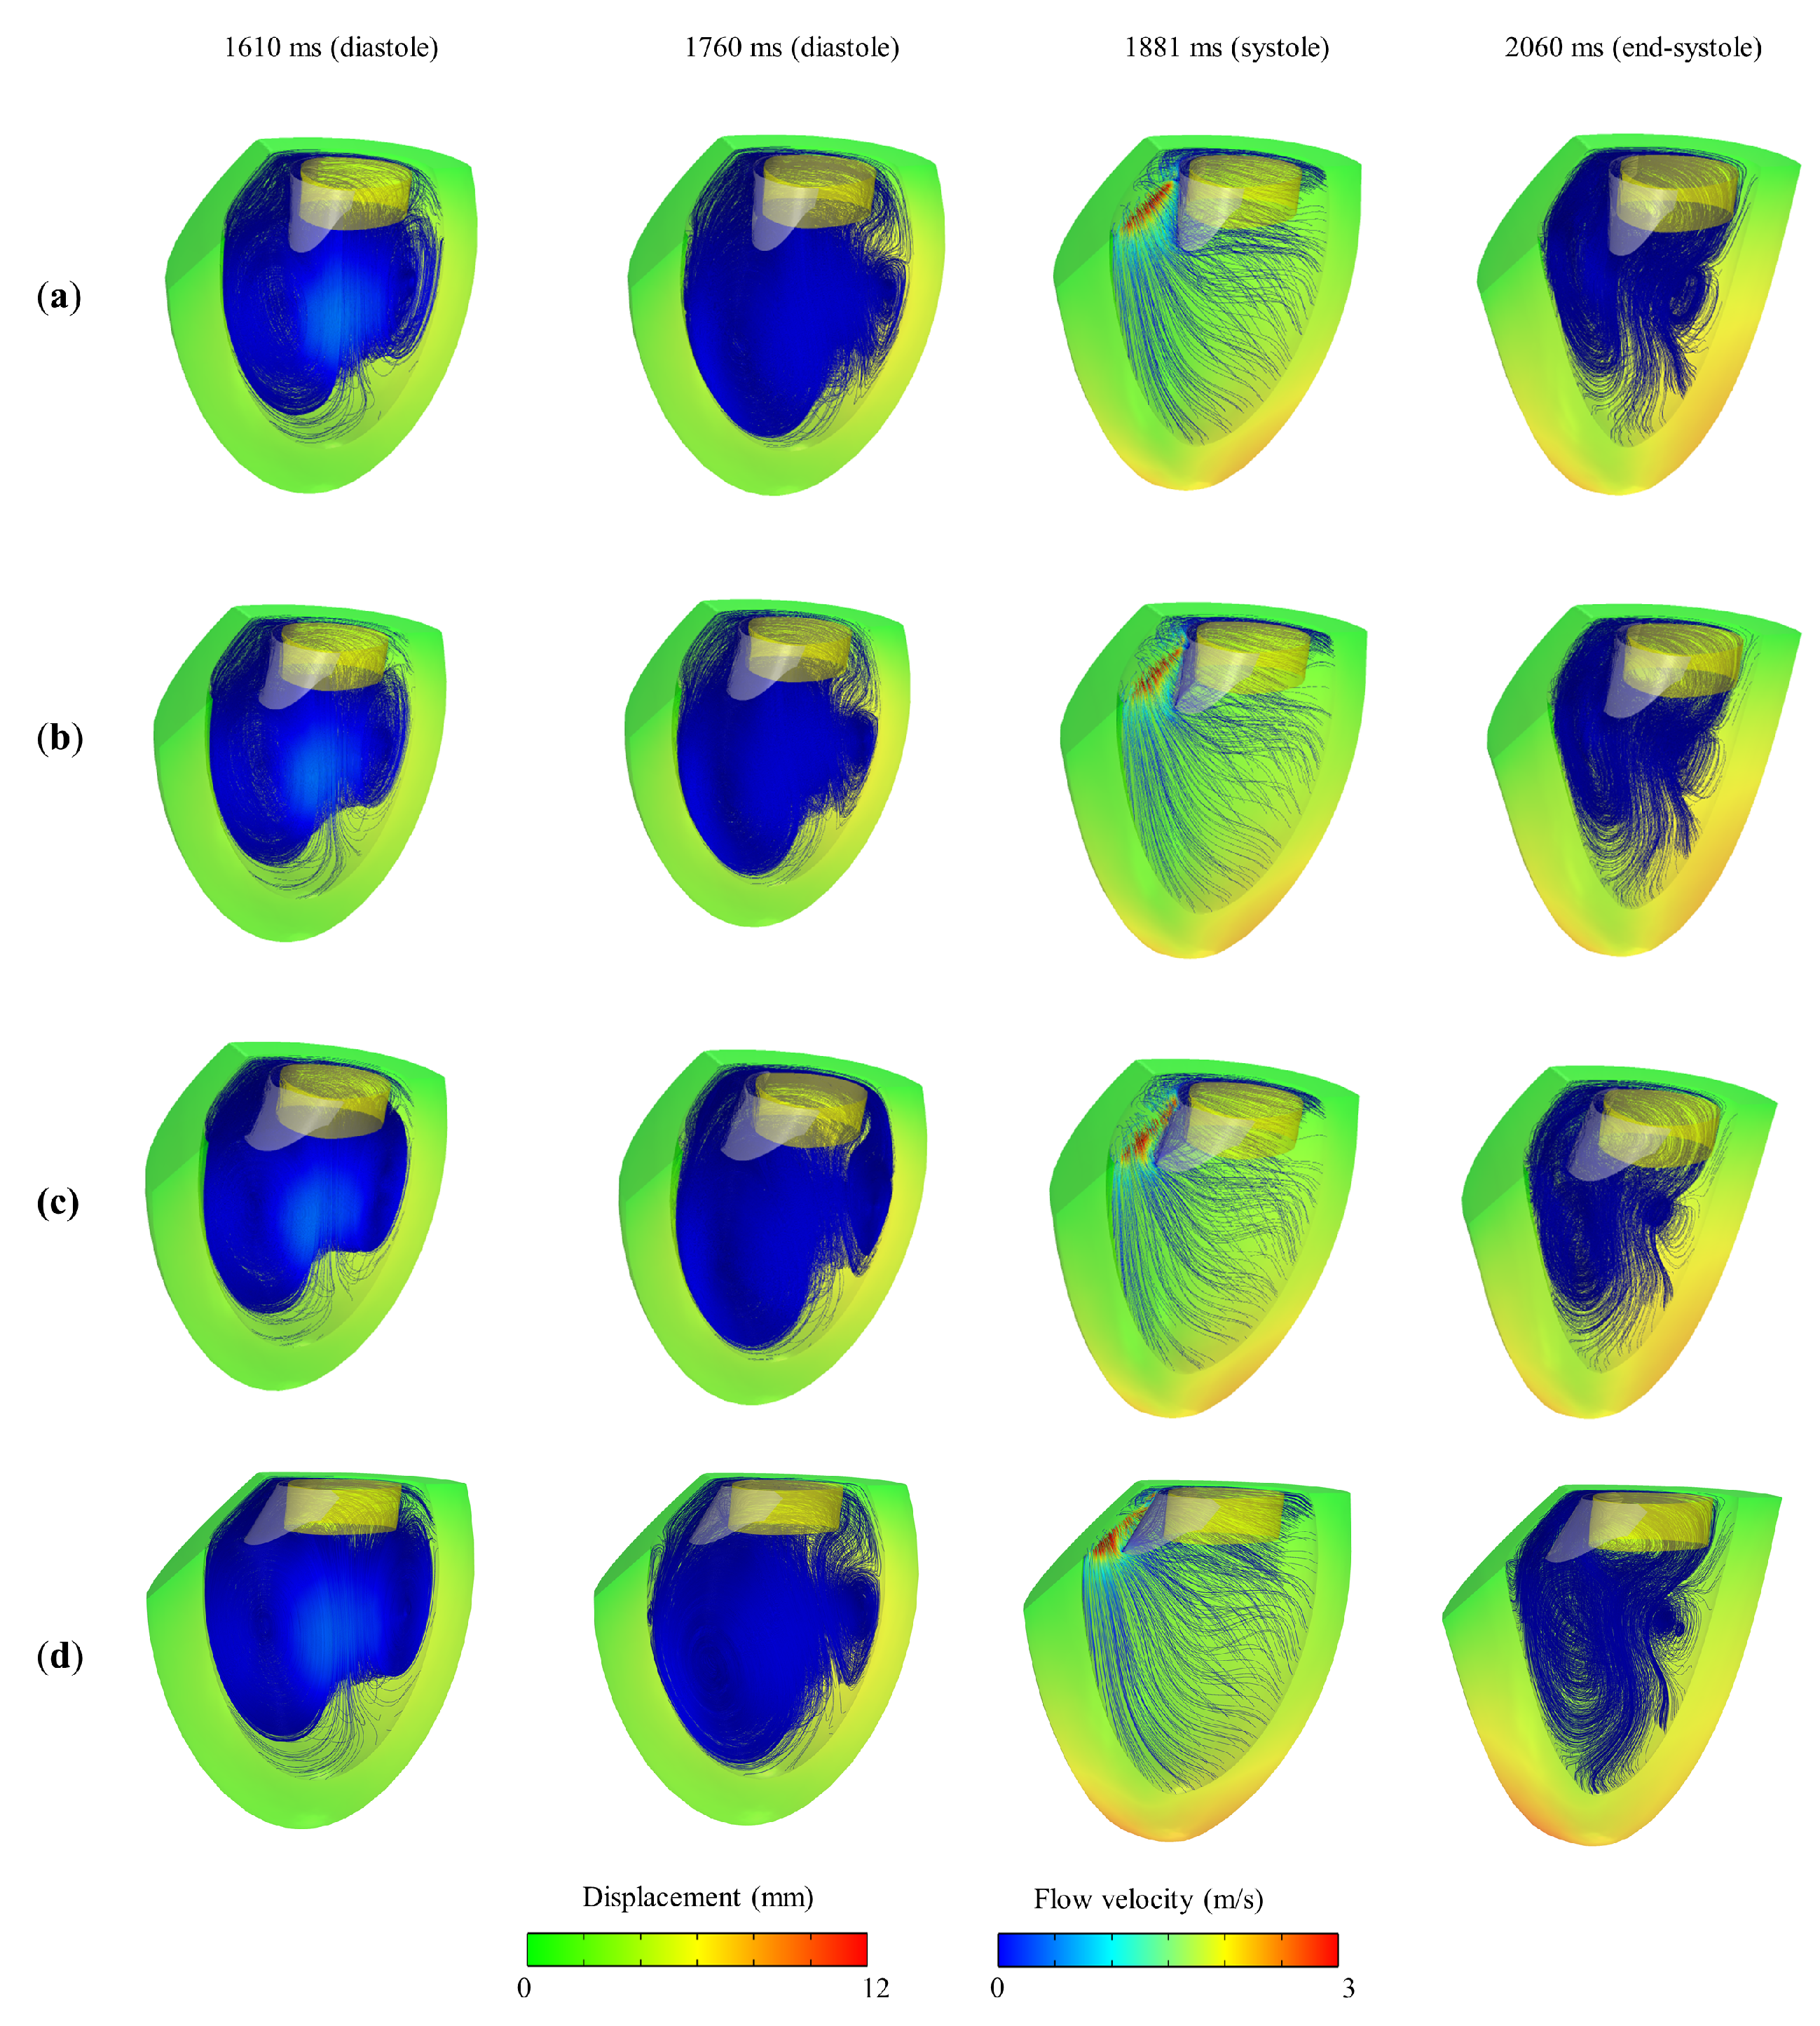
The model was executed for several cardiac cycles, and the results were examined after the model achieved a steady-state, as shown in Figure 4a. Figure 5 shows the velocity streamlines and structural deformation at four distinct time points throughout the cardiac cycle of the simulated 3D LV model. The filling phase (diastole) can be seen at time 1610 ms. The snapshot captured at 1760 ms displays the iso-volumetric contraction following the filling phase. Furthermore, during the closure of the MV and the subsequent opening of the AoV, the blood is directed into the after-load (systemic) circulation, as demonstrated at 1881 ms. Thereafter, the pressure in the LV decreases during the iso-volumetric relaxation as shown at 2060 ms. The occlusion of blood circulation at the LVOT is evident when the AML is shifted towards the outflow tract. Figure 5d demonstrates that obvious blockage occurs when the AML extends significantly into the outflow tract, resulting in elevated pressure gradients. In Figure 5, simulations illustrate that protrusion of AML into the LVOT leads to a higher degree of obstructed blood flow.
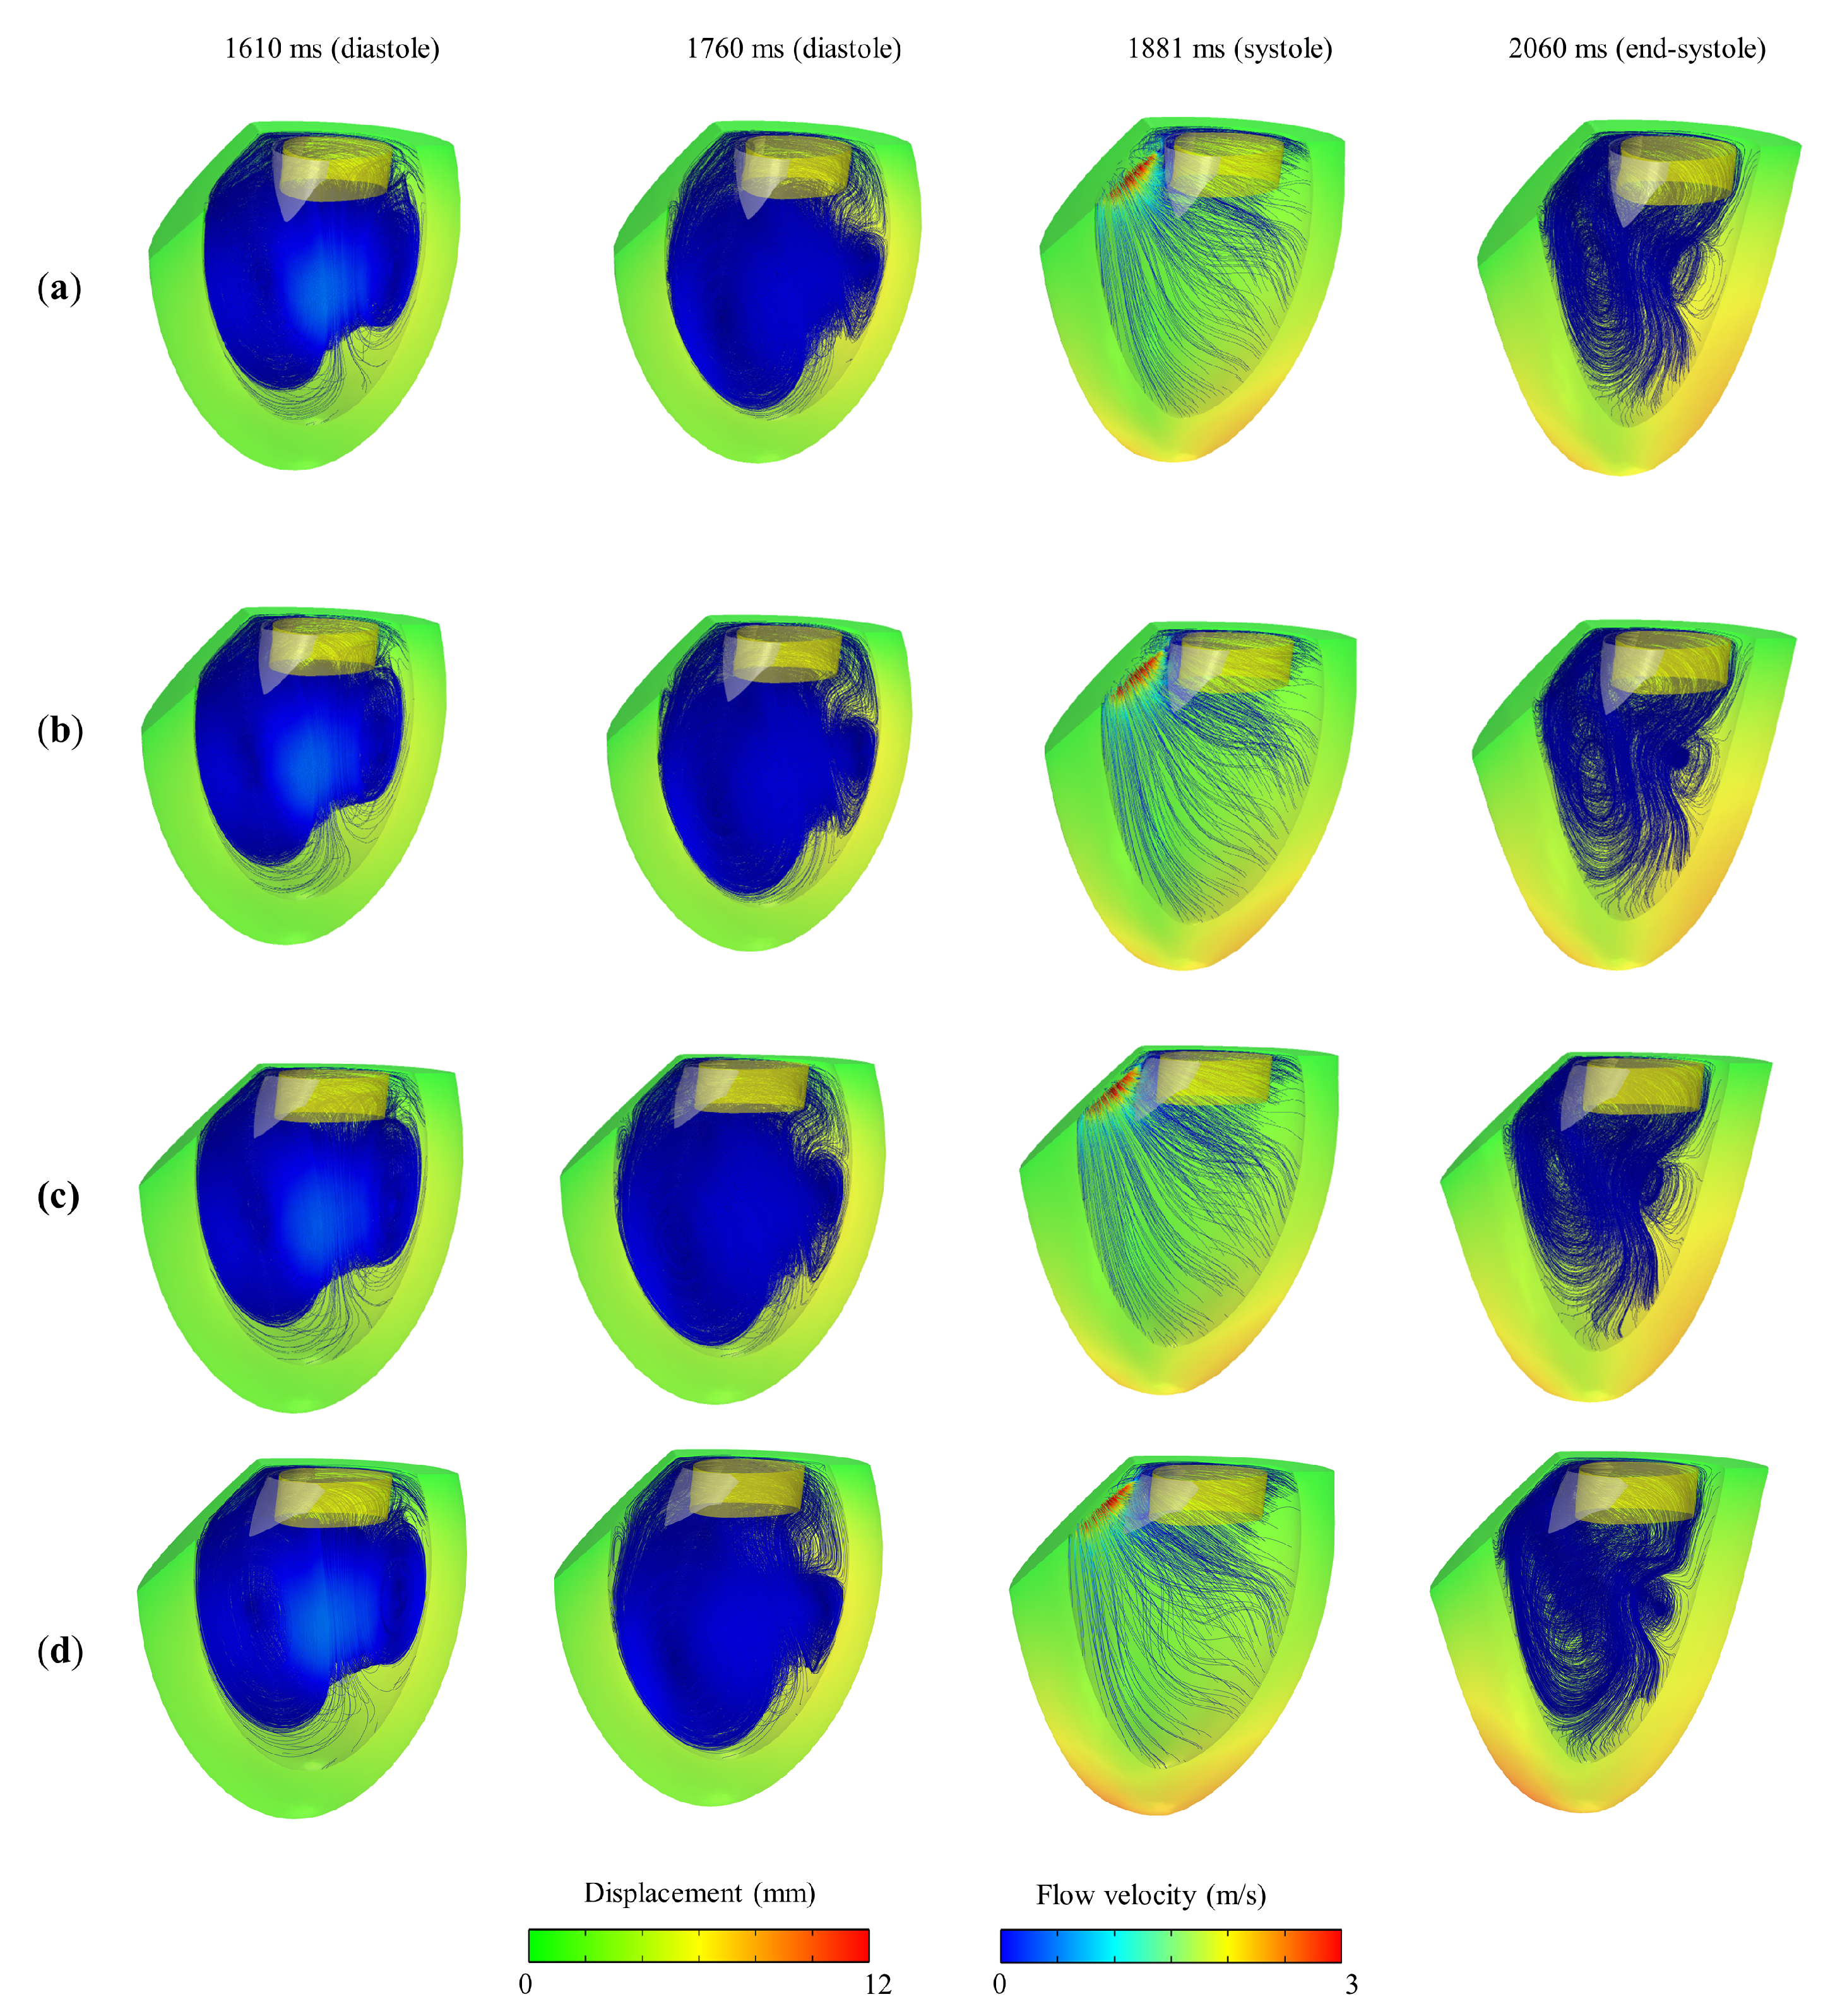
As part of this study, we simulated the four angles of AML after the anterior leaflet splitting (laceration) in order to investigate of its impact on the flow pattern at the LVOT. After MV anterior leaflet splitting, obstruction at the LVOT diminish as the blood flows seamlessly towards the AoV (see Figure 6). Additionally, Figure 6d shows less obstruction to the LVOT flow in comparison with case (d) when AML is preserved (Figure 5).
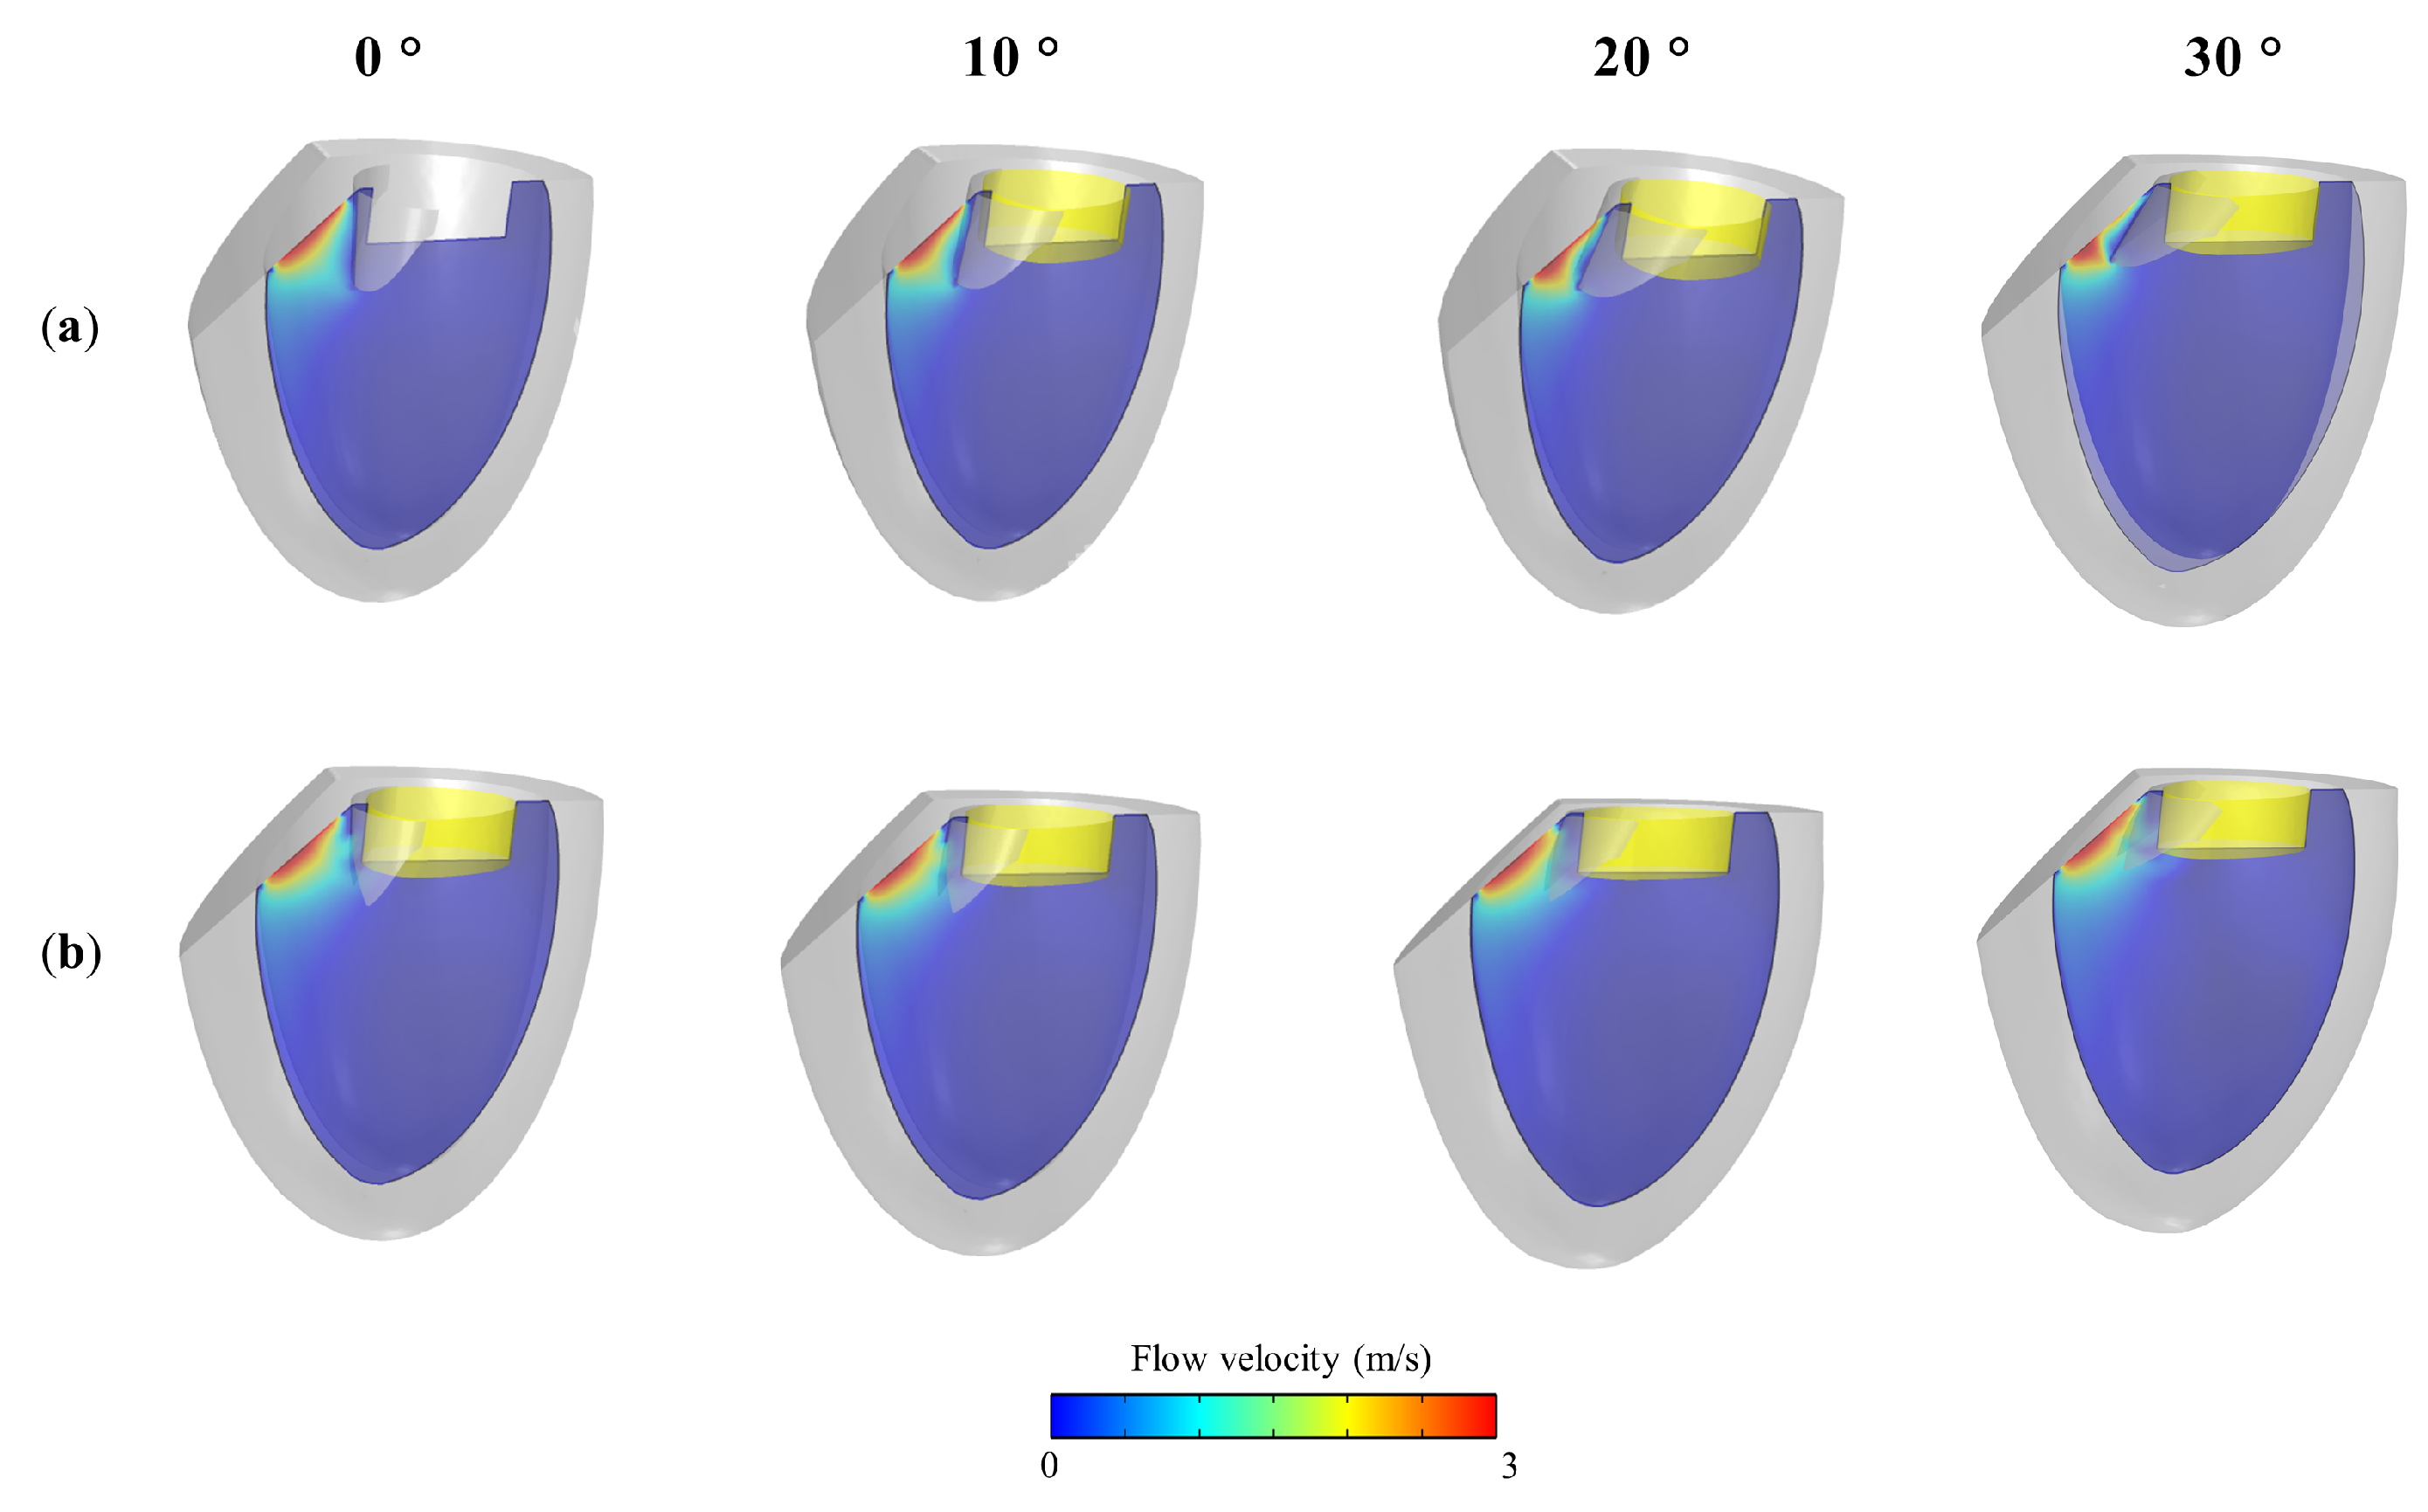
Snapshots of flow velocity profiles at different angulation of MV anterior leaflet are shown in Figure 7. It can be seen clearly the different flow profiles when displacing the AML towards LVOT from 0° to 30° (see Figure 7a). At 0°, no flow obstruction was seen as the blood is smoothly driven into the AoV. Moreover, slight obstacle to the flow was illustrated at angle 10° and 20°, while excessive simulation of the MV anterior leaflet, at 30°, reveals higher obstruction of the blood flow in comparison with 0°, 10° and 20°. Following the division of the AML, noticeable alterations were observed in the blood flow pattern during the ejection phase through the AoV (see Figure 7b).
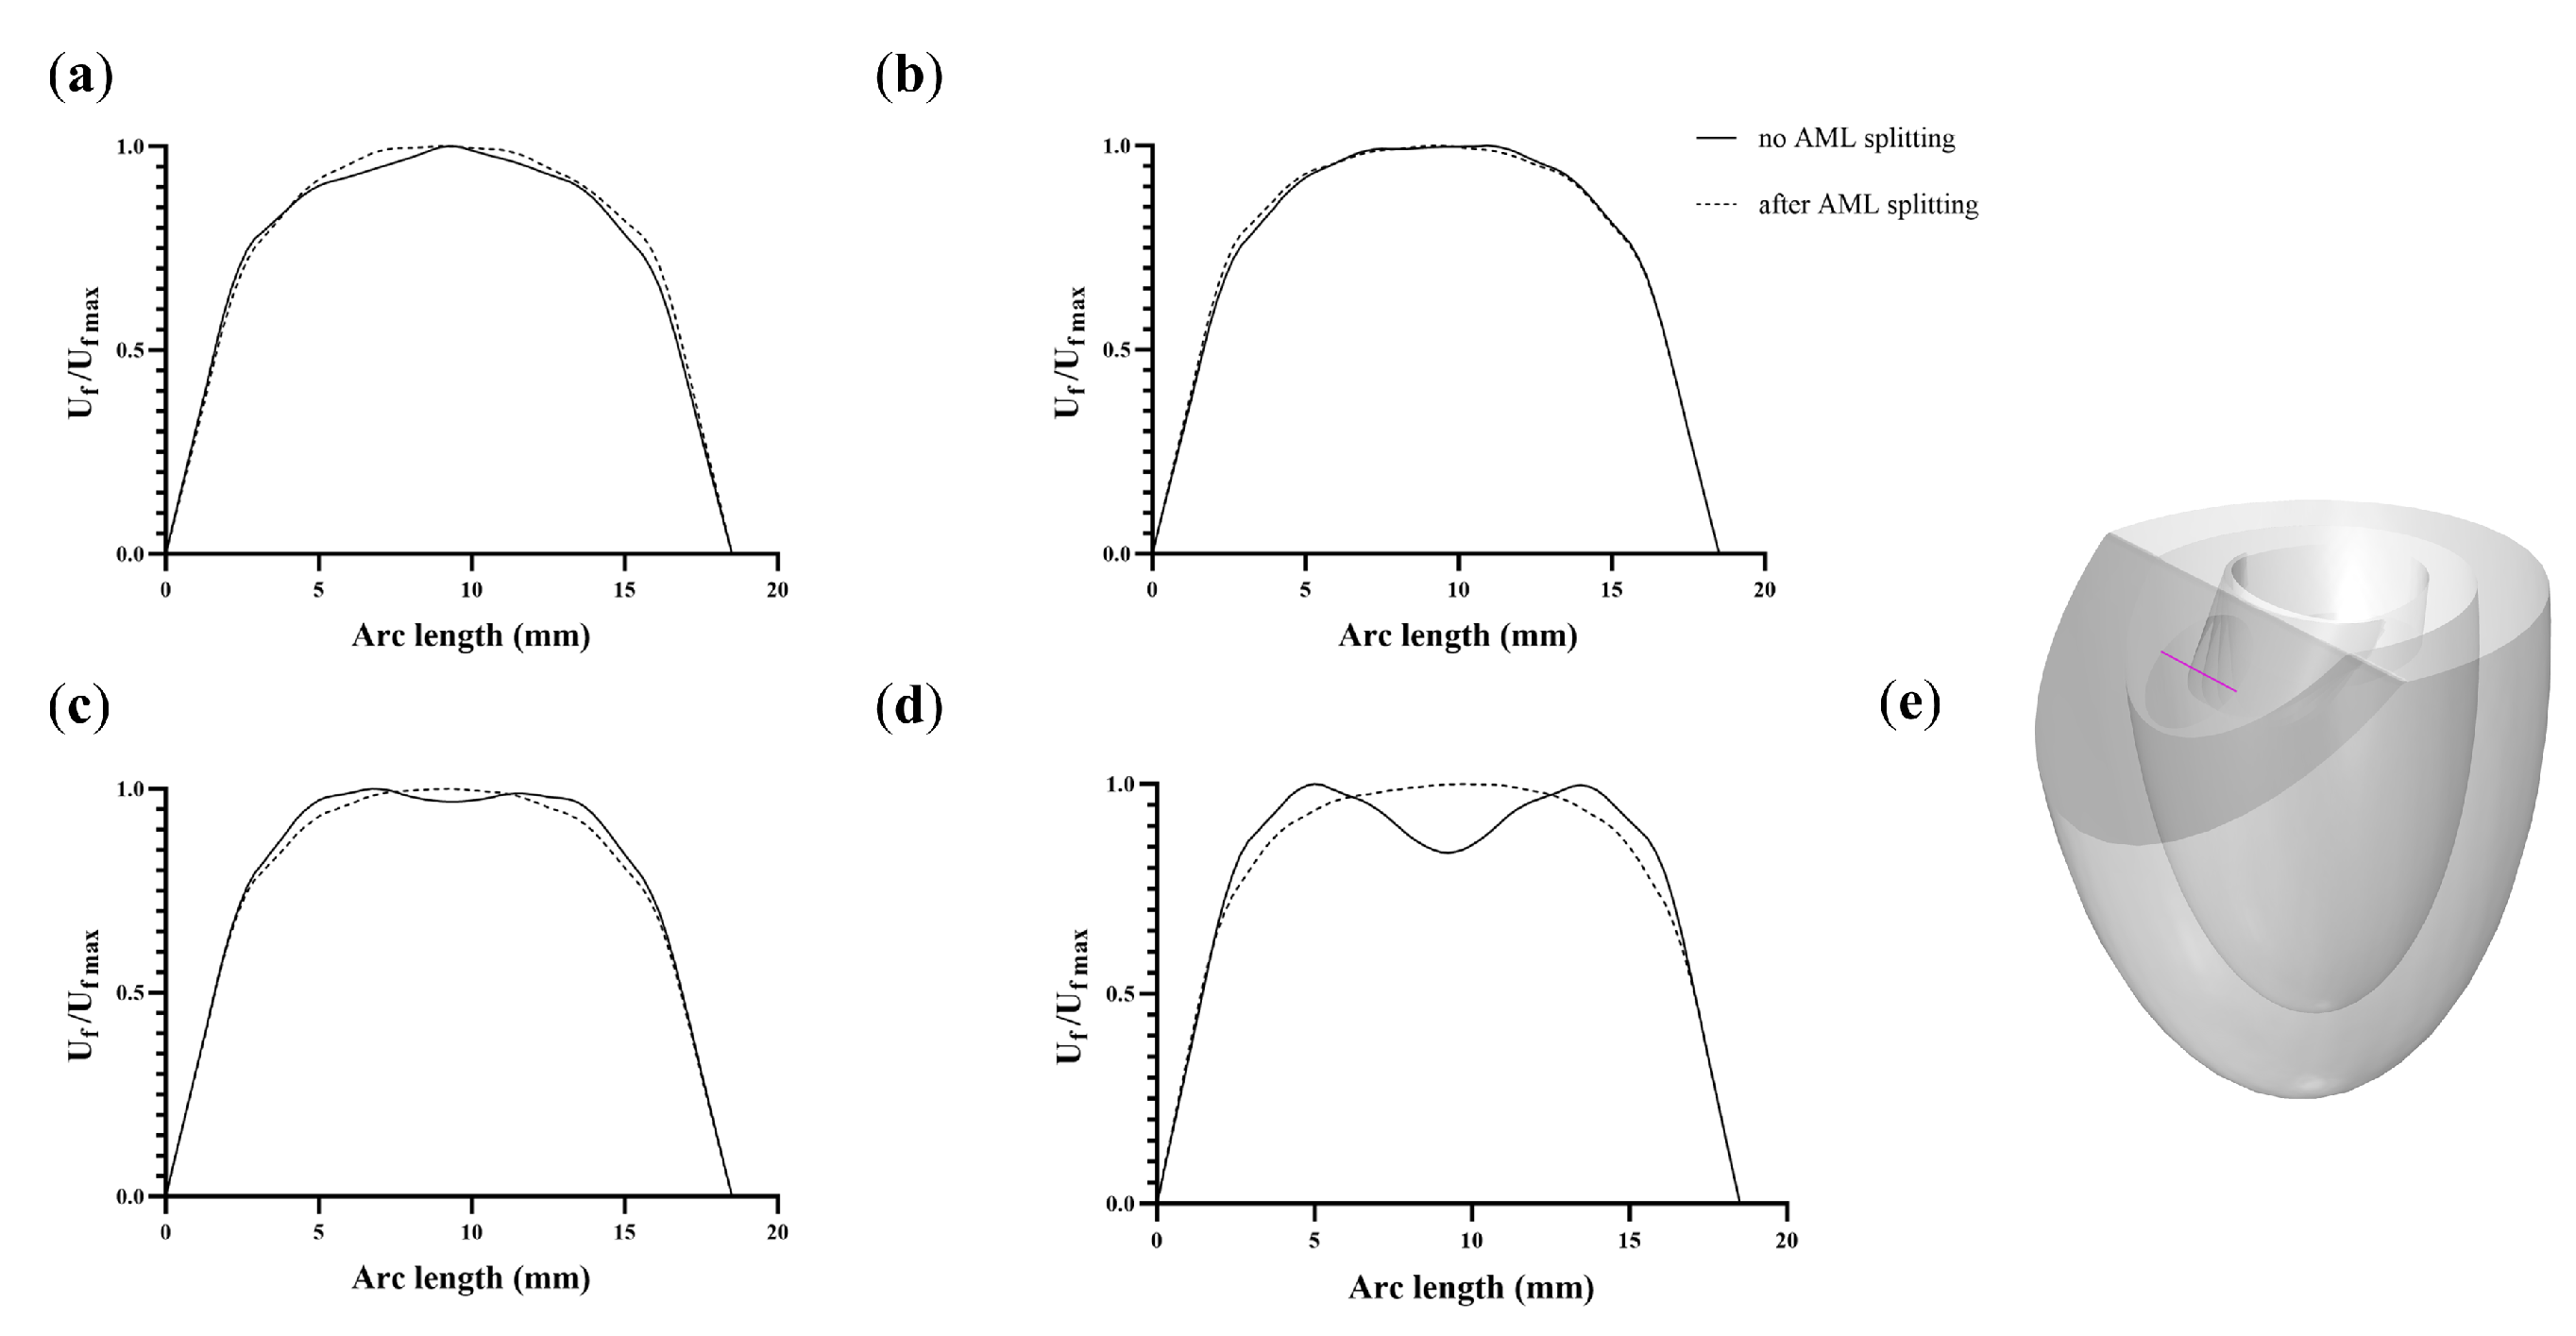
In order to examine and contrast the blood flow patterns in these different models, the blood flow were measured at a line extended perpendicularly from the center of the AoV into the LV cavity, as seen in Figure 8e. This can provide a better understanding of the impact of different simulation scenarios on the blood movement during systole. As AML protrudes into the LVOT, more obstruction can be seen in the flow pattern (see Figure 8a–d). A slight difference was found at angle 0° prior and post AML splitting; however, more occlusion to the blood flow is illustrated as the AML is extended to outflow tract.
In this work, the flow profile at outlet boundary, the AoV, was studied. Figure 9 shows the flow profiles at different simulations. The profile was investigated by plotting the flow velocity at mid-line of AoV, as shown in Figure 9e. An obvious dropped in the flow was seen in Figure 9d in comparison with other cases (Figure 9a–c), before AML laceration. An improvement in the flow profile was existed after AML laceration, especially for case (Figure 9d). This clinical technique is used to alleviate the obstruction in the remaining area of the LVOT following the TMVI following the TMVI, hence preventing the obstruction of the LVOT [15,16].
During the TMVI procedure attempt, LVOT pressure gradients can be measured by by introducing a catheter equipped with sensors into the heart. One sensor is positioned near to the AoV, while another sensor is positioned close to the LV apex [32,33]. This enables surgeons to observe and measure the intraventricular pressure and the flow velocity at the outflow tract. By evaluating the pressure and flow during the process, it is possible to detect any potential LVOT obstruction. In this study, the pressure gradients ( Δ P) of different simulations of MV leaflet angulation were investigated as illustrated in Figure 4b. Moreover, the pressure gradient was calculated by taking the difference of LV pressure (at LV cavity) and maximum pressure near AoV. It is obvious that the pressure gradients value increased when anterior leaflet of MV extended into the outflow tract, as seen in Figure 4b for those the cases before AML splitting. In addition, as it was illustrated earlier in Figure 8 and Figure 9, a dropped in pressure gradients was seen in all cases after the laceration of anterior leaflet. The decrease in pressure gradients following the division of the anterior leaflet, as seen in Figure 4b, aligns with the findings published in prior studies [13,34,35]. The presence of an artificial valve in the mitral valve, along with the laceration of the anterior leaflet, did not result in the observation of critical LVOT gradients. The MV leaflet splitting approach is crucial because to the occurrence of significant LVOT blockage in up to 22% of patients undergoing transcatheter mitral valve implantation (TMVI) [17,18].
Prior to TMVI, it is essential to evaluate the LVOT and MV annulus. This can aid in choosing the optimal size of the MV prosthetic device. The protrusion of the MV device into the LV can cause AML to move excessively towards the outflow tract, resulting in the formation of LVOT obstruction [36,37]. Our simulations demonstrated the capability of the developed model to simulate occlusion at the LVOT, by showing the effect of this obstruction on flow pattern and pressure gradient. Additionally, simulations after AML splitting were studied to show the importance of this clinical approach in diminishing the LVOT obstruction, as the preservation of subvalvular apparatus of MV is necessary. Preserving the subvalvular apparatus, including native leaflets of MV, during mitral valve surgery, such as TMVI, significantly increases patients’ likelihood of surviving the treatment by greatly boosting their capacity to sustain LV function [38,39]. However, in some cases, LVOT obstruction may exist due to the movement of MV anterior leaflet towards outflow tract. To overcome such as complications, the surgical technique of AML splitting can be a solution to minimize the flow obstruction at LVOT following TMVI [16].
The ALE-FSI technique uses a well-defined fluid–structure interface. This approach directly solves solid and fluid variables to relate fluid-solid interaction. ALE-FSI is used in several vascular simulations [40,41]. Few models have used the ALE technique to simulate fluid dynamics on mitral leaflets [42,43,44]. In addition, some of these models have employed idealized 2D or 3D geometries, and most have concentrated on certain cardiac cycle stages like closure or opening rather than the full cycle. FSI simulations are cost-effective for studying intraventricular fluid dynamics. The presented model is an extension of our previously published study [26]. In addition, our model has been used and validated for different applications, such as modeling MV prolapse and replicating the motion of the MV leaflets in response to different pressures in the atria and ventricles, resulting in their opening and closing. The 3D-0D model of LV developed in this study accurately incorporates native MV anterior leaflet, MV prosthetic valve, and ventricular wall in the presence of HCM. In addition, MV annular plane (inlet) and Ao outlet boundary are linked to 0D closed-loop circulatory circuit, which incorporates implicit conservation of blood volume. This 0D model presents a more accurate representation of the cardiovascular system, and improves the accuracy in simulating cardiovascular dynamics.

4. Conclusions

In this study, a 3D-0D cardiac model was developed using a realistic (ALE) coupling technique. The performed simulations show the different applications of LV generic model. This model includes a prosthetic mitral valve placed in the LV to simulate the effects of moving the rigid AML towards the LVOT. Furthermore, this model was utilized to investigate the surgical technique of AML splitting in order to reduce the flow obstruction at LVOT following TMVI. Computational simulations have great potential to enhance the understanding of the impact of SAM on the flow pattern at the outflow tract. The 3D-0D computational model presented in this study offers valuable insights into the flow patterns within the heart under various conditions, such as different angles of MV anterior leaflet angulation and MV laceration, in the presence of HCM. The utilization of simplified geometric models for the LV and MV decreases the computational workload, hence enhancing the process of model creation [45,46]. The passive component of ventricular myocardial tissues was assumed to exhibit transverse isotropic hyperelasticity, despite their orthotropic characteristics [47]. The study conducted by Demer and Yin [48] demonstrated that a transverse isotropic hyperelastic material accurately reproduced mechanical responses in both uniaxial and biaxial conditions. The LV active reaction was represented using a time-based function. Future simulations will integrate the excitation-contraction mechanism described by Watanabe et al. [49] for active reaction of the LV muscle. The model presented in this study accurately reproduced the MV anterior leaflet movement towards intraventricular septum as a rigid boundary. In future work, the mechanical properties of MV leaflets would be incorporated using experimental hyperelastic isotropic material to replicate the physical movement of the MV anterior leaflet. The model presented here has the potential to be expanded for investigating additional cardiac phenomena and exploring post-procedural complications.

Funding

This study is supported via funding from Prince Sattam bin Abdulaziz University project number (PSAU/2023/R/1445).

Institutional Review Board Statement

Not applicable.

Informed Consent Statement

Not applicable.

Data Availability Statement

Data is contained within the article.

Acknowledgments

The author extends his appreciation to Prince Sattam bin Abdulaziz University for funding this research.

Conflicts of Interest

The author declares no conflicts of interest.

References

  1. Nkomo, V.T.; Gardin, J.M.; Skelton, T.N.; Gottdiener, J.S.; Scott, C.G.; Enriquez-Sarano, M. Burden of valvular heart diseases: A population-based study. Lancet 2006, 368, 1005–1011. [Google Scholar] [CrossRef] [PubMed]
  2. Butzner, M.; Leslie, D.L.; Cuffee, Y.; Hollenbeak, C.S.; Sciamanna, C.; Abraham, T. Stable Rates of Obstructive Hypertrophic Cardiomyopathy in a Contemporary Era. Front. Cardiovasc. Med. 2021, 8, 765876. [Google Scholar] [CrossRef] [PubMed]
  3. Maron, B.J.; Gardin, J.M.; Flack, J.M.; Gidding, S.S.; Kurosaki, T.T.; Bild, D.E. Prevalence of hypertrophic cardiomyopathy in a general population of young adults. Echocardiographic analysis of 4111 subjects in the CARDIA Study. Coronary Artery Risk Development in (Young) Adults. Circulation 1995, 92, 785–789. [Google Scholar] [CrossRef]
  4. Veselka, J.; Anavekar, N.S.; Charron, P. Hypertrophic obstructive cardiomyopathy. Lancet 2017, 389, 1253–1267. [Google Scholar] [CrossRef] [PubMed]
  5. Czimbalmos, C.; Csecs, I.; Toth, A.; Kiss, O.; Suhai, F.I.; Sydo, N.; Dohy, Z.; Apor, A.; Merkely, B.; Vago, H. The demanding grey zone: Sport indices by cardiac magnetic resonance imaging differentiate hypertrophic cardiomyopathy from athlete’s heart. PLoS ONE 2019, 14, e0211624. [Google Scholar] [CrossRef] [PubMed]
  6. Song, C.; Wang, S.; Guo, Y.; Zheng, X.; Lu, J.; Fang, X.; Wang, S.; Huang, X. Preoperative NT-proBNP Predicts Midterm Outcome After Septal Myectomy. J. Am. Heart Assoc. 2019, 8, e011075. [Google Scholar] [CrossRef]
  7. Guigui, S.A.; Torres, C.; Escolar, E.; Mihos, C.G. Systolic anterior motion of the mitral valve in hypertrophic cardiomyopathy: A narrative review. J. Thorac. Dis. 2022, 14, 2309–2325. [Google Scholar] [CrossRef] [PubMed]
  8. Saccocci, M.; Taramasso, M.; Maisano, F. Mitral Valve Interventions in Structural Heart Disease. Curr. Cardiol. Rep. 2018, 20, 49. [Google Scholar] [CrossRef]
  9. Regueiro, A.; Granada, J.F.; Dagenais, F.; Rodés-Cabau, J. Transcatheter mitral valve replacement: Insights from early clinical experience and future challenges. J. Am. Coll. Cardiol. 2017, 69, 2175–2192. [Google Scholar] [CrossRef]
  10. Bapat, V.; Pirone, F.; Kapetanakis, S.; Rajani, R.; Niederer, S. Factors influencing left ventricular outflow tract obstruction following a mitral valve-in-valve or valve-in-ring procedure, part 1. Catheter. Cardiovasc. Interv. 2015, 86, 747–760. [Google Scholar] [CrossRef]
  11. Blanke, P.; Naoum, C.; Webb, J.; Dvir, D.; Hahn, R.T.; Grayburn, P.; Moss, R.R.; Reisman, M.; Piazza, N.; Leipsic, J. Multimodality Imaging in the Context of Transcatheter Mitral Valve Replacement: Establishing Consensus Among Modalities and Disciplines. JACC Cardiovasc. Imaging 2015, 8, 1191–1208. [Google Scholar] [CrossRef] [PubMed]
  12. Murphy, D.J.; Ge, Y.; Don, C.W.; Keraliya, A.; Aghayev, A.; Morgan, R.; Galper, B.; Bhatt, D.L.; Kaneko, T.; Di Carli, M.; et al. Use of Cardiac Computerized Tomography to Predict Neo–Left Ventricular Outflow Tract Obstruction Before Transcatheter Mitral Valve Replacement. J. Am. Heart Assoc. 2017, 6, e007353. [Google Scholar] [CrossRef] [PubMed]
  13. Babaliaros, V.C.; Greenbaum, A.B.; Khan, J.M.; Rogers, T.; Wang, D.D.; Eng, M.H.; O’Neill, W.W.; Paone, G.; Thourani, V.H.; Lerakis, S.; et al. Intentional percutaneous laceration of the anterior mitral leaflet to prevent outflow obstruction during transcatheter mitral valve replacement: First-in-human experience. Cardiovasc. Interv. 2017, 10, 798–809. [Google Scholar] [CrossRef] [PubMed]
  14. Russell, H.M.; Guerrero, M.E.; Salinger, M.H.; Manzuk, M.A.; Pursnani, A.K.; Wang, D.; Nemeh, H.; Sakhuja, R.; Melnitchouk, S.; Pershad, A.; et al. Open atrial transcatheter mitral valve replacement in patients with mitral annular calcification. J. Am. Coll. Cardiol. 2018, 72, 1437–1448. [Google Scholar] [CrossRef] [PubMed]
  15. Deng, L.; Huang, X.; Yang, C.; Lyu, B.; Duan, F.; Tang, D.; Song, Y. Numerical simulation study on systolic anterior motion of the mitral valve in hypertrophic obstructive cardiomyopathy. Int. J. Cardiol. 2018, 266, 167–173. [Google Scholar] [CrossRef] [PubMed]
  16. Ludwig, S.; Kalbacher, D.; Waldschmidt, L.; Schaefer, A.; Modine, T.; Dvir, D.; Carasso, S.; Denti, P.; Schofer, N.; Conradi, L. Prevention of LVOT Obstruction by Device-Mediated Laceration of the Anterior Mitral Valve Leaflet During TMVR. Case Rep. 2023, 16, 101873. [Google Scholar] [CrossRef] [PubMed]
  17. Eleid, M.F.; Cabalka, A.K.; Williams, M.R.; Whisenant, B.K.; Alli, O.O.; Fam, N.; Pollak, P.M.; Barrow, F.; Malouf, J.F.; Nishimura, R.A.; et al. Percutaneous Transvenous Transseptal Transcatheter Valve Implantation in Failed Bioprosthetic Mitral Valves, Ring Annuloplasty, and Severe Mitral Annular Calcification. JACC Cardiovasc. Interv. 2016, 9, 1161–1174. [Google Scholar] [CrossRef] [PubMed]
  18. Descoutures, F.; Himbert, D.; Maisano, F.; Casselman, F.; de Weger, A.; Bodea, O.; Van der Kley, F.; Colombo, A.; Giannini, C.; Rein, K.A.; et al. Transcatheter valve-in-ring implantation after failure of surgical mitral repair. Eur. J. Cardio Thorac. Surg. 2013, 44, e8–e15. [Google Scholar] [CrossRef]
  19. Kohli, K.; Wei, Z.A.; Yoganathan, A.P.; Oshinski, J.N.; Leipsic, J.; Blanke, P. Transcatheter mitral valve planning and the neo-LVOT: Utilization of virtual simulation models and 3D printing. Curr. Treat. Options Cardiovasc. Med. 2018, 20, 1–14. [Google Scholar] [CrossRef]
  20. Seo, J.H.; Vedula, V.; Abraham, T.; Lardo, A.C.; Dawoud, F.; Luo, H.; Mittal, R. Effect of the mitral valve on diastolic flow patterns. Phys. Fluids 2014, 26, 121901. [Google Scholar] [CrossRef]
  21. Schnittger, I.; Gordon, E.P.; Fitzgerald, P.J.; Popp, R.L. Standardized intracardiac measurements of two-dimensional echocardiography. J. Am. Coll. Cardiol. 1983, 2, 934–938. [Google Scholar] [CrossRef] [PubMed]
  22. Kunzelman, K.S.; Cochran, R.P.; Verrier, E.D.; Eberhart, R.C. Anatomic basis for mitral valve modelling. J. Heart Valve Dis. 1994, 3, 491–496. [Google Scholar] [PubMed]
  23. Tsang, W.; Meineri, M.; Hahn, R.T.; Veronesi, F.; Shah, A.P.; Osten, M.; Nathan, S.; Russo, M.; Lang, R.M.; Horlick, E.M. A three-dimensional echocardiographic study on aortic-mitral coupling in transcatheter aortic valve replacement. Eur. Heart J. Cardiovasc. Imaging 2013, 14, 950–956. [Google Scholar] [CrossRef] [PubMed]
  24. Legrice, I.J.; Hunter, P.J.; Smaill, B.H. Laminar structure of the heart: A mathematical model. Am. J. Physiol. Heart Circ. Physiol. 1997, 272, H2466–H2476. [Google Scholar] [CrossRef] [PubMed]
  25. Ahmad Bakir, A.; Al Abed, A.; Stevens, M.C.; Lovell, N.H.; Dokos, S. A Multiphysics Biventricular Cardiac Model: Simulations With a Left-Ventricular Assist Device. Front. Physiol. 2018, 9, 1259. [Google Scholar] [CrossRef]
  26. Alharbi, Y.; Al Abed, A.; Bakir, A.A.; Lovell, N.H.; Muller, D.W.; Otton, J.; Dokos, S. Fluid structure computational model of simulating mitral valve motion in a contracting left ventricle. Comput. Biol. Med. 2022, 148, 105834. [Google Scholar] [CrossRef]
  27. Holzapfel, G.A.; Ogden, R.W. Constitutive modelling of passive myocardium: A structurally based framework for material characterization. Philos. Trans. R. Soc. A 2009, 367, 3445–3475. [Google Scholar] [CrossRef]
  28. Cai, L.; Wang, Y.; Gao, H.; Li, Y.; Luo, X. A mathematical model for active contraction in healthy and failing myocytes and left ventricles. PLoS ONE 2017, 12, e0174834. [Google Scholar] [CrossRef]
  29. Usyk, T.P.; LeGrice, I.J.; McCulloch, A.D. Computational model of three-dimensional cardiac electromechanics. Comput. Vis. Sci. 2002, 4, 249–257. [Google Scholar] [CrossRef]
  30. Shavik, S.M.; Wall, S.T.; Sundnes, J.; Burkhoff, D.; Lee, L.C. Organ-level validation of a cross-bridge cycling descriptor in a left ventricular finite element model: Effects of ventricular loading on myocardial strains. Physiol. Rep. 2017, 5, e13392. [Google Scholar] [CrossRef]
  31. Zienkiewicz, O.C.; Taylor, R.L.; Nithiarasu, P. Convection-Dominated Problems: Finite Element Approximations to the Convection-Diffusion-Reaction Equation. In The Finite Element Method for Fluid Dynamics, 7th ed.; Zienkiewicz, O.C., Taylor, R.L., Nithiarasu, P., Eds.; Butterworth-Heinemann: Oxford, UK, 2014; Chapter 2; pp. 31–85. [Google Scholar]
  32. Wang, D.D.; Eng, M.H.; Greenbaum, A.B.; Myers, E.; Forbes, M.; Karabon, P.; Pantelic, M.; Song, T.; Nadig, J.; Guerrero, M.; et al. Validating a prediction modeling tool for left ventricular outflow tract (LVOT) obstruction after transcatheter mitral valve replacement (TMVR). Catheter. Cardiovasc. Interv. 2018, 92, 379–387. [Google Scholar] [CrossRef] [PubMed]
  33. Pasipoularides, A.; Murgo, J.P.; Miller, J.W.; Craig, W.E. Nonobstructive left ventricular ejection pressure gradients in man. Circ. Res. 1987, 61, 220–227. [Google Scholar] [CrossRef] [PubMed]
  34. Khan, J.M.; Babaliaros, V.C.; Greenbaum, A.B.; Foerst, J.R.; Yazdani, S.; McCabe, J.M.; Paone, G.; Eng, M.H.; Leshnower, B.G.; Gleason, P.T.; et al. Anterior Leaflet Laceration to Prevent Ventricular Outflow Tract Obstruction During Transcatheter Mitral Valve Replacement. J. Am. Coll. Cardiol. 2019, 73, 2521–2534. [Google Scholar] [CrossRef] [PubMed]
  35. Khan, J.M.; Rogers, T.; Schenke, W.H.; Mazal, J.R.; Faranesh, A.Z.; Greenbaum, A.B.; Babaliaros, V.C.; Chen, M.Y.; Lederman, R.J. Intentional Laceration of the Anterior Mitral Valve Leaflet to Prevent Left Ventricular Outflow Tract Obstruction During Transcatheter Mitral Valve Replacement: Pre-Clinical Findings. JACC Cardiovasc. Interv. 2016, 9, 1835–1843. [Google Scholar] [CrossRef] [PubMed]
  36. Sanchez, J.D.Z.; Bateman, M.G.; Iaizzo, P.A. Engineering and technologies associated with cardiac valve repair and replacement therapies. Eng. Med. 2019, 219–254. [Google Scholar]
  37. Geske, J.B.; Sorajja, P.; Ommen, S.R.; Nishimura, R.A. Variability of left ventricular outflow tract gradient during cardiac catheterization in patients with hypertrophic cardiomyopathy. JACC Cardiovasc. Interv. 2011, 4, 704–709. [Google Scholar] [CrossRef] [PubMed]
  38. Lee, E.M.; Shapiro, L.M.; Wells, F.C. Importance of subvalvular preservation and early operation in mitral valve surgery. Circulation 1996, 94, 2117–2123. [Google Scholar] [CrossRef]
  39. Fu, G.; Zhou, Z.; Huang, S.; Chen, G.; Liang, M.; Huang, L.; Wu, Z. Mitral valve surgery in patients with rheumatic heart disease: Repair vs. replacement. Front. Cardiovasc. Med. 2021, 8, 685746. [Google Scholar] [CrossRef]
  40. Toma, M.; Krdey, A.; Takagi, S.; Oshima, M. Strongly Coupled Fluid-Structure Interaction Cardiovascular Analysis with the Effect of Peripheral Network. Seisan Kenkyu 2011, 63, 339–344. [Google Scholar]
  41. Taelman, L.; Degroote, J.; Verdonck, P.; Vierendeels, J.; Segers, P. Modeling hemodynamics in vascular networks using a geometrical multiscale approach: Numerical aspects. Ann. Biomed. Eng. 2013, 41, 1445–1458. [Google Scholar] [CrossRef]
  42. Espino, D.M.; Shepherd, D.E.; Hukins, D.W. Evaluation of a transient, simultaneous, arbitrary Lagrange-Euler based multi-physics method for simulating the mitral heart valve. Comput. Methods Biomech. Biomed. Eng. 2014, 17, 450–458. [Google Scholar] [CrossRef] [PubMed]
  43. Hassani, K.; Karimi, A.; Dehghani, A.; Tavakoli Golpaygani, A.; Abdi, H.; Espino, D.M. Development of a fluid-structure interaction model to simulate mitral valve malcoaptation. Perfusion 2018, 34, 267659118811045. [Google Scholar] [CrossRef] [PubMed]
  44. Govindarajan, V.; Mousel, J.; Udaykumar, H.S.; Vigmostad, S.C.; McPherson, D.D.; Kim, H.; Chandran, K.B. Synergy between Diastolic Mitral Valve Function and Left Ventricular Flow Aids in Valve Closure and Blood Transport during Systole. Sci. Rep. 2018, 8, 6187. [Google Scholar] [CrossRef] [PubMed]
  45. Lau, K.D.; Diaz, V.; Scambler, P.; Burriesci, G. Mitral valve dynamics in structural and fluid-structure interaction models. Med. Eng. Phys. 2010, 32, 1057–1064. [Google Scholar] [CrossRef] [PubMed]
  46. Domenichini, F.; Pedrizzetti, G. Asymptotic Model of Fluid-Tissue Interaction for Mitral Valve Dynamics. Cardiovasc. Eng. Technol. 2015, 6, 95–104. [Google Scholar] [CrossRef]
  47. Dokos, S.; Smaill, B.H.; Young, A.A.; LeGrice, I.J. Shear properties of passive ventricular myocardium. Am. J. Physiol. Heart Circ. Physiol. 2002, 283, H2650–H2659. [Google Scholar] [CrossRef]
  48. Demer, L.L.; Yin, F.C. Passive biaxial mechanical properties of isolated canine myocardium. J. Physiol. 1983, 339, 615–630. [Google Scholar] [CrossRef]
  49. Watanabe, H.; Sugiura, S.; Kafuku, H.; Hisada, T. Multiphysics simulation of left ventricular filling dynamics using fluid-structure interaction finite element method. Biophys. J. 2004, 87, 2074–2085. [Google Scholar] [CrossRef]
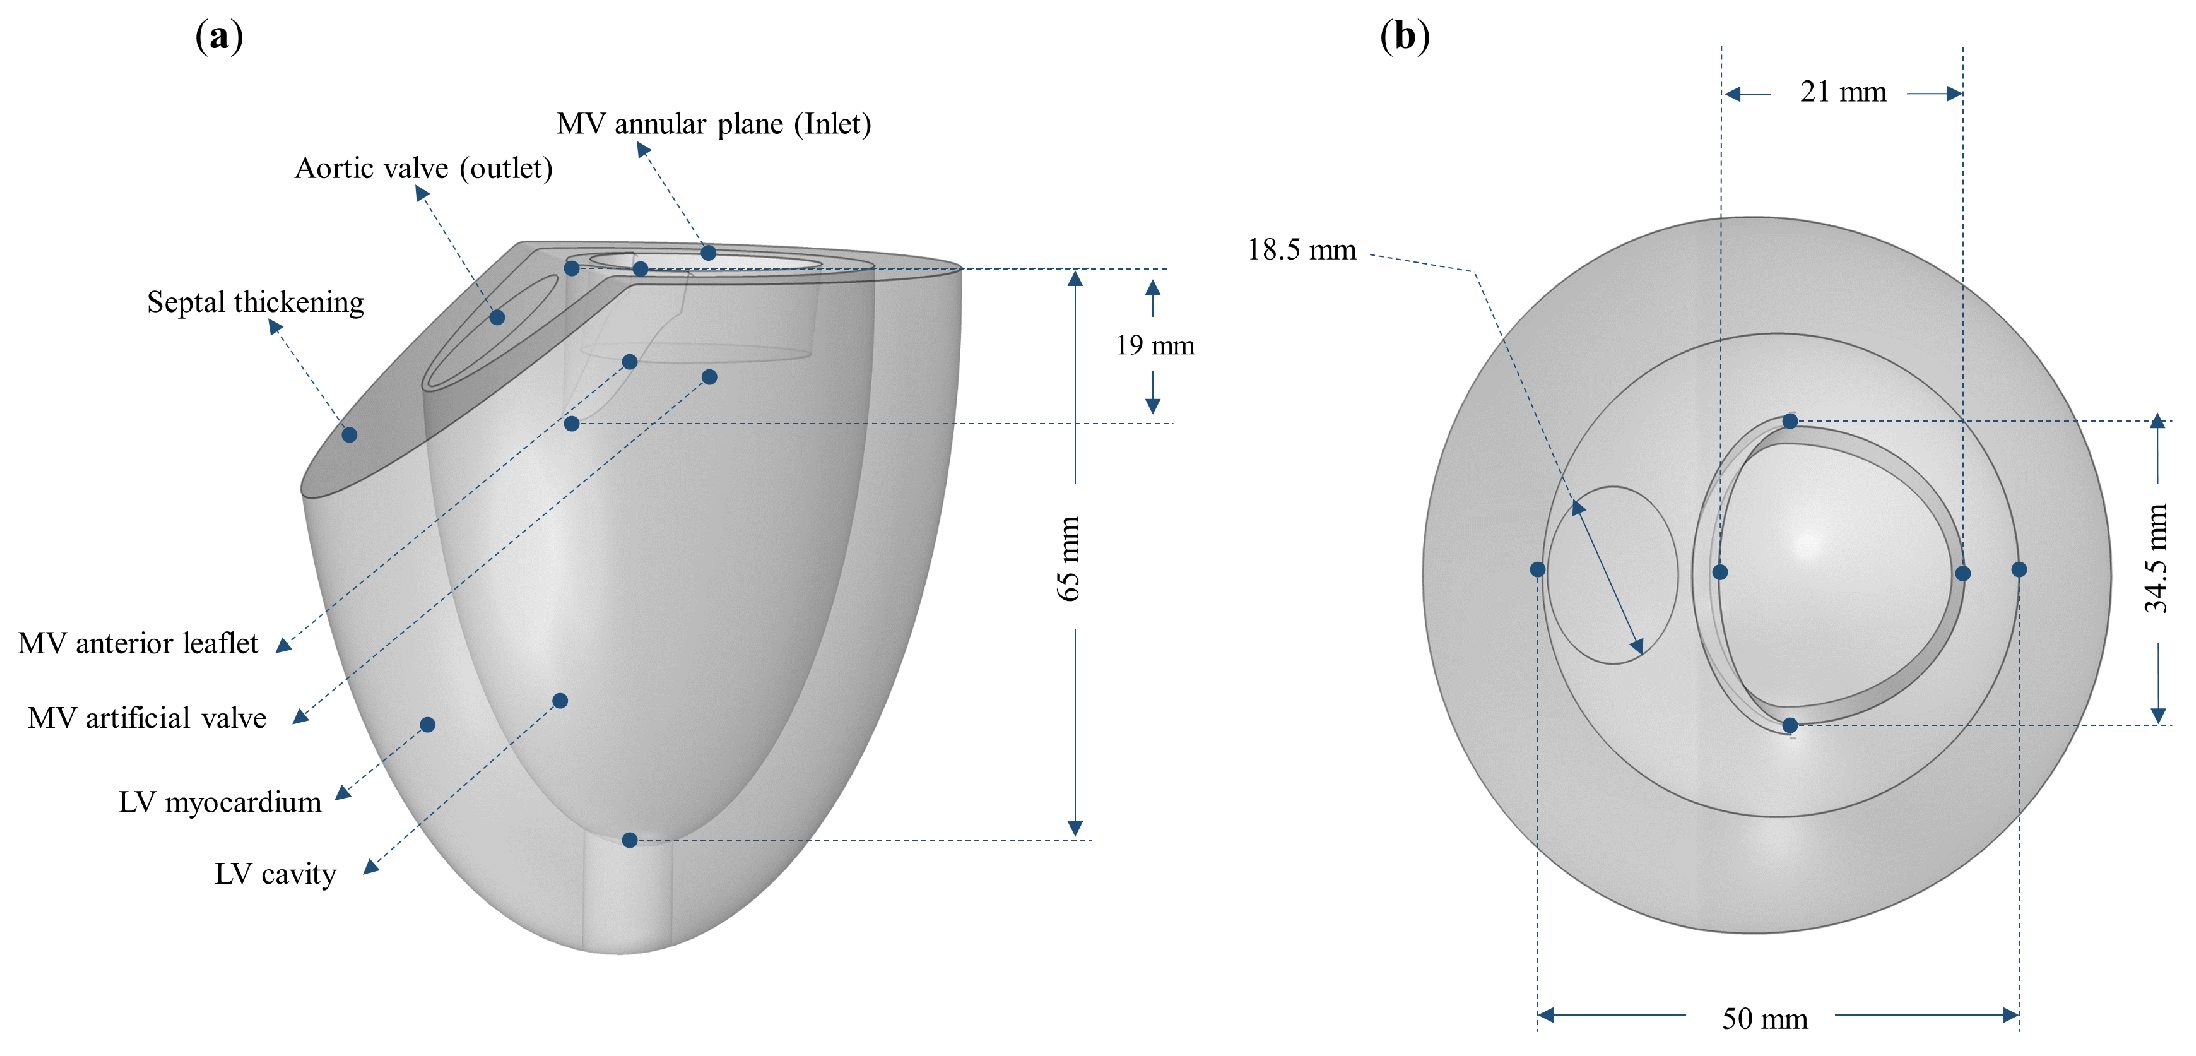
Figure 1. Geometry of LV generic model including anterior leaflet and MV device. (a,b) illustrate the longitudinal and transverse views of the LV idealized model, respectively.
Applsci 14 00466 g001
Figure 2. Myocarium fiber orientation, and pre− and after−load Windkessel model. (a) Changes in myocarium fiber orientation from the outer (epicardium) to the inner (endocardium) surface of the LV. (b) Closed−loop circuit coupled to the inlet and outlet boundaries of the 3D model.
Applsci 14 00466 g002
Figure 3. The model setting for (a) SAM simulation by rotating the MV anterior leaflet at various angles towards the outflow tract, and (b) anterior leaflet after splitting.
Applsci 14 00466 g003
Figure 4. 3D model pressure waveform and gradients. (a) shows LV, LA, Ao and arterial pressure of 3D generic model at 0° (with no AML splitting), and (b) illustrates the pressure gradients of all simulations.
Applsci 14 00466 g004
Figure 5. Illustrations of simulated velocity fields and structural deformations of the LV generic model at four different time during the cardiac cycle, where (ad) are simulated models at angle 0°, 10°, 20° and 30°, respectively, with the preservation of AML.
Applsci 14 00466 g005
Figure 6. Snapshots of four time points of flow velocity and LV wall displacement. (ad) show the simulations at angle 0°, 10°, 20° and 30°, respectively, after AML splitting.
Applsci 14 00466 g006
Figure 7. Snapshots of flow velocity profiles at different angulation of MV anterior leaflet, where (a,b) illustrate the simulations before and after division of AML, respectively (left-to-right (0°, 10°, 20° and 30°)).
Applsci 14 00466 g007
Figure 8. Blood flow measurements from a line that projected from the Aov towards the LV cavity. (ad) show the simulations at angle 0°, 10°, 20° and 30°, respectively, before and after AML splitting. (e) shows the line projected perpendicularly from the AoV into the LV cavity.
Applsci 14 00466 g008
Figure 9. Flow profile at the AoV. (ad) show the simulations at angle 0°, 10°, 20° and 30°, respectively, before and after AML laceration. (e) shows the line where the flow vecloities were measured.
Applsci 14 00466 g009
Table 1. Parameters of Windkessel circulatory model.
ParameterValueUnitDescription
R w 0.9 mmHg s mL 1 Systematic resistance
C w 4.5 mL mmHg 1 Systematic compliance
R a o 0.08 mmHg s mL 1 Aortic valve resistance
R p e r 0.94 mmHg s mL 1 Peripheral resistance
R v e n 0.015 mmHg s mL 1 Venous resistance
C v e n 65mL mmHg 1 Venous compliance
V v e n , 0 3200mLResting volume for vein
V v e n , 0 400mLResting volume for artery
V l a , 0 4mLResting volume for LA
P l a , 0 1mmHgResting pressure for LA
E e s , l a 0.25 mmHg mL 1 End-systolic elastance
E e d , l a 0.15 mmHg mL 1 End-diastolic elastance
t c y c l e 0.96 sCardiac cycle
Initial values
V v e n 73.5 mL
V l a 641mL
V a r t 4082mL
Disclaimer/Publisher’s Note: The statements, opinions and data contained in all publications are solely those of the individual author(s) and contributor(s) and not of MDPI and/or the editor(s). MDPI and/or the editor(s) disclaim responsibility for any injury to people or property resulting from any ideas, methods, instructions or products referred to in the content.