Article

A New Method for 2D-Adapted Wavelet Construction: An Application in Mass-Type Anomalies Localization in Mammographic Images

by
Damian Valdés-Santiago
1,
Angela M. León-Mecías
1,
Marta Lourdes Baguer Díaz-Romañach
1,
Antoni Jaume-i-Capó
2,3,
Manuel González-Hidalgo
3,4,5 and
Jose Maria Buades Rubio
2,*
1
Numerical and Image Analysis Research Group (ANIMES), Department of Applied Mathematics, Faculty of Mathematics and Computer Science, University of Havana, Plaza de la Revolución, La Habana CP 10400, Cuba
2
Computer Graphics and Vision and AI Group (UGiVIA), Department of Mathematics and Computer Science, Universitat de les Illes Balears, 07122 Palma, Spain
3
Laboratory for Artificial Intelligence Applications (LAIA@UIB), Universitat de les Illes Balears, 07122 Palma, Spain
4
SCOPIA Research Group, Department of Mathematical Sciences and Computer Science, University of the Balearic Islands, 07122 Palma, Spain
5
Institute for Health Research of the Balearic Islands (IdISBa), 07010 Palma, Spain
*
Author to whom correspondence should be addressed.
Appl. Sci. 2024, 14(1), 468; https://doi.org/10.3390/app14010468
Submission received: 30 November 2023 / Revised: 1 January 2024 / Accepted: 3 January 2024 / Published: 4 January 2024
(This article belongs to the Special Issue Artificial Intelligence for Health and Well-Being)

Abstract

:
This contribution presents a wavelet-based algorithm to detect patterns in images. A two-dimensional extension of the DST-II is introduced to construct adapted wavelets using the equation of the tensor product corresponding to the diagonal coefficients in the 2D discrete wavelet transform. A 1D filter was then estimated that meets finite energy conditions, vanished moments, orthogonality, and four new detection conditions. These allow, when performing the 2D transform, for the filter to detect the pattern by taking the diagonal coefficients with values of the normalized similarity measure, defined by Guido, as greater than 0.7, and α = 0.1 . The positions of these coefficients are used to estimate the position of the pattern in the original image. This strategy has been used successfully to detect artificial patterns and localize mass-like abnormalities in digital mammography images. In the case of the latter, high sensitivity and positive predictive value in detection were achieved but not high specificity or negative predictive value, contrary to what occurred in the 1D strategy. This means that the proposed detection algorithm presents a high number of false negatives, which can be explained by the complexity of detection in these types of images.

1. Introduction

Breast cancer is a highly prevalent disease in the female population worldwide. In Cuba, it ranks second in incidence and mortality (National Directorate of Medical Records and Health Statistics, 2020). The analysis of X-ray images of the breast, known as mammography, is the most popular and widely used breast cancer screening modality because the tumor can be detected before it can be physically felt [1]. Analyzing and interpreting mammograms requires practice, experience, and training because these images are inherently noisy and have poor contrast and lower sensitivity dense breast tissues [2] due to the low radiation doses used and shorter exposure time necessary for the safety of human health. To ensure consistent and accurate mammograms diagnosis, some radiologists use intelligent automated systems, but others still do it with the naked eye. There are a large number of different types of mammography abnormality. Some types of breast cancer are often associated with asymmetry between the right and left breasts [3,4,5], serving as early indications of the disease. In [3], a computer system solely based on computer vision and morphological features is developed for asymmetry detection in mammography images. This approach aims to support advances in Artificial Intelligence (AI) to complement existing methods for early breast cancer detection. The authors in this paper focused on morphological analysis and breast skin segmentation, which can serve as essential building blocks that could enhance current AI models. They have utilized dynamic time warping (DTW) for shape analysis and the growing seed region (GRS) method for breast skin segmentation. In [6], skin segmentation is also addressed using multi-class partition, which allows us to achieve a more refined delineation of skin regions. The segmentation could also be dealt with the new active contour model based on the level set method and Kullback–Leibler divergence presented in [7]. However, the most common breast abnormalities that may indicate breast cancer are masses and calcifications. Breast abnormalities are defined with a wide range of features and may be easily missed or misinterpreted by radiologists while reading large amounts of mammographic images provided in screening programs [8]. It is generally accepted that mass detection is a more challenging problem than the detection of micro-calcifications, not only due to the large variation in size and shape in which masses can appear in a mammogram but also because masses often exhibit poor image contrast (see [9,10] and references therein).
Mammogram features extraction is widely studied from the perspective of pattern recognition analysis to detect the best features that could represent a mammogram. The features of a digital image could be extracted directly from the spatial data or using a different space via special data transform, such as the Fourier transform or wavelets transform, which could be helpful in separating special data that contain specific scale-dependent characteristics, as is done in [11]. In this paper, an effective supervised classifier for mammograms is proposed using the discrete wavelet transform decomposition. The Daubechies-4, Daubechies-8, and Daubechies-16 wavelets are used in a four-level decomposition process. In each level of decomposition, a percentage of the low-frequency coefficients is used to represent the corresponding mammogram (i.e., feature vector). The classification is done by measuring the Euclidean distance between class prototype and the desired mammogram coefficient vector. The achieved numerical results indicate the effectiveness of the classifier in solving three basic problems in mammogram diagnosis: (i) classification of cancerous versus cancerous-free patterns; (ii) classification of abnormality indicator (i.e., microcalcifications, circumscribed masses, spiculated lesions, ill-defined lesions, and normal tissues); (iii) classification of the risk level of cancerous cells (i.e., benign versus malignant). The MIAS database is used. Daubechies-8 is the most successful choice of wavelet. A review of published techniques related to the detection and segmentation of mammography masses of any shape, margin, and size is presented in [9]. Detection is defined as the identification of potential lesions within all the parenchymal background. Usually, these methods generate a marker/prompt at a suspicious region in a mammogram. In contrast, segmentation is defined as a method able to detect the precise outline of the potential lesion. The quantitative performance of seven mass detection methods were compared: (i) based on a detection of concentric layers; (ii) based on a Laplacian edge detector approach; (iii) based on threshold; (iv) based on Iris filter; (v) based on a classifier approach; (vi) based on a Difference of Gaussian’s; and (vii) based on a pattern matching approach, which starts by defining a template—in our case, a tumor-like template. The definition of the template is based on the approach of [12], who defined the tumor by three characteristics: brightness contrast, uniform density, and circular shape. They are compared using two different mammography databases: a public digitized database (MIAS) and a local full-field digital database (Trueta). The obtained results show a dependence on the breast density and on the lesion size and shape. The analysis of the FROC curves shows that algorithms based on the Laplacian, the Iris filter, the pattern matching, and the gradient analysis provide the best results, obtaining a sensitivity better than 0.8. However, the number for false positive per image is more than five at that sensitivity. None of the investigated approaches provide the overall best detection performance.
The authors in [10] proposed a simple algorithm for mass enhancement and detection in mammographic images using wavelet processing and an adaptive threshold technique. The algorithm includes preprocessing, wavelet-based denoising, enhancement, and finally mass segmentation using adaptive thresholding. Thus, comparisons of the obtained results for mass detection have been carried out with ground truth provided by MIAS and DDSM databases, using the standard Jaccard similarity measure. The true positive fraction of 90.9 and 91% was achieved at the rate of a 2.35 and 2.1 average of false positive per image (FP/I) among 45 and 85 mammograms for MIAS and DDSM databases, respectively, with the proposed method.
Our goal in this contribution is to use custom-built wavelet bases to detect mass-like abnormalities (mass-like pattern) in mammograms. The signal representation and analysis using basis functions such as wavelets has been a booming research topic for more than 20 years due to their attractive properties for various purposes [13,14,15]. Pattern recognition and detection belong to this field. Success in detecting patterns in a signal depends, to a great extent, on the wavelet basis used for the transform. The more the wavelet resembles the pattern at a certain position of the signal, the greater the value of the transform coefficient, and vice versa [16]. If the pattern to be detected is very different from the wavelet, then the detection will be less accurate.
It is possible that a suitable wavelet cannot be found among the known options for certain applications. Although there are various types of wavelets in the literature, there is no universal rule that determines which wavelet is most suitable for each application. Instead, the researcher is expected to try different wavelets, more or less arbitrarily, in order to find the right one [17]. So, it is natural to try to build a new wavelet that is suited to the problem. This requires efficient numerical algorithms where the wavelet is as similar as possible to the pattern given a priori and allows for an accurate detection of said pattern in a signal. This approach is called adapted wavelet, matched wavelet, or data-driven wavelet [18,19,20,21].
Taking a close approach to the Daubechies discrete wavelet transform (DWT), Rodrigo Capobianco Guido et al. [22,23,24] present three versions of the so-called siscrete Shapelet transform (DST), a transform created not only to determine the support in time with the frequencies of a signal but also to detect a pattern in it. The DST is built to detect this pattern regardless of its amplitude and presents the same time complexity as any DWT when decomposing a signal for the same support size. The DST is capable of adjusting to a predefined pattern but not to a set of patterns like a machine learning algorithm would.
The DST-I [23] uses Daubechies’ original approach to build wavelets, but from the time domain, imposing constraints on the high-pass filter coefficients such as orthogonality, unit energy, and a certain number of vanished moments. To adjust the wavelet to fit the desired pattern, a constraint based on the fractal dimension of the pattern is added. Then, the system of nonlinear equations (NLES) formed by these restrictions is solved. Despite the success achieved by the adapted wavelet following this algorithm in the pattern detection of the complex visual system of a fly, its computational cost was relatively high [23].
The DST-II [22] arises as a modification to the DST-I, which decreases its computational cost, favors the solution of the NLES, and facilitates a simplified interpretation of the transformed signal. This replaces the fractality constraint in detecting the pattern with two detection constraints based on the correlation between the pattern and the wavelet filter, which were defined in such a way that the scalar products involved in the calculation of the DST-II, according to the algorithm of Mallat, capture the target pattern. The inclusion of these two restrictions allows the NLES to be squared.
On the other hand, the design of wavelets to detect specific patterns defined a priori is also interesting for the 2D case. Chapa and Rao [25] developed a technique to derive a band-limited orthonormal wavelet from the spectrum of the desired signal so that the root mean square error between its spectra would be minimal. The work of Fung and Shi [26] used correlation for edge detection, building in the frequency domain a bank of multiple wavelets at different scales that are optimal for ramp and pulse edges.
Kumar et al. [27] propose the extraction of regions with text from an image using adapted wavelet filters and texture features in the image. Unlike other methods, this one does not require a priori information about the font, geometric transformation, distortion or, texture of the background. The results for various images verify that the proposal is robust, versatile, and effective for extracting text from images.
Mesa [28] uses the lifting scheme to fit 2D wavelets in the three possible directions of a separable approach. Experiments were carried out with an artificial pattern. The author mentions that the diagonal lifting is the most complicated one to formalize mathematically, and its estimation is more cumbersome than the one carried out in the horizontal and vertical directions.
Del Marco and Again [29] take advantage of the transient capture capability and directional filtering of wavelets to improve the quality of an image. To do this, they estimate wavelets to optimize the Michelson contrast measure in the spatial domain. Thus, they are able to detect objects in infrared video streams with fewer false alarms than the standard detection approaches. Pragada and Sivaswamy [30] design image-adapted wavelet bases for denoising. They carried out the experiments in natural, satellite, and medical images, obtaining an improvement in the images with respect to other classical wavelets. Gupta and Joshi [31] estimate fitted wavelets to images that are not separable from two channels in the statistical sense. The filter bank is estimated by minimizing the root mean square error. The experiments showed that non-separable matched wavelets provided better coding gain compared to classical wavelets.
Isnanto et al. [32] build wavelets adapted to images of the human iris (called irislet). For this, they use the circular Hough transformation, the conversion to polar coordinates, the determination of the profile of the images of 1D lines, the discrete Daubechies transform, and the method of least squares. The results showed that the irislet had a high recognition rate. Ansari et al. [33] proposed a design that uses a convolutional neural network to design a two-channel non-separable wavelet that fits a given image. The network loss function is the total squared error between the input image and the reconstructed image, leading to a perfect reconstruction at the end of the training. Ansari and Gupta [34] used the lifting scheme to obtain separable wavelets adapted to compressed images. This wavelet provides better reconstruction results compared to other classical wavelets. The detection and reconstruction time were significantly reduced without causing degradation of reconstruction quality.
Recoskie [35] proposes a new filter learning method that considers the 2D TWD as a modified convolutional neural network, which is trained from the data via gradient descent. The learned wavelets are capable of capturing the structure of the training data (which were examples of classical wavelets) without relying on the DFT. According to this author, his model requires relatively few parameters compared to traditional networks.
In the particular case of digital mammography images, breast lesions have specific shape characteristics, associated with the probability that they are malignant [1]. Therefore, wavelet prototypes have been built to recognize these lesions, in particular, microcalcifications [36].
As a result of the conceptual theoretical analysis of the research topic, an extension to 2D of the DST and its variants was not found, which would allow for the detection of patterns in images. For this reason, this research aims to numerically and computationally validate a strategy for obtaining filters for the construction of wavelets adapted to two-dimensional patterns in digital images.
In this research, the 1D strategy proposed in [37] is extended to estimate 2D separable adapted wavelets, as well as a pattern detection algorithm based on the DST-II coefficients. A novel strategy based on the tensor product of one-dimensional vectors was proposed to perform a 2D DWT but with four new detection conditions to locate the 2D pattern. This was used to detect artificial patterns and mass-like abnormalities in digital mammography images. The similarity measure S proposed in [22] was used as the detection algorithm, which is applied to the wavelet coefficients of the DST-II. The work is organized as follows: In Section 2, we present some elements of the discrete wavelet theory and a novel algorithm to obtain two-dimensional pattern-adapted wavelets based on the two-dimensional extension of the DST-II. The principles of the pattern detection algorithm are also explained. In Section 3, the performance of the proposed algorithm is shown through numerical experimentation, taking as examples an artificial image and a mammography image. Some remarks are presented in Section 4.

2. Materials and Methods

This section presents a couple of results of the discrete wavelet theory [38,39,40] and the numerical strategy used to estimate 2D pattern-adapted wavelets based on the two-dimensional extension of the DST-II. The numerical algorithms to estimate the wavelets, as well as their application in an artificial pattern and the detection algorithm based on the normalized similarity measure S , are also presented here.

2.1. Discrete Wavelet Theory

The space l 2 ( Z N 1 × Z N 2 ) is defined as an extension of the vector space l 2 ( Z N ) , where the elements of Z N are considered complex vectors with N components (see [38]):
l 2 ( Z N 1 × Z N 2 ) = { z = [ z ( n 1 , n 2 ) ] : z ( n 1 , n 2 ) C , 0 n 1 N 1 1 , 0 n 2 N 2 1 } ,
and the vector space has dimension N 1 · N 2 , where addition and multiplication by a complex scalar are similar to the 1D case. The complex inner product on l 2 ( Z N 1 × Z N 2 ) is
z , w = n 1 = 0 N 1 1 n 2 = 0 N 2 1 z ( n 1 , n 2 ) · w ( n 1 , n 2 ) ¯ , z , w l 2 ( Z N 1 × Z N 2 ) .
The rotation operator is also useful in 2D cases.
Definition 1. 
Let z l 2 ( Z 1 × Z N 2 ) , extended by periodicity, and  k 1 , k 2 Z . The rotation operator on l 2 ( Z N 1 × Z N 2 ) is defined by
R k 1 , k 2 : l 2 ( Z N 1 × Z N 2 ) l 2 ( Z N 1 × Z N 2 ) z R k 1 , k 2 z , ( R k 1 , k 2 z ) ( n 1 , n 2 ) = z ( n 1 k 1 , n 2 k 2 ) .
Theorem 1. 
Let M 1 , M 2 Z , N 1 = 2 M 1 , N 2 = 2 M 2 . Let R 2 k v 1 k = 0 N 1 1 R 2 k u 1 k = 0 N 1 1 be a first-stage wavelet basis for l 2 Z N 1 and let R 2 k v 2 k = 0 N 2 1 R 2 k u 2 k = 0 N 2 1 be a first-stage wavelet basis for l 2 Z N 2 . If we define
w 0 n 1 , n 2 = v 1 n 1 · v 2 n 2 ,
w 1 n 1 , n 2 = u 1 n 1 · v 2 n 2 ,
w 2 n 1 , n 2 = v 1 n 1 · u 2 n 2 ,
w 3 n 1 , n 2 = u 1 n 1 · u 2 n 2 ,
then,
i = 0 3 R 2 k 1 , 2 k 2 w i k 1 Z M 1 k 2 Z M 2
is an orthonormal basis for l 2 Z N 1 × Z N 2 , where v 1 , u 1 , and v 2 , u 2 are called generators of the wavelet basis for l 2 Z N 1 and l 2 Z N 2 , respectively. The proof of the theorem can be consulted in [41].

2.2. Strategy for Building 2D-Adapted Wavelets

We propose a strategy based on the tensor product of one-dimensional vectors to execute a 2D DWT (Theorem 1) but with a different approach regarding the detection conditions. In Equation (4), it is observed that the diagonal detail coefficients of the 2D DWT depend on two factors: the image that is decomposed and the one-dimensional high-pass filter u used in the decomposition. Then, with the aim to obtain a 1D filter that when used in the 2D discrete wavelet transform should be capable of detecting the considered pattern in the diagonal detail coefficients of the 2D DWT, we include four correlation conditions between the filter coefficients q (1D) and (i) the samples of the 2D pattern in a specific position, (ii) the samples of the 2D pattern in the contiguous position in the horizontal direction, (iii) the samples of the 2D pattern in the contiguous position in the vertical direction, and (iv) the samples of the 2D pattern in the contiguous position in the diagonal direction.
Therefore, the NLES of the DST-II was modified by substituting two conditions of vanished moments and the two detection conditions with four detection conditions to locate the 2D pattern. This is a novel proposal since, to the best of the author’s knowledge, a 2D-adapted wavelet has not been proposed to detect patterns from the DST-II.

System of Nonlinear Equations for the Proposed 2D Extension

Let the 2D pattern be m [ · , · ] of n 1 rows and n 2 columns. Since these quantities must be even to have a perfect reconstruction, as in the DST-II, dimensions N 1 and N 2 are chosen by taking the even number immediately below the original dimensions. Thus, the 1D filter q has support size N = max { N 1 , N 2 } , N 8 , and is necessarily even.
The NLES F ( q 0 , q 1 , , q N 1 ) = 0 of N equations and N unknowns, whose solution is the high-pass filter of the 2D-adapted wavelet, is the following:
  • Unit energy to ensure that the shapelet conserves the energy of the signal: k = 0 N 1 q k 2 1 = 0 ;
  • N 2 4 vanished moments for an adequate regularity of the shapelet: k = 0 N 1 q k · k b = 0 , where b = 0 , 1 , , N 2 5 ;
  • N 2 1 orthogonality conditions: k = 0 N 1 q k · q k + 2 l = δ 0 , l , where δ is the Dirac delta and l Z ;
  • Four conditions for pattern detection:
    i = 1 N 1 j = 1 N 2 q i · q j · m i , j = 0 , i = 1 N 1 j = 1 N 2 q i · q j · m i , j 1 = 0 , i = 1 N 1 j = 1 N 2 q i · q j · m i 1 , j = 0 , i = 1 N 1 j = 1 N 2 q i · q j · m i 1 , j 1 = 0 .
The NLES is solved numerically using the strategy in [37], where an initial approximation obtained by the continuation method is used to start the Newton iterative algorithm. Then, the perfect reconstruction filter bank is obtained as in the 1D case.
p k = ( 1 ) k · q N k 1 ; p ¯ k = p N k 1 ; q ¯ k = ( 1 ) k + 1 · p k , k = 0 , 1 , , N 1 .

2.3. Detection of the 2D Pattern with the Proposed Strategy

The signal f [ · , · ] is decomposed, obtaining DST - II 2 D ( f [ · , · ] ) using the algorithm based on tensor product. The detection is based on the normalized similarity measure S , which emphasizes the presence of zeros in the shapelet coefficients. In particular, we will only apply this measure on the diagonal detail coefficients of a 2D DST-II since the 2D shapelet is designed to detect the pattern in these coefficients.
Let the image f [ · , · ] of dimension L 1 × L 2 be analyzed with the 2D DWT and the corresponding matrix of diagonal coefficients c D of dimension M 1 × M 2 . Let a pixel be at position ( i , j ) of c D . Let the normalized similarity measure be S = e ( | DST - II ( f [ · ] ) | ) α , 0 < α 1 [22]. If  S ( α = 0.1 ) [ c D i , j ] > 0.7 , then the 2D pattern occurs inside a rectangle whose upper right corner has the following coordinates:
x = ( 2 · M 2 N 2 + L 2 ) mod ( L 2 ) , y = ( 2 · M 1 N 1 + L 1 ) mod ( L 1 ) ,
with a width of N 2 pixels and a length of N 1 pixels. If there are no coefficients that meet this condition, then the pattern is not found in the image.
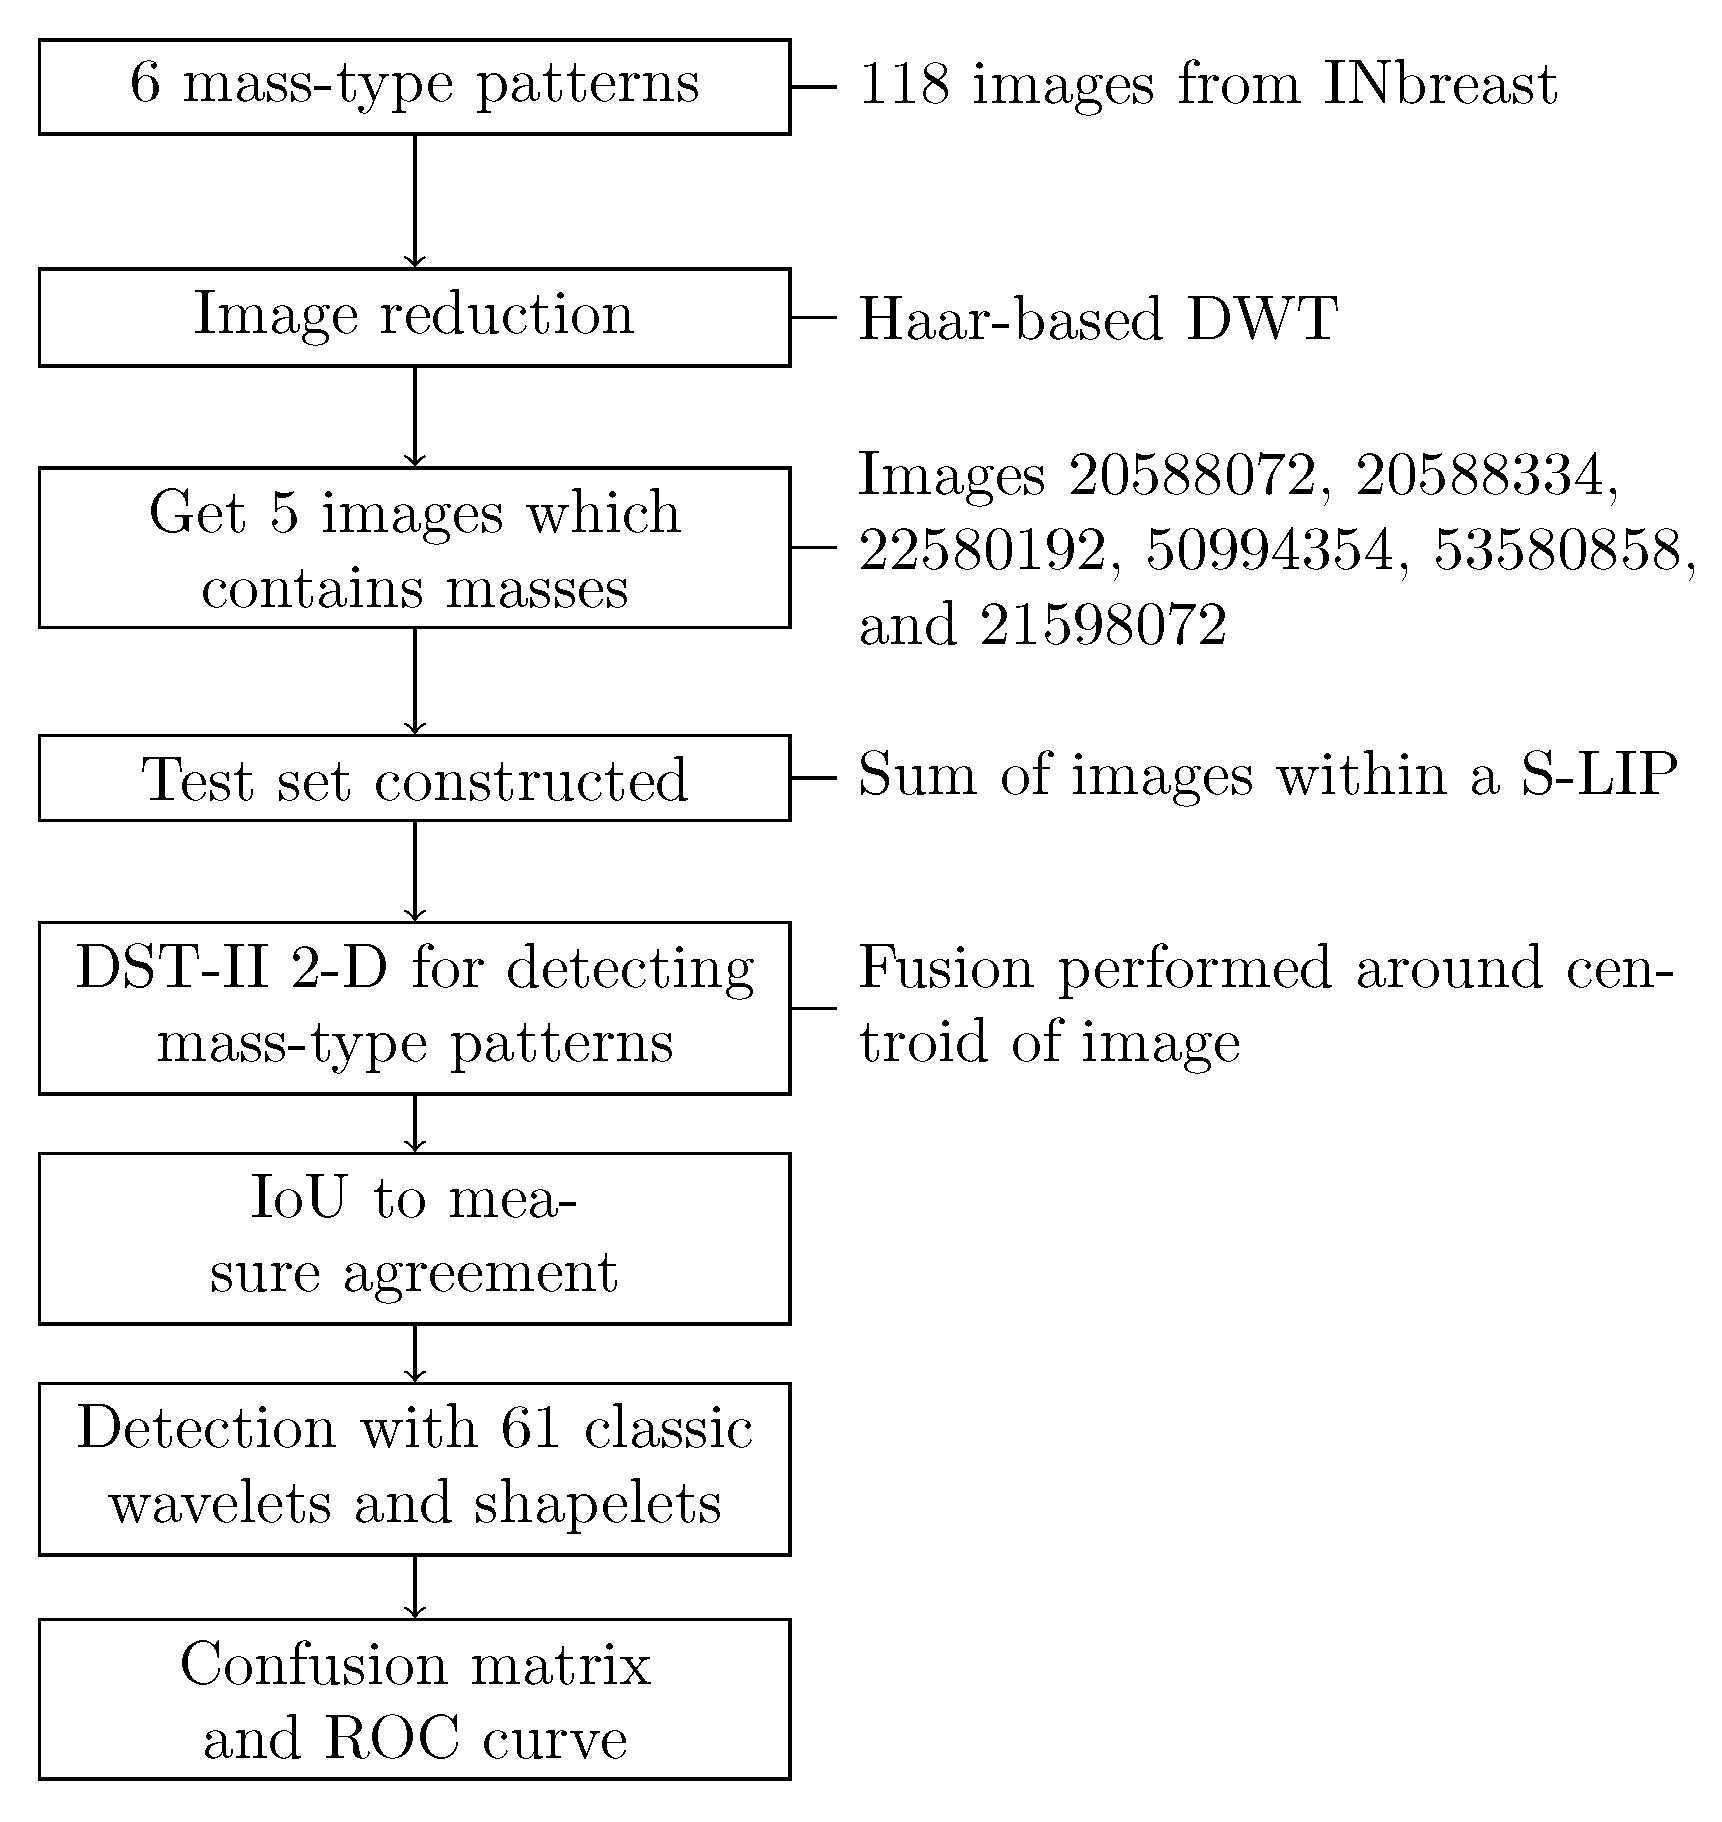
Figure 1 depicts a flowchart of the strategy designed in this section.

3. Results

In this section, we use the proposed algorithm to build a 2D pattern-adapted wavelet (shapelet) to detect patterns in an artificial image and a mammography image. To determine the best detection results, the values of the S measure of the 2D DWT coefficients with the estimated shapelet are used. The proposed strategy is an initial attempt (hence its novelty) and still has issues to be addressed from the mathematical and computational point of view. After these adjustments, it will be necessary to assess whether its use is relevant in this context with respect to other techniques such as automatic learning, which have demonstrated their effectiveness in the detection of mammographic lesions. The future improvements could be focused on using other stable numerical algorithms to solve high-dimensional systems, given the characteristics of these mammography images; specifying the optimization model for the identification of mass-like anomalies in mammography; analyzing and exploring the effects of the proposed strategy on other types of abnormalities such as microcalcifications; and comparing the effectiveness of detection using DST-II as a feature vector in automatic and deep learning models. This is the parallelization of the strategy for efficient GPU computation, which would allow us to split the problem into smaller ones and perhaps find a way to compose the detection in a patch analysis style. An important task to be done is to validate the assisted diagnosis system from a clinical point of view through physician consultation and piloting.

3.1. Application of the 2D Strategy for Artificial Images

In a first experiment, an artificial image of 63 × 41 dimension was considered, which you can see on the far left of Figure 2 and Figure 3. In this image, the letters that make up the words are considered to be independent 2D patterns. In the images, the axis represents the pixel position in horizontal and vertical directions. The last graphic refers to the values of measure S for diagonal coefficients of DST-II, where the x-axis is the coefficient position and the y-axis is the value of its measure S . Figure 2 shows the results of the detection when considering the pattern defined by the letter c. The highest value of the S measure in the matrix of diagonal coefficients c D was reached in position ( 17 , 14 ) , which corresponds to a rectangle whose upper left corner has coordinates ( 20 , 25 ) with respect to the analyzed image. In Figure 3, it can be seen that the strategy was successful in detecting three occurrences of the letter a, although it did not locate the three remaining occurrences.

3.2. Detection of 2D Mass-like Patterns in Digital Mammography Images

Breast cancer remains one of the most commonly detected cancers in the world population. In Cuba, it ranks second in incidence and mortality [42]. X-ray imaging of the breast, known as mammography, is the most popular and widely used breast cancer screening modality because the tumor can be detected before it can be physically felt [1]. Mammograms are inherently noisy, have poor contrast, and are less sensitive to dense breast tissues [2] due to the low radiation doses used and shorter exposure times necessary for the safety of human health. Analysis and interpretation of mammograms require practice, experience, and training. Radiologists may miss certain abnormalities on mammograms due to the subtlety of the suspicious lesions, or because these are masked in the breast parenchyma [43]. That is why radiologists have used computer-aided analysis (CAD) to improve the detection of subtle signs and provide a consistent and accurate diagnosis from mammograms. There are various mammographic lesions; in particular, a mass is a voluminous lesion that occupies a space with different shapes and has a denser appearance in the center while it is relatively thin towards the edges [44]. A mass can be classified according to its shape, its density (number of fat cells present along with the density of suspicious cells), and its margin (characteristics of its border) [44]. In this section, the 2D strategy proposed to detect mammography masses using adapted wavelets will be applied.

3.2.1. Design of the Simulations Using the Proposed 2D Strategy

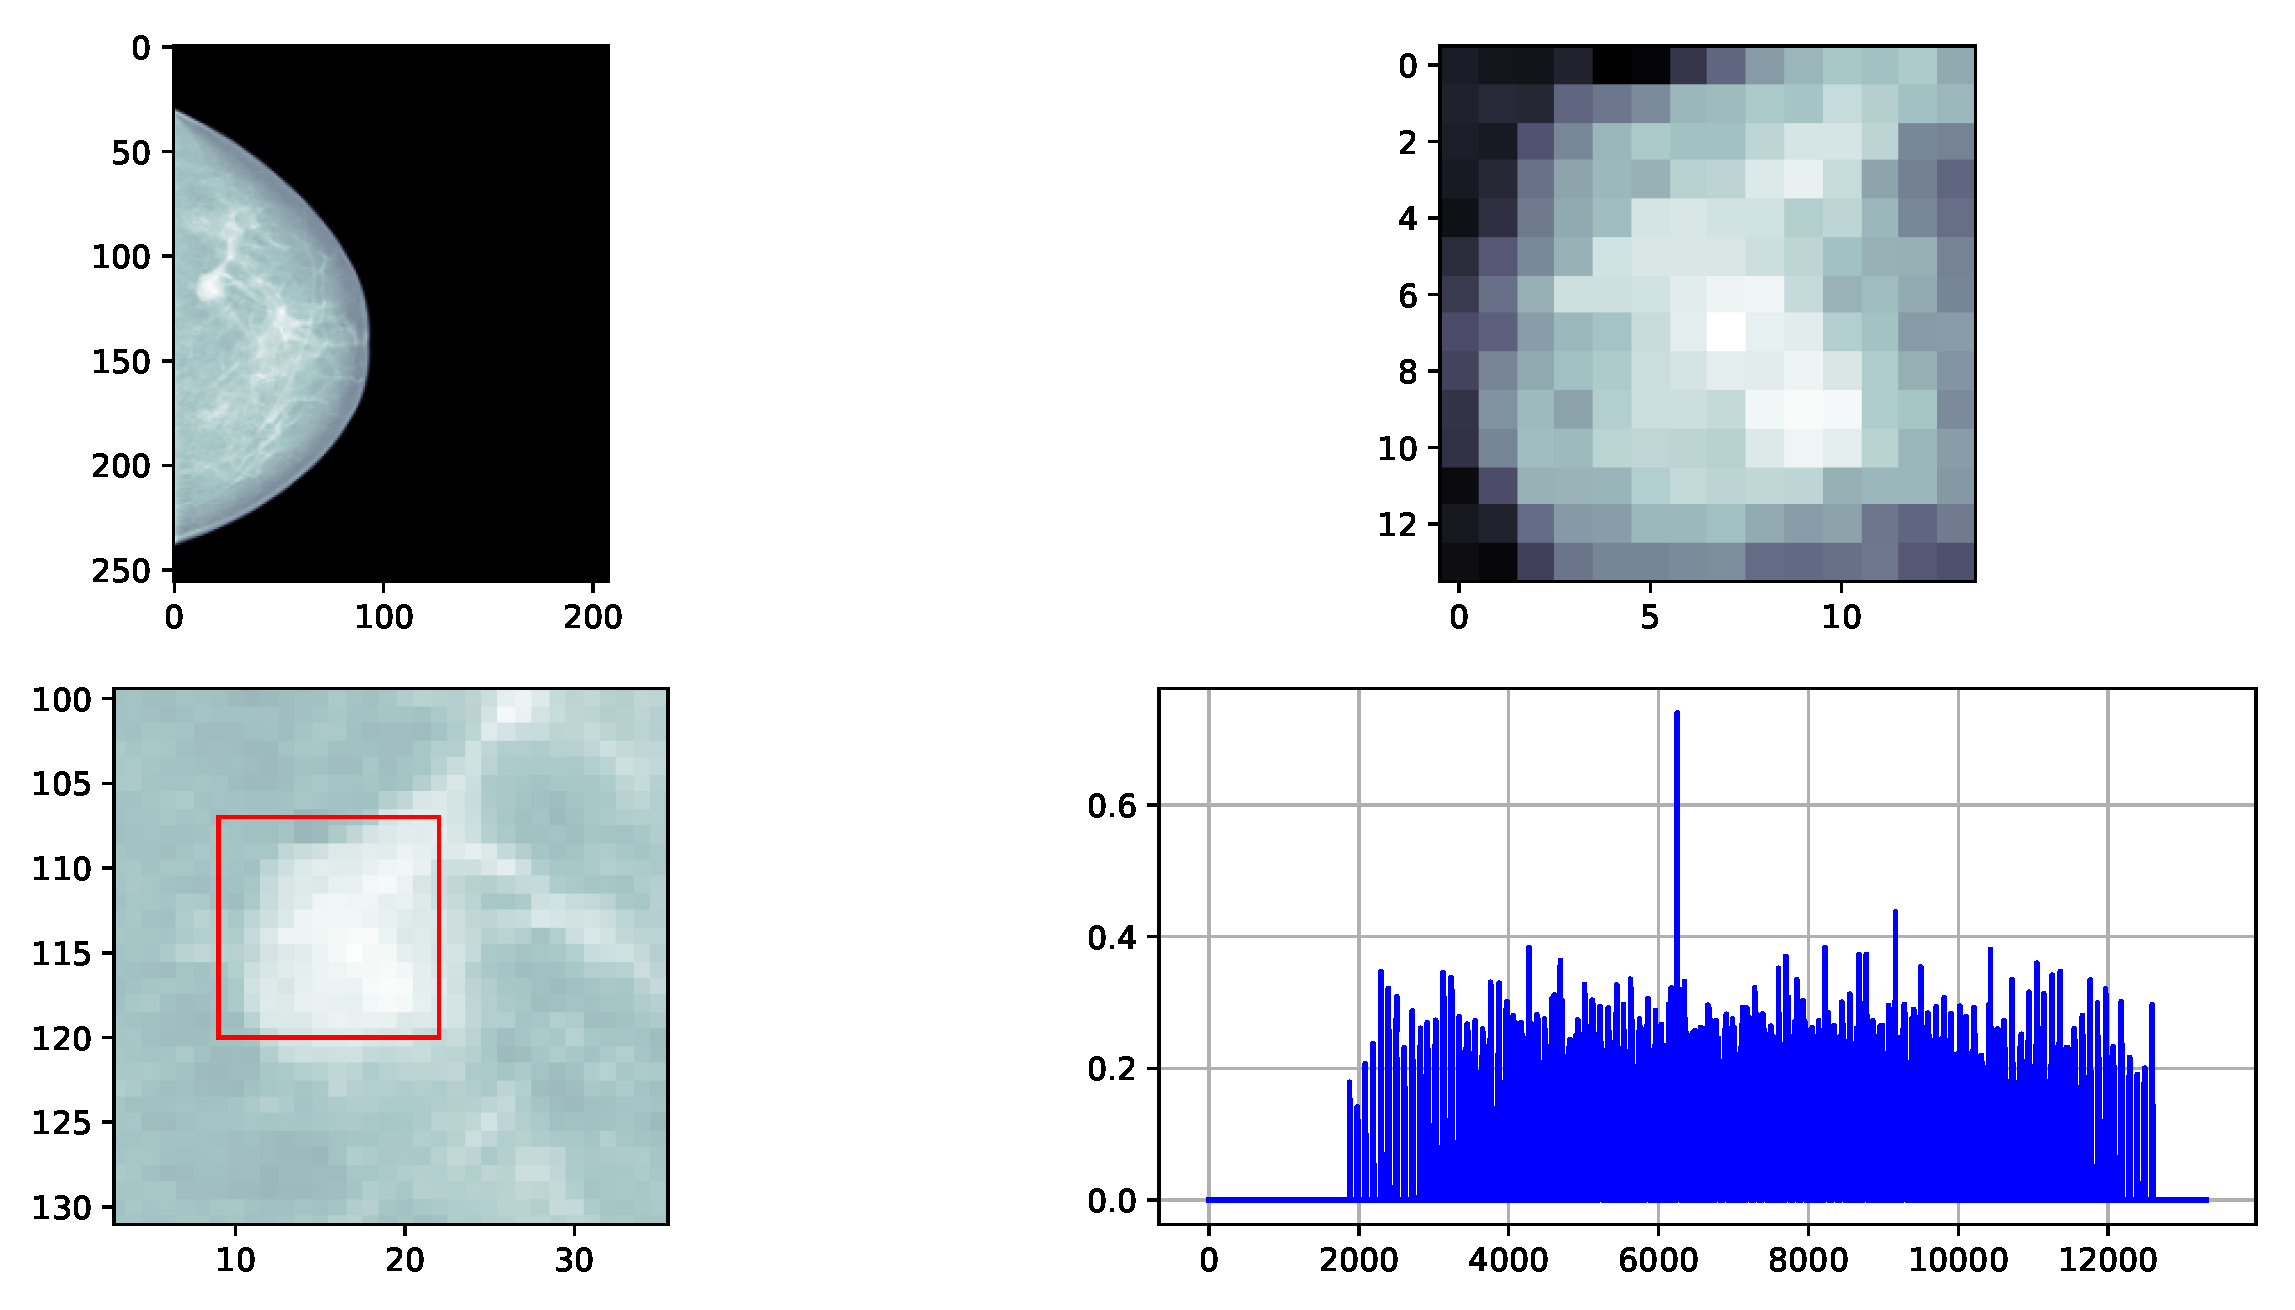
As an initial step, the relevance of applying the proposed 2D strategy to detect a mass-type pattern in digital mammography images was verified. Figure 4 shows results where the detection was successful.
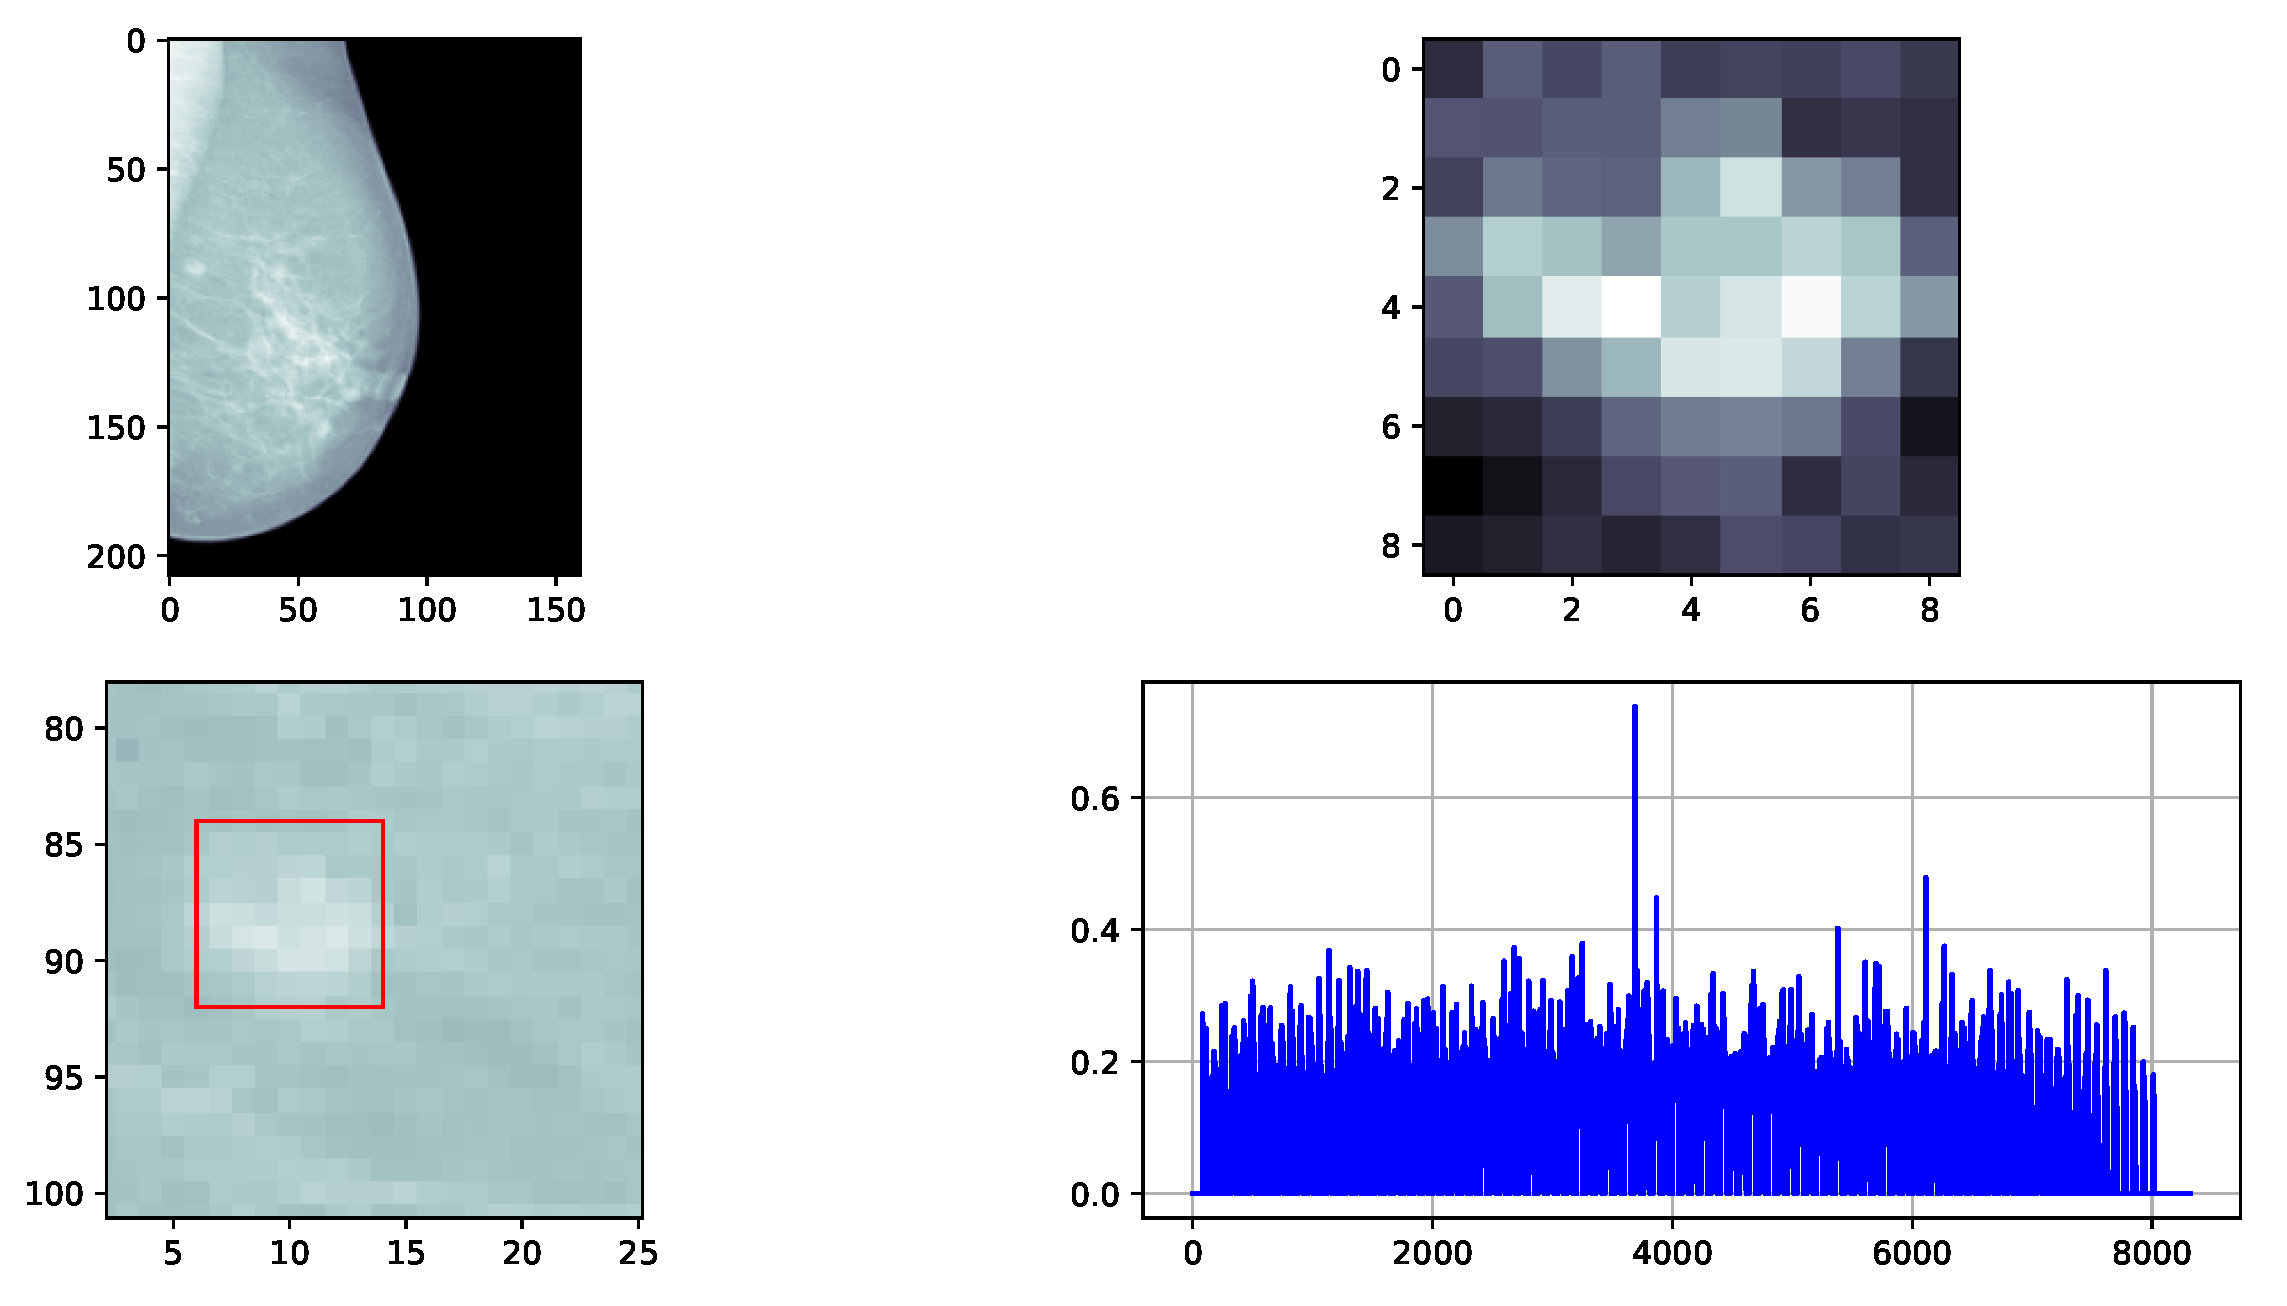
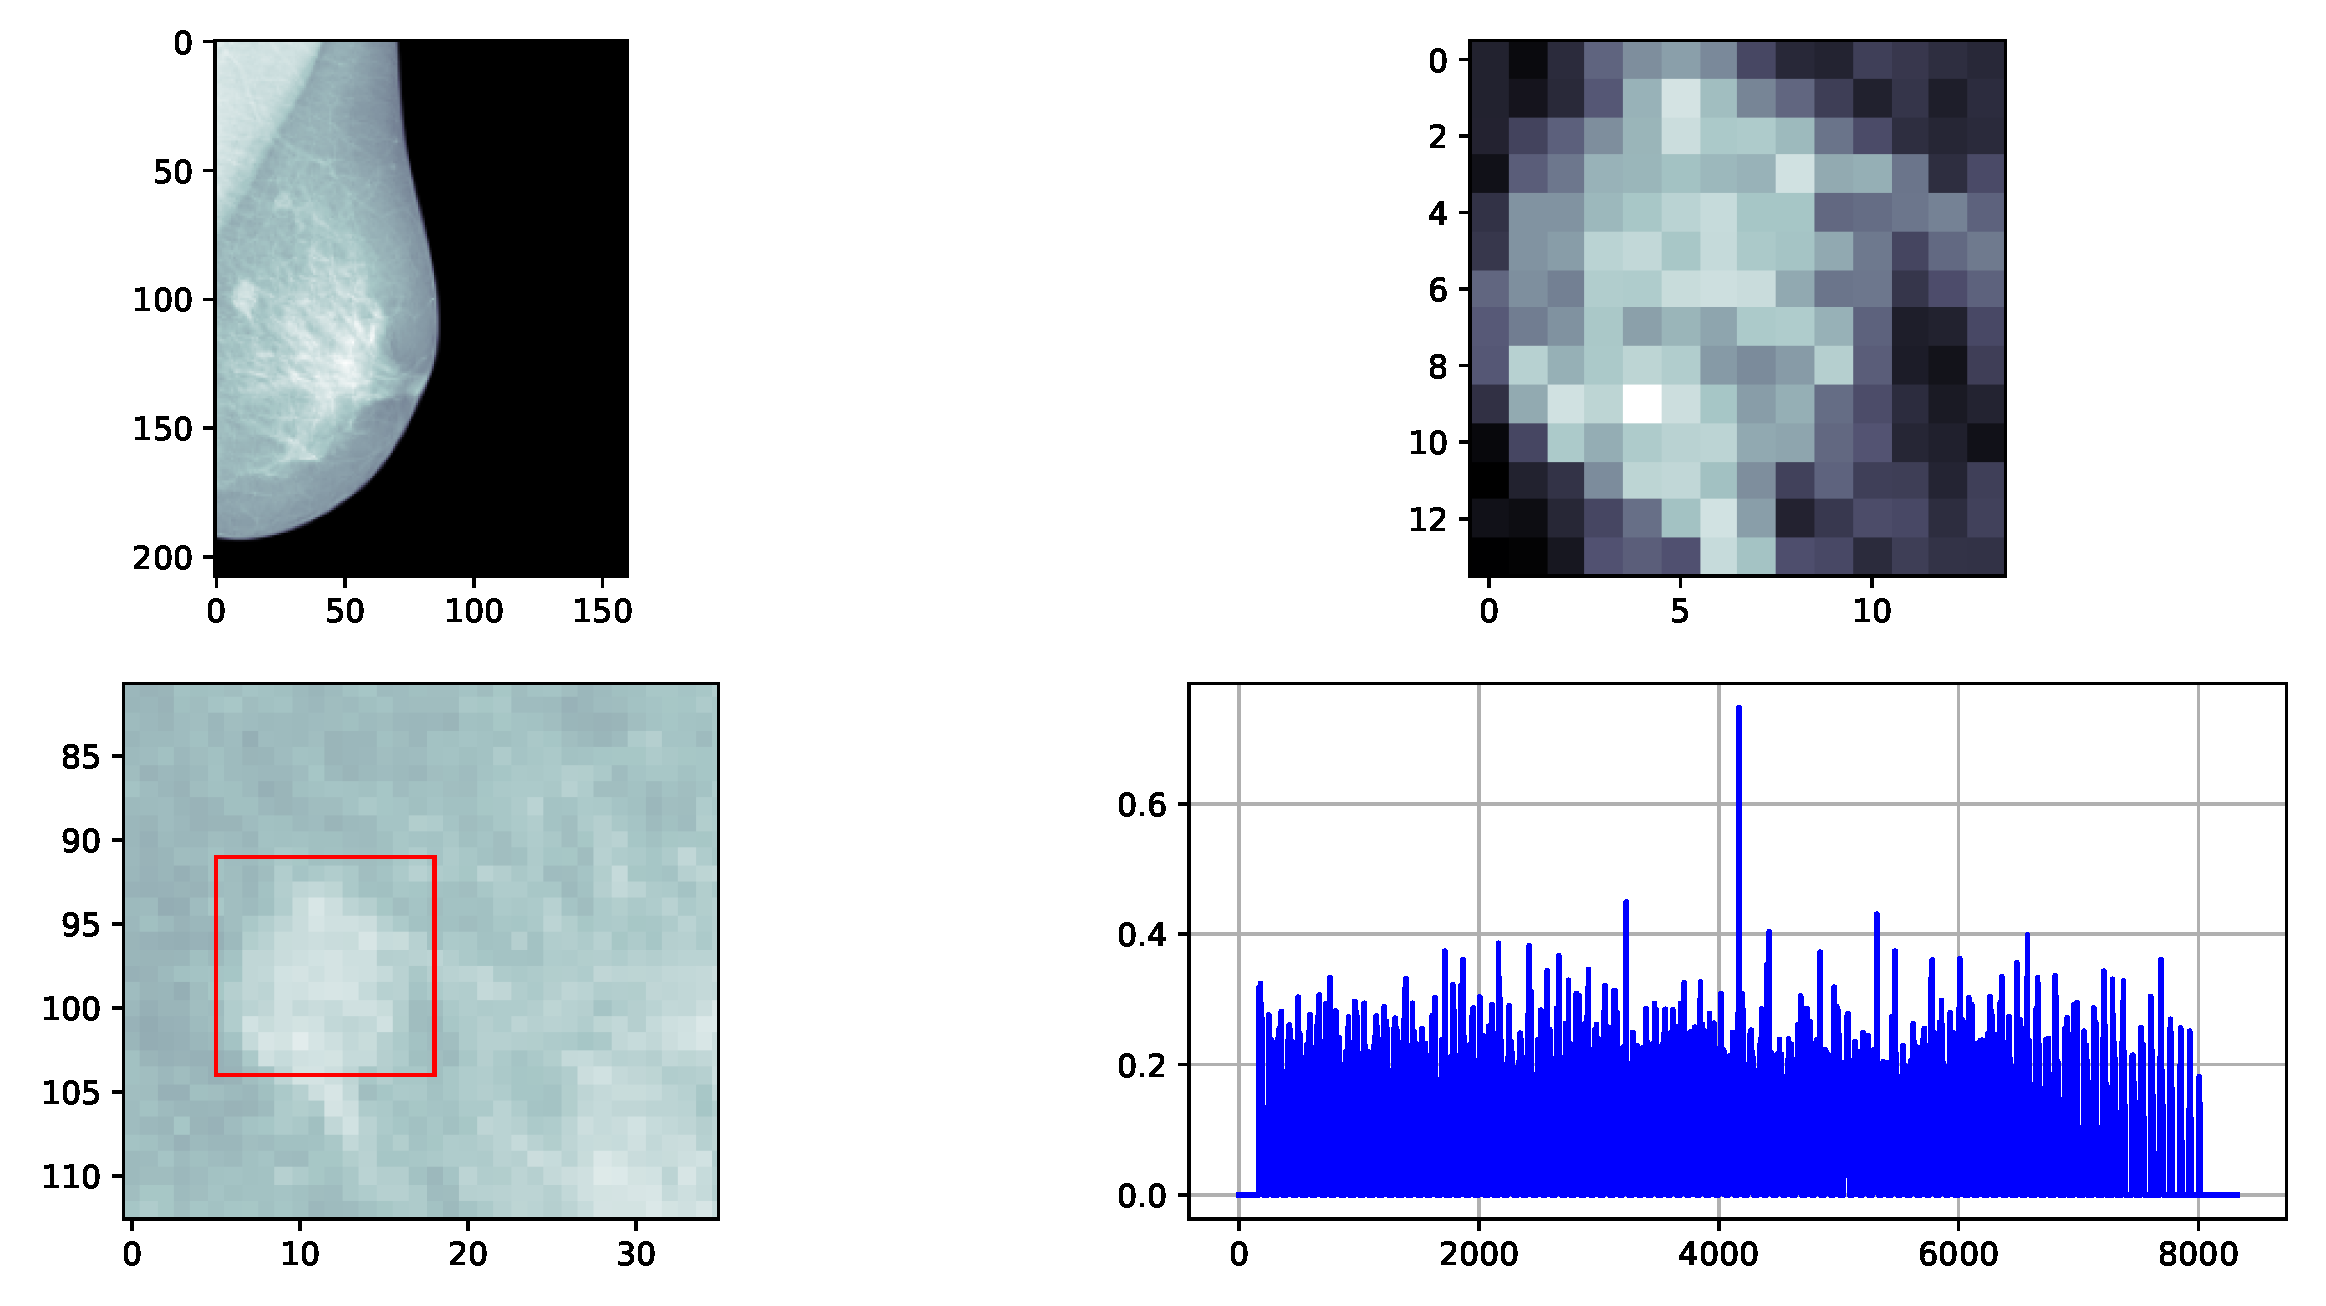
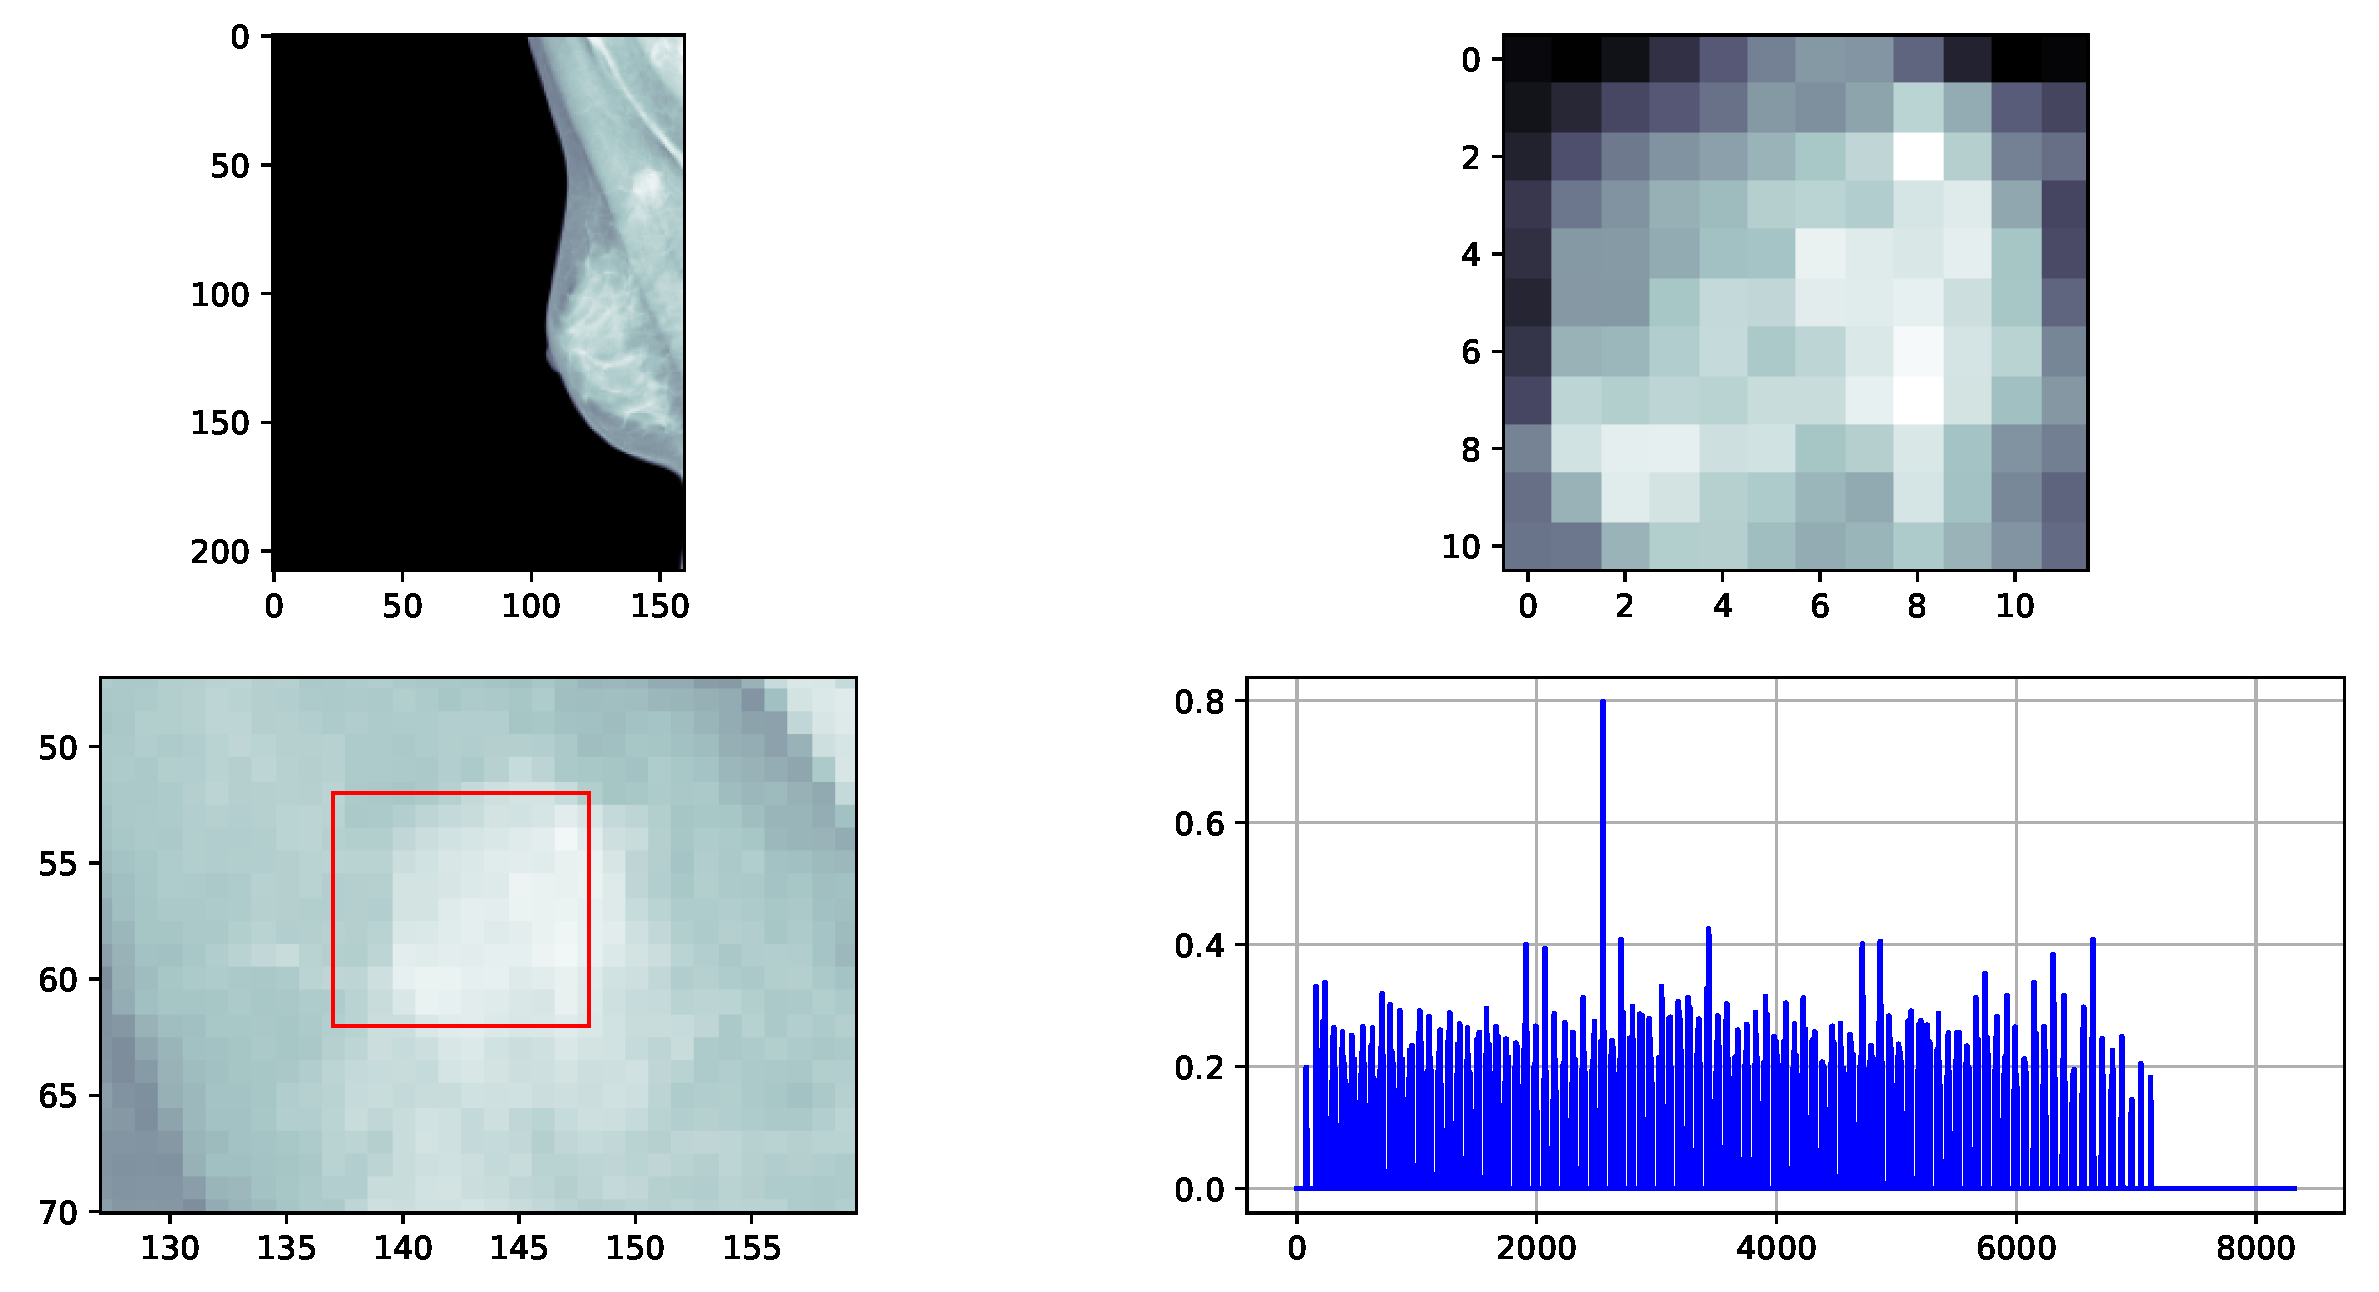
Thus, it was decided to extend the experimentation to six mass-type patterns in 118 mammography images from the INbreast 1.0 [45] database (Figure 5). Due to the limitation of the 1D strategy that requires a shapelet filter with sizes smaller than 26 samples [37,46], the dimension of the images was reduced using the Haar-based DWT to reach 160 × 108 resolution. Next, five different patterns of mass-like abnormalities were intentionally extracted, considering aspects such as the position of the mass, that the lesion was not in the pectoralis or near the edge of the breast, and that there was no local co-occurrence of abnormalities such as calcification within the mass, among other abnormalities. Images coded as 20588072, 20588334, 22580192, 50994354, 53580858, and 21598072 from the INbreast dataset were selected (Figure 6). The results of pattern detection in the first five images can be seen in Figure 7, Figure 8, Figure 9, Figure 10, and Figure 11, respectively. A flowchart of the simulations setup for the experiments over the proposed DST-II 2D for mass-like pattern detection is depicted in Figure 5.
Since such mass-like patterns only occur once in the corresponding images, a test set including all INbreast images, where each of the five mass patterns were separately inserted, was constructed, merging the original image with the pattern image using the sum of images within a symmetric and logarithmic model for image processing (S-LIP) proposed by [47], already used in two of this papers author’s own research [17,48]. This fusion was performed around the centroid of the original mammography image, which was estimated with the function skimage.measure.regionprops of the Python library Scikit-image [49]. To detect the mass-like pattern, the algorithm described in Section 2.3 was used. Since it can happen that several rectangles are obtained where the pattern to be detected is estimated to be located, the rectangle with the highest value of the measure S was taken. To measure the level of agreement between the actual location of the inserted mass-like pattern and the estimated location, the Intersection over Union (IoU) measure was used.
The IoU metric in object detection evaluates the degree of overlap between the region where a mass is actually located in an image and the prediction of such a region given by a certain algorithm [50]. It is defined as the intersection area of both regions divided by their union area, and ranges from 0 to 1, where 0 indicates no overlap and 1 means perfect overlap. In this contribution, it is considered that the detection of the mass-like pattern is achieved for an IoU 0.30 .
In addition to the estimated shapelets for each pattern, another 61 classic wavelets, such as Daubechies 1-32, Symlets 2-19, and Coiflet 2-12, were used in the detection, available in their 2D version in PyWavelets [51]. Thus, the confusion matrix and the ROC curve of the detection were computed using the R language [52].

3.2.2. Results of 2D Detection

Using the estimated shapelet and the 61 classical wavelets, 175,584 runs were performed, resulting in detecting six embedded mass-like patterns in 118 images from INbreast.
When using shapelets and classical wavelets for detection, the average IoU mean was reported as 0 with a median of 0, indicating many cases with little to no overlap between detected and actual patterns
When shapelets were used to detect the masses in images that actually had such anomalies inserted (472 images), 431 zeros of the IoU measure were obtained, with a mean of 0.01 ( S D = 0.08 ) and a maximum value of 0.92 . If the images did not contain the mass-like pattern (2360), this measure reached 2181 zeros, a mean of 0.01 ( S D = 0.07 ), and a maximum value of 0.92 .
Figure 12 shows that when using the estimated shapelets for each pattern, a very high sensitivity of 0.96 (i.e., most of the inserted mass-like patterns were detected correctly) and a low specificity of 0.04 (i.e., if the anomaly was not in the signal, it is not detected by the algorithm) were reached. In addition, a high positive predictive value of 0.83 (i.e., knowing that the algorithm detected the anomaly, what is the probability that it actually occurs in the signal) and a low negative predictive value of 0.16 (i.e., knowing that if the algorithm did not detect the anomaly, what is the probability that it really is not there) were obtained.
Figure 13 shows, from top to bottom, the best and worst detection results according to the IoU measure. From left to right, the mammography image with the mass-like pattern inserted (in a red rectangle) by fusion of the S-LIP model; the image of the mass to be detected; and the detection results (red rectangles) according to the measurement S on the diagonal detail coefficients of the DST-II 2 are shown. The detection with the highest value of the said measurement is colored yellow. The last column of the graph shows the values of the measure S for the diagonal coefficients.
Figure 13a,b show the most accurate detection results. It can be noted that there are several predictions of the pattern detection with value of S > 0.7 , and very accurate pattern detection was reached (IoU = 0.92 and 0.64, respectively), with a high value of the measure ( S = 0.73 and 0.75 , respectively). Many of the predictions are located within the breast and near the position where the mass-like abnormality pattern was inserted. However, some are at the edge of the breast, near the pectoral, or entirely outside the breast.
On the other hand, Figure 13c,d shows the least-accurate results in pattern detection. A dispersion of the predictions can be noticed, and even the most accurate does not detect the anomaly, as expected, since it was not inserted into the image. Note that in these cases, despite the fact that high values of the S measure are obtained, similar to those obtained in the most precise detection, the IoU metric reached low values.
When comparing the detection of these 2D patterns using classical wavelets instead of shapelets, high precision was not obtained. Figure 14 shows that very high sensitivity ( 0.99 ) and very low specificity ( 0.006 ) were reached. On the other hand, a high positive predictive value ( 0.83 ) and a low negative predictive value ( 0.18 ) were obtained. Table 1 shows a summary of the measures obtained from the confusion matrix when detecting 2D shapes using shapelets and classical wavelets.
The proposed strategy to detect specific 2D patterns showed effectiveness in artificial patterns and, in some cases, in patterns of mass-like abnormalities in digital mammography. When performing the simulation on this type of images, a high sensitivity and positive predictive value in detection was achieved, but not a high specificity or negative predictive value, contrary to what occurred in the 1D strategy. This means that the proposed algorithm presents a high number of false negatives, which can be explained by the high self-similarity of the regions in the breast tissue, the slow intensity variations of the pixels in these images, and the presence of fuzzy edges, aspects pointed out by authors such as [1], as well as the modification of the resolution made in order to apply the proposed 2D strategy. Sensitivity and specificity are inversely related; as sensitivity increases, specificity tends to decrease, and vice versa. When a test’s sensitivity is high, only few cancers are likely to be missed. Specificity is the proportion of healthy women who are correctly identified as not having breast cancer. A test with low specificity is more likely to produce a high number of false positives and may incorrectly identify disease or illness in individuals when it is not present. Understanding how sensitivity and specificity impact test results and test interpretation can help to inform clinical decision-making. If the radiologist is knowledgeable about the sensitivity and specificity values of the algorithm, he or she can request an opinion from more experienced people to analyze false positives, or he or she can guide other tests for this subset of the analyzed population.
Another aspect to consider is the “stiffness” of the detection conditions of the proposed 2D extension, which was based on the DST-II detection constraints for 1D. The detection conditions are stiff in the sense that these conditions seek a perfect match between the shapelet filter and the pattern to be detected. This fact struggles to manifest in the case of mammographic images, given the high self-similarity of the regions in the breast tissue, the slow variations of pixel intensity in these images, and the presence of fuzzy edges. This opens the door for further research where fuzzy constraints or a probabilistic and Bayesian approach can be used to model such correspondence. Also, it is know that the detection with DST-II is sensitive to noise in 1D signals, so it is recommend to apply some denoising method before the detection. It is necessary to undertake further research on this issue, considering the different noise types present in mammographic images, such as Poisson noise.

4. Conclusions

A novel strategy was proposed to design a 2D-adapted wavelet that allows for the locating of a pattern within a digital image. The proposed strategy consisted of using the equation of the diagonal coefficients (which depend only on the high pass filter) corresponding to the tensor product to build 2D wavelet bases. A 1D filter was then estimated such that conditions of finite energy, vanished moments, orthogonality, and four new detection conditions are met. These ensure that when performing 2D DWT, the filter detects the pattern by taking the diagonal coefficients with values of the measure S ( α = 0.1 ) > 0.7 . The positions of these coefficients are used to estimate the position of the pattern in the original image. To find the aforementioned filter, the already-validated 1D strategy is used. The 2D strategy requires that in order to guarantee the convergence of the numerical iteration, the filters do not have a support size greater than 26 samples. For pattern sizes larger than 26 samples, convergence is not achieved with any of the numerical algorithms used using the convergence criterion considered. This is in agreement with the experimental (not theoretical) results of Murugesan [53]. This limit on the pattern size to achieve convergence of the numerical methods would surely change if better hardware or a parallel computing scheme were used, which will be considered in future research. This is happening because, as the size of the system increases, the convergence of the numerical method may become more difficult or require more iterations to reach an accurate solution. High-dimensional systems of non-linear equations can have multiple solutions, which makes the convergence of the numerical method more difficult. The computational complexity increases with the number of variables in the system, which can lead to numerical stability problems and rounding errors. On the other hand, the detection conditions of the proposed 2D extension are stiff in the sense that these conditions seek a perfect match between the shapelet filter and the pattern to be detected. This fact is difficult to occur in the case of mammographic images, given the high self-similarity of the regions in the breast tissue, the slow variations of pixel intensity in these images and the presence of fuzzy edges. This opens the door for further research, where fuzzy constraints can be used to model such correspondence or a probabilistic and Bayesian approach.
The presented results show that the proposal allows for the identification of regions of the image between which the pattern is found, which would help specialists, after effective validation, to focus their gaze on those regions instead of looking at the whole image, with the consequent visual fatigue and time delay that this causes. The results would need to be refined and evaluated on a larger number of digital mammography images annotated by medical specialists. This would allow for the proposal to be used in the medium to long term as a feature vector for training machine learning models in lesion classification and malignancy, given the importance of early diagnosis of the disease. Practical benefits can be found in other less-complex domains with respect to the nature of the image, such as the detection of characters in documents or small dimensional patterns such as microcalcifications in digital mammograms. This work has shown the possibility of using DST-II to localize shapes and masses in digital mammograms. There have been experiments that support our starting hypothesis. However, we have not performed systematic experimentation to determine the best threshold and the best alpha value associated with the normalized similarity measure. The use of statistical learning techniques to determine such parameters could help to improve the specificity values. High sensitivity and positive predictive value in detection were achieved but not high specificity or negative predictive value, contrary to what occurred in the 1D strategy. This means that the proposed detection algorithm presents a high number of false negatives, which can be explained by the complexity of detection in this type of images. The following future improvements could be focused on: using other stable numerical algorithms to solve high-dimensional systems, given the characteristics of these mammography images; and specifying the optimization model for the identification of mass-like anomalies in mammography, among others. This research did not evaluate whether the 2D extension of DST-II was effective for certain types of mass-like patterns such as stellate or lobulated tumours; rather, it tested, at an exploratory level, whether the technique was useful for localizing, with some accuracy, this type of abnormality. This will be the subject of further research. The results of the exploratory study presented here show that there is room for improvement in the technique, which will be resolved in the near future and will enable it to be validated as a possible component of a CAD for localizing different types of masses.
Finally, the proposed is characterized by interpretability and explainability [54]. Specifically, it illustrates simulatability, indicating its susceptibility to simulation or cognitive scrutiny by a human observer. Moreover, the approach demonstrates decomposability, wherein each constituent aspect is elucidated in isolation, thereby augmenting comprehensibility. Additionally, it exhibits algorithmic transparency, enabling the user to apprehend the procedural sequence employed by the methodology in transforming input data into output. This attribute assumes heightened significance in the health domain, where confidence in the behavior of intelligent systems is of utmost importance.

Author Contributions

Conceptualization, D.V.-S. and A.M.L.-M.; methodology, D.V.-S., A.M.L.-M. and M.L.B.D.-R.; software, D.V.-S.; validation, D.V.-S., A.M.L.-M. and M.G.-H.; investigation, D.V.-S.; resources, A.J.-i.-C. and J.M.B.R.; data curation, D.V.-S.; writing—original draft preparation, D.V.-S. and A.M.L.-M.; writing—review and editing, A.M.L.-M., M.L.B.D.-R., M.G.-H., A.J.-i.-C. and J.M.B.R.; visualization, D.V.-S.; supervision, A.M.L.-M., M.L.B.D.-R. and M.G.-H.; funding acquisition, M.G.-H., A.J.-i.-C. and J.M.B.R. All authors have read and agreed to the published version of the manuscript.

Funding

This research was developed as part of the project PN223LH010-003 “Numerical Methods for Multiscale Problems” from the Cuban National Basic Sciences Program, funded by the Ministry of Science, Technology and Environment (CITMA), Cuba. It was also partially funded by the Erasmus+ Program “Student Mobility for Traineeships” (2021), University of the Balearic Islands and the University of Havana; R&D&I Project PID2019-104829RAI00—“EXPLainable Artificial INtelligence systems for health and well-beING (EXPLAINING)”, MCIN/AEI/10.13039/501100011033; R+D+i Project PID2020-113870GB-I00—“Development of Soft Computing tools for Clinical Diagnostic Aid and Emergency Management (HESOCODICE)”, MCIN/AEI/10.13039/501100011033; and Project OCDS-CUD2022/03 —“Propuesta de sistema 3D para seguimiento y medición de úlceras en pies diabéticos”.

Institutional Review Board Statement

Not applicable.

Informed Consent Statement

Not applicable.

Data Availability Statement

All data and code are available at https://github.com/dvs89cs/dst2_ieee_latam (accessed on 2 January 2024).

Conflicts of Interest

The authors declare no conflicts of interest.

References

  1. Bhateja, V.; Misra, M.; Urooj, S. Non-Linear Filters for Mammogram Enhancement; Springer Nature: Singapore, 2020; p. 251. [Google Scholar]
  2. Tang, J.; Rangayyan, R.M.; Xu, J.; El Naqa, I.E.; Yang, Y. Computer-aided detection and diagnosis of breast cancer with mammography: Recent advances. IEEE Trans. Inf. Technol. Biomed. 2009, 13, 236–251. [Google Scholar] [CrossRef] [PubMed]
  3. Bayareh-Mancilla, R.; Medina-Ramos, L.A.; Toriz-Vázquez, A.; Hernández-Rodríguez, Y.M.; Cigarroa-Mayorga, O.E. Automated Computer-Assisted Medical Decision-Making System Based on Morphological Shape and Skin Thickness Analysis for Asymmetry Detection in Mammographic Images. Diagnostics 2023, 13, 3440. [Google Scholar] [CrossRef] [PubMed]
  4. Price, E.R.; Joe, B.N.; Sickles, E.A. The developing asymmetry: Revisiting a perceptual and diagnostic challenge. Radiology 2015, 274, 642–651. [Google Scholar] [CrossRef] [PubMed]
  5. Scutt, D.; Manning, J.T.; Whitehouse, G.H.; Leinster, S.J.; Massey, C.P. The relationship between breast asymmetry, breast size and the occurrence of breast cancer. Br. J. Radiol. 1997, 70, 1017–1021. [Google Scholar] [CrossRef] [PubMed]
  6. Medina-Ramos, L.; Toriz-Vázquez, A.; Hernández-Rodríguez, Y.; Bayareh-Mancilla, R.; Cigarroa-Mayorga, O. Automated Segmentation of Breast Skin for Early Cancer Diagnosis: A Multi-otsu Region Growing Approach for Detecting Skin Thickness Variations. In Proceedings of the XLVI Mexican Conference on Biomedical Engineering, CNIB 2023, IFMBE Proceedings, Villahermosa Tabasco, Mexico, 2–4 November 2023; Volume 96, pp. 211–221. [Google Scholar] [CrossRef]
  7. Yang, C.; Weng, G.; Chen, Y. Active contour model based on local Kullback–Leibler divergence for fast image segmentation. Eng. Appl. Artif. Intell. 2023, 123, 106472. [Google Scholar] [CrossRef]
  8. Bozek, J.; Mustra, M.; Delac, K.; Grgic, M. A survey of image processing algorithms in digital mammography. In Recent Advances in Multimedia Signal Processing and Communications; Springer: Berlin, Germany, 2009; pp. 631–657. [Google Scholar]
  9. Oliver, A.; Freixenet, J.; Martí, J.; Pérez, E.; Pont, J.; Denton, E.R.E.; Zwiggelaar, R. A review of automatic mass detection and segmentation in mammographic images. Med. Image Anal. 2010, 14, 87–110. [Google Scholar] [CrossRef]
  10. Vikhe, P.; Thool, V. Mass Detection in Mammographic Images Using Wavelet Processing and Adaptive Threshold Technique. J. Med. Syst. 2016, 40, 82. [Google Scholar] [CrossRef]
  11. Rashed, E.; Ismail, I.; Zaki, S. Multiresolution mammogram analysis in multilevel decomposition. Pattern Recognit. Lett. 2007, 28, 286–292. [Google Scholar] [CrossRef]
  12. Lai, S.; Li, X.; Bischof, W. On techniques for detecting circumscribed masses in mammograms. IEEE Trans. Med. Imag. 1989, 8, 377–386. [Google Scholar] [CrossRef]
  13. Li, B.; Chen, X. Wavelet-based numerical analysis: A review and classification. Finite Elem. Anal. Des. 2014, 81, 14–31. [Google Scholar] [CrossRef]
  14. Abdulazeez, A.M.; Zeebaree, D.Q.; Abdulqader, D.M. Wavelet Applications in Medical Images: A Review. Test Eng. Manag. 2020, 83, 17265–17276. [Google Scholar]
  15. Kumar, A. Wavelet Signal Processing: A Review for Recent Applications. Int. J. Eng. Tech. 2020, 6, 1–7. [Google Scholar] [CrossRef]
  16. Guido, R.C. A note on a practical relationship between filter coefficients and scaling and wavelet functions of discrete wavelet transforms. Appl. Math. Lett. 2011, 24, 1257–1259. [Google Scholar] [CrossRef]
  17. Valdés-Santiago, D.; Mesejo-León, D.; León-Mecías, A. Multiple-level Logarithmic Wavelets for mammographic contrast enhancement: A statistical analysis for wavelet selection. Rev. Comput. Y Sist. 2018, 22, 621–637. [Google Scholar] [CrossRef]
  18. Chapa, J.O.; Rao, R.M. Algorithms for designing wavelets to match a specified signal. IEEE Trans. Signal Process. 2000, 48, 3395–3406. [Google Scholar] [CrossRef]
  19. Mesa, H. Adapted Wavelets for Pattern Detection. In Proceedings of the Progress in Pattern Recognition, Image Analysis and Applications: 10th Iberoamerican Congress on Pattern Recognition, CIARP 2005, Havana, Cuba, 15–18 November 2005; Sanfeliu, A., Cortés, M.L., Eds.; Springer: Berlin/Heidelberg, Germany, 2005; pp. 933–944. [Google Scholar]
  20. Misiti, M.; Yves, M.; Oppenheim, G.; Poggi, J.M. Wavelets and their Applications; ISTE Ltd.: London, UK, 2007; p. 353. [Google Scholar]
  21. Floryan, D.; Graham, M.D. Discovering multiscale and self-similar structure with data-driven wavelets. Proc. Natl. Acad. Sci. USA 2021, 118, e2021299118. [Google Scholar] [CrossRef] [PubMed]
  22. Guido, R.C. Fusing time, frequency and shape-related information: Introduction to the Discrete Shapelet Transform’s second generation (DST-II). Inf. Fusion 2018, 41, 9–15. [Google Scholar] [CrossRef]
  23. Guido, R.C.; Barbon, S.; Vieira, L.S.; Sanchez, F.L.; Maciel, C.D.; Pereira, J.C.; Scalassara, P.R.; Fonseca, E.S. Introduction to the discrete shapelet transform and a new paradigm: Joint time-frequency-shape analysis. In Proceedings of the IEEE International Symposium on Circuits and Systems, Seattle, WA, USA, 18–21 May 2008; pp. 2893–2896. [Google Scholar] [CrossRef]
  24. Guido, R.C. Nearly symmetric orthogonal wavelets for time-frequency-shape joint analysis: Introducing the discrete shapelet transform’s third generation (DST-III) for nonlinear signal analysis. Commun. Nonlinear Sci. Numer. Simul. 2021, 97, 105685. [Google Scholar] [CrossRef]
  25. Chapa, J.O.; Rao, R.M. Optimal matched wavelet construction and its application to image pattern recognition. In Proceedings of the Wavelet Applications II, Orlando, FL, USA, 17–21 April 1995; Szu, H.H., Ed.; Volume 2491, pp. 518–529. [Google Scholar] [CrossRef]
  26. Fung, C.C.; Shi, P. Design of compactly supported wavelet to match singularities in medical images. In Proceedings of the Applications of Digital Image Processing XXV, Seattle, WA, USA, 7–11 July 2002; Tescher, A.G., Ed.; International Society for Optics and Photonics, SPIE: Bellingham, WA, USA, 2002; Volume 4790, pp. 358–369. [Google Scholar] [CrossRef]
  27. Kumar, S.; Khanna, N.; Chaudhury, S.; Joshi, S.D. Locating text in images using matched wavelets. In Proceedings of the Eighth International Conference on Document Analysis and Recognition (ICDAR’05), Seoul, Republic of Korea, 31 August–1 September 2005; Volume 2, pp. 595–599. [Google Scholar] [CrossRef]
  28. Mesa, H. Ondelettes Adaptées pour la Détection de Motifs. Ph.D. Thesis, Université Paris XI, Paris, France, 2006. [Google Scholar]
  29. DelMarco, S.; Agaian, S. The design of wavelets for image enhancement and target detection. In Proceedings of the Mobile Multimedia/Image Processing, Security, and Applications 2009, Orlando, FL, USA, 14–15 April 2009; Agaian, S.S., Jassim, S.A., Eds.; International Society for Optics and Photonics, SPIE: Bellingham, WA, USA, 2009; Volume 7351, p. 735103. [Google Scholar] [CrossRef]
  30. Pragada, S.; Sivaswamy, J. Design of Image Adaptive Wavelets for Denoising Applications. In Proceedings of the National Conference on Communications (NCC), Powai, India, 1–3 February 2008; pp. 584–589. [Google Scholar]
  31. Gupta, A.; Joshi, S.D. Two-channel nonseparable wavelets statistically matched to 2D images. Signal Process. 2011, 91, 673–689. [Google Scholar] [CrossRef]
  32. Isnanto, R.R.; Satoto, K.I.; Windasari, I.P. Constructing irislet: A new wavelet type which matched for iris image characteristics. In Proceedings of the 2nd International Conference on Information and Communication Technology (ICoICT), Bandung, Indonesia, 28–30 May 2014; pp. 232–237. [Google Scholar] [CrossRef]
  33. Ansari, N.; Gupta, A.; Duggal, R. Design of Image Matched Non-Separable Wavelet using Convolutional Neural Network. arXiv 2016, arXiv:1612.04966. [Google Scholar] [CrossRef]
  34. Ansari, N.; Gupta, A. Image Reconstruction Using Matched Wavelet Estimated From Data Sensed Compressively Using Partial Canonical Identity Matrix. IEEE Trans. Image Process. 2017, 26, 3680–3695. [Google Scholar] [CrossRef]
  35. Recoskie, D. Learning Sparse Orthogonal Wavelet Filters. Ph.D. Thesis, University of Waterloo, Waterloo, ON, Canada, 2018. [Google Scholar]
  36. Xing, Y.; Huda, W.; Laine, A.F.; Fan, J. Simulated phantom images for optimizing wavelet-based image processing algorithms in mammography. In Proceedings of the Mathematical Methods in Medical Imaging III, San Diego, CA, USA, 25–26 July 1994; Bookstein, F.L., Duncan, J.S., Lange, N., Wilson, D.C., Eds.; Volume 2299, pp. 207–217. [Google Scholar] [CrossRef]
  37. Valdés-Santiago, D.; León-Mecías, A.; Baguer Díaz Romañach, M.L.; González Hidalgo, M.; Jaume-i Capó, A. Influencia en la detección de patrones de la solución del sistema no lineal en una Transformada Shapelet Discreta II. Rev. Mat. Teor. Apl. 2023, in press. [Google Scholar]
  38. Frazier, M.W. An Introduction to Wavelets through Linear Algebra; Springer: New York, NY, USA, 1999; p. 520. [Google Scholar] [CrossRef]
  39. Ryan, Ø. Linear Algebra, Signal Processing, and Wavelets. A Unified Approach. Python Version; Springer Nature: Cham, Switzerland, 2019; p. 382. [Google Scholar] [CrossRef]
  40. Mallat, S.G. A Wavelet Tour of Signal Processing: The Sparse Way, 3rd ed.; Academic Press: Burlington, MA, USA, 2009; p. 808. [Google Scholar] [CrossRef]
  41. Valdés-Santiago, D. Análisis Numérico de una Estrategia de Construcción de Wavelets Adaptadas a Patrones Unidimensionales: Extensión a Imágenes Digitales. Ph.D. Thesis, Facultad de Matemática y Computación, Universidad de La Habana, Havana, Cuba, 2023. [Google Scholar]
  42. Dirección Nacional de Registros Médicos y Estadísticas de Salud. Anuario Estadístico de Salud 2019; Technical Report; Ministerio de Salud Pública de Cuba: La Habana, Cuba, 2020.
  43. Skaane, P. Studies comparing screen-film mammography and full-field digital mammography in breast cancer screening: Updated review. Acta Radiol. 2009, 50, 3–14. [Google Scholar] [CrossRef] [PubMed]
  44. Benson, J.R.; Tuttle, T.M.; Gui, G. Early Breast Cancer: From Screening to Multidisciplinary Management, 3rd ed.; CRC Press: Boca Raton, FL, USA, 2013. [Google Scholar]
  45. Moreira, I.C.; Amaral, I.; Domingues, I.; Cardoso, A.; Cardoso, M.J.; Cardoso, J.S. INbreast: Toward a Full-field Digital Mammographic Database. Acad. Radiol. 2012, 19, 236–248. [Google Scholar] [CrossRef] [PubMed]
  46. Valdés-Santiago, D.; León-Mecías, A.; Baguer Díaz Romañach, M.L.; González Hidalgo, M.; Jaume-i Capó, A. Exploratory study on estimation, detection and robustness of a Discrete Shapelet Transform II. Rev. Investig. Oper. (Aprobado Para Publicar) 2023, 44, 184–205. [Google Scholar]
  47. Navarro, L.; Deng, G.; Courbebaisse, G. The Symmetric Logarithmic Image Processing Model: Application to Laplacian Edge Detection. Digit. Signal Process. Rev. J. 2013, 23, 1337–1343. [Google Scholar] [CrossRef]
  48. Valdés-Santiago, D. Transformada Wavelet Logarítmica Multinivel para Incrementar Contraste de Masas en Mamografía Digital. Mater’s Thesis, Facultad de Matemática y Computación, Universidad de La Habana, Havana, Cuba, 2018. [Google Scholar]
  49. Van der Walt, S.; Schönberger, J.L.; Nunez-Iglesias, J.; Boulogne, F.; Warner, J.D.; Yager, N.; Gouillart, E.; Yu, T.; the scikit-image contributors. scikit-image: Image processing in Python. PeerJ 2014, 2, e453. [Google Scholar] [CrossRef] [PubMed]
  50. Padilla, R.; Passos, W.L.; Dias, T.L.B.; Netto, S.L.; da Silva, E.A.B. A Comparative Analysis of Object Detection Metrics with a Companion Open-Source Toolkit. Electronics 2021, 10, 279. [Google Scholar] [CrossRef]
  51. Lee, G.; Gommers, R.; Waselewski, F.; Wohlfahrt, K.; O’Leary, A. PyWavelets: A Python package for wavelet analysis. J. Open Source Softw. 2019, 4, 1237. [Google Scholar] [CrossRef]
  52. R Core Team. R: A Language and Environment for Statistical Computing; R Foundation for Statistical Computing: Vienna, Austria, 2023. [Google Scholar]
  53. Murugesan, S.; Tay, D.B.H. Design of almost symmetric orthogonal wavelet filter bank via direct optimization. IEEE Trans. Image Process. 2012, 21, 2474–2480. [Google Scholar] [CrossRef]
  54. Arrieta, A.B.; Díaz-Rodríguez, N.; Del Ser, J.; Bennetot, A.; Tabik, S.; Barbado, A.; García, S.; Gil-López, S.; Molina, D.; Benjamins, R.; et al. Explainable Artificial Intelligence (XAI): Concepts, taxonomies, opportunities and challenges toward responsible AI. Inf. Fusion 2020, 58, 82–115. [Google Scholar] [CrossRef]
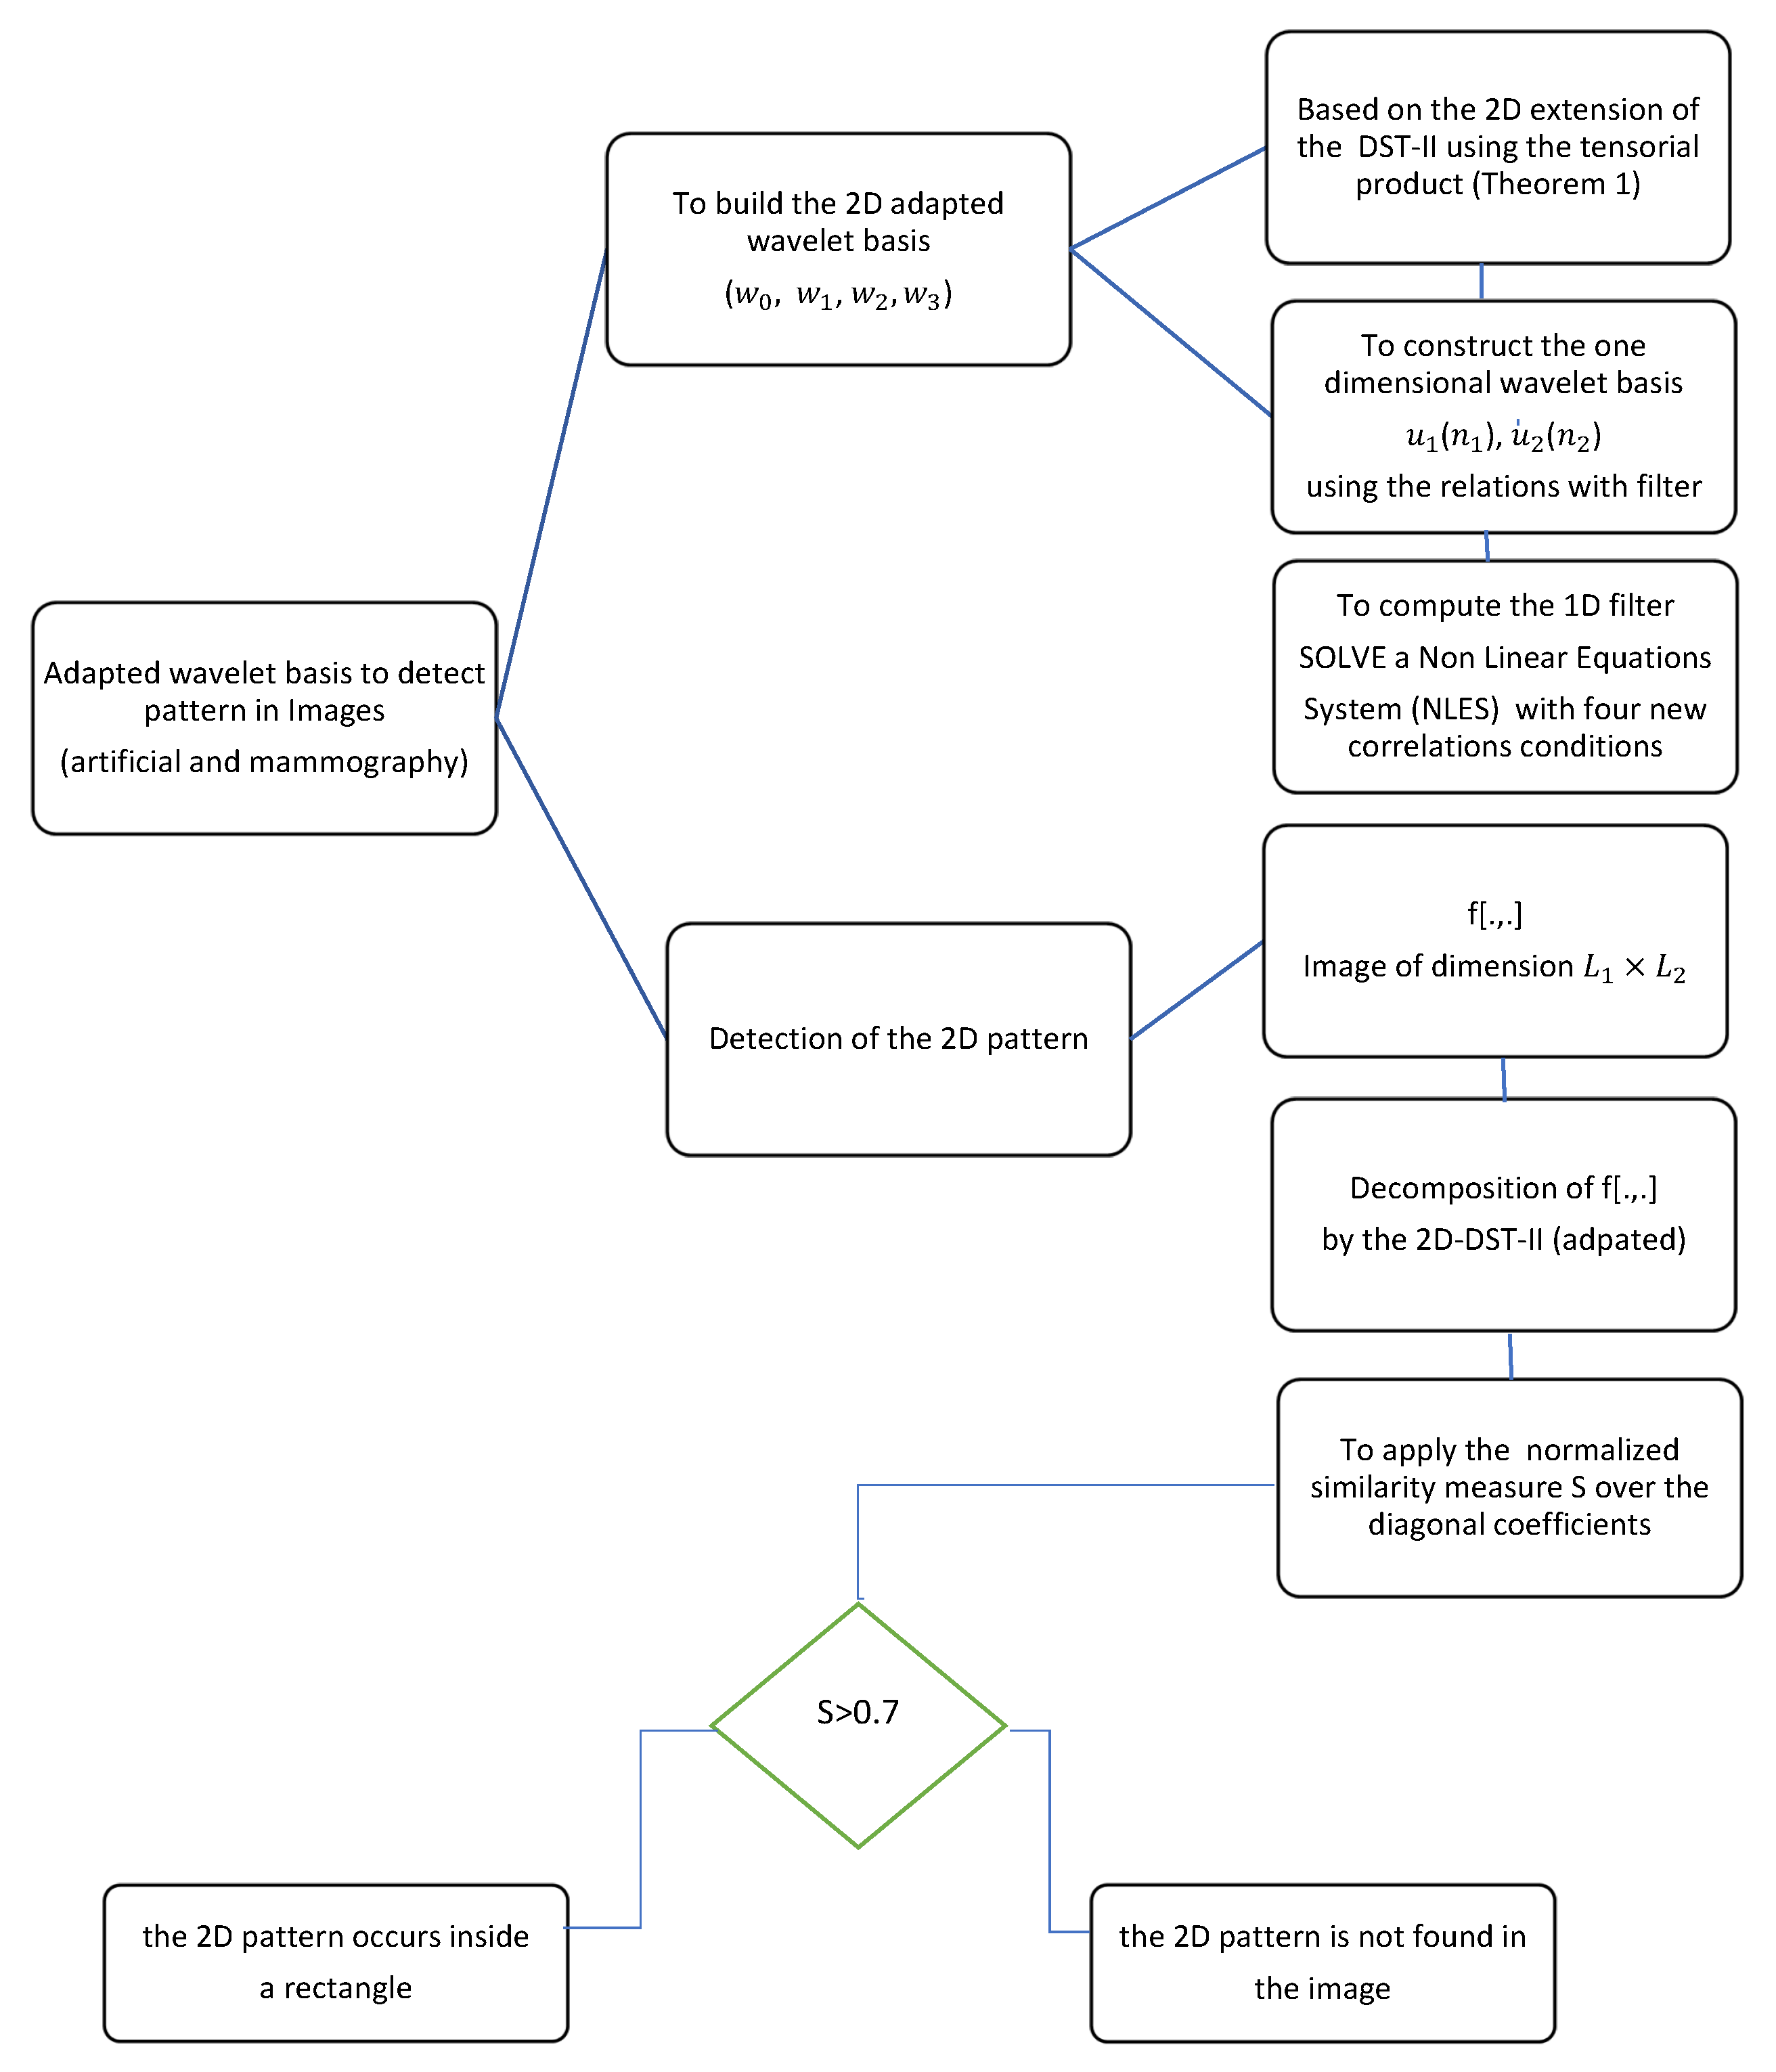
Figure 1. Strategy to estimate a 2D pattern-adapted wavelet based on the two-dimensional extension of the DST-II and its use in detecting patterns in images.
Applsci 14 00468 g001
Figure 2. Locating the pattern of the letter c in an image. From left to right: the original image, the pattern to be detected, the region given by the algorithm based on shapelets, and the measure S of the diagonal coefficients of detail. Position of the maximum value for the measure S of the diagonal coefficients = 371, Rect(xy = (20, 25), width = 8, height = 9, angle = 0).
Applsci 14 00468 g002
Figure 3. Locating the pattern of the letter a in an image. From left to right: the original image, the pattern to be detected, the region given by the algorithm based on shapelets, and the measure S of the diagonal coefficients of detail. Maxima of the measure S of the diagonal coefficients = { 143 , 375 , 606 } , Rect(xy = (26, 3), width = 8, height = 9), Rect(xy = (28, 25), width = 8, height = 9), Rect(xy = (28, 47), width = 8, height = 9).
Applsci 14 00468 g003
Figure 4. Locating a mass-like abnormality pattern on a digital mammogram. From left to right: the original image, the pattern to be detected, the region given by the algorithm based on shapelets, and the measure S of the diagonal coefficients of detail.
Applsci 14 00468 g004
Figure 5. Flowchart of the simulations setup for the experiments over the proposed DST-II 2D for mass-like pattern detection.
Applsci 14 00468 g005
Figure 6. Patterns of mass-like anomaly from the INbreast mammography database to estimate 2D shapelets: (a) 20588072; (b) 20588334; (c) 22580192; (d) 50994354; (e) 53580858; (f) 21598072.
Applsci 14 00468 g006
Figure 7. Successful pattern detection in image 20588072. From left to right and top to bottom: the original image, the pattern to be detected, the region given by the algorithm based on shapelets, and the measure S of the diagonal detail coefficients.
Applsci 14 00468 g007
Figure 8. Successful pattern detection in image 20588334. From left to right and top to bottom: the original image, the pattern to be detected, the region given by the algorithm based on shapelets, and the measure S of the diagonal detail coefficients.
Applsci 14 00468 g008
Figure 9. Successful pattern detection in image 22580192. From left to right and top to bottom: the original image, the pattern to be detected, the region given by the algorithm based on shapelets, and the measure S of the diagonal detail coefficients.
Applsci 14 00468 g009
Figure 10. Successful pattern detection in image 50994354. From left to right and top to bottom: the original image, the pattern to be detected, the region given by the algorithm based on shapelets, and the measure S of the diagonal detail coefficients.
Applsci 14 00468 g010
Figure 11. Successful pattern detection in image 53580858. From left to right and top to bottom: the original image, the pattern to be detected, the region given by the algorithm based on shapelets, and the measure S of the diagonal detail coefficients.
Applsci 14 00468 g011
Figure 12. Confusion matrix on the effectivity for detecting 2D patterns using the corresponding shapelets.
Applsci 14 00468 g012
Figure 13. Best (a,b) and worst (c,d) results, according to the measure IoU, of 2D detection (in yellow) using the estimated shapelet for each pattern inserted in the image. From left to right: the original image, the pattern to be detected, the region given by the algorithm based on shapelets, and the measure S of the diagonal coefficients of detail. (a) Detection of the pattern pat21598072 inserted in the image 20587466, IoU = 0.92, S = 0.73 . (b) Detection of the pattern pat22580192 inserted in the image 50996228, IoU = 0.64, S = 0.75 . (c) Detection of the pattern pat21598072 inserted in the image 22670832, IoU = 0.116, S = 0.73 . (d) Detection of the pattern pat21598072 inserted in the image 22579916, IoU = 0.012, S = 0.74 .
Applsci 14 00468 g013
Figure 14. Confusion matrix on the effectivity of detecting 2D patterns using classical wavelets.
Applsci 14 00468 g014
Table 1. Comparative table of the results obtained when using shapelets and classical wavelets to detect the pattern in images. See Figure 12 and Figure 14, respectively.
SensibilitySpecificityPrecisionRecallPPVNPV
Shapelets0.960.040.830.960.830.162
Classical Wavelets0.990.0060.830.990.830.18
Disclaimer/Publisher’s Note: The statements, opinions and data contained in all publications are solely those of the individual author(s) and contributor(s) and not of MDPI and/or the editor(s). MDPI and/or the editor(s) disclaim responsibility for any injury to people or property resulting from any ideas, methods, instructions or products referred to in the content.