Article

Changes in Temperature and Precipitation Trends in Selected Polish Cities Based on the Results of Regional EURO-CORDEX Climate Models in the 2030–2050 Horizon

by
Joanna Struzewska
1,
Jacek W. Kaminski
1 and
Maciej Jefimow
1,2,*
1
Department of Atmosphere and Climate Modelling, Institute of Environmental Protection-National Research Institute, 02-170 Warszawa, Poland
2
Department of Environmental Protection and Management, Warsaw University of Technology, 00-661 Warszawa, Poland
*
Author to whom correspondence should be addressed.
Appl. Sci. 2024, 14(1), 9; https://doi.org/10.3390/app14010009
Submission received: 31 October 2023 / Revised: 5 December 2023 / Accepted: 13 December 2023 / Published: 19 December 2023

Abstract

:
This study presents the potential impacts of climate change in 49 Polish cities by analyzing seven climate indicators. The analysis was carried out for the following three horizons: the current climate conditions (an average period spanning 2006 to 2015), near-future conditions (an average period spanning 2026 to 2035), and future conditions (an average period spanning 2046 to 2055). Climate indices were computed with bias-corrected EURO-CORDEX model ensembles from two Representative Concentration Pathway scenarios, RCP4.5 and RCP8.5. The systematic error was reduced using the quantile mapping method with a non-parametric approach of robust empirical quantiles (RQUANT). Data were used as references in the period of current climate conditions, and those required for bias correction consisted of historical ground-based observations provided by the Institute of Meteorology and Water Management. The analysis encompassed various key climate indices, including the annual average temperature, the count of hot days, cold days, and frost days, the cumulative annual precipitation, the frequency of days with precipitation, and instances of extreme precipitation (defined as the days with precipitation exceeding 10 mm/day). These findings reveal a noteworthy rise in the average annual temperature of approximately 1 °C and an uptick in the number of hot days by 3.7 days. Conversely, a decline in the number of cold days by approximately 19 days and frost days by 8 days was observed. Additionally, there was an augmentation in the annual precipitation sum, reaching up to 80 mm in RCP 8.5, accompanied by an increase in the number of days with precipitation (up by 3.3 days) and days with extreme precipitation (up by 2 days).

1. Introduction

Regional Climate Models (RCMs) have been in the scope of research for over 30 years [1,2,3] to develop a community of nested downscaling systems [4] to better understand climate features in meso-gamma scales. The state of knowledge regarding atmospheric physics indicates that the complexity of climate change factors increases with the scale of a complex phenomenon. A comprehensive understanding of climate factors on a local scale can serve as a foundation for informed decision making in city management systems. As the climate continues to evolve and urban areas become increasingly vulnerable to extreme weather events, it is crucial to analyze climate change scenarios and devise effective adaptation strategies, particularly in densely populated urban areas.
The continuous growth of the urban population [5] during global warming is associated with the need to develop and implement plans for climate change adaptation. Such initiatives are within the spectrum of interest of the European Union, assigning local governments the responsibility of leading the required transformation process and aiming to reach mitigation and adaptation goals [6]. The magnitude of global surface temperature change depends on socioeconomic policy development and the resulting greenhouse gas emissions [7,8]. An increase in global surface temperature indicates a rise in the length and frequency of heat waves [9,10,11]. It directly impacts the hydrological cycle, causing increased floods and droughts in Europe [12,13,14,15]. Research conducted by [16] indicates an increase in the mean annual number of summer days (Tmax > 25 °C) in Krakow, in scenario RCP8.5, by 192% (in the period 2071–2100 related to 1971–2000). Another research performed by [17] demonstrates a significant increase, in scenario RCP8.5, of the monthly mean temperature in the hottest month in cities by 4 to 7 °C (by 2100), suggesting that this usually exceeds the threshold for heat deaths.This hazardous phenomenon cannot be neglected, especially the excessive mortality observed and analyzed in, e.g., [18,19,20,21]. Therefore, research on the impact of global climate change on urban areas is vital to city inhabitants. Moreover, since the future of socioeconomic development is unknown (it can only be assumed with predictions), information about the future climate conditions needed for adaptation plans must be acquired from available emission scenarios.
The motivation for the work is related to the needs of the Polish Ministry of Climate and Environment (former Ministry of Environment). A dedicated, innovative project, MPA44 (“Developing climate change adaptation plans for cities with more than 100,000 inhabitants”, http://44mpa.pl/ (access on 12 December 2023), was conducted to develop adaptation plans for climate change in cities with populations exceeding 100,000. The main objective was to assess the climate change sensitivity of the 44 largest Polish cities and plan adaptive actions adequate to the identified threats. Preparing urban adaptation plans in these 44 cities contributed to protecting approximately 30% of Poland’s population from the effects of climate change. Also, implementing this project triggered similar actions at the local level in smaller cities and municipalities. An additional five cities with populations ranging from approximately 50,000 to 99,000 participated in the CLIMCITIES (“CLIMate change adaptation in small and medium-sized CITIES”) project following the MPA44 methodology [22,23]. ClimCities focused on climate change adaptation in five small and medium-sized Polish cities (Bełchatów, Tomaszów Mazowiecki, Ostrołęka, Siedlce, and Nowy Sącz). The climate projections for all cities were the first step in developing Urban Climate Adaptation Plans (UCAPs) in collaboration with authorities, residents, and experts. No other local climate projections were available for Poland at that time. The results of these projects have already been used in current policymaking for climate change adaptation in city development plans in Poland, as demonstrated by [24].
To map the broadest possible range of climate outcomes, we chose to use the RCP 8.5 (MESSAGE) scenario with the assumption of making a small effort to reduce GHG emissions and the effect of reaching a radiative forcing level at 8.5 W/m2 in 2100 [25]. Moreover, stabilization scenario RCP 4.5, based on the miniCAM level 2 scenario, assumed that radiative forcing would be reached at level 4.5 W/m2 in 2100 and never exceed it [26,27,28]. Despite the improbability of the RCP8.5 scenario [29], it remains valuable for assessing the critical risk levels associated with adaptation plans addressing climate change and extreme events.
Climate change scenarios for 49 cities in both projects were developed using a homogeneous climate dataset prepared by the EURO-CORDEX [30,31] as a result of the downscaling procedure with Regional Climate Models of global projections from CMIP5 [32] for the European domain. This paper summarizes spatial and temporal variability of the future climate conditions of selected climate indices in 49 Polish cities.

2. Materials and Methods
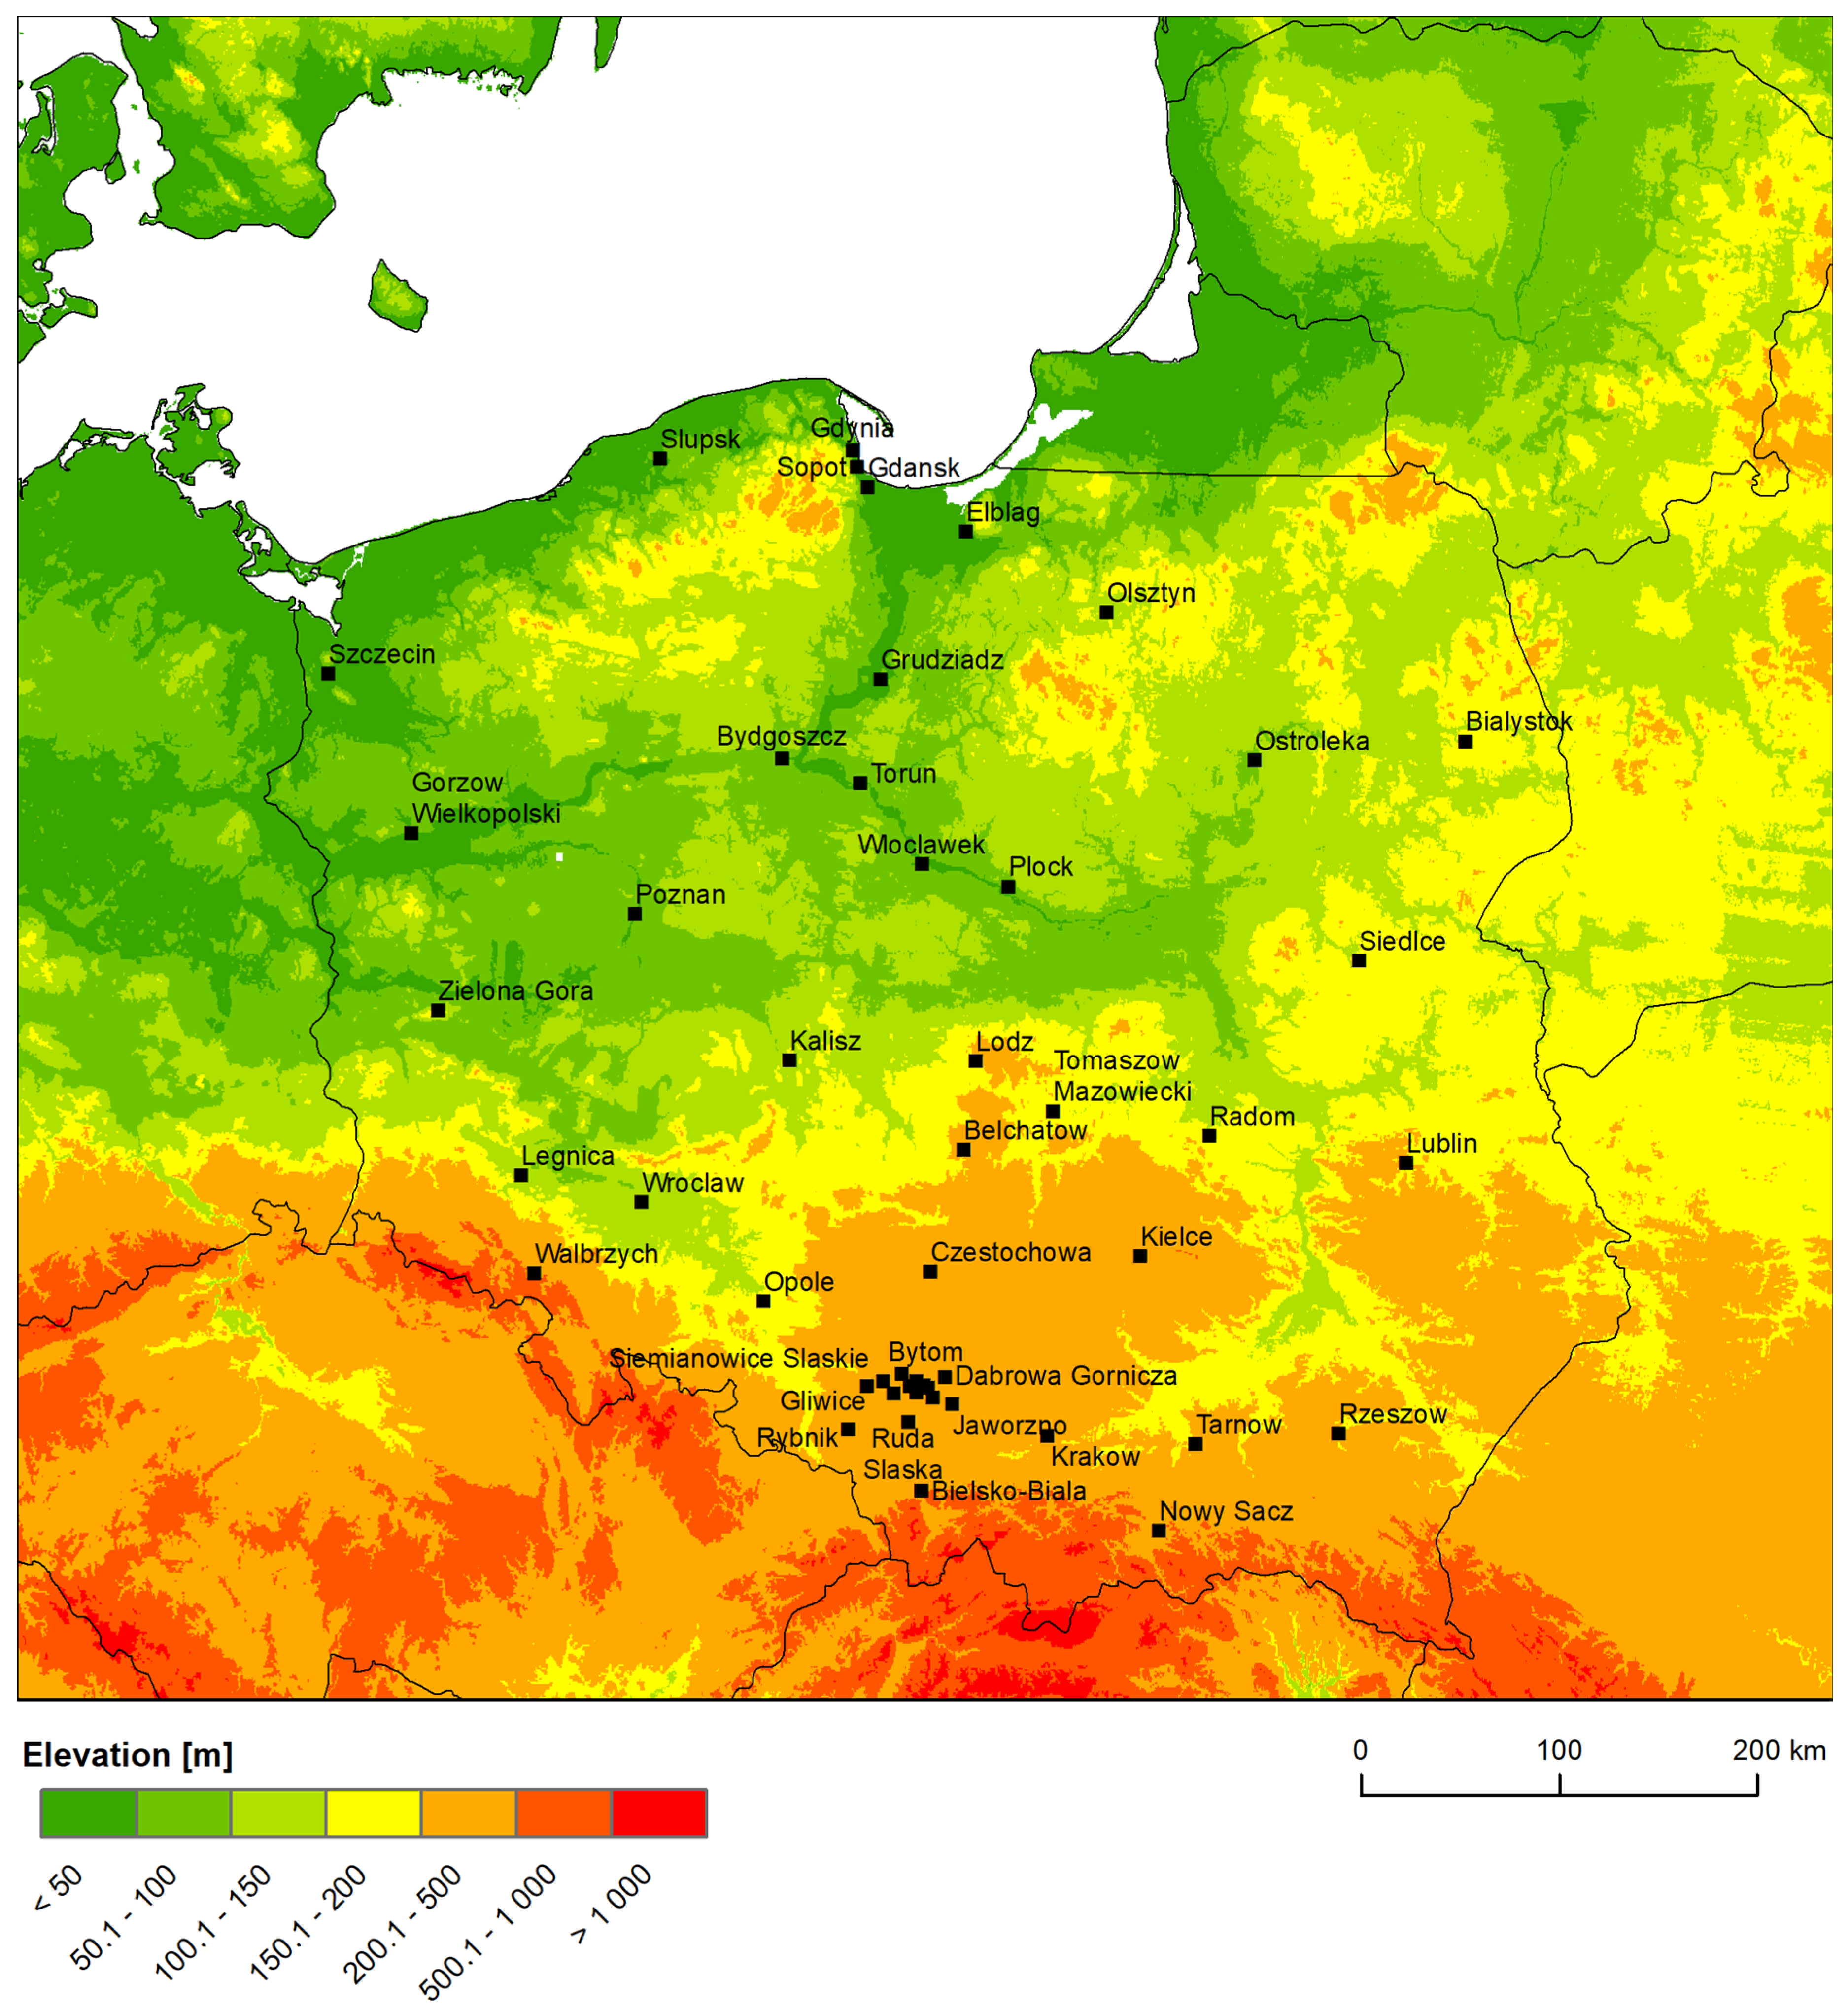
The analysis of climate change covered near-future climate conditions—2030—and future climate conditions—2050. For the current climate conditions, calculations for the 2010 horizon were carried out based on modeling results and observation data. For the 2010 horizon, indices of exposure to climatic factors were calculated to estimate the difference between those currently observed and modeled exposure in the current climate and to assess the tendency of predicted changes in the long term (2006–2055).

2.1. Research Area

Figure 1 presents the topographical map of Poland and the location of cities analyzed in the scope of both projects. Most of Poland’s territory is located in the lowlands. In the south of Poland, there are two chains of mountains and highlands. The continental climate of Eastern Europe influences the eastern part of Poland, while Western Europe is under the influence of maritime air masses from over the Atlantic Ocean. A transitional climate characterizes the center of Poland.
In Table 1, the geographical coordinates of city centers are provided.

2.2. Input Data

The future climate conditions were prepared using the results from climate simulations calculated for the EURO-CORDEX [33] project for climate projections according to the 5th Assessment Report of the Intergovernmental Panel on Climate Change (hereafter AR5 IPCC, https://www.ipcc.ch/report/ar5, access on 12 December 2023). The results of the available simulations of Regional Climate Models for the entire European domain on a regular grid with a resolution of 0.11° (approx. 12.5 km) were used.
Climate model results were evaluated using two potential paths of change in radiative forcing: RCP4.5 and RCP8.5. These scenarios depict the possible trajectories of atmospheric greenhouse gas concentration rates over time and allow us to account for the uncertainty in climate assessments. The full list of models is presented in Table 2.
The observations provided by the Institute of Meteorology and Water Management for the implementation of projects were used as reference data for the current climate. For each observation location and EURO-CORDEX model, a statistical correction was performed using the quantile mapping method to reduce systematic errors. A non-parametric approach of robust empirical quantiles (RQUANT), approximated by the local linear least square regression [34], was chosen. This method was similarly used, e.g., by [35,36,37], as well as in recent studies by [38,39,40]. Model calibration was performed using a 10-year observation dataset between 1 January 2006 and 31 December 2015. The downscaling was performed on mean daily values, significantly reducing EURO-CORDEX biases reported in [41]. These parameters, derived from EURO-CORDEX projections and using statistical downscaling, were compared with statistics computed from observations (Section 3.3).
The following meteorological parameters, observed for the current climate and available modeling results of the entire period until 2055, were used to determine exposure and vulnerability to climate change: the average daily temperature (°C), maximum daily temperature (°C), minimum daily temperature (°C), and total daily precipitation (mm/day).
Table 2. EURO-CORDEX models list. Global Climate Models (GCM) and Regional Climate Models (RCM).
GCM InstitutionGCMRCM InstitutionRCMRCM VersionRealization
Number
CNRM 1, CERFACS 2CNRM-CM5CLMcom 3CCLM4-8-17 [42]v1r1i1p1
CNRM 1, CERFACS 2CNRM-CM5CNRM 1ALADIN53 [43]v1r1i1p1
CNRM 1, CERFACS 2CNRM-CM5RMIB-UGent 4ALARO [44]v1r1i1p1
CNRM 1, CERFACS 2CNRM-CM5SMHI 5RCA4 [45]v1r1i1p1
ICHEC 6EC-EARTHKNMI 7RACMO22E [46]v1r1i1p1
ICHEC 6EC-EARTHDMI 8HIRHAM5 [47]v1r3i1p1
ICHEC 6EC-EARTHCLMcom 3CCLM4-8-17 [48]v1r12i1p1
ICHEC 6EC-EARTHSMHI 5RCA4 [43]v1r12i1p1
IPSL 9IPSL-CM5A-MRIPSL 9-INERIS 10WRF331F [49]v1r1i1p1
IPSL 9IPSL-CM5A-MRSMHI 5RCA4 [45]v1r1i1p1
MPI-M-MPI 11ESM-LRCLMcom 3CCLM4-8-17 [42]v1r1i1p1
MPI-M-MPI 11ESM-LRMPI 11-CSC 12REMO2009 [50]v1r1i1p1
MPI-M-MPI 11ESM-LRMPI 11-CSC 12REMO2009 [50]v1r2i1p1
MPI-M-MPI 11ESM-LRSMHI 5RCA4 [45]v1ar1i1p1
1 National Centre for Meteorological Research—UMR 3589 (http://www.umr-cnrm.fr/); 2 Centre Européen de Recherché et de Formation Avancée en Calcul Scientifique (https://cerfacs.fr/); 3 Climate Limited-area Modelling Community (https://clmcom.scrollhelp.site/clm-community/); 4 Royal Meteorological Institute of Belgium and Ghent University (https://www.meteo.be/en/belgium; https://www.ugent.be/en); 5 Swedish Meteorological and Hydrological Institute (https://www.smhi.se/en/q/Stockholm/2673730); 6 Irish Center for High-end Computing (https://www.ichec.ie/); 7 The Royal Netherlands Meteorological Institute (https://www.knmi.nl/); 8 Danish Meteorological Institute (http://ocean.dmi.dk/); 9 The Institut Pierre Simon Laplace (https://cmc.ipsl.fr/); 10 The French National Institute for Industrial Environment and Risks (https://www.ineris.fr/); 11 Max-Planck-Institut für Meteorologie (https://mpimet.mpg.de/startseite); 12 Computational Methods in Systems and Control Theory (https://www.mpi-magdeburg.mpg.de/csc).
Statistically downscaled data of the EURO-CORDEX model ensemble were used to calculate the climate indices for the analyzed horizons. Subsequently, the values of the indices were averaged for 10-year periods: for current climate conditions from 2006 to 2015, for near future conditions from 2026 to 2035, and for future climate conditions from 2046 to 2055.
The average values of climate indices were calculated for each of the 49 cities using the ensemble mean from two Representative Concentration Pathway scenarios.

2.3. Climate Indices

In total, seven climate indices (https://www.climdex.org, access on 12 December 2023) were analyzed, including four describing thermal conditions and three describing precipitation as follows:
  • The annual average temperature.
  • The number of hot days per year is calculated as the sum of all days in a selected year with a maximum daily temperature above 30 °C.
  • The number of frost days per year is calculated as the sum of all days in a selected year with a minimum daily temperature below 0 °C.
  • The number of cold days per year is calculated as the sum of all days with a maximum daily temperature lower than 0 °C in the selected year.
  • The annual sum of precipitation.
  • The number of days with precipitation is calculated as the sum of days in a year with a daily sum exceeding 1 mm.
  • The number of days with extreme precipitation is calculated as the number of days in the selected year with a daily sum of precipitation exceeding 10 mm.

3. Results and Discussion

The spatial variability of the selected temperature and precipitation indices was analyzed for 49 cities. The percentage change for the 2030 and 2050 horizons was calculated for RCP4.5 and RCP8.5 scenarios relative to the 2010 horizon (with the average for 2006–2015) using the statistical downscaling of the EURO-CORDEX model ensemble.
Section 3.1 and Section 3.2 show the spatial distribution for the relative changes in the analyzed parameters. Section 3.3. provides information on the trends of the absolute values and compares the current climate decade with the observations.

3.1. Temperature Indices

The spatial distribution of changes in the annual average temperature, the number of hot days, the number of frost days, and the number of cold days were analyzed.

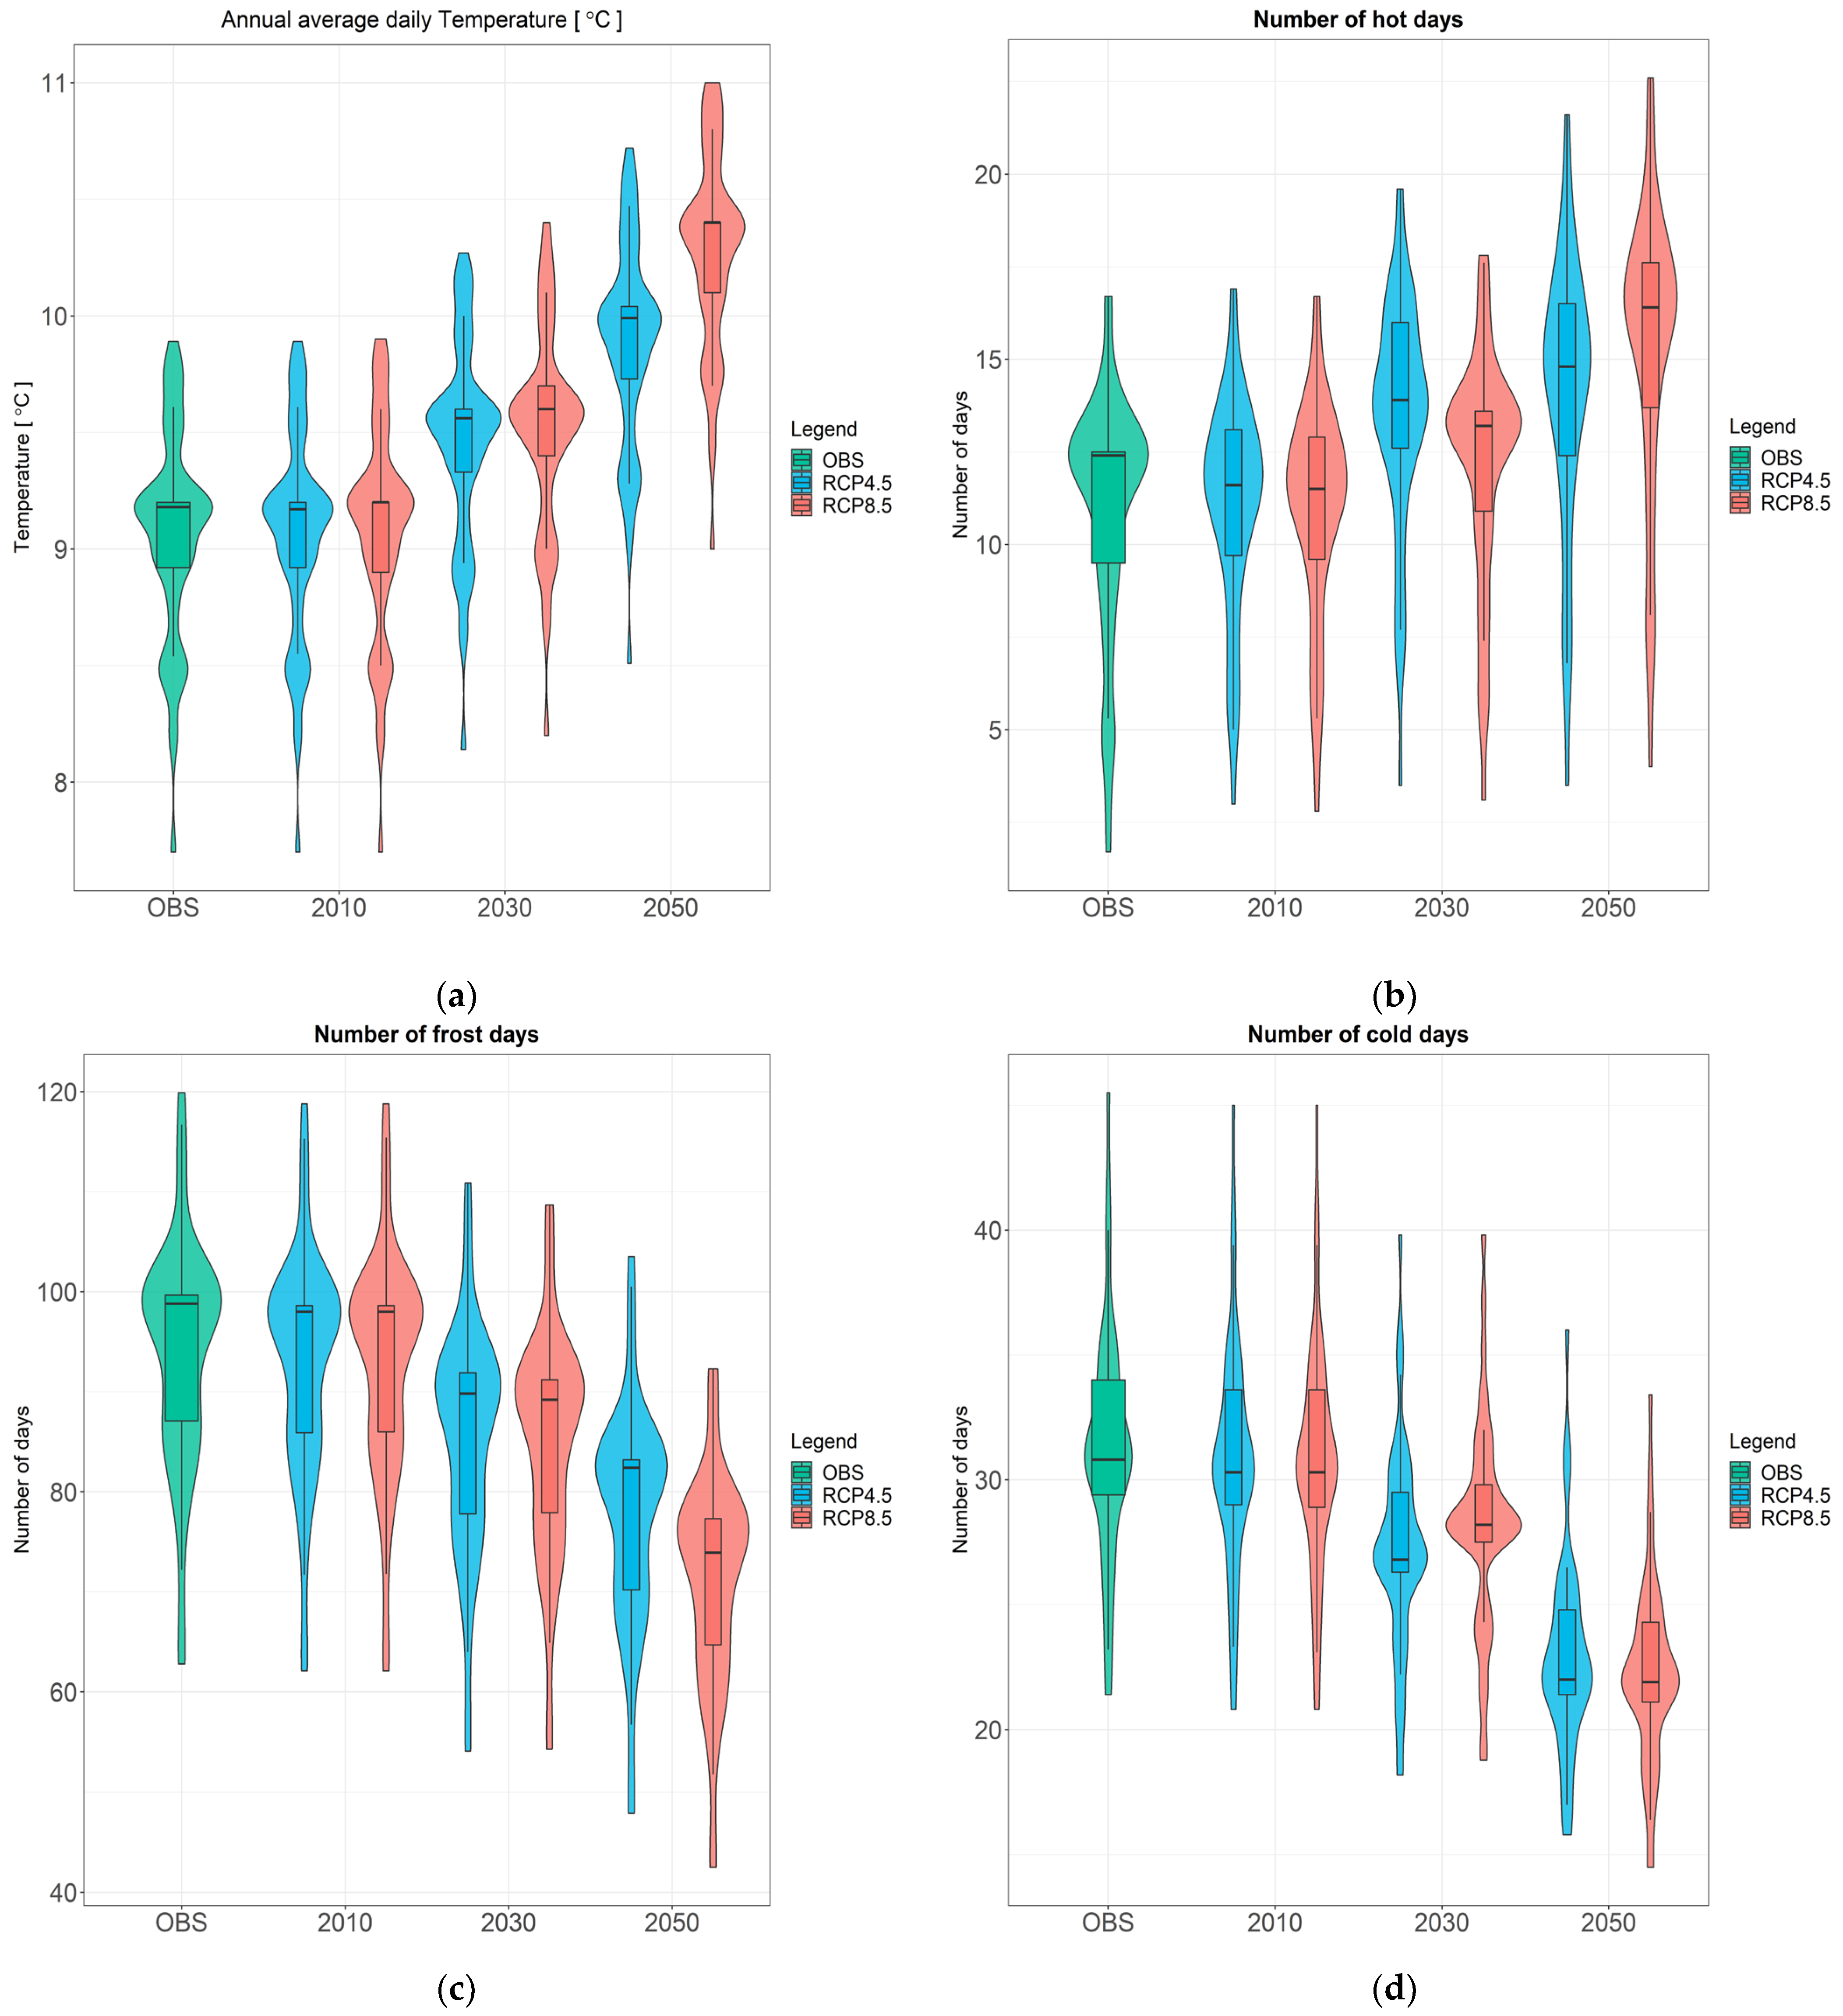
3.1.1. Annual Average Temperature

The average annual temperature shows an increasing trend for the entire country (Figure 2). In the RCP4.5 scenario, for the 2030 horizon, the increase is less than 5% (0.40 °C) compared to 2010 in most parts of the country. The exception is the northeastern part, where the changes range from 5% to 8% (0.45 °C). For the 2050 horizon, the increase in most of the country is expected to be between 8% and 10% (0.82 °C) and between 10% and 12% (0.83 °C) in the northeastern part.
In the RCP8.5 scenario for the 2030 horizon, in the south, the country’s warmest region, the annual average temperature increase is the lowest and does not exceed 5% (0.39 °C). In the remaining area, the change is expected to be from 5% to 8% (0.41 °C) relative to 2010. For the 2050 horizon, the average annual temperature increase in most locations exceeds 12% (0.82 °C), corresponding to 2010.

3.1.2. Number of Hot Days (Tmax > 30 °C)

For the RCP4.5 scenario, the number of hot days in the north of Poland is projected to increase by 30% to 40% (1.9 days) in the 2030 horizon. (Figure 3). In the central part of the country, the projected increase is 20% to 30% (2.8 days), and in the southern part—10% to 20% (2.14 days). In the 2050 horizon, the number of hot days in most cities is expected to increase by 20% to 30% (3.0 days). Moreover, in some cities in the north and the south of the country, an increase of 30% to 40% (1.9 days) is expected.
In the RCP8.5 scenario, in the 2030 horizon, the projected changes in the value are slightly lower than in the RCP4.5 scenario. In this scenario, an increase from 5% to 10% (1.2 days) compared to 2010 is dominant. Also, there are individual cases of cities in the southwest and northeast where the rate of increase is higher, ranging from 10% to 20% (1.79 days). In the RCP8.5 scenario for the 2050 horizon, a significant increase higher than 30% (4.4 days) in the number of hot days is projected over the entire country.

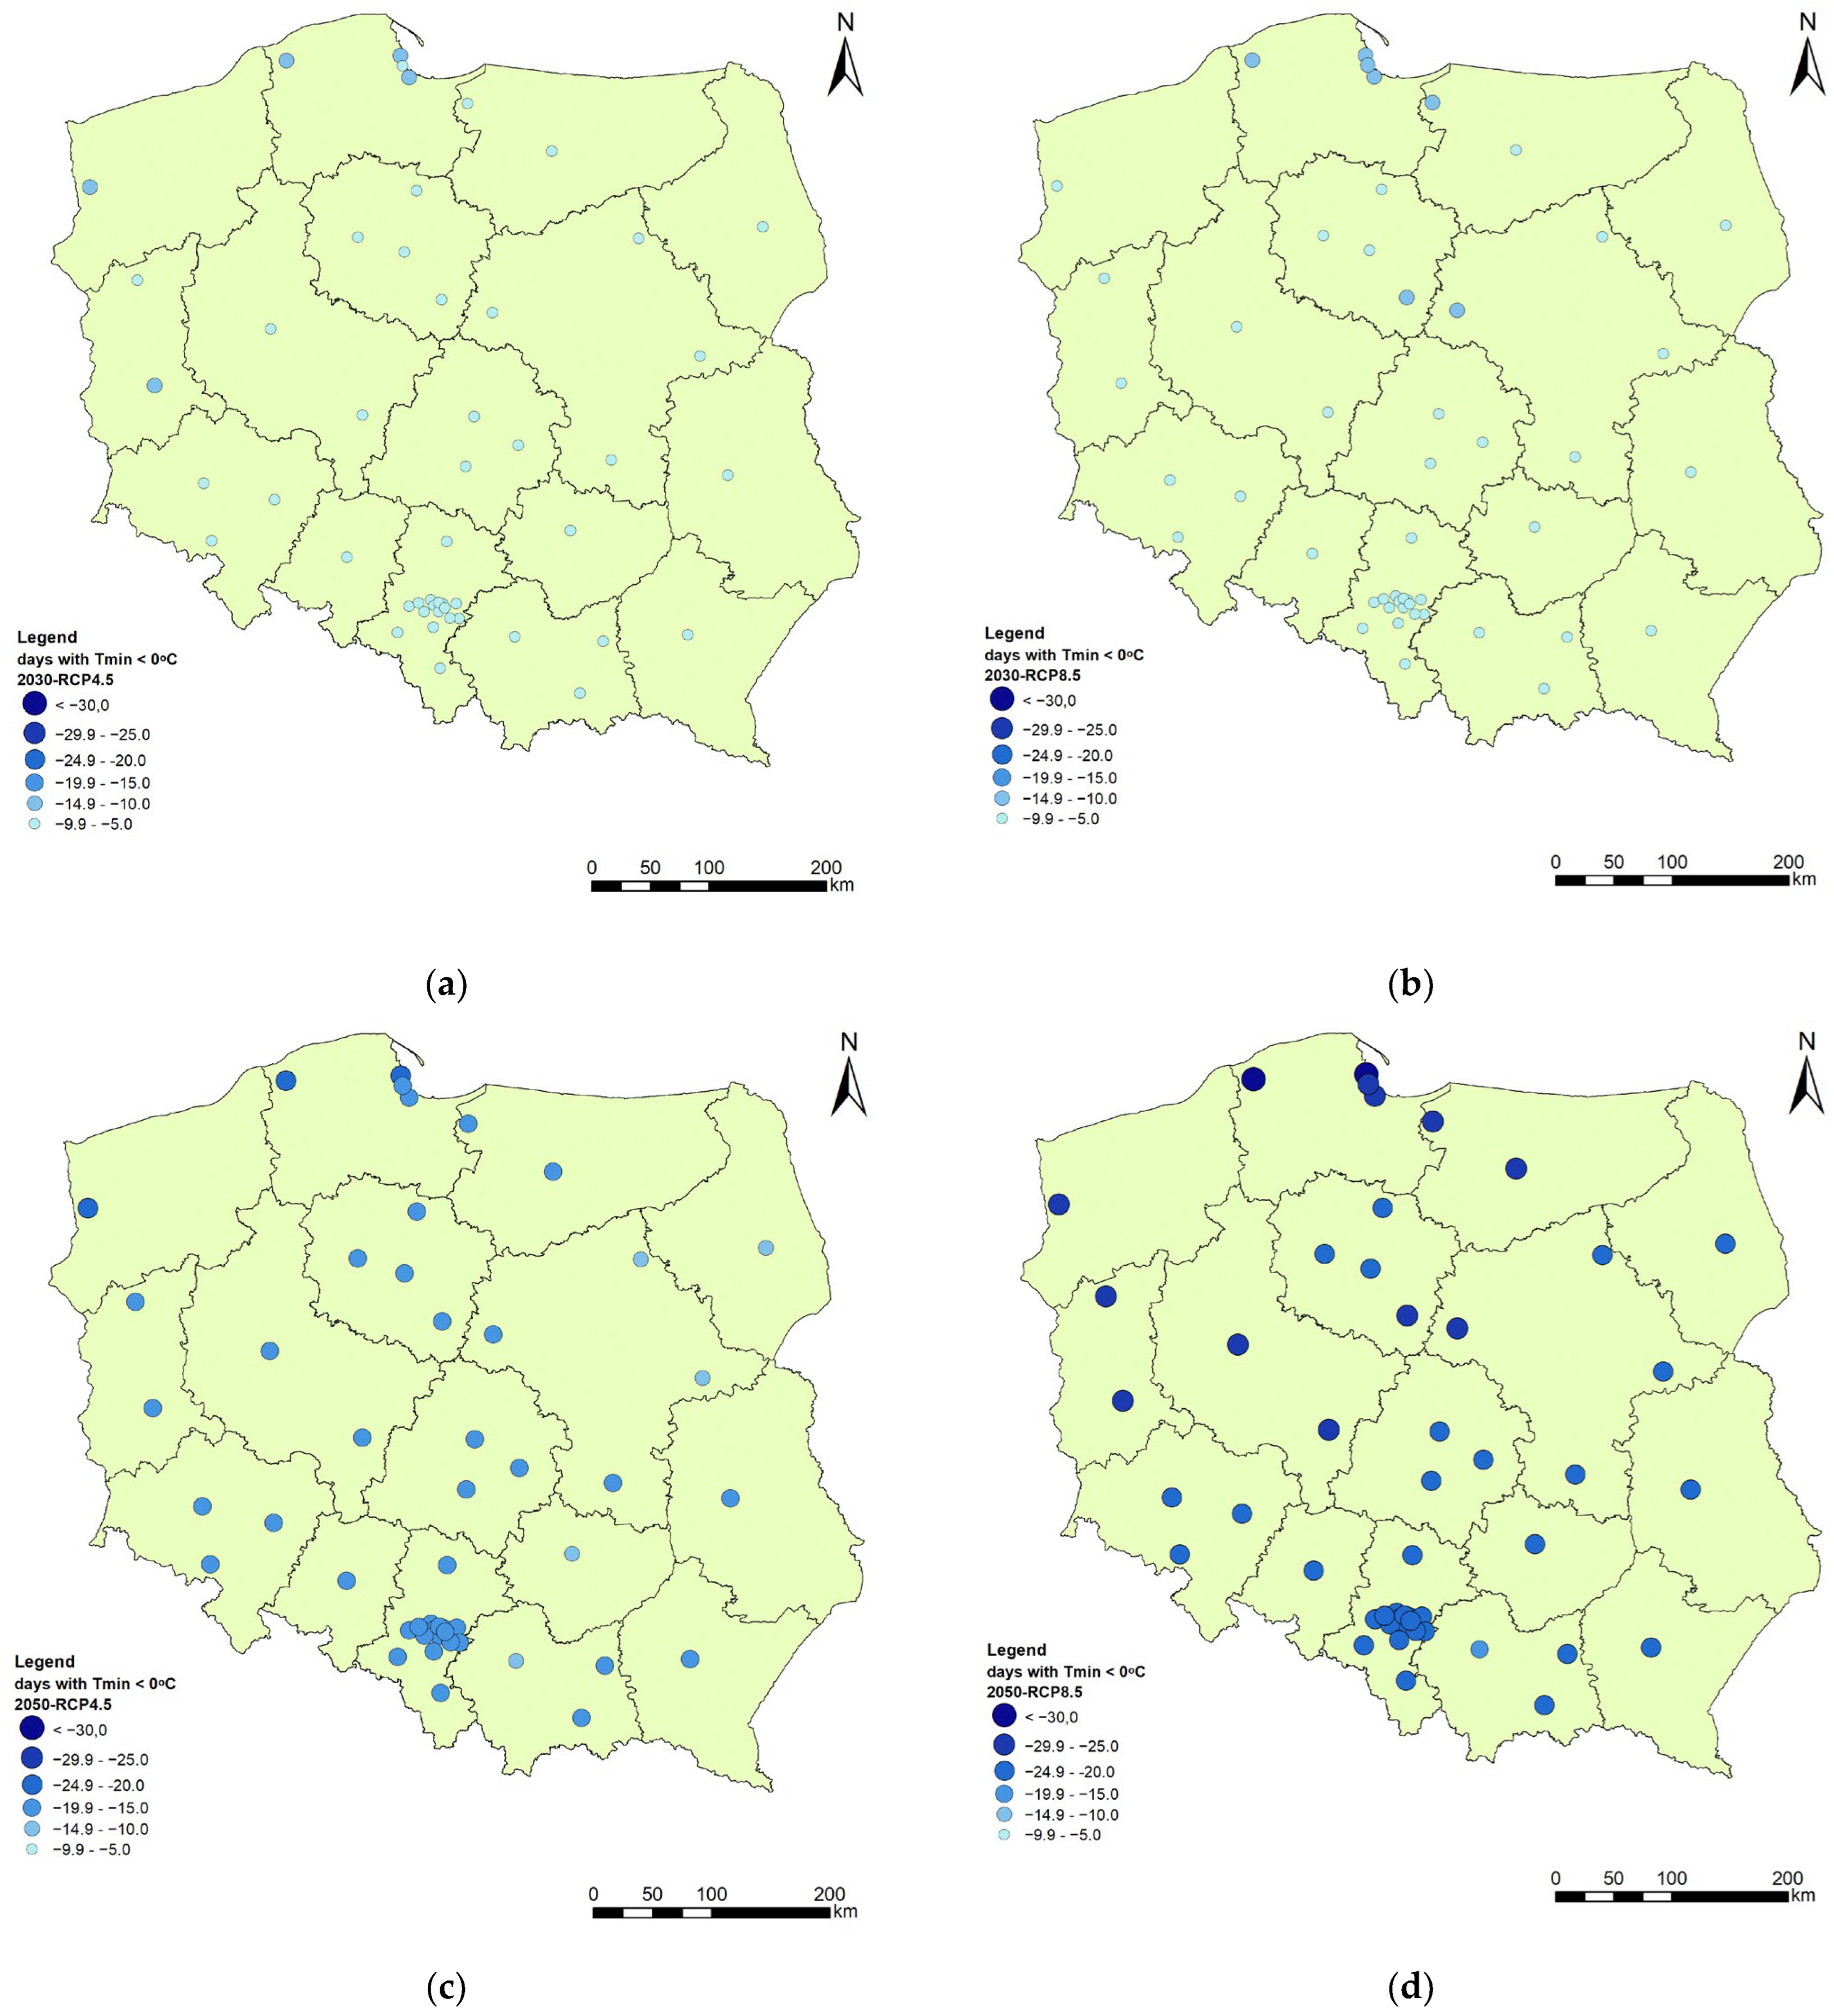
3.1.3. Number of Frost Days (Tmin < 0 °C)

A decrease in the number of frost days is visible in both RCP scenarios (Figure 4). For the 2030 horizon, very similar results were obtained in most regions of Poland, with the decrease not exceeding 9% (7.5 days) for both scenarios. A slightly larger decrease, between 5% and 10%, is expected in the country’s north. In the 2050 horizon, in RCP4.5, a 15% to 20% (15.3 days) decrease in the number of frost days is projected (except in the country’s northeastern regions). A slightly higher 20% to 25% (21.9 days) decrease for the RCP8.5 is also calculated.

3.1.4. Number of Cold Days (Tmax < 0 °C)

The number of cold days appears to be decreasing similarly for both scenarios (Figure 5). For the 2030 horizon, the reduction is from 10% to 15% (3.6 days) in RCP4.5 in most of Poland. In the RCP8.5 scenario, it is less than or equal to 10% (2.7 days). The largest decrease in this scenario occurs in the northeast of the country. In the 2050 horizon, there is a further reduction of 20% to 25% in the number of cold days for most locations compared to 2010.

3.2. Precipitation Indices

An analysis was performed on the annual precipitation, the number of days with precipitation per year, and the number of days with extreme rainfall above 10 mm/day.

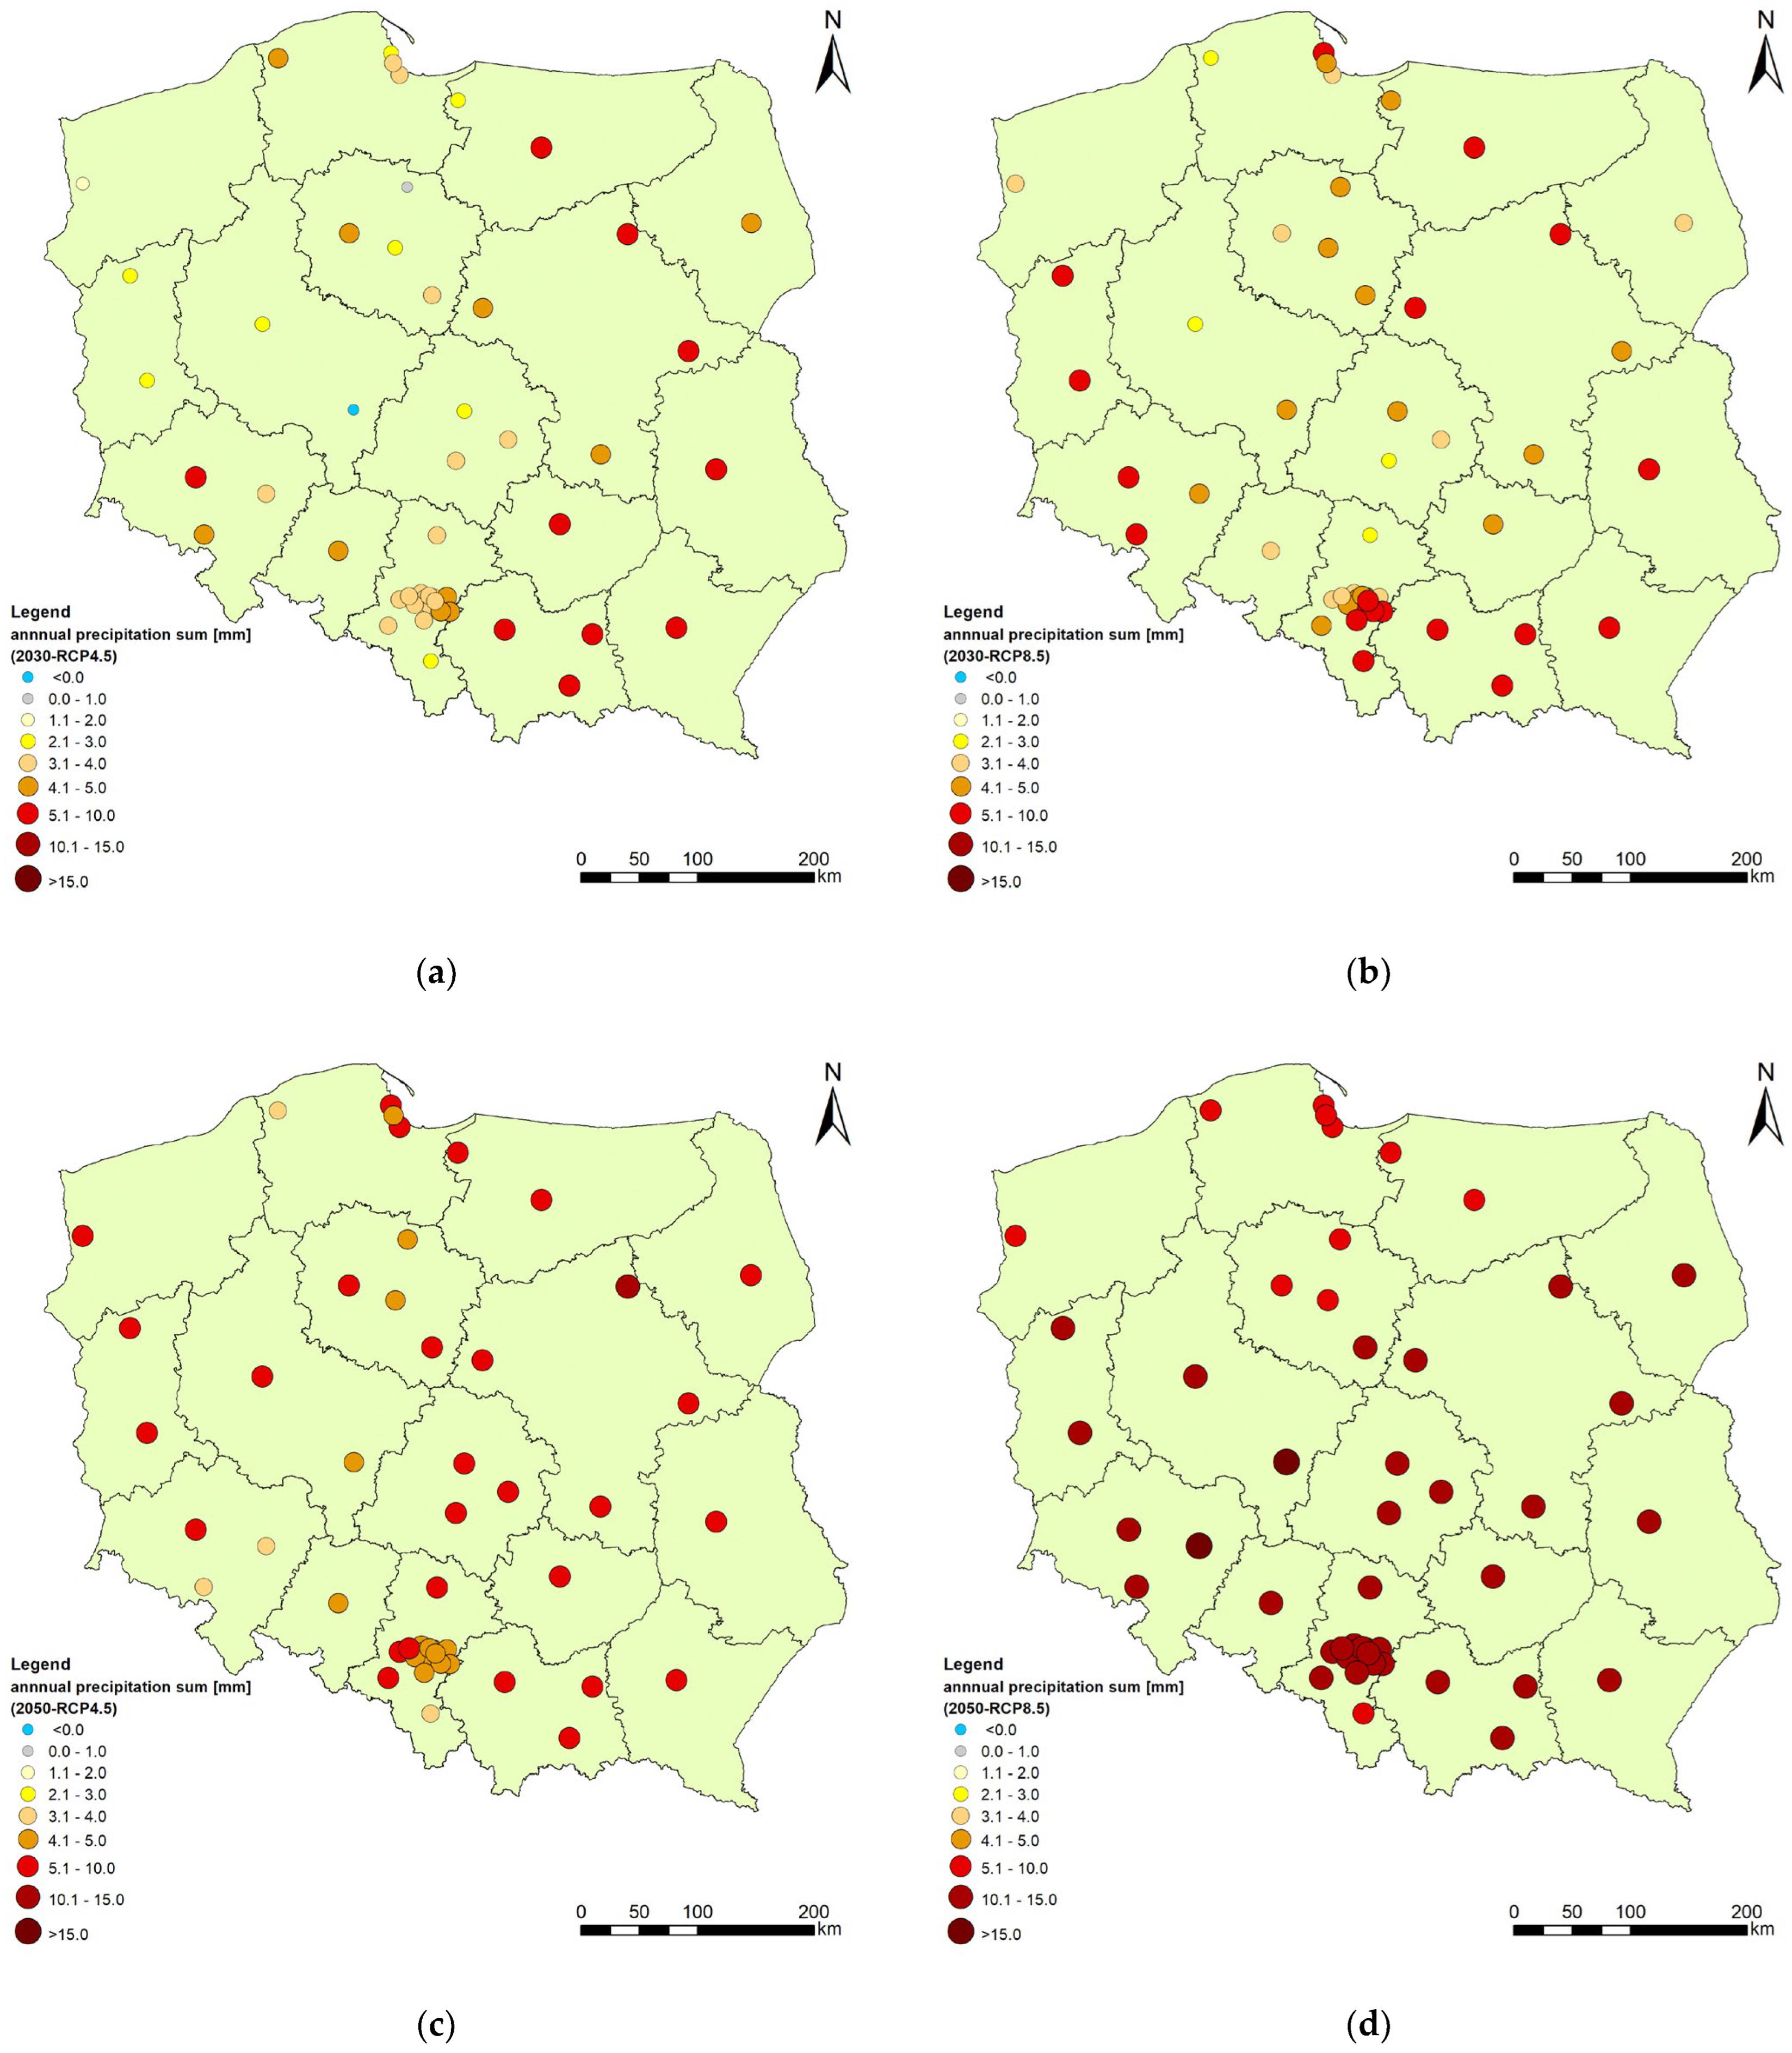
3.2.1. Total Annual Precipitation

The analyses of the variability of the total annual precipitation for the RCP4.5 scenario in the horizon until 2030 show an increase in the value of the index for cities located in the eastern part of Poland by 5–10% (43 mm) (Figure 6). In the southern and central parts of the country, these increases are smaller and reach a maximum of 5% (23 mm). The smallest increase is expected in locations in the western part of the country—below 3% (15 mm). In the 2050 horizon, increases of between 5% and 10% (45 mm) are expected in most locations in the country. Smaller changes are expected in the central and southern parts of the country, where the values of this indicator do not exceed 5% (32 mm) of the base value for 2010.
In the RCP8.5 scenario for the 2030 horizon, the most significant changes in the value of this indicator are expected, especially in the western and southern parts of Poland, where the rates of increase range are expected to be from 5% to 10% (42 mm). For the central and northern parts of the country, smaller increases in annual precipitation are expected, up to 5% (28 mm) compared to 2010. In the 2050 horizon, the forecasts for the entire country are high. In most cities, simulations show an increase in the indicator value equal to between 10% and 15% (76 mm). This increase in the country’s southwestern part is also expected to be greater than 15% (88 mm). The smallest increase is expected for the northern and northwestern parts of the country, where it is expected to increase by a maximum of 10% (44 mm) compared to the base year.

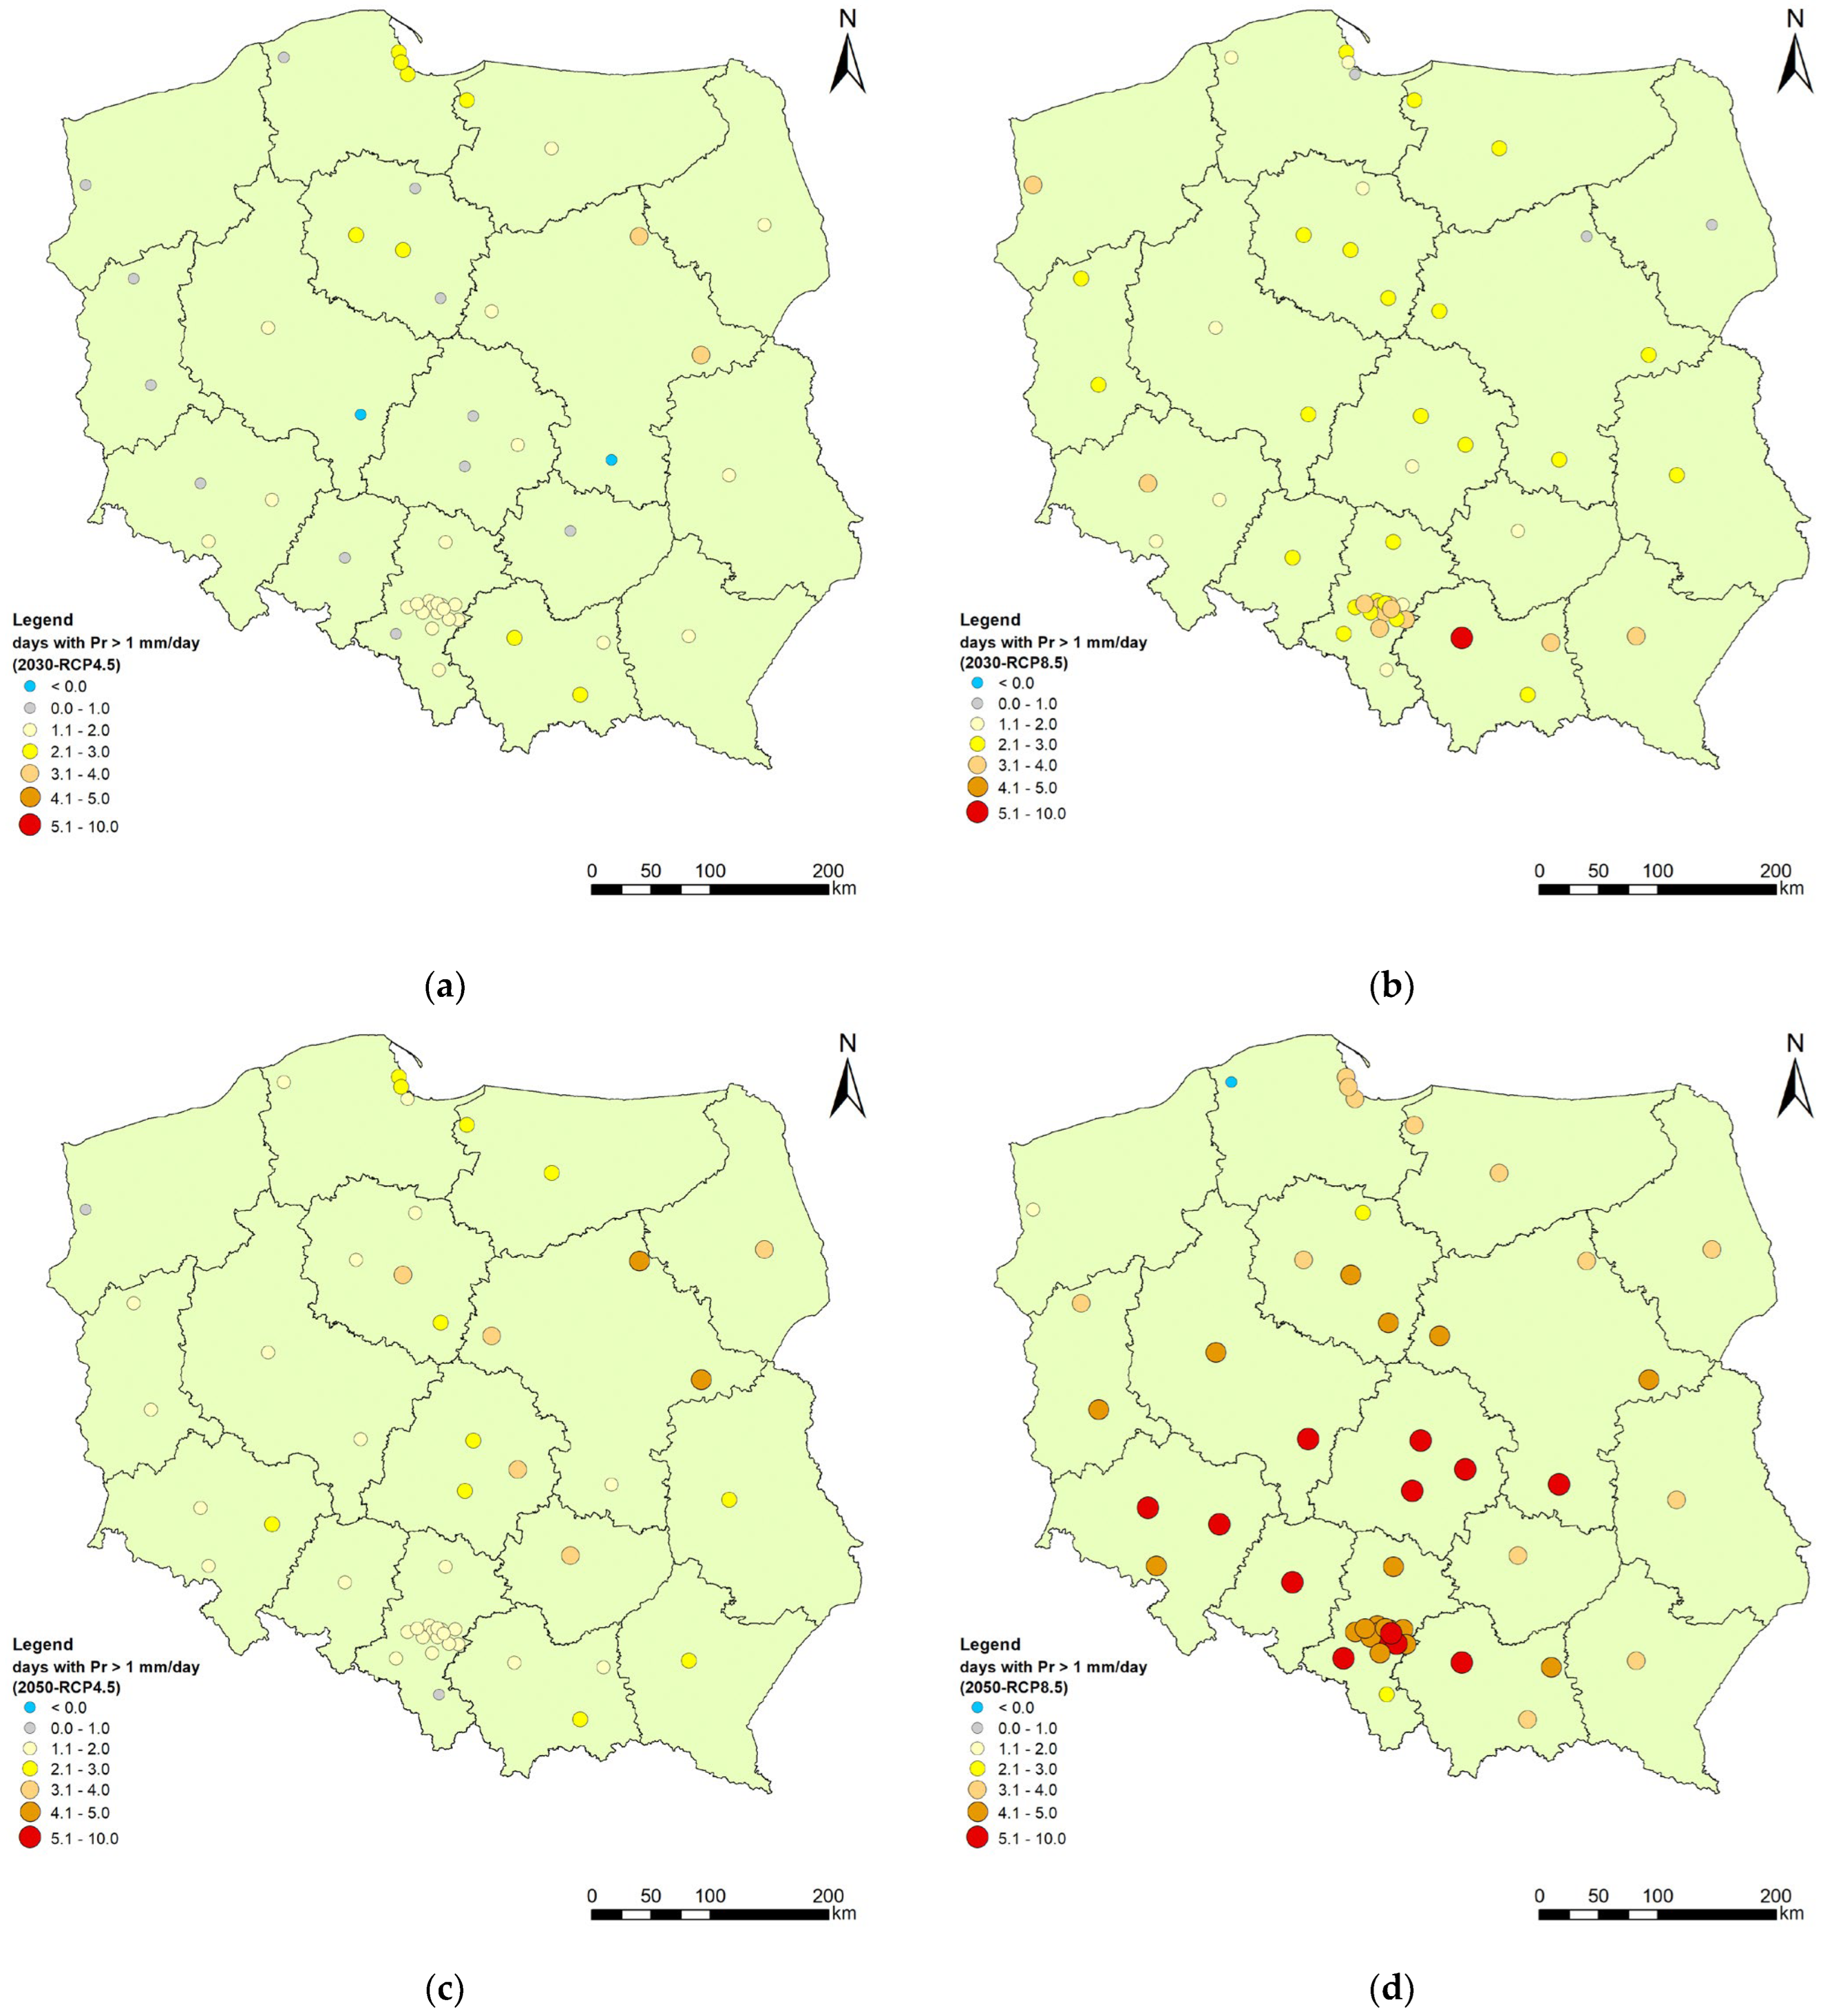
3.2.2. Number of Days with Precipitation

The largest change in the number of days with precipitation in the RCP4.5 scenario for the 2030 horizon is expected in the northern and eastern parts of the country (Figure 7). The modeling results show an increase of 2% to 3% (2.2 days) in cities located in Pomerania and 3% to 4% (2 mm) in the eastern part of the Mazowieckie Voivodship. A 2% to 3% (2.2 days) increase is also predicted for cities in the Małopolska region. In the rest of the country, the changes are minor and do not exceed 2% (1.5 days) compared to the base year. In some cities in central Poland, a slight decrease in the number of days with precipitation is expected. The situation for the 2050 horizon is similar, with the highest increase in cities located in the northeastern part of the country, where the increase in the value relative to 2010 reaches 5% (4 days). An increase of up to 4% (2.9 days) is observed in the central part of the country, which indicates the value of changes in relation to the 2030 horizon. As for the 2030 horizon, the smallest changes are expected in the southern and western parts of the country.
In the RCP8.5 scenario, these changes are more substantial. In the 2030 horizon, the largest changes are observed in the southern part of Poland, where the increase in the indicator value reaches 4% (3.6 days) and, in the case of Małopolska (Kraków), as much as 10% is expected (5.3 days). It is not predicted to exceed 3% (2.5 days) in the rest of the country. In the 2050 horizon, the largest growth is forecast in the central and southern parts of the country. The increase in value in these regions is up to 10% (5.6 days) compared to the base year. The smallest changes are expected to occur in the north and northwest of Poland.

3.2.3. Number of Days with Extreme Precipitation (PR > 10 mm/day)

The largest increase in the number of days with extreme precipitation of >10 mm/day in the RCP 4.5 scenario is expected to take place in the eastern and southern parts of Poland (Figure 8). These simulations show increases from 5% to 10% (1.3 days) of the index value, and in the easternmost cities (Rzeszów and Lublin), even above 15% (2.1 days) compared to the value for 2010. The smallest changes are expected to occur in the central and western parts of the country. In the time horizon until 2050, the changes are expected to be greater, with an increase in value from 10% to 15% (2.2 days) compared to 2010, observed practically all over Poland.
In the RCP 8.5 scenario, for the time horizon until 2030, the largest growth is expected in the country’s central, northern, and southeastern parts. A similar increase is forecasted for four cities in the western part of the country. The number of days with extreme precipitation is expected to increase by 5% to 10% (1.3 days) compared to 2010. Smaller increases are forecast for the southwestern and northeastern parts of the country. In the time horizon until 2050, the increase in the number of days with extreme precipitation across the country is predicted to exceed 15% (2.7 days) compared to the 2010 baseline value. The smallest increase is observed in the country’s southeastern part, which is between 10% and 15% (1.8 days) compared to the base year.

3.3. Evaluation and Trends

The variability in absolute values of the analyzed parameters for 49 cities is shown on violin plots representing the distribution. The violin plots depict the probability density of the data at different values, showing the shape of the distribution. The period for the climate horizon 2010 was averaged for 2006–2015. Predictions for future horizons were calculated using a similar approach, presenting the average value for all locations with violin plots representing the distribution of the selected quartiles. The time spans for the predictions were as follows: the average for 2026–2035 represented the horizon for 2030, and the average for 2046–2055 represented the horizon for 2050. The ensemble models employed in this study were statistically corrected using a quantile mapping approach, with observations from weather stations recorded between 2006 and 2015. Significant trends related to changes over the coming decades were observed for most of the analyzed parameters.
In the case of the average annual temperature, the range of variation in the observations, the results of the models, and the average values for 2010 are in good agreement (Figure 9). In both scenarios, an increase in the annual average temperature is observed. In the 2030 horizon, the projected values are similar and equal to 9.5 °C on average. Further growth is predicted for 2050, from an average of 10.0 °C in the RCP4.5 to 10.4 °C in the RCP8.5. A similar increase of about 1 °C for the RCP8.5 scenario until 2050 has been shown by is also shown in [51].
An increase in the number of hot days is predicted as a direct consequence of the maximum daily temperature increase in all of Central Europe, shown, e.g., in [52,53,54] or in the recent work of [55]. However, these scenarios show different dynamics (Figure 9). In RCP4.5, there is a significant increase from 11.5 to 13.9 days on average in the 2030 horizon and stabilization with a slight upward trend in the 2050 horizon (14.8 days on average). In RCP8.5, the growth in the 2030 horizon is smaller (13.4 days on average), while in the 2050 horizon, it shows much larger values—16.4 days on average.
The number of frost days in the current climate conditions (horizon 2010) for the observation and model is similar. The differences between RCP scenarios represented by the violin plot range do not exceed one day (Figure 9). The average observation for all cities is 98 days compared to 97 days for the modeled value. The projected trends in both scenarios are very similar for the 2030 horizon. They are expected to decrease to 90 days in RCP4.5 and 89 days in RCP8.5. A more significant disparity between the trends is predicted in the next time horizon (2050). In the RCP4.5 scenario, a further decrease is predicted, with an average of 83 days. In the RCP8.5 scenario, a more significant decrease is predicted, reaching 74 days (Figure 9).
In terms of the number of cold days, the range of variability in the observations and the results of the models’ ensemble in the current climate conditions (2010) are similar (Figure 9). The average value for the models’ ensemble is 30.5 days compared to the average value of 31 days for the observations. In the first time horizon, until 2030, a substantial decrease is predicted in both emission scenarios. The decrease in the RCP4.5 scenario is more dynamic (falling to 27 days) compared to 28 days in the RCP8.5 scenario. In the 2050 horizon, a further decrease is predicted in both scenarios, down to 22.4 days. The average trend line in scenario RCP8.5 for all cities suggests more dynamic droop than in scenario RCP4.5.
The average values for cities, for the annual sum of precipitation in the current climate, in both ensemble models and observations are very similar, reaching roughly 627 mm. Also, regarding the variability by cities, represented by the violin plot range, the disparity between the observations and model ensemble is small, occurring during the 3rd quartile, for about 10 mm. In both scenarios, trend lines for the 2030 horizon suggest an increase in the precipitation sum, with the RCP4.5 scenario being more dynamic. This increase is predicted to be roughly 674 mm. Substantial differences are predicted for the 2050 horizon, where scenario RCP8.5 tends to be more dynamic than RCP4.5. The average value for all cities in the RCP8.5 is about 700 mm compared to 680 mm in the RCP4.5 scenario.
Small differences between the models’ ensemble and observations in the current climate (2010) are visible regarding the number of days with precipitation. For these observations, the average value for the cities is 105.5 days compared with 105 days for the models (Figure 10). The spread of the values for observations ranges from 96 to 111.5 days. Both scenarios predict a slight increase in the future climate, with a more dynamic trend in the RCP8.5 scenario. In the next horizon, a further increase is predicted for both scenarios by approximately 2.5 days.
The number of days with extreme precipitation exceeding 10 mm per day for the current climate ranges from 13.7 days for the 1st quartile to 16.8 for the 3rd quartile of observations. Model ensembles for the analyzed emission scenarios, in terms of spread values, are quite similar, with differences at approx. 0.05 days (Figure 10). For the horizon of 2030, an identical increase is expected for both scenarios. A small difference in terms of disparity by location is also expected. An average increase of up to 16.3 days is predicted for all cities. In the second time horizon to the year 2050, a more dynamic increase is expected for scenario RCP8.5 up to approx. 18.5 days, compared to a smaller increase in scenario RCP4.5 for up to approx. 17.4 days.

4. Conclusions

The analysis of the climate indices for 49 cities makes it possible to formulate several general conclusions in relation to the predicted changes in temperature and precipitation in Poland by 2050:
  • The country’s average annual temperature shows an upward tendency. A slightly higher temperature increase is expected to occur in northeast Poland. The temperature increase by 2050 is expected to be equal to approx. 1 °C (0.83 in RCP 4.5 and 1.2 in RCP 8.5).
  • The number of hot days is expected to increase, with the most significant increase in the country’s north. On average, the number of hot days could increase by 3.7 days (3.0 in RCP 4.5 and 4.4 in RCP 8.5).
  • In both scenarios, the decrease in the number of frost days is slightly higher in the country’s north. By 2050, the number of frost days could decrease by around 19 (15.3 in RCP 4.5 and 21.9 in RCP 8.5).
  • The number of cold days is expected to decrease throughout the country. The most significant decrease in this scenario occurs in the country’s northeast. The number of cold days in the 2050 horizon could decrease on average by around 8 days (8 in RCP 4.5 and 8.6 in RCP 8.5) compared to 2010.
  • The annual precipitation increases mainly in cities in the eastern part of Poland. The smallest increase is expected in locations in the western part of the country, where it could be below 5%. By 2050, the annual precipitation is expected to increase by an average of 40 mm in RCP 4.5 to 80 mm in RCP 8.5.
  • A slight increase, by approx. 3.3 days (2.1 in RCP 4.5 and 4.5 in RCP 8.5) is the total number of days with precipitation expected.
  • Both RCP scenarios predict an increase in the number of days with extreme precipitation, mainly in eastern Poland, for approximately 2 days (1.4 in RCP 4.5 and 2.7 in RCP 8.5).
An increase in the average annual temperature results in an increase in the number of hot days and a decrease in the number of cold days. As a result of the rising temperatures in the cold season, the number of frosty days is expected to decrease. The most significant changes, both in summer and winter, occur in the northeast of Poland. The increase in annual precipitation is due to the increase in the number of extreme precipitation days. The total number of days with precipitation could increase slightly. The changes in precipitation are expected to be the smallest in the western part of the country.

Author Contributions

Conceptualization, J.S. and J.W.K.; Data curation, M.J.; Formal analysis, M.J.; Funding acquisition, J.S.; Investigation, M.J. and J.S.; Methodology, M.J. and J.S.; Project administration, J.S.; Resources, M.J., J.S. and J.W.K.; Software, M.J.; Supervision, J.W.K.; Validation, M.J.; Visualization, M.J.; Writing—original draft, J.S.; Writing—review and editing, M.J. and J.W.K. All authors have read and agreed to the published version of the manuscript.

Funding

This research was a part of the MPA44 project funded in the scope of the Cohesion Fund, Operational Programme Infrastructure and Environment 2014–2020.

Institutional Review Board Statement

Not applicable.

Informed Consent Statement

Not applicable.

Data Availability Statement

The data presented in this study are available on request from the corresponding author. The data are not publicly available due to privacy.

Acknowledgments

The analyses were accomplished in the frame of two projects: ClimCities (“Climate change adaptation in small and medium size Cities”) and MPA (“Developing climate change adaptation plans for cities with more than 100,000 inhabitants”, http://44mpa.pl/). We acknowledge EURO-CORDEX initiative for providing the climate simulations. We thank the climate modeling groups for producing and making their model output available.

Conflicts of Interest

The authors declare no conflict of interest.

References

  1. Dickinson, R.E.; Errico, R.M.; Giorgi, F.; Bates, G.T. A regional climate model for the western United States. Clim. Chang. 1989, 15, 383–422. [Google Scholar] [CrossRef]
  2. Giorgi, F.; Bates, G.T. The climatological skill of a regional model over complex terrain. Mon. Weather Rev. 1989, 117, 2325–2347. [Google Scholar] [CrossRef]
  3. Giorgi, F. Simulation of regional climate using a limited area model nested in a general circulation model. J. Clim. 1990, 3, 941–963. [Google Scholar] [CrossRef]
  4. Kida, H.; Koide, T.; Sasaki, H.; Chiba, M. A new approach for coupling a limited area model to a GCM for regional climate simulations. J. Meteorol. Soc. Jpn. Ser. II 1991, 69, 723–728. [Google Scholar] [CrossRef]
  5. UNPD (United Nations, Department of Economic and Social Affairs, Population Division). World Urbanization Prospects: The 2018 Revision, Online Edition. Available online: https://population.un.org/wup/Download/Files/WUP2018-F02-Proportion_Urban.xls (accessed on 12 December 2023).
  6. Abarca-Alvarez, F.J.; Navarro-Ligero, M.L.; Valenzuela-Montes, L.M.; Campos-Sánchez, F.S. European strategies for adaptation to climate change with the mayors adapt initiative by self-organizing maps. Appl. Sci. 2019, 9, 3859. [Google Scholar] [CrossRef]
  7. IPCC. Climate Change 2013: The Physical Science Basis. Contribution of Working Group I to the Fifth Assessment Report of the Intergovernmental Panel on Climate Change; Stocker, T.F., Qin, D., Plattner, G.-K., Tignor, M., Allen, S.K., Boschung, J., Nauels, A., Xia, Y., Bex, V., Midgley, P.M., Eds.; Cambridge University Press: Cambridge, UK; New York, NY, USA, 2013; 1535p. [Google Scholar] [CrossRef]
  8. IPCC. Climate Change 2021: The Physical Science Basis. Contribution of Working Group I to the Sixth Assessment Report of the Intergovernmental Panel on Climate Change; Masson-Delmotte, V., Zhai, P., Pirani, A., Connors, S.L., Péan, C., Berger, S., Caud, N., Chen, Y., Goldfarb, L., Gomis, M.I., et al., Eds.; Cambridge University Press: Cambridge, UK; New York, NY, USA, 2021; in press. [Google Scholar] [CrossRef]
  9. Meehl, G.A.; Tebaldi, C. More intense, more frequent, and longer lasting heat waves in the 21st century. Science 2004, 305, 994–997. [Google Scholar] [CrossRef]
  10. Schär, C.; Vidale, P.L.; Lüthi, D.; Frei, C.; Häberli, C.; Liniger, M.A.; Appenzeller, C. The role of increasing temperature variability in European summer heatwaves. Nature 2004, 427, 332–336. [Google Scholar] [CrossRef]
  11. Koffi, B.; Koffi, E. Heat waves across Europe by the end of the 21st century: Multiregional climate simulations. Clim. Res. 2008, 36, 153–168. [Google Scholar] [CrossRef]
  12. Madsen, H.; Lawrence, D.; Lang, M.; Martinkova, M.; Kjeldsen, T.R. Review of trend analysis and climate change projections of extreme precipitation and floods in Europe. J. Hydrol. 2014, 519, 3634–3650. [Google Scholar] [CrossRef]
  13. Kundzewicz, Z.W.; Ulbrich, U.; Graczyk, D.; Krüger, A.; Leckebusch, G.C.; Menzel, L.; Pińskwar, I.; Radziejewski, M.; Szwed, M. Summer floods in Central Europe–climate change track? Nat. Hazards 2005, 36, 165–189. [Google Scholar] [CrossRef]
  14. Kundzewicz, Z.W.; Radziejewski, M.; Pinskwar, I. Precipitation Extremes in the Changing Climate of Europe. Clim. Res. 2006, 31, 51–58. [Google Scholar] [CrossRef]
  15. Rojas, R.; Feyen, L.; Bianchi, A.; Dosio, A. Assessment of future flood hazard in Europe using a large ensemble of bias-corrected regional climate simulations. J. Geophys. Res. 2012, 117, D17109. [Google Scholar] [CrossRef]
  16. Bokwa, A.; Dobrovolný, P.; Gál, T.; Geletič, J.; Gulyás, Á.; Hajto, M.J.; Holec, J.; Hollosi, B.; Kielar, R.; Lehnert, M.; et al. Urban climate in Central European cities and global climate change. Acta Climatol. 2018, 51, 7–35. [Google Scholar] [CrossRef]
  17. Milner, J.; Harpham, C.; Taylor, J.; Davies, M.; Le Quéré, C.; Haines, A.; Wilkinson, P. The challenge of urban heat exposure under climate change: An analysis of cities in the Sustainable Healthy Urban Environments (SHUE) database. Climate 2019, 5, 93. [Google Scholar] [CrossRef] [PubMed]
  18. Kosatsky, T. The 2003 European heat waves. Eurosurveillance 2005, 10, 3–4. [Google Scholar] [CrossRef]
  19. Bouchama, A.; Dehbi, M.; Mohamed, G.; Matthies, F.; Shoukri, M.; Menne, B. Prognostic factors in heat wave–related deaths: A meta-analysis. Arch. Intern. Med. 2007, 167, 2170–2176. [Google Scholar] [CrossRef]
  20. Metzger, K.B.; Ito, K.; Matte, T.D. Summer heat and mortality in New York City: How hot is too hot? Environ. Health Perspect. 2010, 118, 80–86. [Google Scholar] [CrossRef]
  21. Madrigano, J.; Ito, K.; Johnson, S.; Kinney, P.L.; Matte, T. A Case-Only Study of Vulnerability to Heat Wave-Related Mortality in New York City (2000–2011). Environ. Health Perspect. 2015, 123, 672–678. [Google Scholar] [CrossRef]
  22. IPCC. Climate Change 2014: Synthesis Report. Contribution of Working Groups I, II and III to the Fifth Assessment Report of the Intergovernmental Panel on Climate Change; Core Writing Team, Pachauri, R.K., Meyer, L.A., Eds.; IPCC: Geneva, Switzerland, 2014; 151p. [Google Scholar]
  23. Moss, R.H.; Edmonds, J.A.; Hibbard, K.A.; Manning, M.R.; Rose, S.K.; Van Vuuren, D.P.; Carter, T.R.; Emori, S.; Kainuma, M.; Kram, T.; et al. The next generation of scenarios for climate change research and assessment. Nature 2010, 463, 747–756. [Google Scholar] [CrossRef]
  24. Kalbarczyk, E.; Kalbarczyk, R. Typology of Climate Change Adaptation Measures in Polish Cities up to 2030. Land 2020, 9, 351. [Google Scholar] [CrossRef]
  25. Riahi, K.; Rao, S.; Krey, V.; Cho, C.; Chirkov, V.; Fischer, G.; Kindermann, G.; Nakicenovic, N.; Rafaj, P. RCP 8.5—A scenario of comparatively high greenhouse gas emissions. Clim. Chang. 2011, 109, 33–57. [Google Scholar] [CrossRef]
  26. Clarke, L.E. Scenarios of Greenhouse Gas Emissions and Atmospheric Concentrations: Report (Vol. 2); US Climate Change Science Program; US EPA: Washington, DC, USA, 2007.
  27. Riahi, K.; Grübler, A.; Nakicenovic, N. Scenarios of long-term socio-economic and environmental development under climate stabilisation. Technol. Forecast. Soc. Chang. 2007, 74, 887–935. [Google Scholar] [CrossRef]
  28. Thomson, A.M.; Calvin, K.V.; Smith, S.J.; Kyle, G.P.; Volke, A.; Patel, P.; Delgado-Arias, S.; Bond-Lamberty, B.; Wise, M.A.; Clarke, L.E.; et al. RCP4. 5: A pathway for stabilisation of radiative forcing by 2100. Clim. Chang. 2011, 109, 77–94. [Google Scholar] [CrossRef]
  29. Hausfather, Z.; Peters, G.P. Emissions—The business as usual story is misleading. Nature 2020, 577, 618–620. [Google Scholar] [CrossRef] [PubMed]
  30. Giorgi, F.; Jones, C.; Asrar, G.R. Addressing climate information needs at the regional level: The CORDEX framework. World Meteorol. Organ. (WMO) Bull. 2009, 58, 175. [Google Scholar]
  31. Jacob, D.; Petersen, J.; Eggert, B.; Alias, A.; Christensen, O.B.; Bouwer, L.M.; Braun, A.; Colette, A.; Déqué, M.; Georgievski, G.; et al. EURO-CORDEX: New high-resolution climate change projections for European impact research. Reg. Environ. Chang. 2014, 14, 563–578. [Google Scholar] [CrossRef]
  32. Taylor, K.E. Summarising multiple aspects of model performance in a single diagram. J. Geophys. Res. Atmos. 2001, 106, 7183–7192. [Google Scholar] [CrossRef]
  33. Available online: https://www.euro-cordex.net/ (accessed on 12 December 2023).
  34. Evin, G.; Somot, S.; Hingray, B. Balanced estimate and uncertainty assessment of European climate change using the large EURO-CORDEX regional climate model ensemble. Earth Syst. Dynam. 2021, 12, 1543–1569. [Google Scholar] [CrossRef]
  35. Gudmundsson, L.; Bremnes, J.B.; Haugen, J.E.; Engen-Skaugen, T. Downscaling RCM precipitation to the station scale using statistical transformations—A comparison of methods. Hydrol. Earth Syst. Sci. 2012, 16, 3383–3390. [Google Scholar] [CrossRef]
  36. Villani, V.; Rianna, G.; Mercogliano, P.; Zollo, A.L.; Schiano, P. Statistical approaches versus weather generator to downscale rcm outputs to point scale. J. Urban Environ. Eng. 2014, 8, 142–154. [Google Scholar]
  37. Mezghani, A.; Dobler, A.; Haugen, J.E.; Benestad, R.E.; Parding, K.M.; Piniewski, M.; Kardel, I.; Kundzewicz, Z.W. CHASE-PL Climate Projection dataset over Poland–bias adjustment of EURO-CORDEX simulations. Earth Syst. Sci. Data 2017, 9, 905–925. [Google Scholar] [CrossRef]
  38. Ahmad, B.; Rasul, G. Statistically downscaled projections of CORDEX South Asia using quantile mapping approach over Pakistan region. Int. J. Glob. Warm. 2018, 16, 435–460. [Google Scholar] [CrossRef]
  39. Enayati, M.; Bozorg-Haddad, O.; Bazrafshan, J.; Hejabi, S.; Chu, X. Bias correction capabilities of quantile mapping methods for rainfall and temperature variables. J. Water Clim. Chang. 2021, 12, 401–419. [Google Scholar] [CrossRef]
  40. Tong, Y.; Gao, X.; Han, Z.; Xu, Y.; Xu, Y.; Giorgi, F. Bias correction of temperature and precipitation over China for RCM simulations using the QM and QDM methods. Clim. Dyn. 2021, 57, 1425–1443. [Google Scholar] [CrossRef]
  41. Alaminie, A.A.; Tilahun, S.A.; Legesse, S.A.; Zimale, F.A.; Tarkegn, G.B.; Jury, M.R. Evaluation of past and future climate trends under CMIP6 scenarios for the UBNB (Abay), Ethiopia. Water 2021, 13, 2110. [Google Scholar] [CrossRef]
  42. CLMCom (CLMCom). CLMcom CORDEX Data for Europe (EUR-11) Based on CCLM4-8-17 Model Simulations. World Data Center for Climate (WDCC) at DKRZ. Available online: https://hdl.handle.net/21.14106/65c6e1e7d10dae63cfaf35b7d456c0973348be6f (accessed on 12 December 2023).
  43. Centre National de Recherches Météorologiques (Meteo-France/CNRM). CNRM CORDEX data for Europe (EUR-44) Based on ALADIN53 Model Simulations. World Data Center for Climate (WDCC) at DKRZ. Available online: https://hdl.handle.net/21.14106/262f8764af9b94a8452090ba38e6343c47e56d1a (accessed on 12 December 2023).
  44. Berckmans, J.; Caluwaerts, S.; De Cruz, L.; De Meutter, P.; De Troch, R.; Deckmyn, A.; Degrauwe, D.; Gerard, L.; Giot, O.; Smet, G.; et al. CORDEX Simulations (Evaluation, Historical, rcp85, rcp45 and rcp26) on a ca. 12.5 km Grid Over Europe Based on ALARO-0 Forced by CNRM-CM5. World Data Center for Climate (WDCC) at DKRZ. Available online: https://www.wdc-climate.de/ui/entry?acronym=CXEU11RUA1 (accessed on 12 December 2023).
  45. Swedish Meteorological and Hydrological Institute (SMHI). Cordex EUR-11 SMHI RCA4. World Data Center for Climate (WDCC) at DKRZ. Available online: https://hdl.handle.net/21.14106/5b6f4dfdf6e61d8ac8ea85dc968ff0921b17b8fc (accessed on 12 December 2023).
  46. Royal Netherlands Meteorological Institute (KNMI). Cordex EUR-11 KNMI RACMO22E. World Data Center for Climate (WDCC) at DKRZ. Available online: https://hdl.handle.net/21.14106/3da82a0eabc05fbf334d180445f312d431b8b4b9 (accessed on 12 December 2023).
  47. Danish Meteorological Institute (DMI). Cordex EUR-11 DMI HIRHAM5. World Data Center for Climate (WDCC) at DKRZ. Available online: https://hdl.handle.net/21.14106/73f8fff0d315c72dbcb120e007414c687fbd3a98 (accessed on 12 December 2023).
  48. CLMCom (CLMCom). Cordex EUR-44 CLMcom CCLM4-8-17. World Data Center for Climate (WDCC) at DKRZ. Available online: https://hdl.handle.net/21.14106/5144c214de52e153be1110cad8ba130a141316aa (accessed on 12 December 2023).
  49. Institut Pierre-Simon Laplace (IPSL); Institut National de l Environnement Industriel et des RISques (INERIS). Cordex EUR-11 IPSL-INERIS WRF331F. World Data Center for Climate (WDCC) at DKRZ. Available online: https://hdl.handle.net/21.14106/18e69890450ec5ddcf9fe7c25ec887625ce25623 (accessed on 12 December 2023).
  50. Climate Service Center Germany (GERICS). Cordex EUR-11 MPI-CSC REMO2009. World Data Center for Climate (WDCC) at DKRZ. Available online: https://hdl.handle.net/21.14106/64bf48fa23cae9263da6c76ece1872870bb14180 (accessed on 12 December 2023).
  51. Kundzewicz, Z.W.; Piniewski, M.; Mezghani, A.; Okruszko, T.; Pińskwar, I.; Kardel, I.; Hov, Ø.; Szcześniak, M.; Szwed, M.; Benestad, R.E.; et al. Assessment of climate change and associated impact on selected sectors in Poland. Acta Geophys. 2017, 66, 1509–1523. [Google Scholar] [CrossRef]
  52. Giorgi, F.; Bi, X.; Pal, J. Mean, interannual variability and trends in a regional climate change experiment over Europe. II: Climate change scenarios (2071–2100). Clim. Dyn. 2018, 23, 839–858. [Google Scholar] [CrossRef]
  53. Kjellström, E.; Bärring, L.; Jacob, D.; Jones, R.; Lenderink, G.; Schär, C. Modelling daily temperature extremes: Recent climate and future changes over Europe. Climatic Chang. 2004, 81 (Suppl. 1), 249–265. [Google Scholar] [CrossRef]
  54. Anders, I.; Stagl, J.; Auer, I.; Pavlik, D. Climate change in Central and Eastern Europe. In Managing Protected Areas in Central and Eastern Europe under Climate Change; Springer Nature: Berlin, Germany, 2014; pp. 17–30. [Google Scholar] [CrossRef]
  55. Lhotka, O.; Kyselý, J.; Farda, A. Climate change scenarios of heat waves in Central Europe and their uncertainties. Theor. Appl. Climatol. 2018, 131, 1043–1054. [Google Scholar] [CrossRef]
Figure 1. Topographical map and locations of the cities.
Applsci 14 00009 g001
Figure 2. Spatial distribution of the percentage change in the average annual temperature for 49 cities based on the results of statistical downscaling of the EURO-CORDEX model ensemble. (a) Scenario RCP 4.5 2030 (b) Scenario RCP 8.5 2030 (c) Scenario RCP 4.5 2050 (d) Scenario RCP 8.5 2050.
Applsci 14 00009 g002
Figure 3. Spatial distribution of the percentage change in the number of hot days for 49 cities based on the results of statistical downscaling of the EURO-CORDEX model ensemble. (a) Scenario RCP 4.5 2030 (b) Scenario RCP 8.5 2030 (c) Scenario RCP 4.5 2050 (d) Scenario RCP 8.5 2050.
Applsci 14 00009 g003
Figure 4. Spatial distribution of the percentage change in the number of frost days for 49 cities based on the results of statistical downscaling of the EURO-CORDEX model ensemble. (a) Scenario RCP 4.5 2030 (b) Scenario RCP 8.5 2030 (c) Scenario RCP 4.5 2050 (d) Scenario RCP 8.5 2050.
Applsci 14 00009 g004
Figure 5. Spatial distribution of the percentage change in the number of cold days for 49 cities based on the results of statistical downscaling of the EURO-CORDEX model ensemble. (a) Scenario RCP 4.5 2030 (b) Scenario RCP 8.5 2030 (c) Scenario RCP 4.5 2050 (d) Scenario RCP 8.5 2050.
Applsci 14 00009 g005
Figure 6. Spatial distribution of the percentage change in the total annual precipitation for 49 cities based on the results of statistical downscaling of the EURO-CORDEX model ensemble. (a) Scenario RCP 4.5 2030 (b) Scenario RCP 8.5 2030 (c) Scenario RCP 4.5 2050 (d) Scenario RCP 8.5 2050.
Applsci 14 00009 g006
Figure 7. Spatial distribution of the percentage change in the number of days with precipitation for 49 cities based on the results of statistical downscaling of the EURO-CORDEX model ensemble. (a) Scenario RCP 4.5 2030 (b) Scenario RCP 8.5 2030 (c) Scenario RCP 4.5 2050 (d) Scenario RCP 8.5 2050.
Applsci 14 00009 g007
Figure 8. Spatial distribution of the percentage change in the number of days with extreme precipitation for 49 cities based on the results of statistical downscaling of the EURO-CORDEX model ensemble. (a) Scenario RCP 4.5 2030 (b) Scenario RCP 8.5 2030 (c) Scenario RCP 4.5 2050 (d) Scenario RCP 8.5 2050.
Applsci 14 00009 g008
Figure 9. Variability in (a) annual average temperature, (b) the number of hot days (Tmax > 30 °C), (c) the number of frost days (Tmin < 0 °C), (d) and number of cold days (Tmax < 0 °C) for 49 cities in Poland based on the results of statistical correction of the EURO-CORDEX model ensemble for the 2010 horizon, the 2030 horizon, the 2050 horizon, and the observations from weather stations for the 2010 horizon. The horizontal line in the boxplot corresponds to the median, and the ranges represent the 1st and 3rd quartiles, respectively.
Applsci 14 00009 g009
Figure 10. Variability in (a) annual precipitation sum, (b) number of days with precipitation (PR > 1 mm/day), (c) and number of days with extreme precipitation (PR > 10 mm/day) for 49 cities in Poland based on the results of the statistical correction of the EURO-CORDEX model ensemble for the 2010 horizon, the 2030 horizon, the 2050 horizon, and the observations from weather stations for the 2010 horizon. The horizontal line in the boxplot corresponds to the median, and the ranges represent the 1st and 3rd quartiles, respectively.
Applsci 14 00009 g010
Table 1. City locations.
CityLatitudeLongitude
Bialystok53.1325° N23.1688° E
Bielsko-Biala49.8224° N19.0583° E
Bydgoszcz53.1235° N18.0084° E
Bytom50.3484° N18.9158° E
Chorzow50.2950° N18.9748° E
Czeladz50.2973° N19.0760° E
Czestochowa50.8110° N19.1207° E
Dabrowa Gornicza50.3328° N19.2241° E
Elblag54.1534° N19.4085° E
Gdansk54.3520° N18.6466° E
Gdynia54.5189° N18.5305° E
Gliwice50.2946° N18.6718° E
Gorzow Wielkopolski52.7320° N15.2431° E
Grudziadz53.4840° N18.7539° E
Jaworzno50.2104° N19.2729° E
Kalisz51.7617° N18.0919° E
Katowice50.2649° N19.0238° E
Kielce50.8703° N20.6275° E
Krakow50.0647° N19.9450° E
Legnica51.2108° N16.1615° E
Lodz51.7592° N19.4550° E
Lublin51.2465° N22.5684° E
Myslowice50.2422° N19.1370° E
Olsztyn53.7784° N20.4801° E
Opole50.6710° N17.9266° E
Plock52.5461° N19.7060° E
Poznan52.4080° N16.9334° E
Radom51.4027° N21.1471° E
Ruda Slaska50.2599° N18.8624° E
Rybnik50.0979° N18.5416° E
Rzeszow50.0412° N21.9991° E
Siemienowice Slaskie50.3163° N19.0239° E
Slupsk54.4641° N17.0282° E
Sopot54.4419° N18.5601° E
Sosnowiec50.2866° N19.1044° E
Szczecin53.4285° N14.5528° E
Tarnow50.0138° N20.9868° E
Torun53.0138° N18.5984° E
Tychy50.1303° N18.9664° E
Walbrzych50.7714° N16.2843° E
Wloclawek52.6481° N19.0678° E
Wroclaw51.1079° N17.0385° E
Zabrze50.3169° N18.7858° E
Zielona Gora51.9356° N15.5064° E
Belchatow51.3608° N19.3622° E
Nowy Sacz49.6251° N20.7150° E
Ostroleka53.0921° N21.5737° E
Siedlce52.1679° N22.2900° E
Tomaszow Mazowiecki51.5293° N20.0167° E
Disclaimer/Publisher’s Note: The statements, opinions and data contained in all publications are solely those of the individual author(s) and contributor(s) and not of MDPI and/or the editor(s). MDPI and/or the editor(s) disclaim responsibility for any injury to people or property resulting from any ideas, methods, instructions or products referred to in the content.

