Simulation and Management Impact Evaluation of Debris Flow in Dashiling Gully Based on FLO-2D Modeling
Abstract
:1. Introduction
2. Study Area Overview
3. Mudslide Formation Conditions
3.1. Source Conditions
3.2. Hydrological Conditions
4. Research Methodology
4.1. FLO-2D Model and Governing Equations
4.2. Selection of Simulation Parameters
4.2.1. Fluid Weight
4.2.2. Selection of Catchment Points
4.2.3. Volume Concentration
4.2.4. Laminar Flow Coefficient, Yield Stress, and Viscosity Coefficient
4.2.5. Manning’s Roughness Coefficient
4.2.6. Clear Water Flow Process Line
5. Simulation Results and Analysis
5.1. Computational Modelling Results
5.2. Analysis and Interpretation of Simulation Results
5.2.1. Movement Velocity Analysis
5.2.2. Mudslide Deposition Depth Analysis
5.3. Hazard Evaluation
6. Calculation of Parameters for Mudslide Mitigation
6.1. Total Mudslide Volume
6.2. Sediment Yield from a Mudslide
6.3. Mudslide Impact Pressure
6.4. Mudslide Runup and Maximum Rise Height
6.5. Mudslide Superelevation at Bends
7. Dashiling Mudslide Mitigation Measures
7.1. Mitigation Strategy
7.2. Evaluation of Mitigation Effectiveness
8. Discussion and Conclusions
8.1. Discussion
8.2. Conclusions
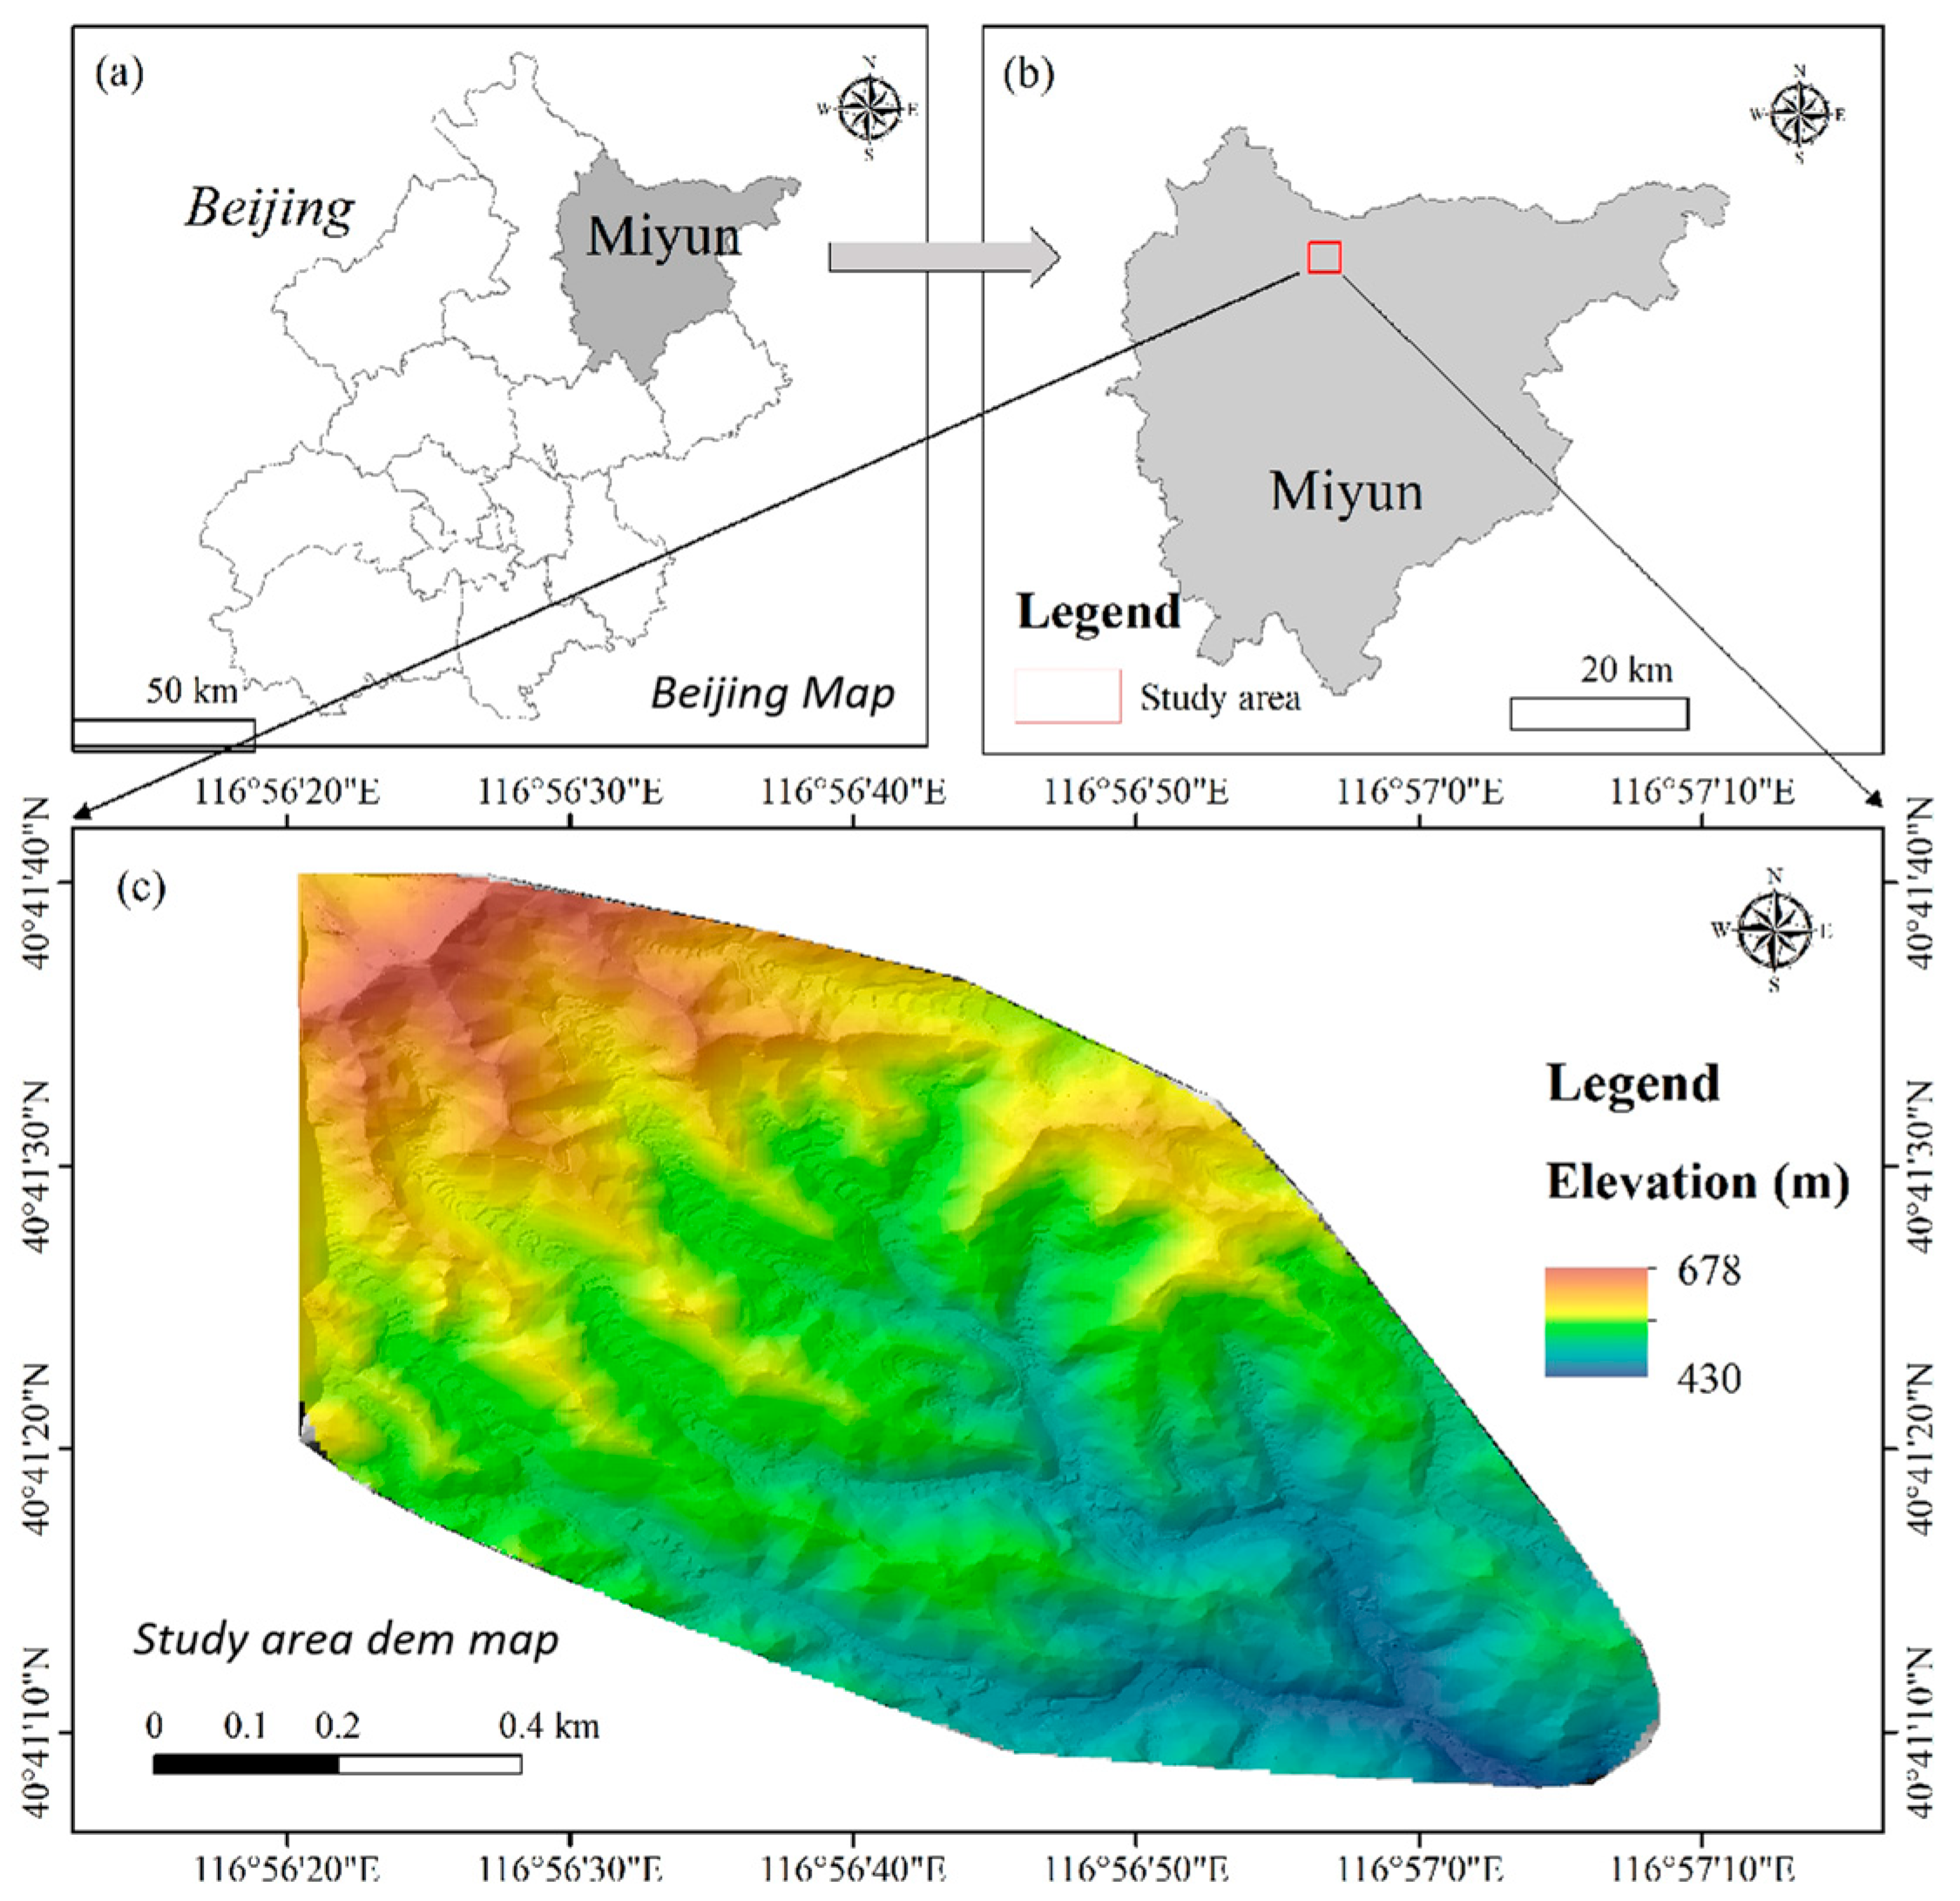
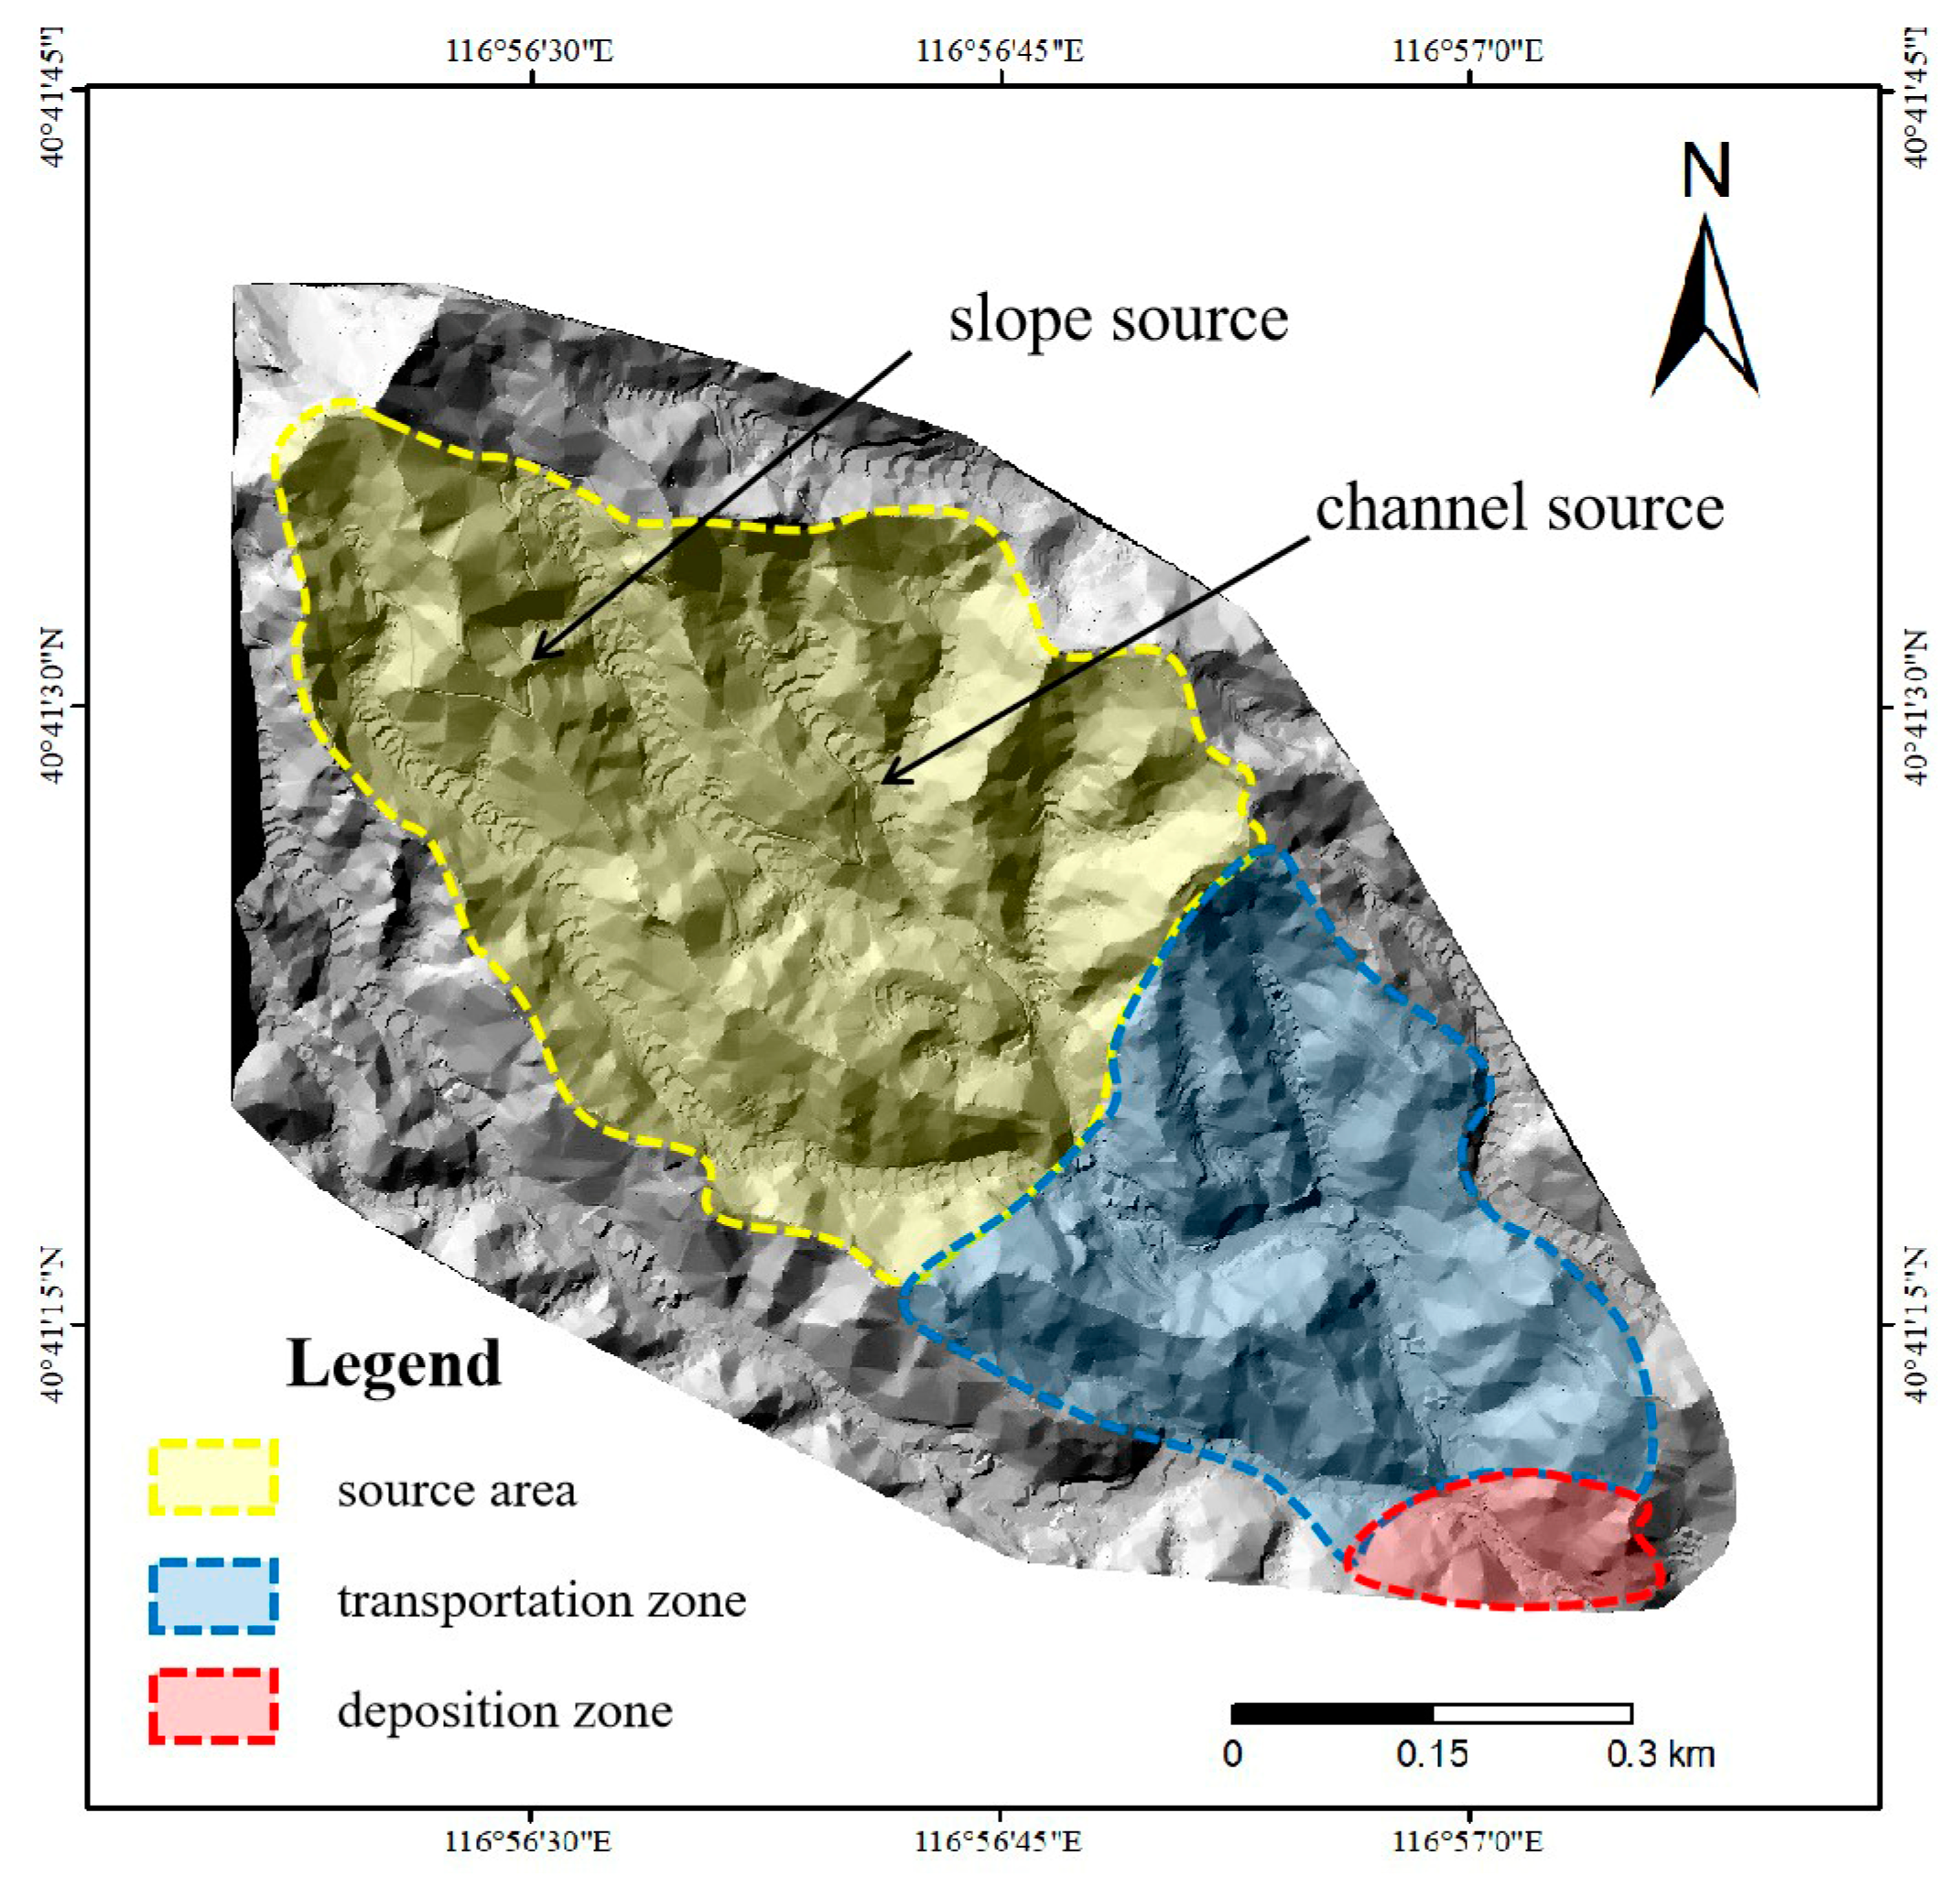
- Field geological surveys were conducted to analyze the geological, topographical, and hydrological conditions contributing to debris flow formation in Dashiling Gully. Key topographic elements (slope, aspect, elevation, and channel bed gradient), geological elements (stratum lithology), and hydrological elements were determined. The basin is characterized by numerous tributary gullies in the basin, and there are sufficient solid sources. The confirmed solid source reserves are about 20 × 104 m3. There is sufficient rainfall in summer, which can easily cause mudslides, seriously threatening the lives and property safety of 13 households in Dashiling Village.
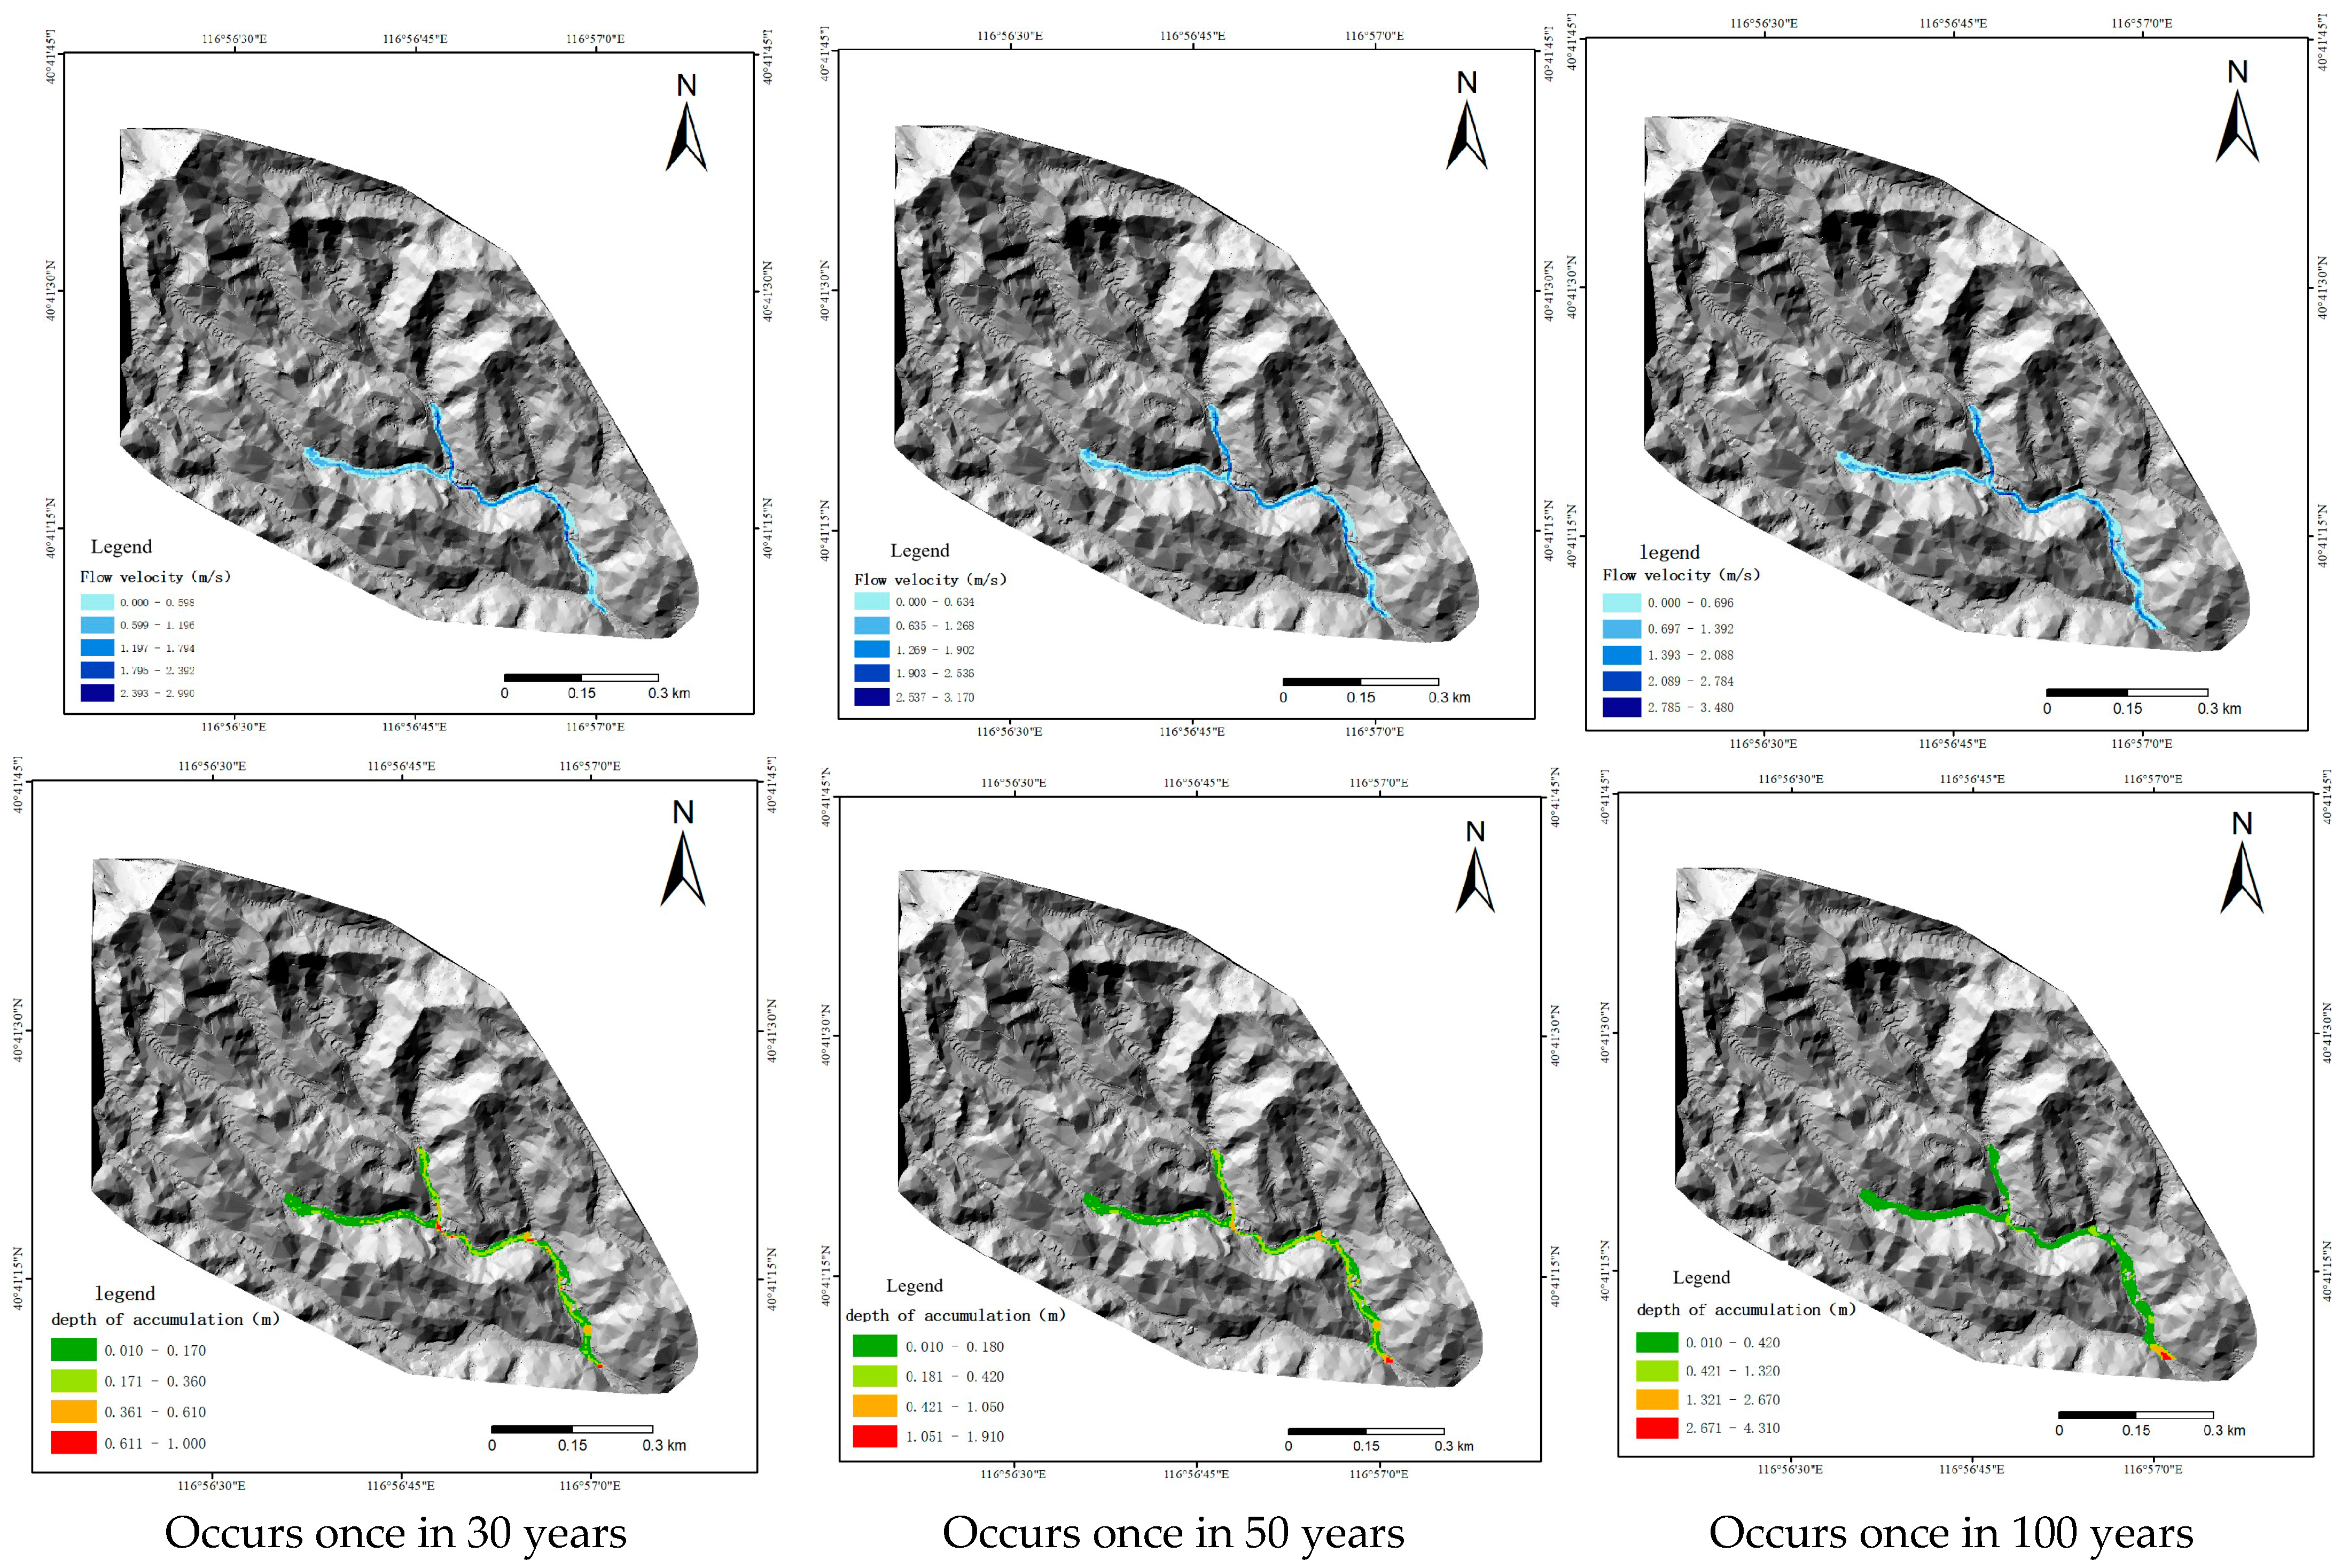
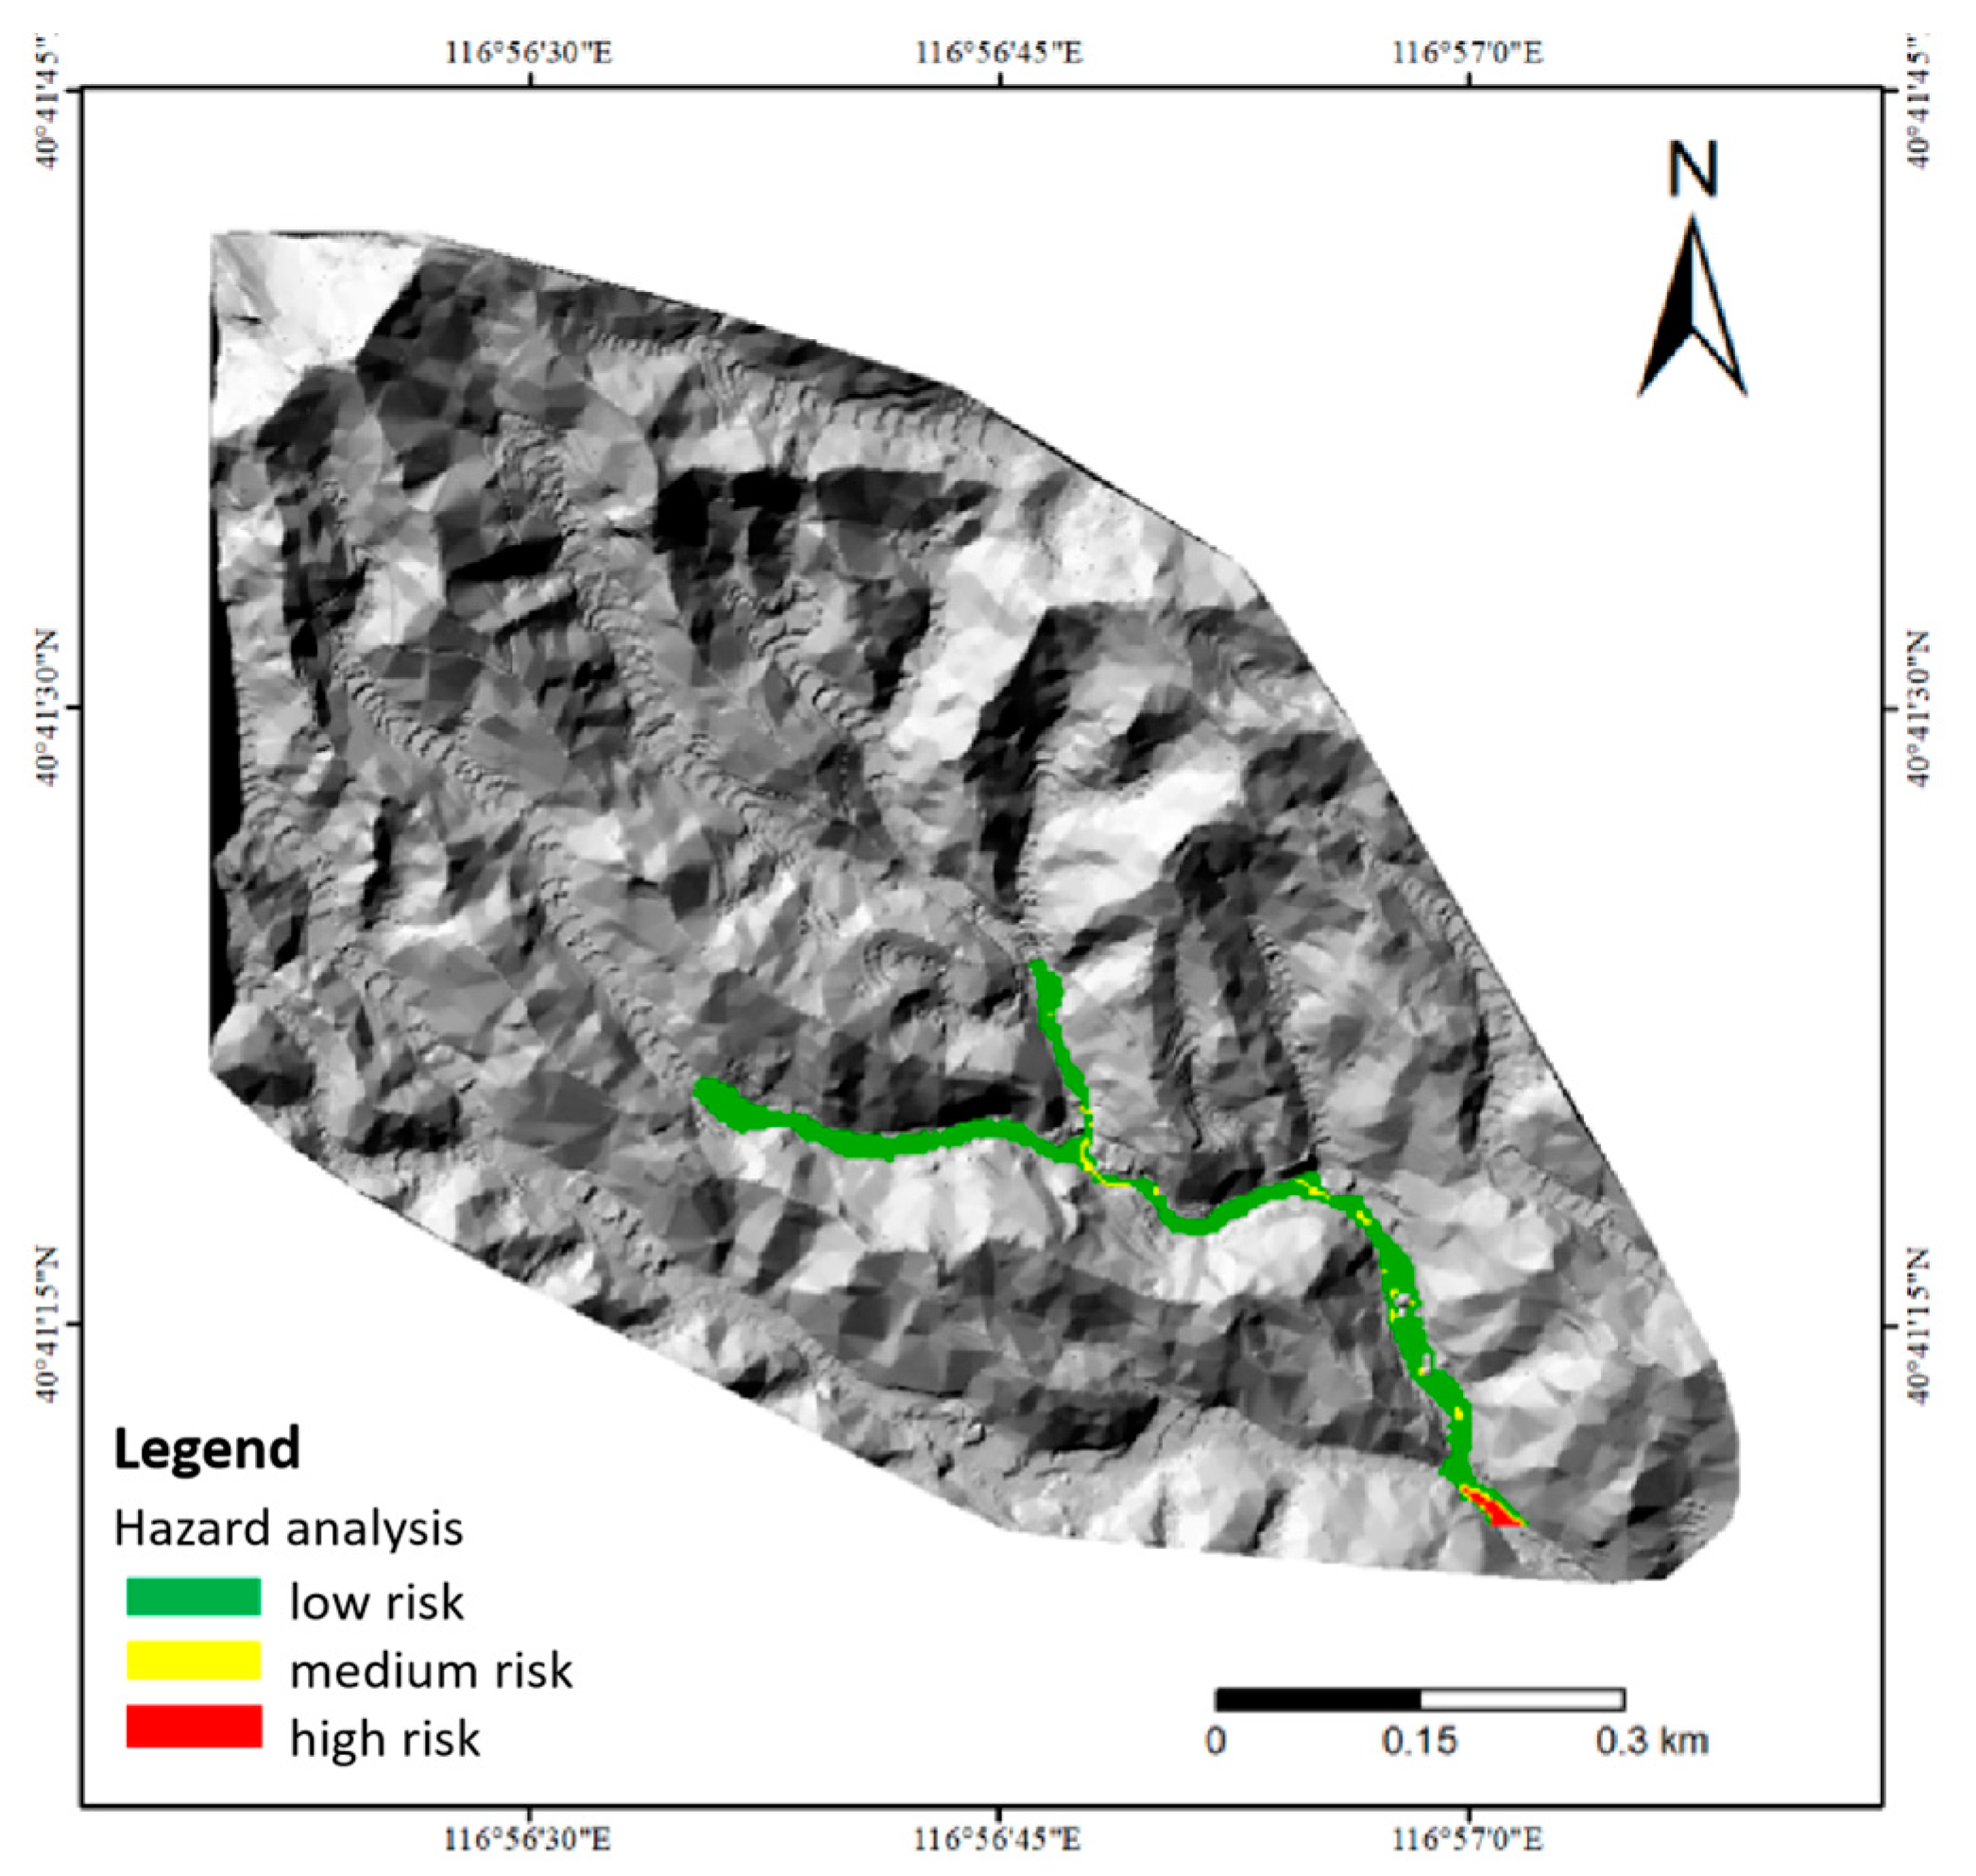
- FlO-2D software was employed to numerically simulate mudslide events in Dashiling Gully under three different rainfall frequencies. The simulations provided critical data on mudslide velocity and deposition depth. Results indicated that mudslide velocity increases with increasing rainfall intensity, and both the extent and depth of deposition also increase with rainfall intensity. Prior to the implementation of mitigation measures, simulations of a 100-year rainfall event revealed a maximum mudslide velocity of 3.5 m/s and a maximum deposition depth of 4.3 m. Hazard zoning classified the gully outlet as a high-risk area under these conditions.
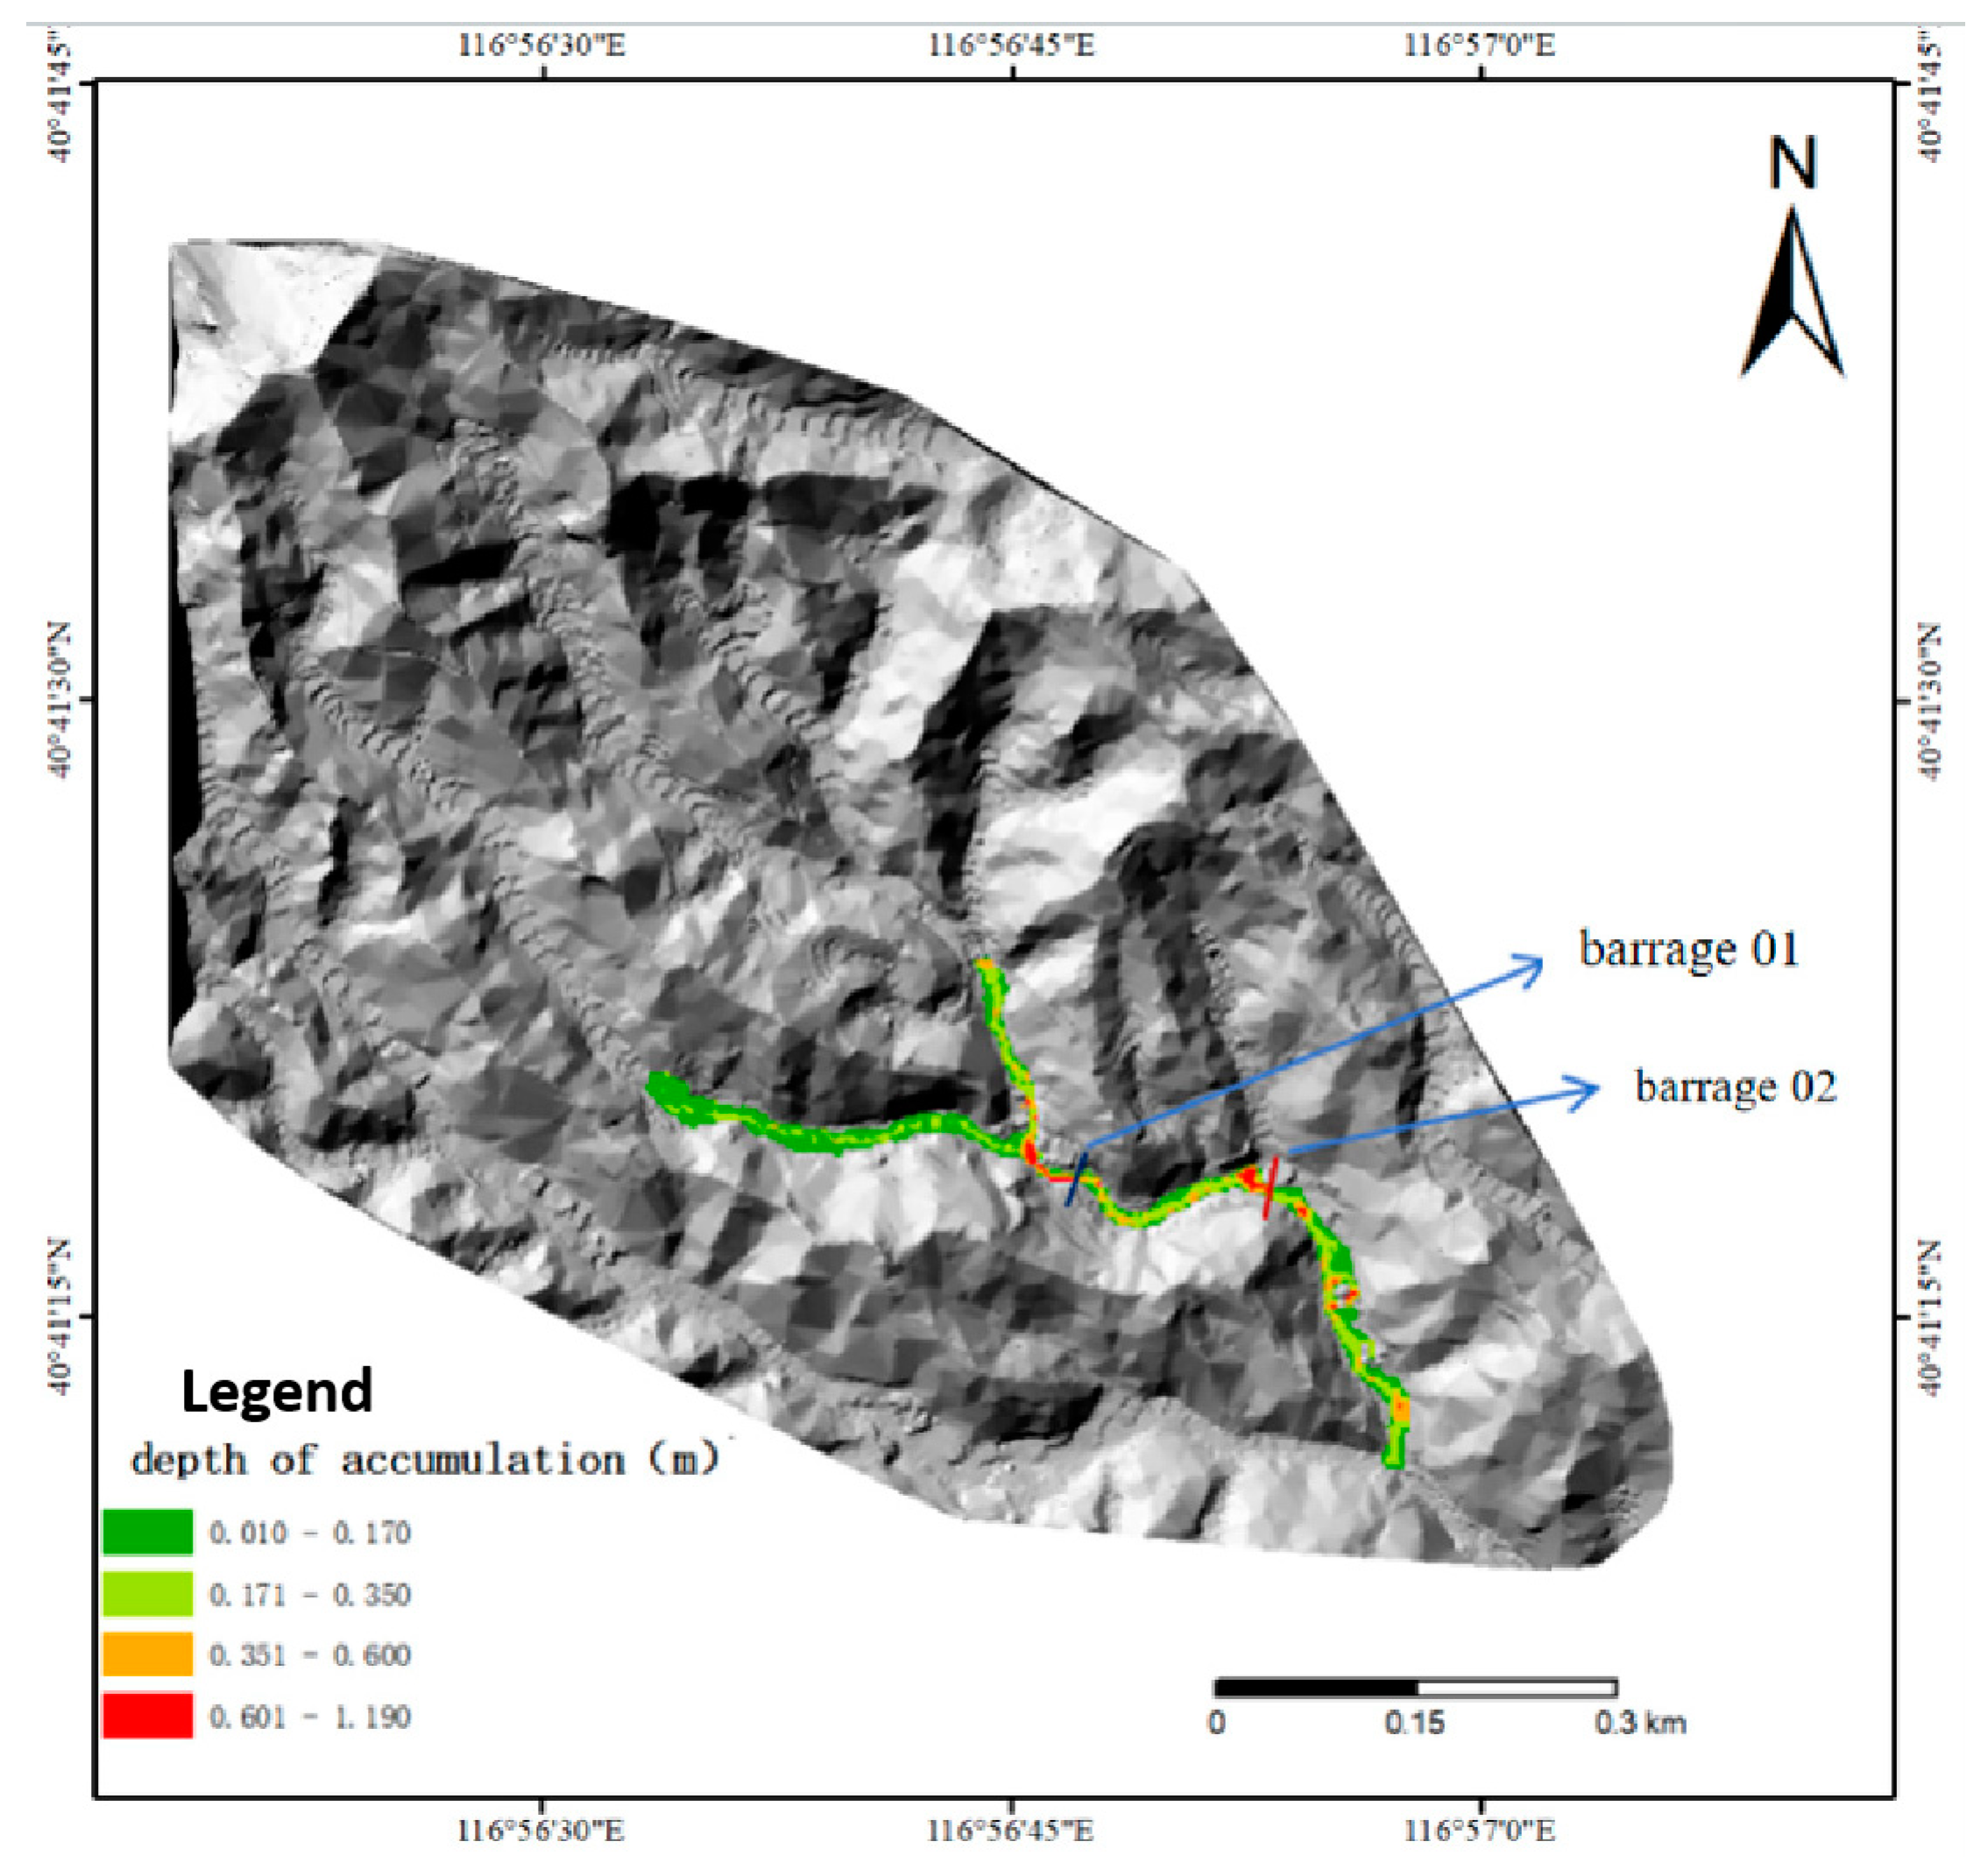
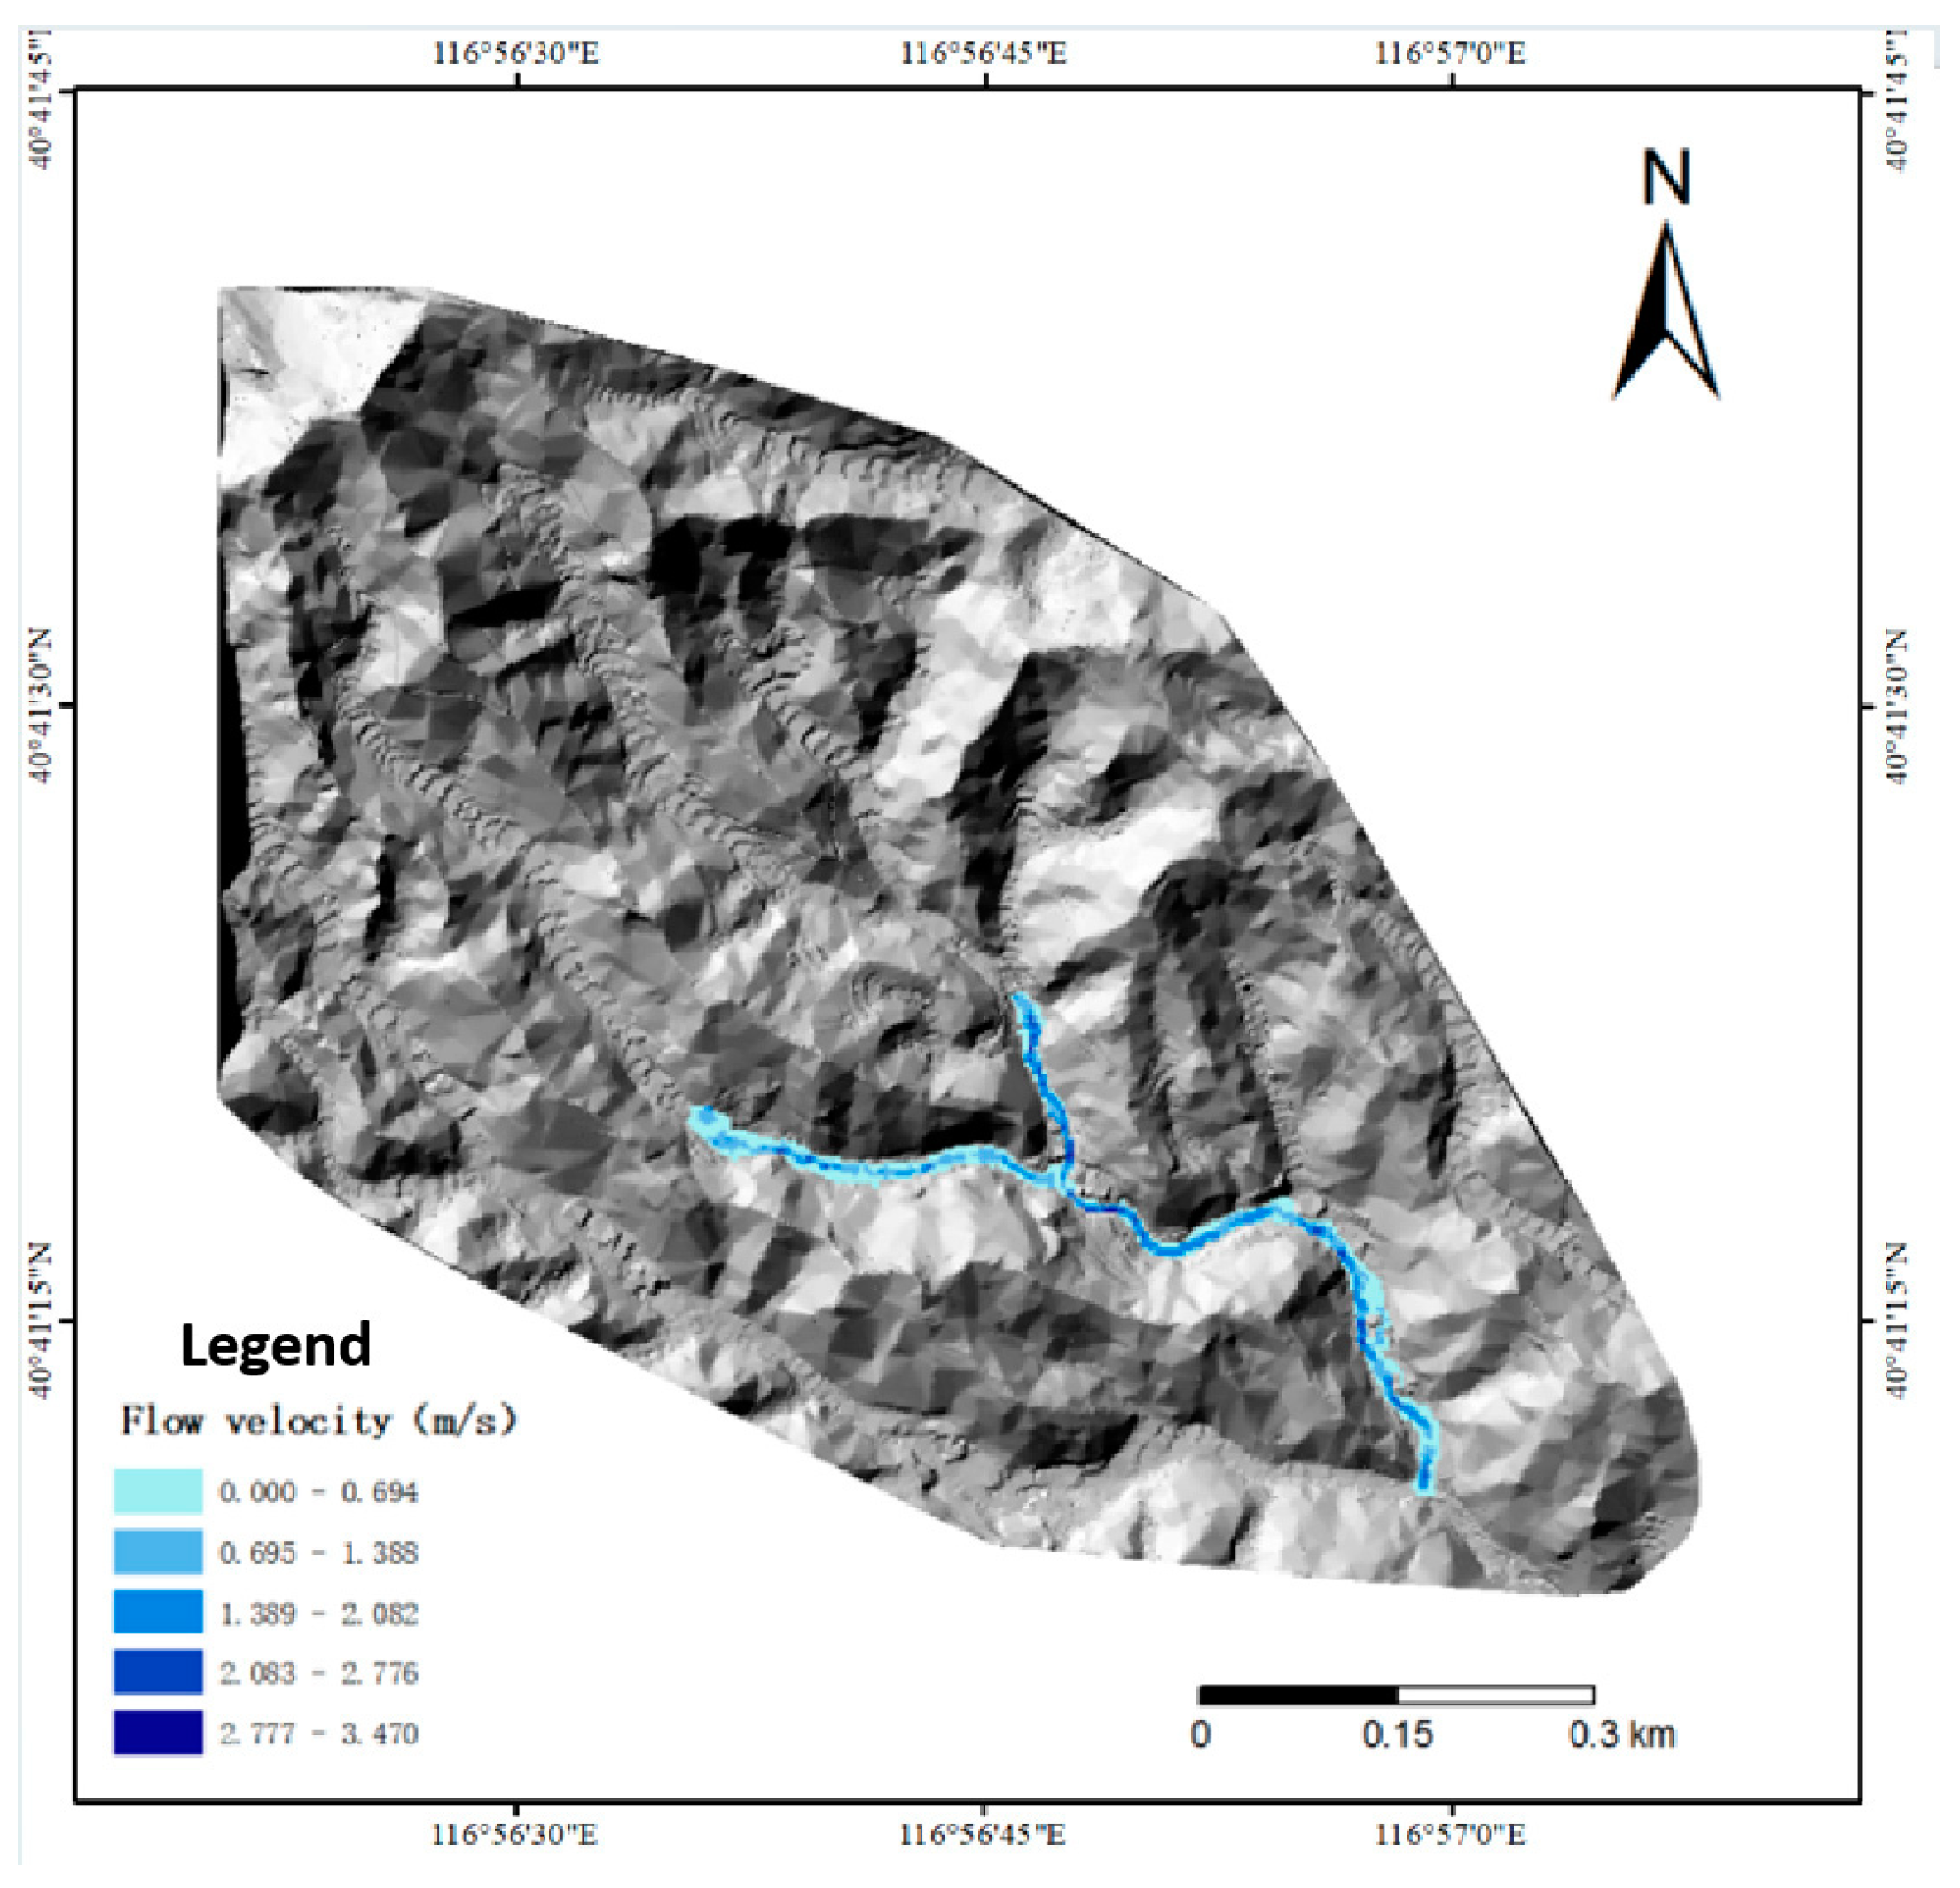
- Following the construction of check dams, additional simulations were conducted for a 100-year rainfall frequency event. The results demonstrated that while mudslide velocities remained relatively unchanged, the check dams effectively trapped a significant volume of sediment. Notably, the maximum deposition depth decreased from 4.3 m to 1.9 m, with maximum deposition now occurring at the check dam locations. Furthermore, post-mitigation deposition depths throughout the gully remained below 0.5 m. Hazard assessments indicated that high-risk zones were eliminated, and apart from a medium-risk area adjacent to the check dams, the entire gully was classified as low-risk. Additional simulations incorporating two more check dams downstream of the gully outlet did not reveal any significant improvement in mitigation effectiveness. Consequently, considering economic and safety factors, check dams were strategically placed at the confluence and bend locations to optimize debris flow mitigation.
Author Contributions
Funding
Data Availability Statement
Conflicts of Interest
References
- Zhao, Z.H. Present Situation and Study on the Early Warning Methodof the Debris Flow Calamity in Beijing. Urban Geol. 2015, 10, 78–84. [Google Scholar]
- Carrara, A.; Crosta, G.; Frattini, P. Comparing models of debris-flow susceptibility in the alpine environment. Geomorphology 2008, 94, 353–378. [Google Scholar] [CrossRef]
- Christen, M.; Kowalski, J.; Bartelt, P. RAMMS: Numerical simulation of dense snow avalanches in three-dimensional terrain. Cold Reg. Sci. Technol. 2010, 63, 1–14. [Google Scholar] [CrossRef]
- Ouyang, C.; He, S.; Xu, Q.; Luo, Y.; Zhang, W. A MacCormack-TVD finite difference method to simulate the mass flow in mountainous terrain with variable computational domain. Comput. Geosci. 2013, 52, 1–10. [Google Scholar] [CrossRef]
- Wu, Y.H.; Liu, K.F.; Chen, Y.C. Comparison between FLO-2D and Debris-2D on the application of assessment of granular debris flow hazards with case study. J. Mt. Sci. 2013, 10, 293–304. [Google Scholar] [CrossRef]
- Han, Z.; Chen, G.; Li, Y.; Xu, L.; Fan, F. Numerical simulation of post-entrainment debris flow at alluvial fan using FLO-2D model. In Geotechnical Hazards Large Earthq. Heavy Rainfalls; Springer: Berlin/Heidelberg, Germany, 2017; pp. 311–321. [Google Scholar] [CrossRef]
- Hsu, Y.C.; Yen, H.; Tseng, W.H.; Jan, C.D. Numerical simulation on a tremendous debris flow caused by Typhoon Morakot in the Jiaopu Stream, Taiwan. J. Mt. Sci. 2014, 11, 1–8. [Google Scholar] [CrossRef]
- Zhang, M.; Zhou, B.; Cheng, Q.; Shen, L.; Xing, A.; Zhuang, Y. Investigation of the triggering mechanism and runout characteristics of an earthflow in Zhimei village, Chengduo, Qinghai, China. Nat. Hazards 2021, 109, 903–929. [Google Scholar] [CrossRef]
- Zhang, T.; Li, D.; East, A.E.; Walling, D.E.; Lane, S.; Overeem, I.; Beylich, A.A.; Koppes, M.; Lu, X. Warming-driven erosion and sediment transport in cold regions. Nat. Rev. Earth Environ. 2022, 3, 832–851. [Google Scholar] [CrossRef]
- Burton, Z.F.; McHargue, T.; Kremer, C.H.; Bloch, R.B.; Gooley, J.T.; Jaikla, C.; Harrington, J.; Graham, S.A. Peak Cenozoic warmth enabled deep-sea sand deposition. Sci. Rep. 2023, 13, 1276. [Google Scholar] [CrossRef] [PubMed]
- Burton, Z.F.; Kroeger, K.F.; Hosford Scheirer, A.; Seol, Y.; Burgreen-Chan, B.; Graham, S.A. Tectonic uplift destabilizes subsea gas hydrate: A model example from Hikurangi margin, New Zealand. Geophys. Res. Lett. 2020, 47, e2020GL087150. [Google Scholar] [CrossRef]
- Zhang, W.; Puzrin, A.M. How small slip surfaces evolve into large submarine landslides—Insight from 3D numerical modeling. J. Geophys. Res. Earth Surf. 2022, 127, e2022JF006640. [Google Scholar] [CrossRef]
- Burton, Z.F.; Dafov, L.N. Salt Diapir-Driven Recycling of Gas Hydrate. Geochem. Geophys. Geosystems 2023, 24, e2022GC010704. [Google Scholar] [CrossRef]
- Roger, J.H.; Bull, S.; Watson, S.J.; Mueller, C.; Hillman, J.I.; Wolter, A.; Davidson, S. A review of approaches for submarine landslide-tsunami hazard identification and assessment. Mar. Pet. Geol. 2024, 162, 106729. [Google Scholar] [CrossRef]
- Četina, M.; Rajar, R.; Hojnik, T.; Zakrajšek, M.; Krzyk, M.; Mikoš, M. Case study: Numerical simulations of debris flow below Stože, Slovenia. J. Hydraul. Eng. 2006, 132, 121–130. [Google Scholar] [CrossRef]
- Kim, S.; Paik, J.; Kim, K.S. Run-out modeling of debris flows in Mt. Umyeon using FLO-2D. KSCE J. Civ. Environ. Eng. Res. 2013, 33, 965–974. [Google Scholar] [CrossRef]
- Liu, J.; Nakatani, K.; Mizuyama, T. Effect assessment of debris flow mitigation works based on numerical simulation by using Kanako 2D. Landslides 2013, 10, 161–173. [Google Scholar] [CrossRef]
- Hsu, S.M.; Chiou, L.B.; Lin, G.F.; Chao, C.H.; Wen, H.Y.; Ku, C.Y. Applications of simulation technique on debris-flow hazard zone delineation: A case study in Hualien County, Taiwan. Nat. Hazards Earth Syst. Sci. 2010, 23, 535–545. [Google Scholar] [CrossRef]
- Chau, K.T.; Lo, K.H. Hazard assessment of debris flows for Leung King Estateof Hong Kong by incorporating GIS with numericalsimulations. Nat. Hazards Earth Syst. Sci. 2004, 4, 103–116. [Google Scholar] [CrossRef]
- Wu, J.; Chen, G.Q.; Zheng, L.; Zhang, Y.B. GIS-based numerical modelling of debris flow motion across three-dimensional terrain. J. Mt. Sci. 2013, 10, 522–531. [Google Scholar] [CrossRef]
- Nie, Y.; Li, X.; Zhou, W.; Xu, R. Dynamic hazard assessment of group-occurring debris flows based on a coupled model. Nat. Hazards 2021, 106, 2635–2661. [Google Scholar] [CrossRef]
- Chen, H.X.; Zhang, L.M.; Zhang, S.; Xiang, B.; Wang, X.F. Hybrid simulation of the initiation and runout characteristics of a catastrophic debris flow. J. Mt. Sci. 2013, 10, 219–232. [Google Scholar] [CrossRef]
- Cui, P.; Hu, K.; Zhuang, J.; Yang, Y.; Zhang, J. Prediction of debris-flow danger area by combining hydrological and inundation simulation methods. J. Mt. Sci. 2011, 8, 1–9. [Google Scholar] [CrossRef]
- Hong, M.; Jeong, S.; Kim, J. A combined method for modeling the triggering and propagation of debris flows. Landslides 2020, 17, 805–824. [Google Scholar] [CrossRef]
- Zhou, S.Y.; Gao, L.; Zhang, L.M. Predicting debris-flow clusters under extreme rainstorms: A case study on Hong Kong Island. Bull. Eng. Geol. Environ. 2019, 78, 5775–5794. [Google Scholar] [CrossRef]
- Jakob, M.; Hungr, O.; Jakob, M. Debris-flow hazard analysis. In Debris-Flow Hazards and Related Phenomena; Springer: Berlin/Heidelberg, Germany, 2005; pp. 411–443. [Google Scholar] [CrossRef]
- Zhang, Y.; Lyu, L.; Li, P. An optimized volume of fluid method for modelling three-dimensional debris flows. Implementation in OpenFOAM, validation, and application in the Aiwa Watershed, Beijing. Comput. Geotech. 2022, 144, 104651. [Google Scholar] [CrossRef]
- O’brien, J.S. Physical Processes, Rheology and Modeling of Mud Flows (Hyperconcentration, Sediment Flow). Ph.D. Thesis, Colorado State University, Fort Collins, CO, USA, 1986. [Google Scholar]
- O’brien, J.S.; Julien, P.Y. Physical Properties and Mechanics of Hyperconcentrated Sediment Flows. Proc. ASCE HD Delin. Landslides Flash Flood Debris Flow Hazards. 1985. Available online: https://eurekamag.com/research/019/725/019725249.php (accessed on 10 May 2024).
- DZ/T 0220-2006; Specification of Geological Investigation for Debris Flow Stabilization. Ministry of Land and Resources of the People’s Republic of China: Beijing, China, 2006.
- Zhou, J.W.; Huang, K.X.; Shi, C.; Hao, M.H.; Guo, C.X. Discrete element modeling of the mass movement and loose material supplying the gully process of a debris avalanche in the Bayi Gully, Southwest China. J. Asian Earth Sci. 2015, 1, 95–111. [Google Scholar] [CrossRef]
- Zhou, G.G.; Du, J.; Song, D.; Choi, C.E.; Hu, H.S.; Jiang, C. Numerical study of granular debris flow run-up against slit dams by discrete element method. Landslides 2020, 17, 585–595. [Google Scholar] [CrossRef]
- DZ/T0239-2004; Specification of Debris Flow Disaster Prevention and Control Engineering Design. Ministry of Land and Resources of the People’s Republic of China: Beijing, China, 2004.




| Section | Catchment Area (km2) | Rainstorm Intensity (mm/h) | Peak Flood Discharge (m3/s) | ||||
|---|---|---|---|---|---|---|---|
| p = 1% | p = 2% | p = 3% | p = 1% | p = 2% | p = 3% | ||
| Main gully catchment | 0.179062 | 125 | 115 | 100 | 1.87 | 1.72 | 1.49 |
| Tributary gully catchment | 0.10916 | 125 | 115 | 100 | 1.14 | 1.05 | 0.91 |
| Mudslide Hazard Level | Deposition Depth (H, m) | Logical Relation | HV (m2/s) |
|---|---|---|---|
| high risk | 2.5 | OR | 2.5 |
| medium risk | AND | ||
| low risk | AND |
| Section | Mudslide duration | Peak mudslide discharge Qc (m3/s) | K | Total mudslide volume Q (104 m3/h) | ||||
| (s) | p = 1% | p = 2% | p = 3% | 0.202 | p = 1% | p = 2% | p = 3% | |
| Main gully catchment | 3600 | 5.60 | 5.15 | 4.48 | 0.4069 | 0.3744 | 0.3255 | |
| Secondary gully catchment | 3.41 | 3.14 | 2.73 | 0.2481 | 0.2282 | 0.1985 | ||
| Section | Mudslide Specific Weight γc | Water Specific Weight γw | Solids Specific Weight γH | Sediments Volume QH (104 m3) | ||
|---|---|---|---|---|---|---|
| (t/m3) | (t/m3) | (t/m3) | ||||
| p = 1% | p = 2% | p = 3% | ||||
| Main gully catchment | 1.537 | 1 | 2.5 | 0.1457 | 0.1340 | 0.1165 |
| Tributary gully catchment | 1.537 | 1 | 2.4 | 0.0952 | 0.0875 | 0.0761 |
| Location | Mudslide Specific Weight γc (kN/m3) | Average Flow Velocity of Mudslide Section Vc (m/s) | Mudslide Flow Impact Pressure P (kPa) | ||||
|---|---|---|---|---|---|---|---|
| p = 1% | p = 2% | p = 3% | p = 1% | p = 2% | p = 3% | ||
| Main gully catchment | 15.37 | 1.02 | 0.46 | 0.53 | 2.14 | 0.44 | 0.58 |
| Tributary gully catchment | 15.37 | 1.23 | 0.50 | 0.87 | 3.12 | 0.51 | 1.56 |
| Location | Average Velocity of Mudslide Section Vc (m/s) | Mudslide Rise Height ΔH (m) | Mudslide Runup Height ΔHc (m) | ||||||
|---|---|---|---|---|---|---|---|---|---|
| p = 1% | p = 2% | p = 3% | p = 1% | p = 2% | p = 3% | p = 1% | p = 2% | p = 3% | |
| Main gully catchment | 1.02 | 0.46 | 0.53 | 0.11 | 0.02 | 0.03 | 0.08 | 0.02 | 0.02 |
| Tributary gully catchment | 1.23 | 0.50 | 0.87 | 0.15 | 0.03 | 0.08 | 0.12 | 0.02 | 0.06 |
| Location | Convex Bank Radius R1 (m) | Concave Bank Radius R2 (m) | Average Velocity of Mudslide Section Vc (m/s) | Mudslide Superelevation | ||||
|---|---|---|---|---|---|---|---|---|
| p = 1% | p = 2% | p = 3% | p = 1% | p = 2% | p = 3% | |||
| Main gully catchment | 24 | 61 | 1.02 | 0.46 | 0.53 | 0.10 | 0.02 | 0.03 |
| Tributary gully catchment | 14 | 32 | 1.23 | 0.50 | 0.87 | 0.13 | 0.02 | 0.06 |
Disclaimer/Publisher’s Note: The statements, opinions and data contained in all publications are solely those of the individual author(s) and contributor(s) and not of MDPI and/or the editor(s). MDPI and/or the editor(s) disclaim responsibility for any injury to people or property resulting from any ideas, methods, instructions or products referred to in the content. |
© 2024 by the authors. Licensee MDPI, Basel, Switzerland. This article is an open access article distributed under the terms and conditions of the Creative Commons Attribution (CC BY) license (https://creativecommons.org/licenses/by/4.0/).
Share and Cite
Jia, X.; Lv, J.; Luo, Y. Simulation and Management Impact Evaluation of Debris Flow in Dashiling Gully Based on FLO-2D Modeling. Appl. Sci. 2024, 14, 4216. https://doi.org/10.3390/app14104216
Jia X, Lv J, Luo Y. Simulation and Management Impact Evaluation of Debris Flow in Dashiling Gully Based on FLO-2D Modeling. Applied Sciences. 2024; 14(10):4216. https://doi.org/10.3390/app14104216
Chicago/Turabian StyleJia, Xiamin, Jianguo Lv, and Yaolong Luo. 2024. "Simulation and Management Impact Evaluation of Debris Flow in Dashiling Gully Based on FLO-2D Modeling" Applied Sciences 14, no. 10: 4216. https://doi.org/10.3390/app14104216
APA StyleJia, X., Lv, J., & Luo, Y. (2024). Simulation and Management Impact Evaluation of Debris Flow in Dashiling Gully Based on FLO-2D Modeling. Applied Sciences, 14(10), 4216. https://doi.org/10.3390/app14104216


