Abstract
The Côte d’Ivoire Basin is one of the most important oil production areas in Africa; and it is also the focus of global oil and gas exploration, but the degree of oil exploration and development in this basin are still in the early stages. Based on a comprehensive analysis of drilling, logging, and geochemical data in the Côte d’Ivoire Basin, this study comprehensively evaluates the Cretaceous lacustrine source rocks in the study area, establishes a total organic carbon (TOC) quantitative prediction model by using the total organic carbon method, determines the relationship between seismic reflections and the geochemical characteristics of the source rocks, and tracks the main source rocks horizontally. The results show that the TOC of the Lower Cretaceous Albian stage source rocks is 2.63 wt.%, the kerogen type II is dominant, and the vitrinite reflectance (RO) ranges from 0.3% to 0.9%. The source rocks are mainly in the low-mature to mature stage, and they are generally of good and premium quality. The distribution range of high-quality source rocks with TOC values of 4.00~5.00% is predicted using the total organic carbon method, and useing the seismic method, we determine that high-quality source rocks with larger thickness values and better continuity are mainly developed in the eastern depression center of the basin.
1. Introduction
With the continuous growth of the world economy, the global demand for oil and gas is rising, and countries around the world are seeking out rich resources and lower-cost exploration areas. In the past 30 years, 54 large oil and gas fields have been discovered in Africa, accounting for 22% of the world’s total [1]. The deepwater area of West Africa has seen major breakthroughs, with the discovery of large oil and gas fields such as Jubilee [2], which has become a hot spot for oil exploration today. About 10% of China’s oil imports come from Africa, and through the “Belt and Road” project, China and West Africa’s oil cooperation is increasing [3], There is an urgent need for source rock and oil and gas geochemistry research in the less developed areas to help Chinese oil companies better conduct post-exploration deployment. The Côte d’Ivoire Basin, which is located in the northern part of the Gulf of Equatorial Guinea in West Africa, has good prospects for petroleum exploration and development. Up to now, reserves of 4.926 billion barrels of oil and 9.96 trillion cubic meters of natural gas have been discovered [4]. Little exploration has taken place along the transition margin between Côte d‘Ivoire and Ghana, and the lack of basic geological data restricts the research process. Therefore, it is necessary to study the petroleum system in the study area [5] and to analyze the geochemical characteristics of the source rocks by conducting experiments such as total organic carbon analysis, rock pyrolysis, vitrinite reflectance, and saturated hydrocarbon chromatography–mass spectrometry [6,7,8] so as to classify and evaluate the source rocks and clarify the distribution of organic facies. The sedimentary environment is discussed, in order to shed light on the parent material source and the preservation conditions of the organic matter [9]. This research provides promising guidance for the follow-up development of the study area.
Previous studies on the formation, evolution, structure, and oil and gas geological characteristics of the Côte d’Ivoire Basin have concluded that the basin can be divided into two first-order structural units; the eastern main depression and the northern sub-depression. The eastern main depression is the key area of oil and gas production at present and is also the subject of this study. It can be further divided into three second-order structural units, namely, the eastern depression, the eastern bulge, and the southern bulge. There are two main sets of Lower-Cretaceous-Albian-stage source rocks and Late Cretaceous Cenomanian–Turonian marine source rocks, in which large hydrocarbon reservoirs have been discovered, Thus, Chinese oil companies must carry out in-depth exploration and development in this area as a matter of urgency [10]. Previous attempts only searched for oil and gas resources through drilling, but there is a lack of comprehensive analyses and distribution predictions of the oil and gas geochemical characteristics of the source rocks, meaning that the exploration prospects and directions are not clear. It is therefore important to conduct in-depth research on the main Cretaceous source rock system. At present, the study area is sparsely drilled, and there are relatively few geochemical data. Based on the experimental results, we comprehensively analyzed and evaluated the geochemical characteristics of the Cretaceous-Albian-stage source rocks, also using logging and seismic methods to predict the plane distribution of the source rocks. This research provides an important theoretical basis for the follow-up exploration and development of Chinese enterprises in Africa and the search for favorable areas.
2. Regional Geological Overview
2.1. The Basin’s Tectonic Characteristics
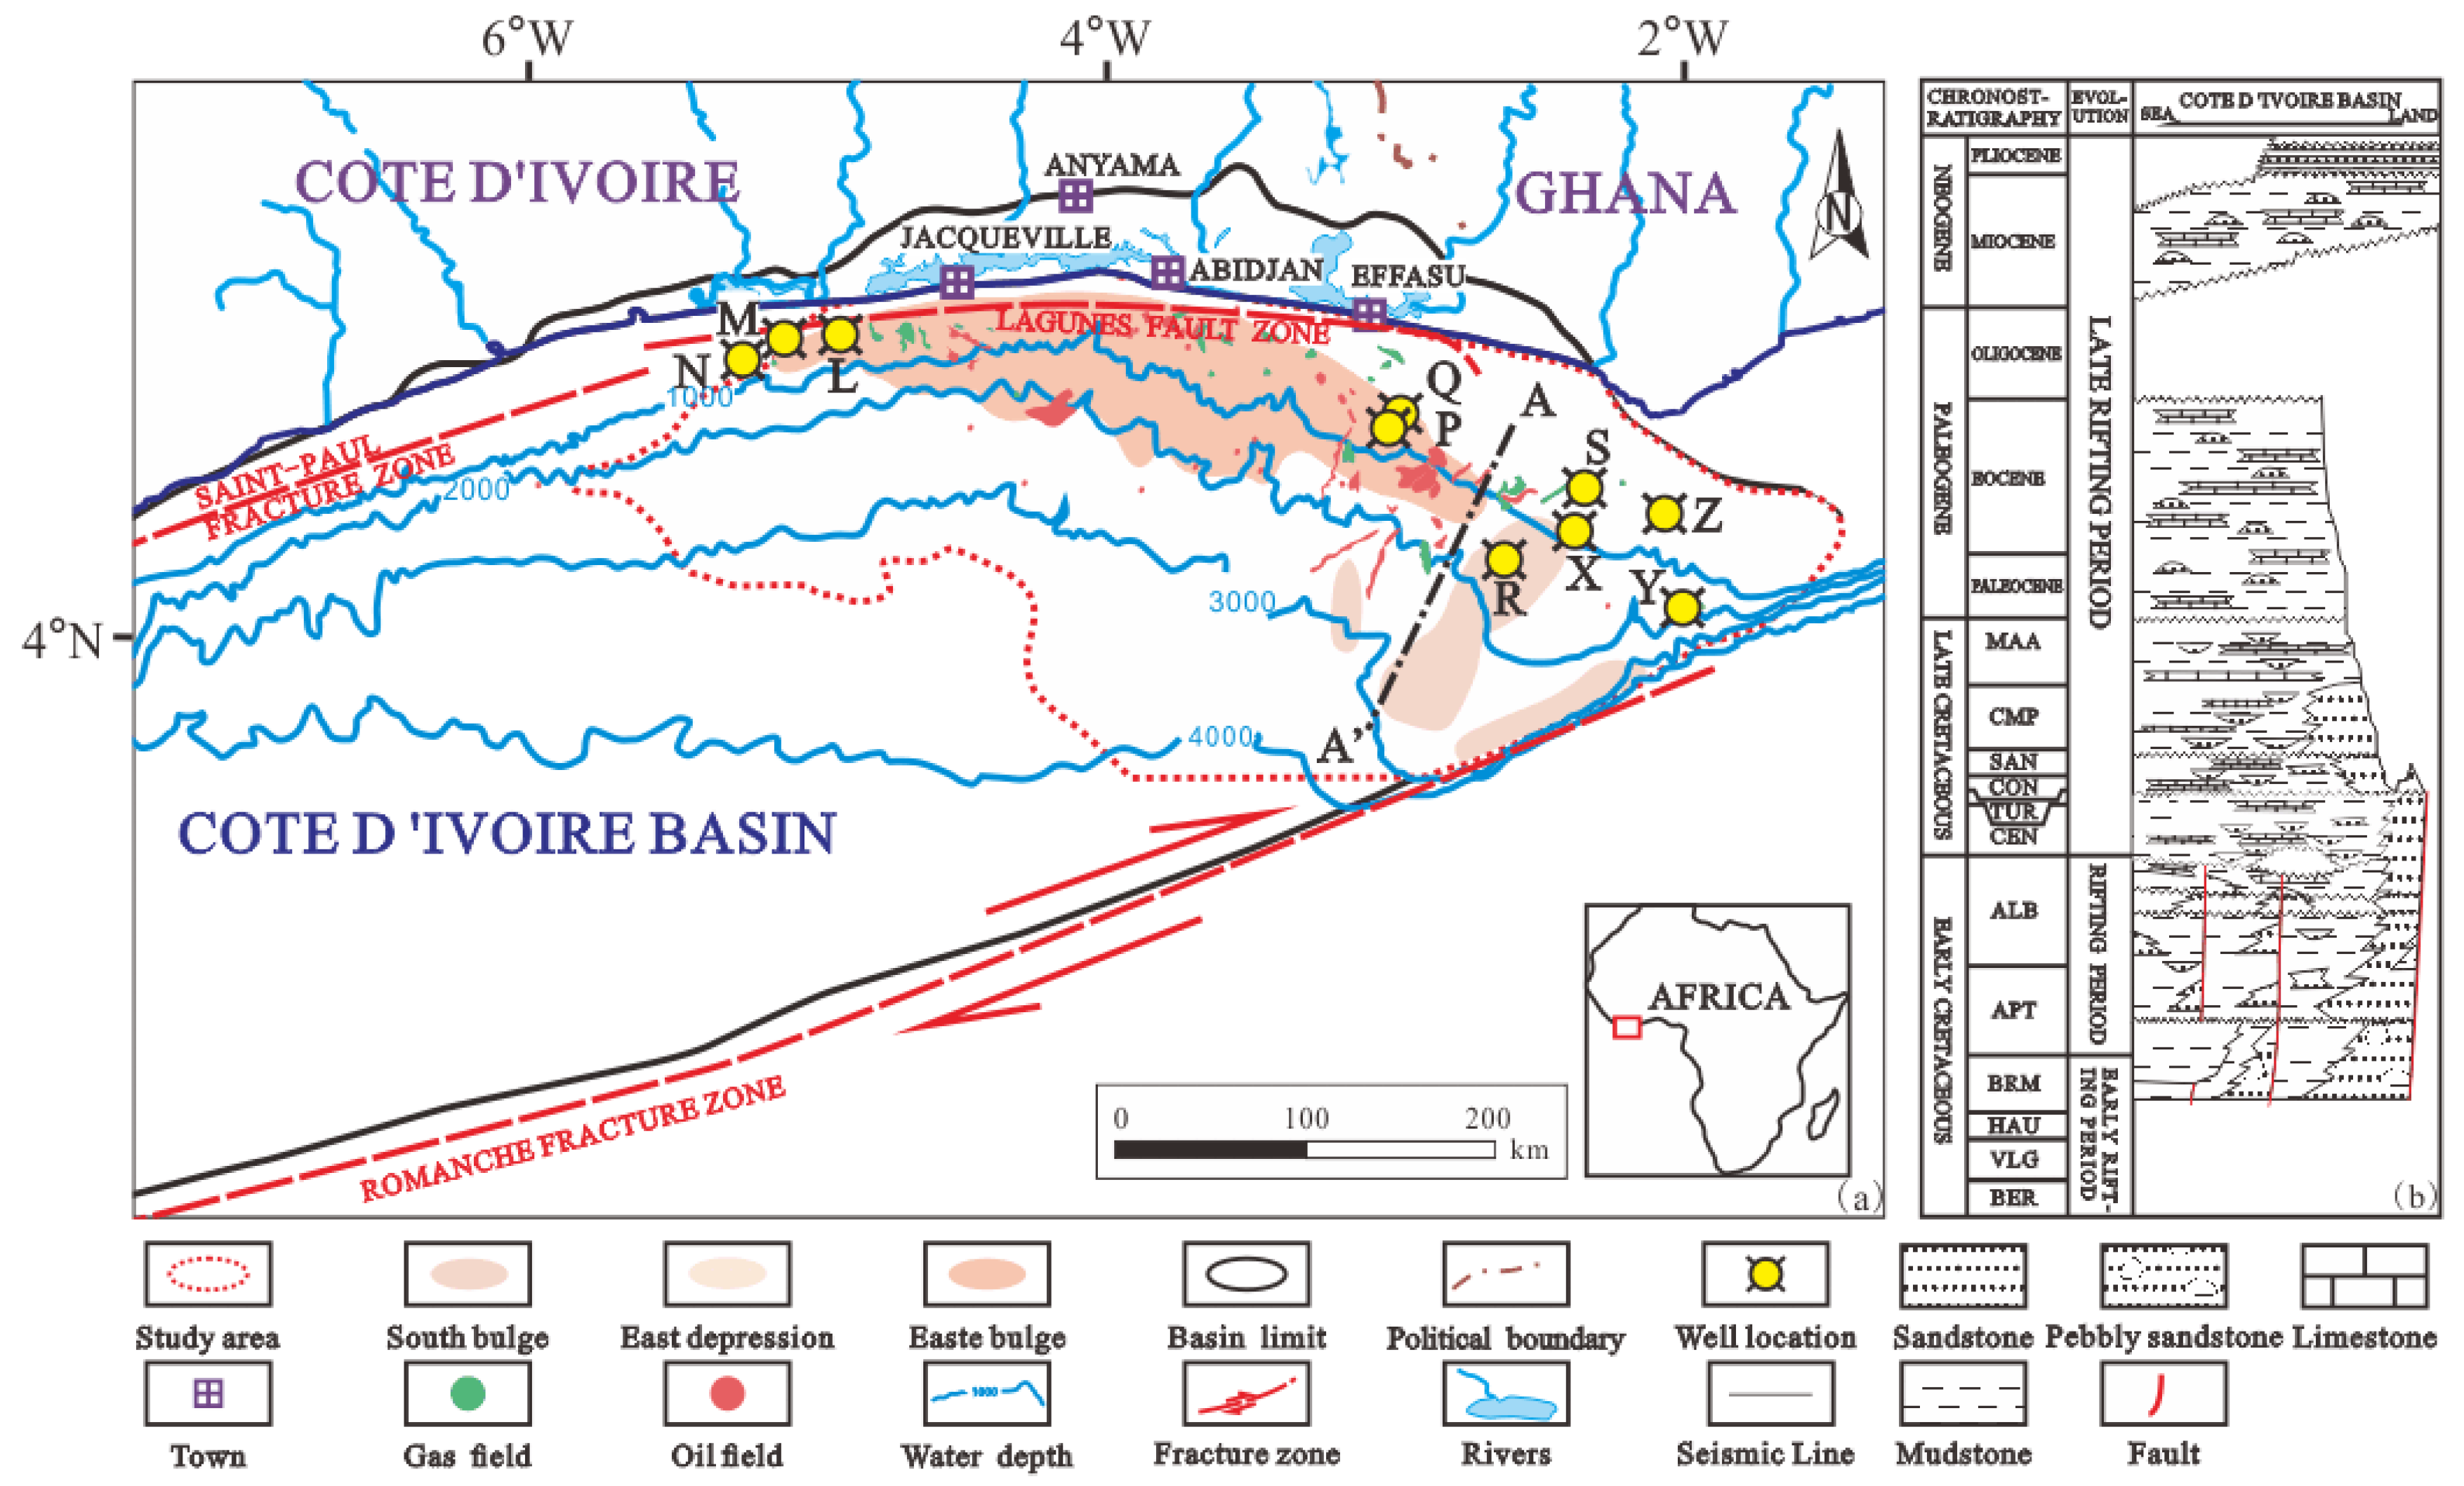
The Côte d’Ivoire Basin is located in the central part of West Africa and the northern part of the Gulf of Guinea (Figure 1). It extends from east to west [11] across Côte d’Ivoire and Ghana, extending to the offshore area of Ghana in the east and deep into the deep-sea area of Liberia in the southwest in a narrow strip with a total area of 185.5 × 10³ km2.

Figure 1.
Location and drilling distribution of the Côte d’Ivoire Basin (a) and column chart of formation filling (b) (Modified according to [12]).
The Côte d’Ivoire Basin developed in the middle of the Paleoproterozoic Craton, on the eastern edge of the Archean core of Guinea [12]. The northern part of the basin is controlled by the Saint-Paulo fracture zone and its overland extension, the Lagunes fault zone, which runs almost parallel to the coast of Côte d’Ivoire and Ghana. The south is controlled by the Romanche fracture zone and is connected to the Ghana shelf by the Côte d’Ivoire–Ghana conversion marginal ridge. These two giant transition fracture zones are the northern and southern boundaries of the basin [13,14,15]. In the basin, there are several fault zones with similar spacing and a nearly vertical strike to the coast, as well as two positive tectonic zones with a parallel strike to the coast–the Abidjan marginal tectonic zone and the Grand Lahou High. A number of NWW–SEE trending anticlinal structures and basement faults developed between the Grand Lahou High and the Jacqueville Trough [16,17], and most of the oil and gas fields discovered so far lie within this region (Figure 1a).
2.2. Basin’s Evolution Characteristics
In the Early Cretaceous period, the South American plate and the African plate rotated apart [18], and the equatorial Atlantic split to form the Côte d’Ivoire Basin, which constitutes a typical transformational passive continental margin basin [19].
The Côte d’Ivoire Basin has undergone three major stages of tectonic evolution [4,10,11,12,19]:
- (1)
- Early rift stage: early Cretaceous Berriasian–Barremian stage. During this period, strike-slip faults and tensile movements formed extensional grabens, in which sediments accumulated rapidly and developed thicker fluvial facies, deltaic facies, and lacustrine facies.
- (2)
- The rift stage: Aptian to late Albian in the Early Cretaceous. Due to the tension-torsion movement of continental cracking and transformation faults, some small folds, inversion faults, fault blocks, and half-grabens were formed. Fluvial facies, deltaic facies, and lacustrine facies of siliceous clastic rock deposits have developed. The Albian—Cenomanian unconformity was formed in the study area during the Late Albian stage when the African and South American plates separated.
- (3)
- Late rift stage: late Cretaceous Cenomanian to Holocene. During this stage, the continental margin subsidence formed steep slopes, and a large number of shovel faults and slump structures were formed. Thick layers of marine shale were deposited in most parts of the study area, and local carbonate deposits developed [20]. In the Oligocene, the whole West African margin was in the low sea level stage, with high levels of unconformity and less unconformity between the Santonian stage and the Campanian stage. Therefore, the late rift stage can be divided into three stages: early, middle, and late (Figure 1b).
2.3. Development of Source Rocks
Previous studies have suggested that the Côte d’Ivoire Basin is mainly composed of three sets of source rocks: Aptian, Albian, and Cenomanian–Turonian.
The Aptian-stage source rocks are mainly lacustrine shale, and the kerogen type is mainly type III, with an average TOC of 0.6 wt.%~2.6 wt.%. The parent material source is mainly terrestrial, with a small amount of marine organic matter, and the thin oil source interval and thick gas generation interval are interbedded. At present, it has only been drilled in Ghana and is a minor source rock, which may be found in deep-water areas in the future [21].
The Albian-stage source rocks can be divided into middle- and upper-Albian source rocks. The middle-Albian source rocks are lacustrine shale [22], which is the oldest source rock found in the Côte d’Ivoire Basin and has entered the gas generation stage [23]. The kerogen types are mainly type II and type III, with an average TOC of about 1.2 wt.%. The source rocks of the Upper Albian stage are marine shale and marl, and the kerogen type is mainly type II, with an average TOC of about 2.1 wt.%, which is mainly used for oil generation.
The main source rocks of the Cenomanian–Turonian stage are marine shale, and the kerogen type is mainly type II. The average TOC of the Cenomanian-stage source rocks is about 0.75 wt.%~2.6 wt.%, and the average TOC of the Turonian stage is about 5.5 wt.%. This set of source rocks extends in the deep-water direction, and the oil and gas in the Jubilee oilfield come from this set of source rocks [15].
3. Methods
A total of 10 wells in the study area were selected for the study, with a sampling interval of 5~10 m per well. A total of 955 samples were collected, including 190 each from wells R and X; 115 each from wells P and Q; 75 each from wells L, Z, and S; and 40 each from wells M, N, and Y. Dark mudstone and argillaceous sandstone were the mainly materials selected. Total organic carbon, rock pyrolysis, vitrinite reflectance, sporopollen color index, saturated hydrocarbon chromatography–mass spectrometry, and other tests were completed. The total organic carbon was measured using a CS444-type organic carbon analyzer (Hammond Manufacturing Company Limited, Guelph, ON, Canada). The specific method involved taking a power sample of about 0.1 g and placing it in a crucible, then leaving it to stand for 12 h with 5% hydrochloric acid to remove the carbonate. The sample was then washed repeatedly with high-purity water to a neutral state and then placed into the instrument for measurement. A YY3000A comprehensive evaluation instrument was used for the rock pyrolysis. The specific method involved first pulverizing the sample to a 100 mesh, and then putting it into the instrument for measurement. The reflectivity of vitrinite was measured using a UMSP-50 microspectrophotometer. The color index of the sporopoly was DIALUX-22EB. For the GC-MS analysis, an HP5890 GC/5970B MSD chromatograph and an HP6890 chromatograph were used for determination. The chromatographic column was HP-5MS (30 m × 0.25 mm × 0.5 μm), the carrier gas was helium (constant current mode, flow rate 1 mL/min), and the temperature was set to the initial temperature of 50 °C for 2 min. The temperature was raised to 310 °C at 2 °C/min and then maintained for 15 min, in accordance with the national standard GB/T 18606-2017 [24]. The geochemical characteristics and hydrocarbon generation potential of the Albian-stage source rocks were analyzed according to the experimental results. All analytical experiments were performed in the Geochemistry Laboratory of Yangtze University.
4. Results
4.1. Abundance of Organic Matter in Source Rocks
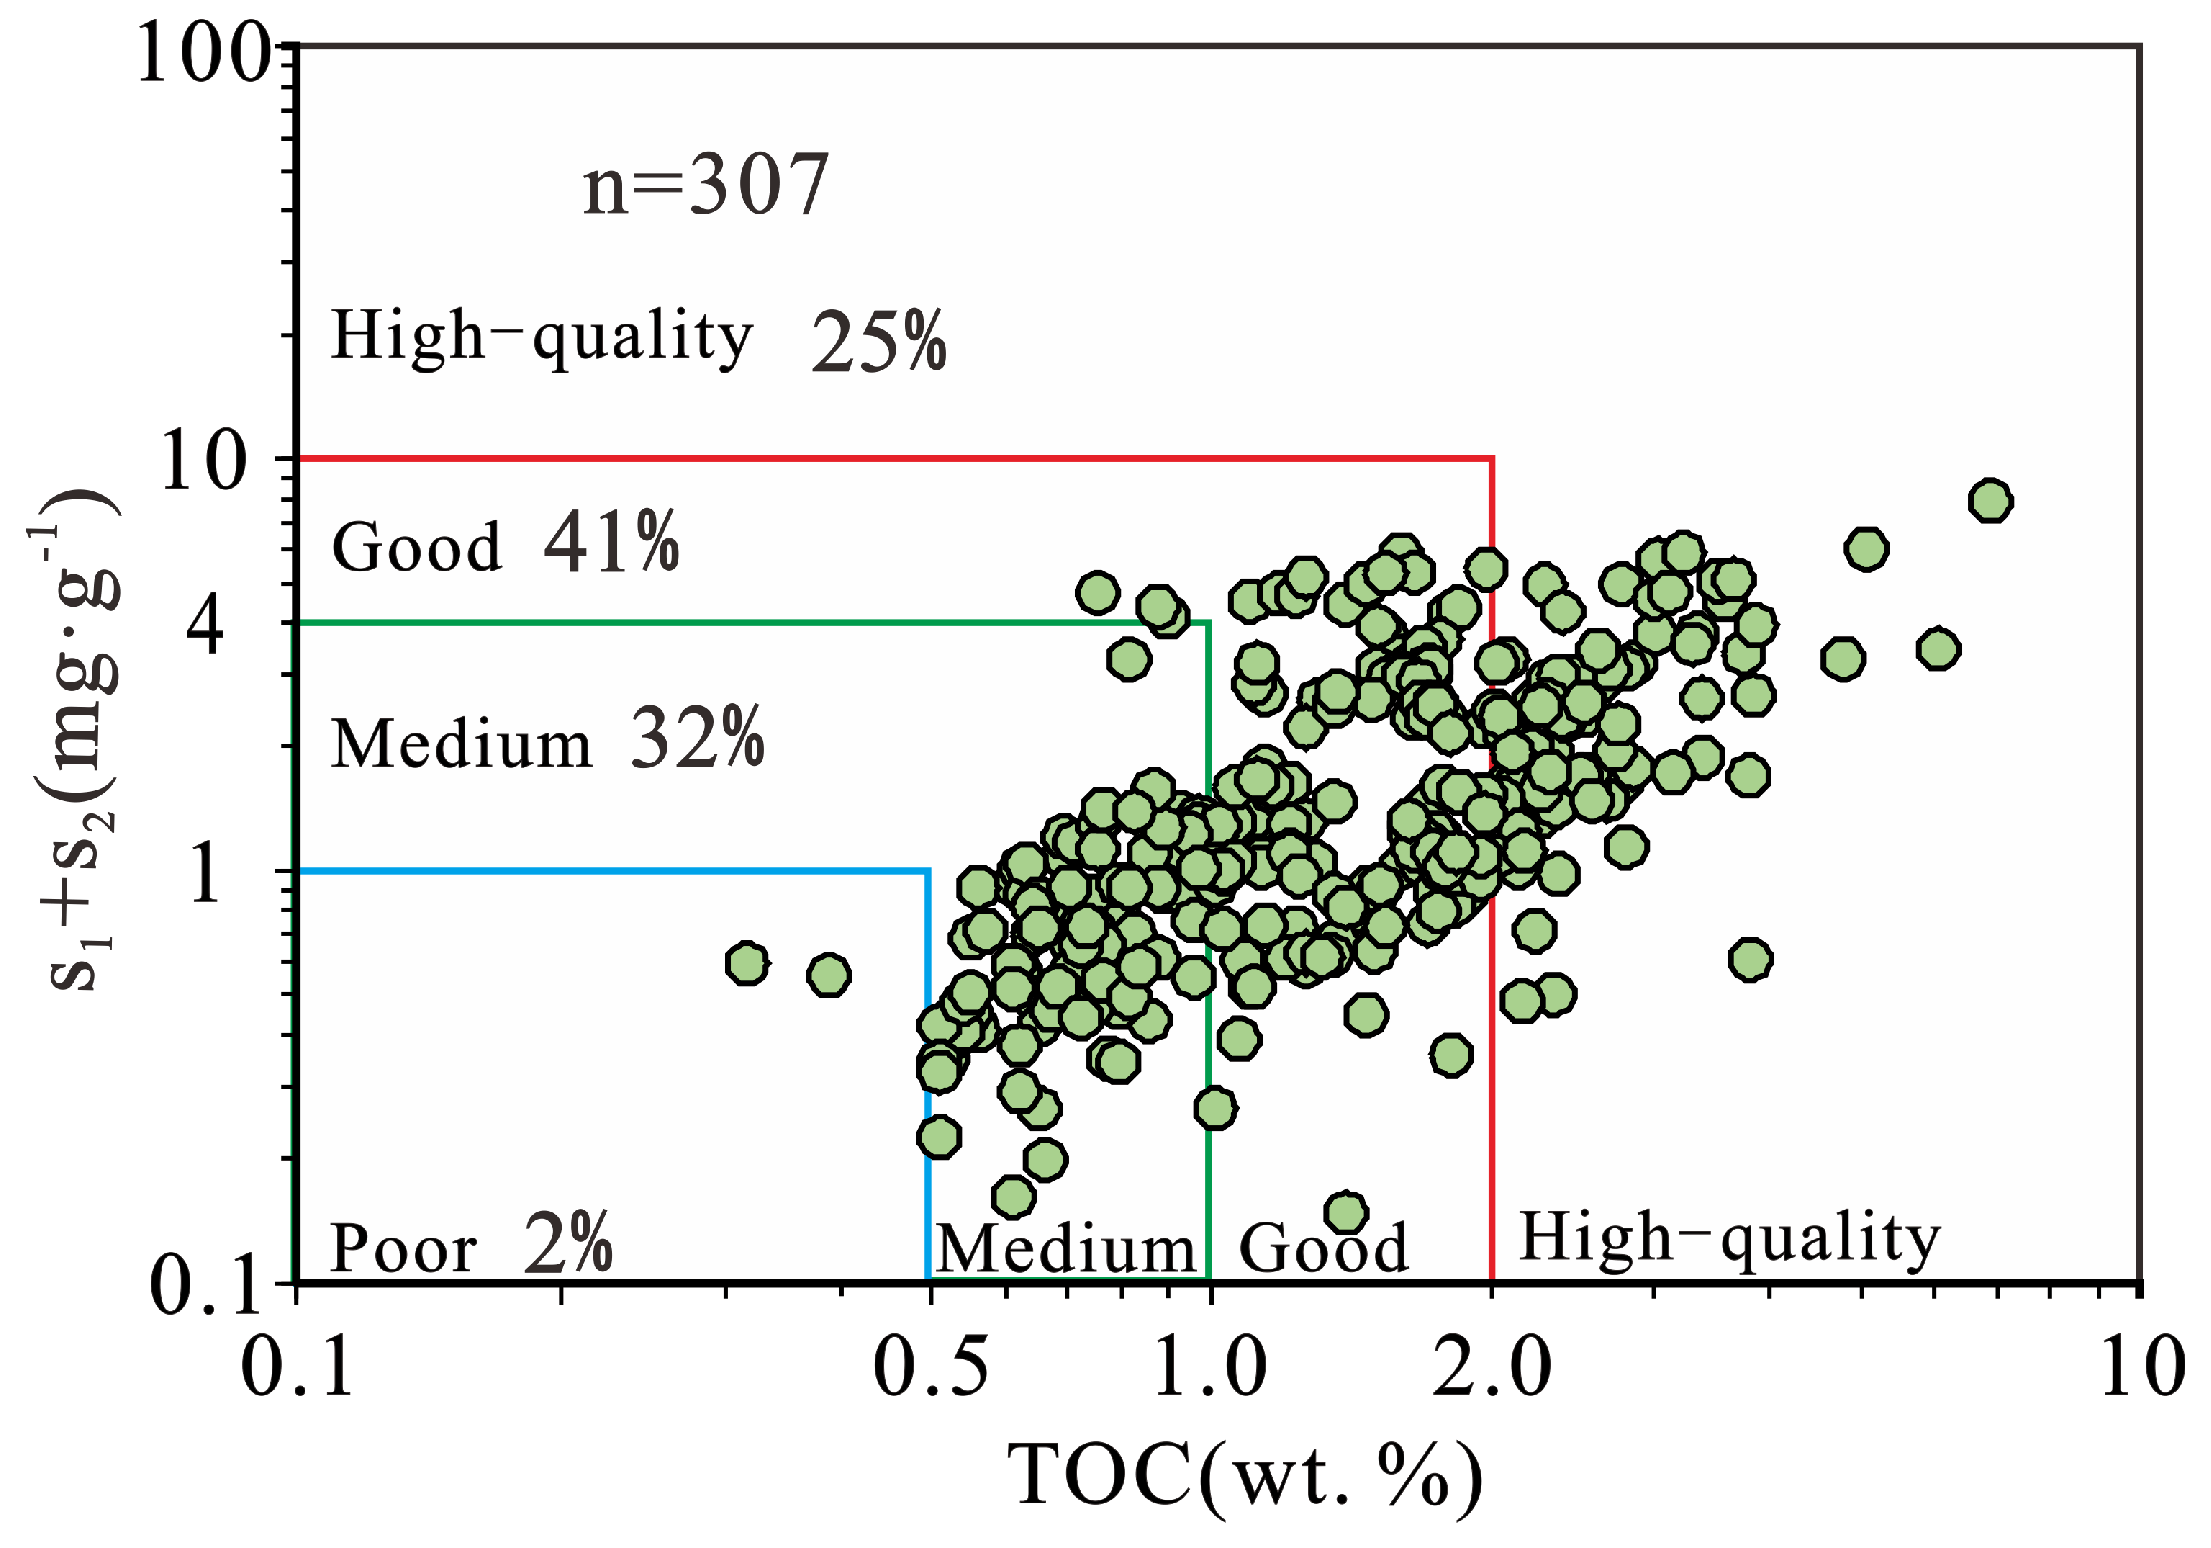
The formation of oil and gas is inseparable from the organic matter in the rock, and only when the organic matter reaches a certain level can an effective source rock be formed [25]. Therefore, the abundance of organic matter is an important basis for evaluating the hydrocarbon generation intensity of the source rock. In this study, the TOC and hydrocarbon generation potential of rock pyrolysis (S1 + S2) are used to evaluate the abundance of organic matter [6,7,26]. We referred to the standards of SY/T5735-2019, a geochemical evaluation method for source rocks issued by the China National Energy Administration when classifying the source rocks. According to the geochemical data of the source rock samples from 10 wells in the Côte d’Ivoire Basin, the TOC distribution of Lower-Cretaceous-Albian-stage source rocks ranges from 0.47 wt.% to 3.08 wt.%, with an average valus of about 2.63 wt.%. Among them, 32% of the samples have a TOC value between 0.5 and 1 wt.%, indicating that they are medium source rocks. A TOC value in the range of 1–2 wt.% indicates a good source rock, and 125 samples account for 41% of the total. The content of high-quality source rocks is high, with 77 samples accounting for a quarter of the total, and the overall abundance of organic matter is high. The results of the hydrocarbon generation potential S1 + S2 show that the data points of the Lower-Cretaceous-Albian-stage source rocks S1 + S2 are mainly distributed between 0.2 and 10.0 mg/g, with an average value of 4.06 mg/g, indicating good hydrocarbon generation potential (Figure 2). Among them, the mean TOC of the well located in the shallow water to deep-water area of the basin is about 1.1 wt.%, the abundance of organic matter is high, the mean of S1 + S2 is 6.3 mg/g; the hydrocarbon generation potential is good. The wells at the edge of the basin shelf have a mean TOC of about 1.5 wt.%, with a high abundance of organic matter, but an S1 + S2 value of 3.3 mg/g, indicating average hydrocarbon generation potential. In summary, the source rocks in the shallow–deep-water area of the study area belong to the high-quality source rocks with good hydrocarbon generation potential, while the source rocks near the shelf constitute medium–good source rocks with average hydrocarbon generation potential.

Figure 2.
S1 + S2 relationship with TOC of Lower-Cretaceous-Albian-stage source rocks in the Côte d’Ivoire Basin.
4.2. Types of Organic Matter in Source Rocks
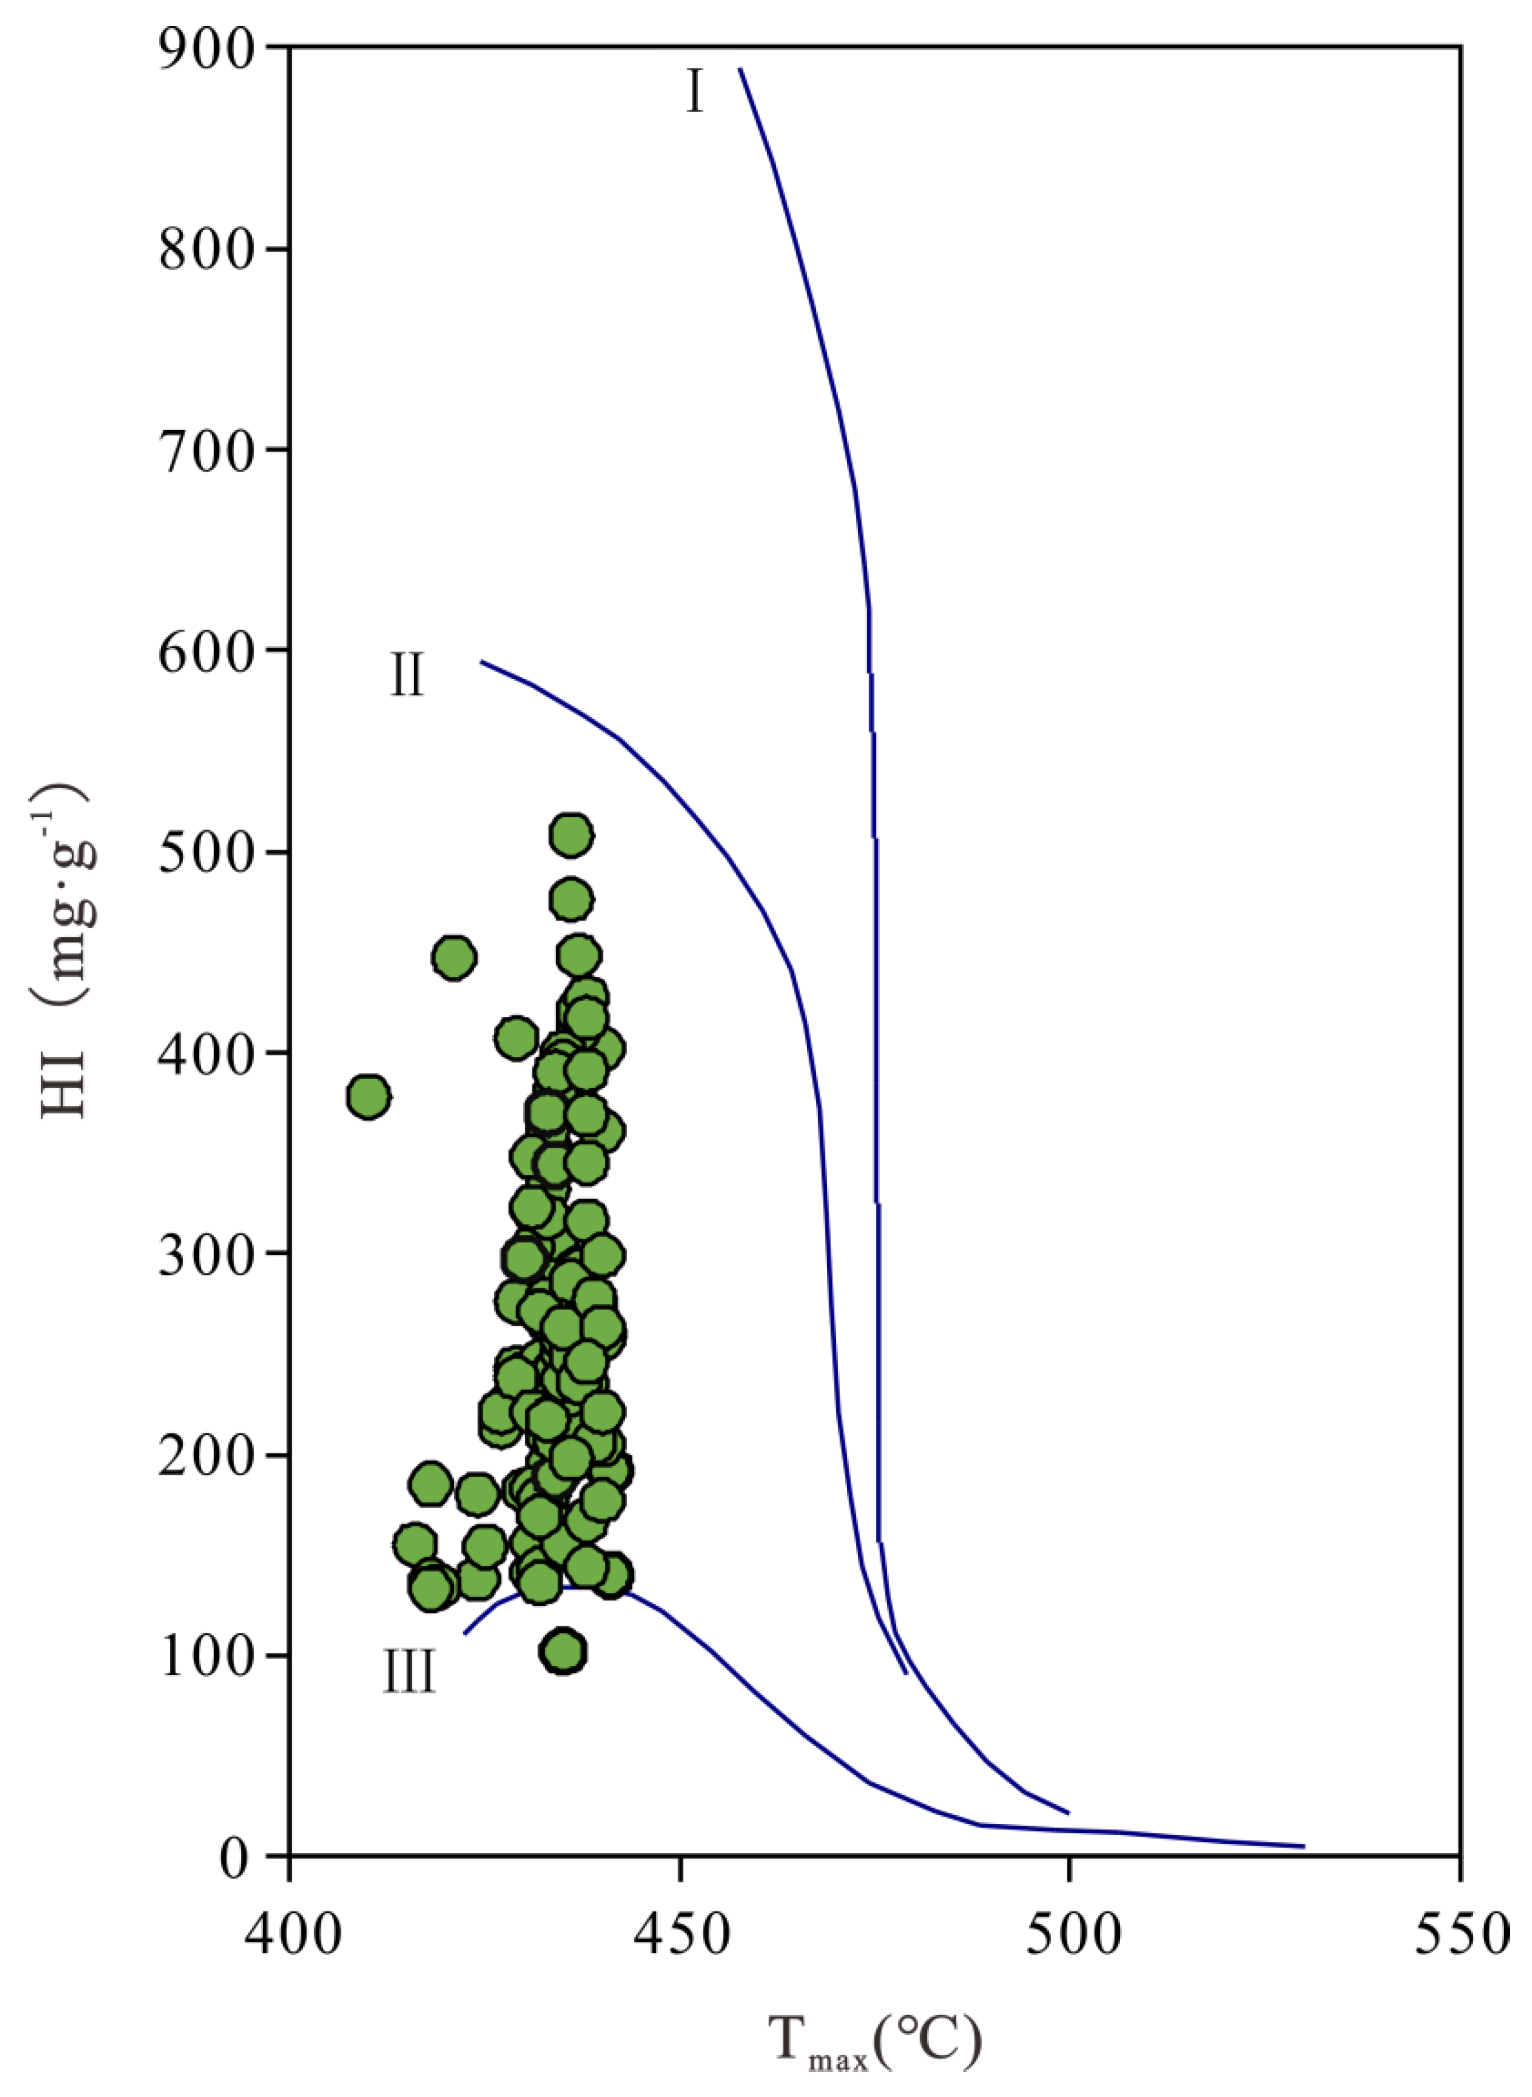
The type of organic matter is an important factor when evaluating the type and quantity of hydrocarbon generation; its type can reflect the ability of organic matter to generate oil or gas [27]. Here, the maximum pyrolysis peak temperature (Tmax) and hydrogen index (HI) are used to identify the organic matter types of the source rocks [6,7]. A total of 116 (n = 116) samples were selected from nine wells in the study area. The results show that the hydrogen index of the Lower-Cretaceous-Albian-stage source rocks in the Côte d’Ivoire Basin ranges from 100 to 550 mg/g, with an average value of 263.6 mg/g. The maximum pyrolysis peak temperature ranges from 420 to 445 °C, with an average value of 439 °C, and the values are concentrated in the range of 430–445 °C. Figure 3 shows the characteristics of mixed-type kerogen, mainly type II kerogen, and some sample sites were type III kerogen. This reflects the fact that the parent material of kerogen has the ability to generate oil and gas, and the organic matter source is mainly a mixture of lower aquatic organisms, such as algae, and higher terrestrial plants [28,29].

Figure 3.
Classification of the pyrolytic kerogen of Lower-Cretaceous-Albian-stage source rocks in the Côte d’Ivoire Basin.
4.3. Maturity of Organic Matter in Source Rocks
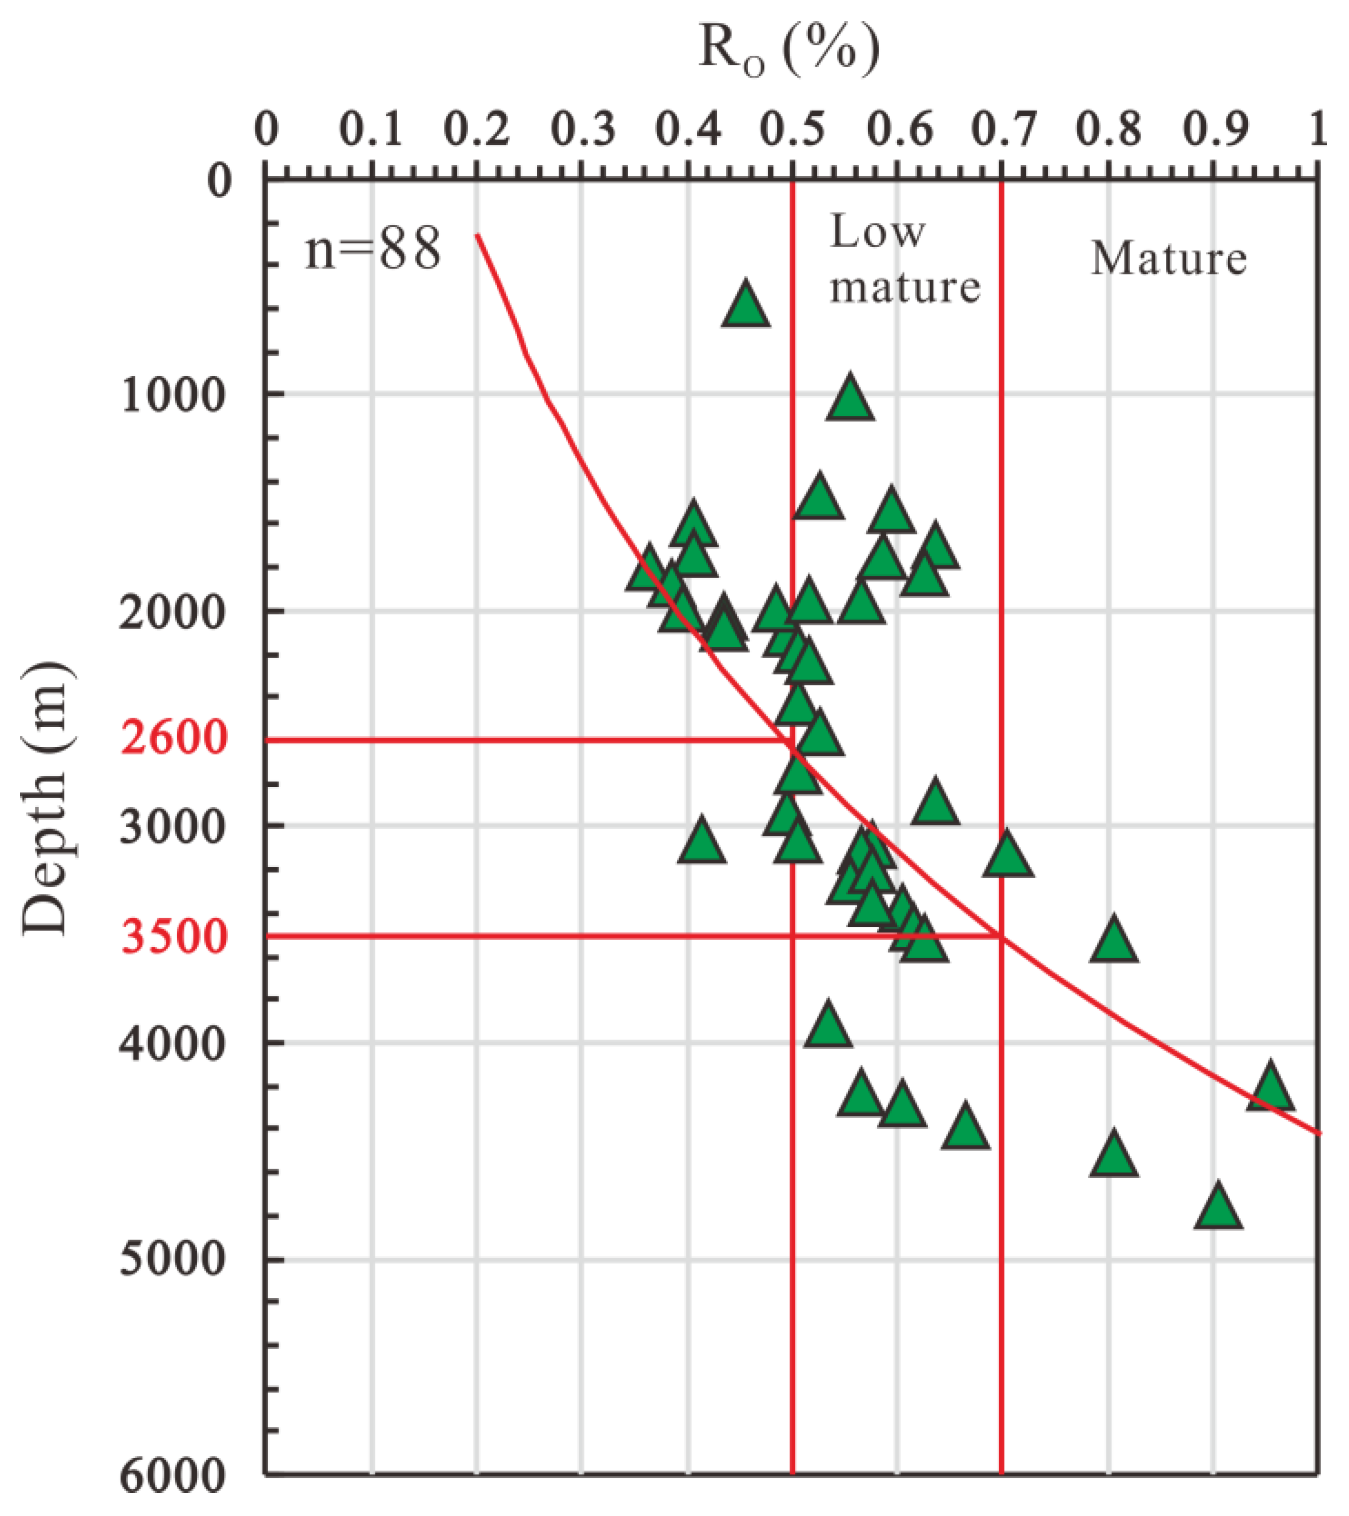
The Lower-Cretaceous-Albian-stage source rocks in the Côte d’Ivoire Basin have high abundance and goog types of organic matter, but the organic matter can only be transformed into oil and gas through thermal evolution [30]. The maturity of the organic matter is an indicator reflecting the degree of thermal evolution and is an important basis for evaluating the type and production of oil and gas [9]. The vitrinite reflectance ranges from 0.3% to 0.9%, with an average of about 0.5%. The RO of 64 samples was more than 0.5%, indicating that it has entered the low-mature to mature stage; 5.6% of the samples have an RO value greater than 0.7%, constituting the mature stage, and all of the samples are in the low-mature to mature stage. As shown in Figure 4, when the burial depth is about 2600 m, the vitrinite reflectance reaches 0.5%, and the organic matter reaches the threshold of hydrocarbon generation and begins to generate oil. When the burial depth is about 3500 m, the vitrinite reflectance reaches 0.7%, enters the mature stage, and begins to generate a large amount of oil (Figure 4).
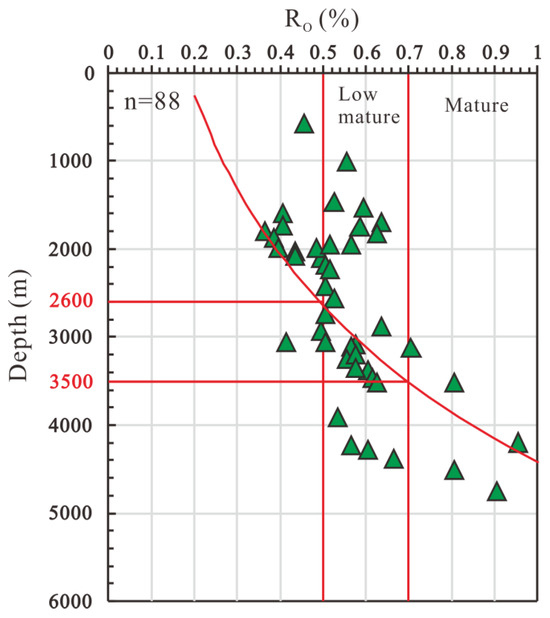
Figure 4.
Relation diagram of the vitrinite reflectance and depth of Lower-Cretaceous-Albian-stage source rock in the Côte d’Ivoire Basin.
4.4. Biomarker Compounds
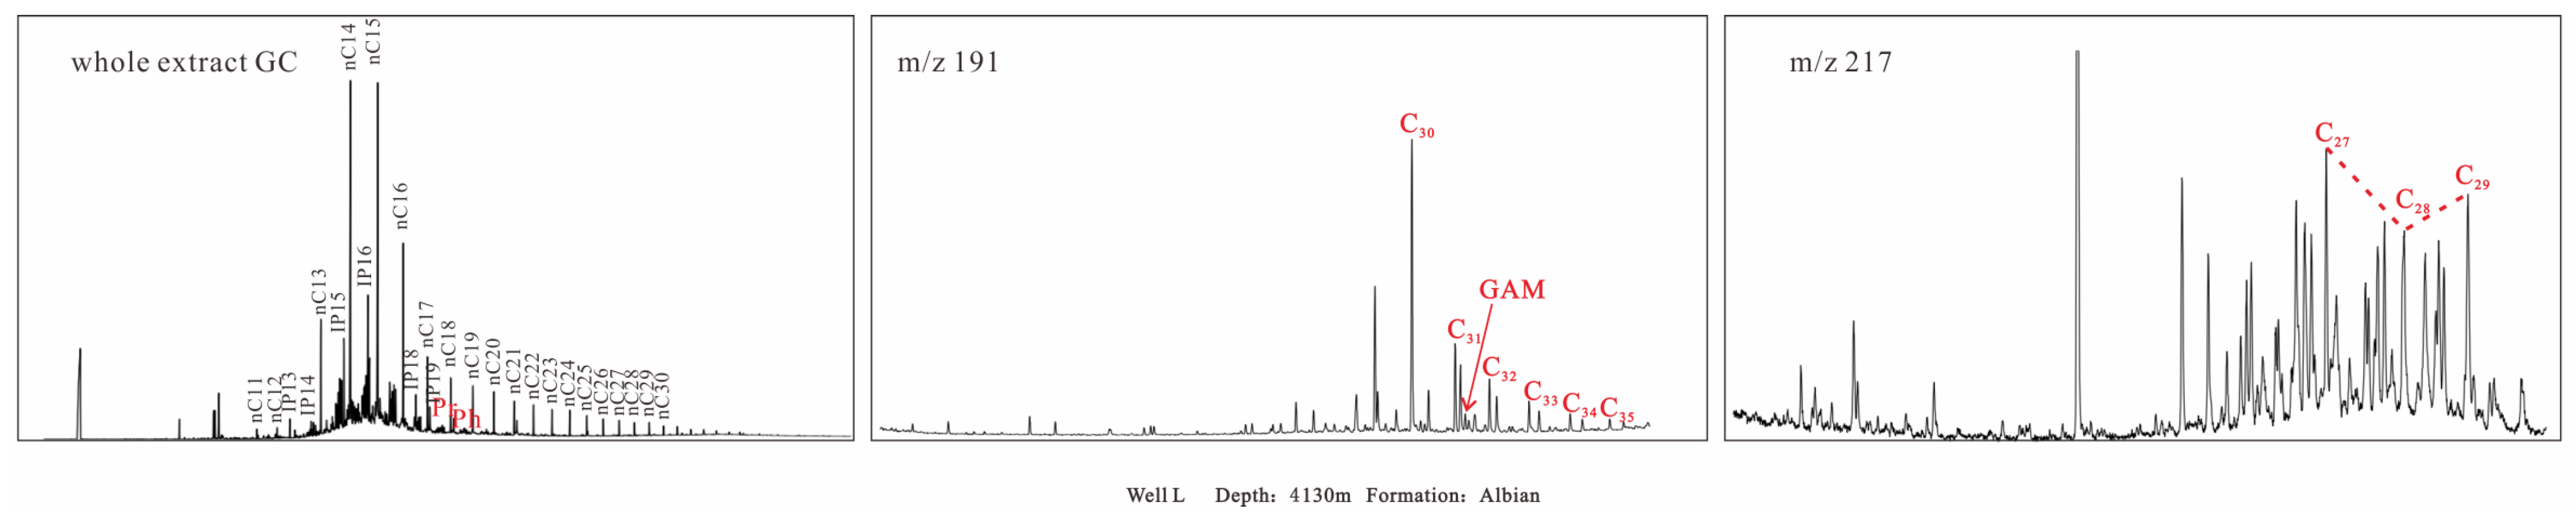
The special and stable structures of biomarkers that allow for little or no change during thermal evolution can be used to identify and trace information about the parent material of source rocks [31]. The organic molecular and geochemical characteristics of Well L in the Côte d’Ivoire Basin show that, according to the m/z 191 mass chromatogram, the Pr/Ph of the source rocks is greater than 1, indicating a weak oxidation–weak reduction environment. The C30 hopane content is the highest, the kurtosis of C31-homohopane to C35-homohopane is gradually reduced, and C34-homohopane and C35-homohopane are almost not visible, indicating that organic matter is preserved under weak reduction conditions [32,33]. Moreover, the gammacerane index is 0.06, indicating that there is no obvious stratification in the water body during the deposition period. The salinity has no significant effect on the preservation of organic matter [34]. Via whole extract GC analysis, the main peak carbon number was found to be mainly nC14, the main peak carbon number is low, which shows that the parent material of the Lower-Cretaceous-Albian-stage source rock in the Côte d’Ivoire Basin is mainly algae and other lower-aquatic organisms [35]. The mass spectrum of m/z 217 shows (Figure 5) that the abundance of C27 regular steranes is high, while that of C28 and C29 regular steranes is relatively low, and the three are distributed in an “L” shape, indicating that the parent material is mainly from microalgae, but there are also mixed inputs of higher terrestrial plants [36,37].
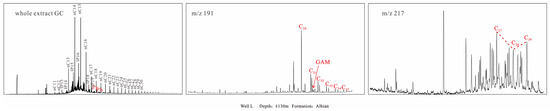
Figure 5.
Mass chromatography of biomarker compounds in the Lower-Cretaceous-Albian-stage source rocks of the Côte d’Ivoire Basin.
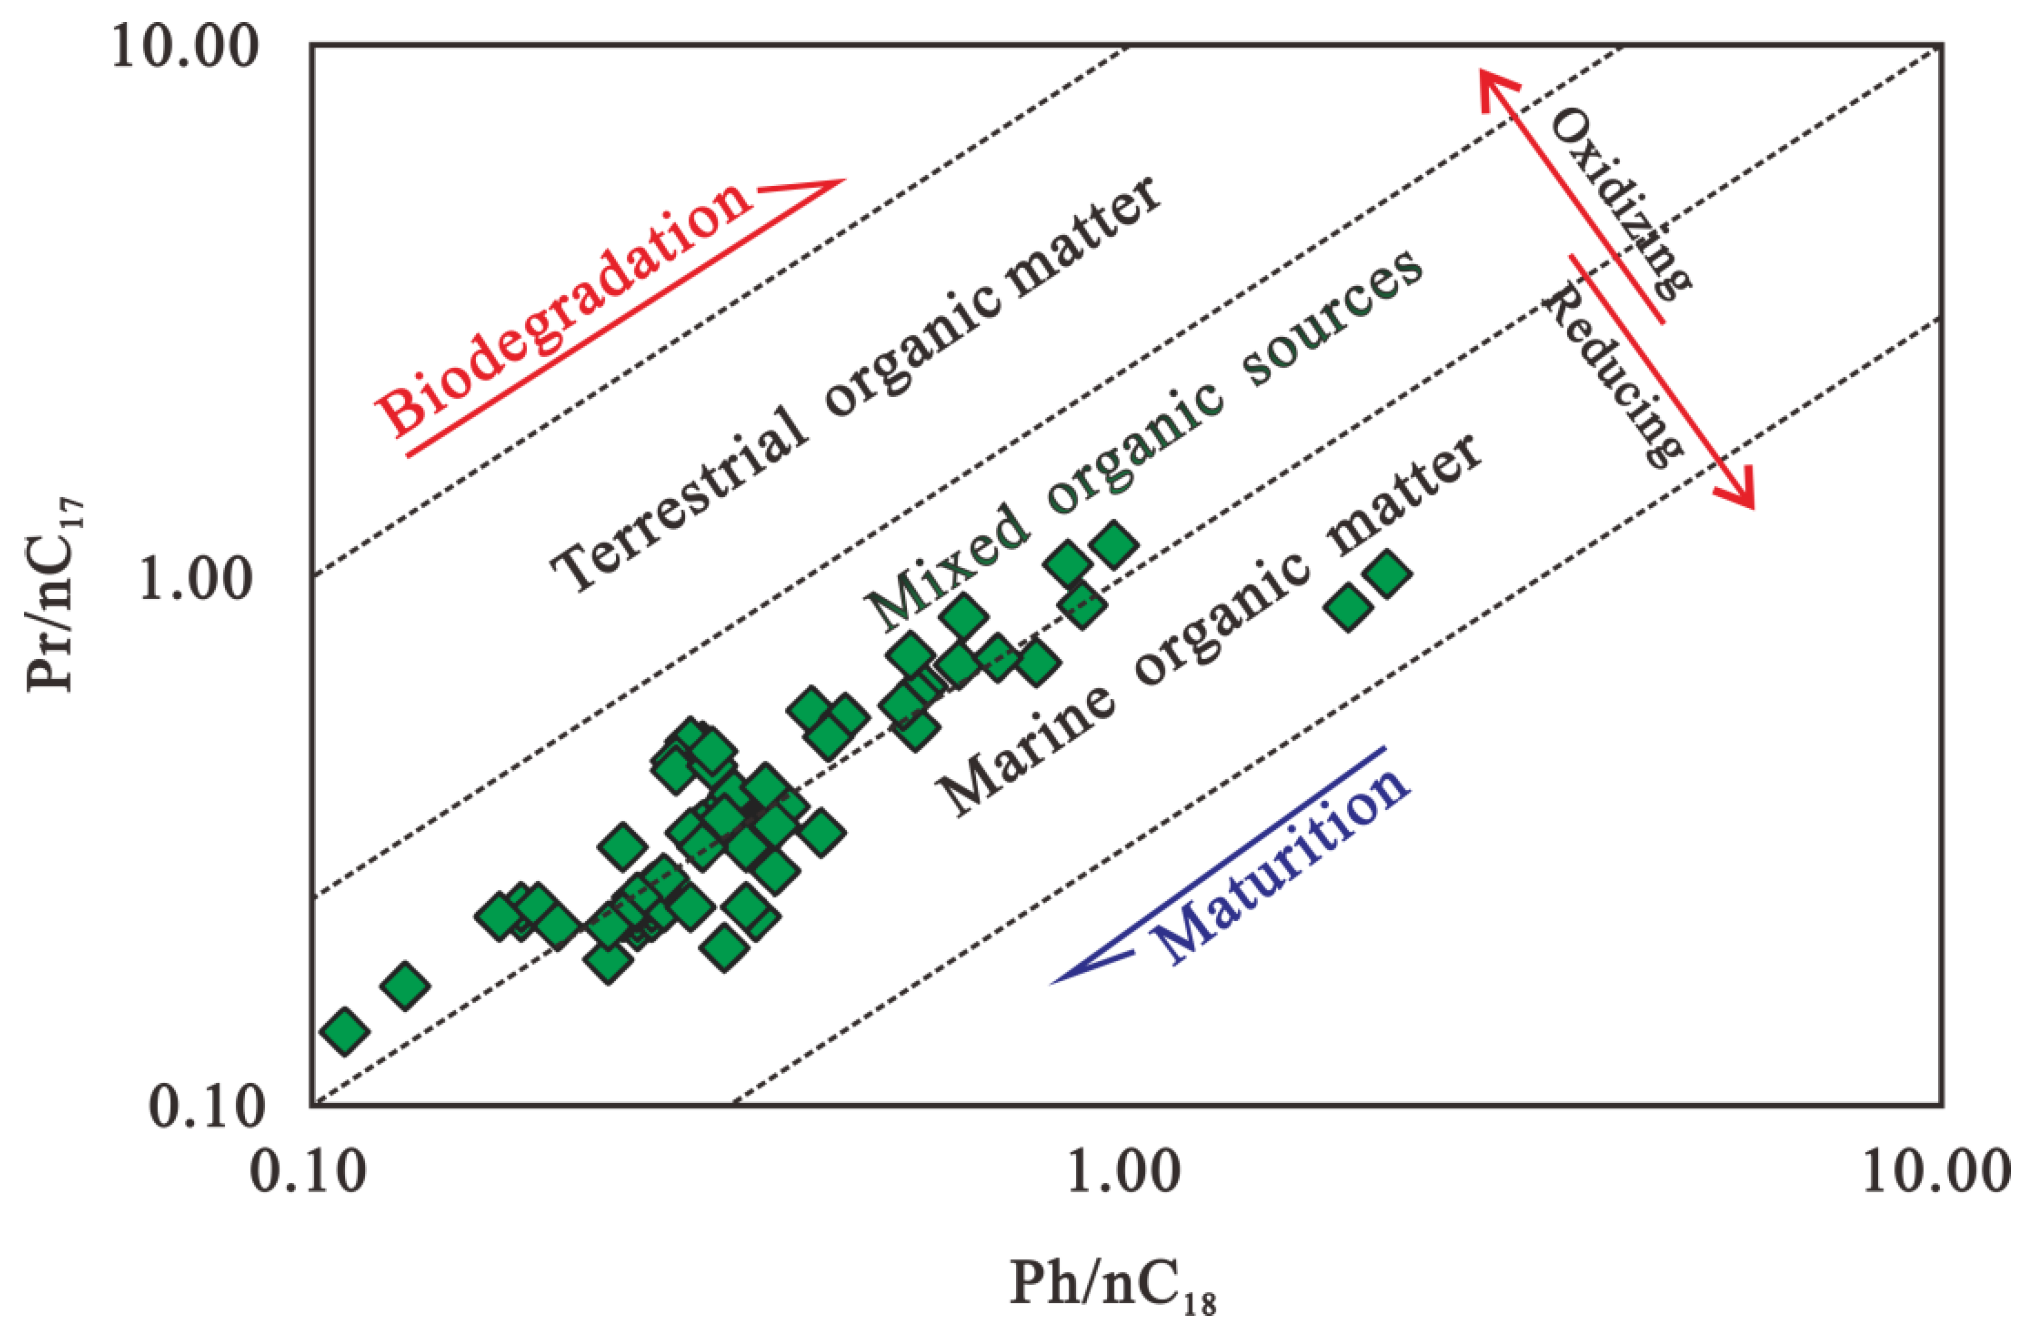
Pristane (Pr) and phytane (Ph) are the two most common types of isoprene in the source rocks, and the Pr/Ph is an important index reflecting the source of the parent material and the sedimentary environment [38,39]. Based on the available data, the Pr/nC17 and Ph/nC18 crossplot (Figure 6) is established. The results show that the sedimentary environment of the Lower Cretaceous source rocks in the Côte d’Ivoire Basin is in a transition environment of oxidation-reduction, which is more conducive to the preservation of organic matter [40,41].
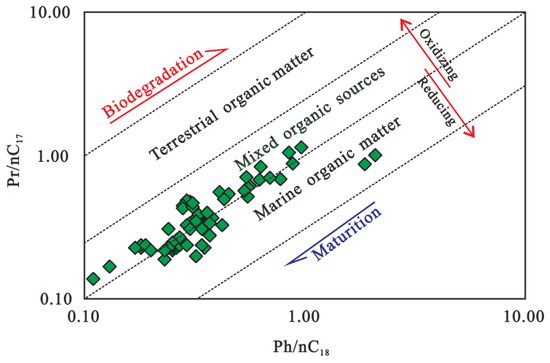
Figure 6.
Pr/nC17 and Ph/nC18 crossplot of Lower-Cretaceous-Albian-stage source rocks in the Côte d’Ivoire Basin.
5. Prediction of Source Rock Distribution
5.1. Total Organic Carbon Method
Passey et al. [42] overlapped the resistivity curve with the acoustic wave time difference curve and found that the curves in the non-source-rock segment basically overlapped, while the curves in the source rock segment formed obvious intervals. The value at the time of overlap is taken as the baseline value and the amplitude difference at the time of the interval is expressed using the ΔlogR method, an empirical formula for the conversion between ΔlogR and TOC, which is currently a commonly used method for predicting the distribution of source rocks with well logging at present. However, there are many parameters involved in this method that need to be determined manually, which can easily makes it easy to cause errors due to subjective judgments [43]. According to the existing logging data in the study area, combined with the improved method developed by Zhu Guangyou et al. [44], we propose a relationship suitable for the study area:
where R is the measured resistivity (Ω·m); DT is the sonic time difference (μs/m); and a, b, and c are the coefficients, which are obtained via the multiple regression analysis of the measured value of the sample.
TOC = a × logR + b × DT + c
The 37 measured TOC values of the nine wells in the basin, the corresponding acoustic time difference, and the resistivity value are analyzed via multiple regression according to Formula (1), and the values of a, b, and c are obtained. Thus, the logging prediction model for the Lower-Cretaceous-Albian-stage source rocks in the Côte d’Ivoire Basin is obtained:
TOC = 0.728 × logR + 0.033 × DT − 1.432
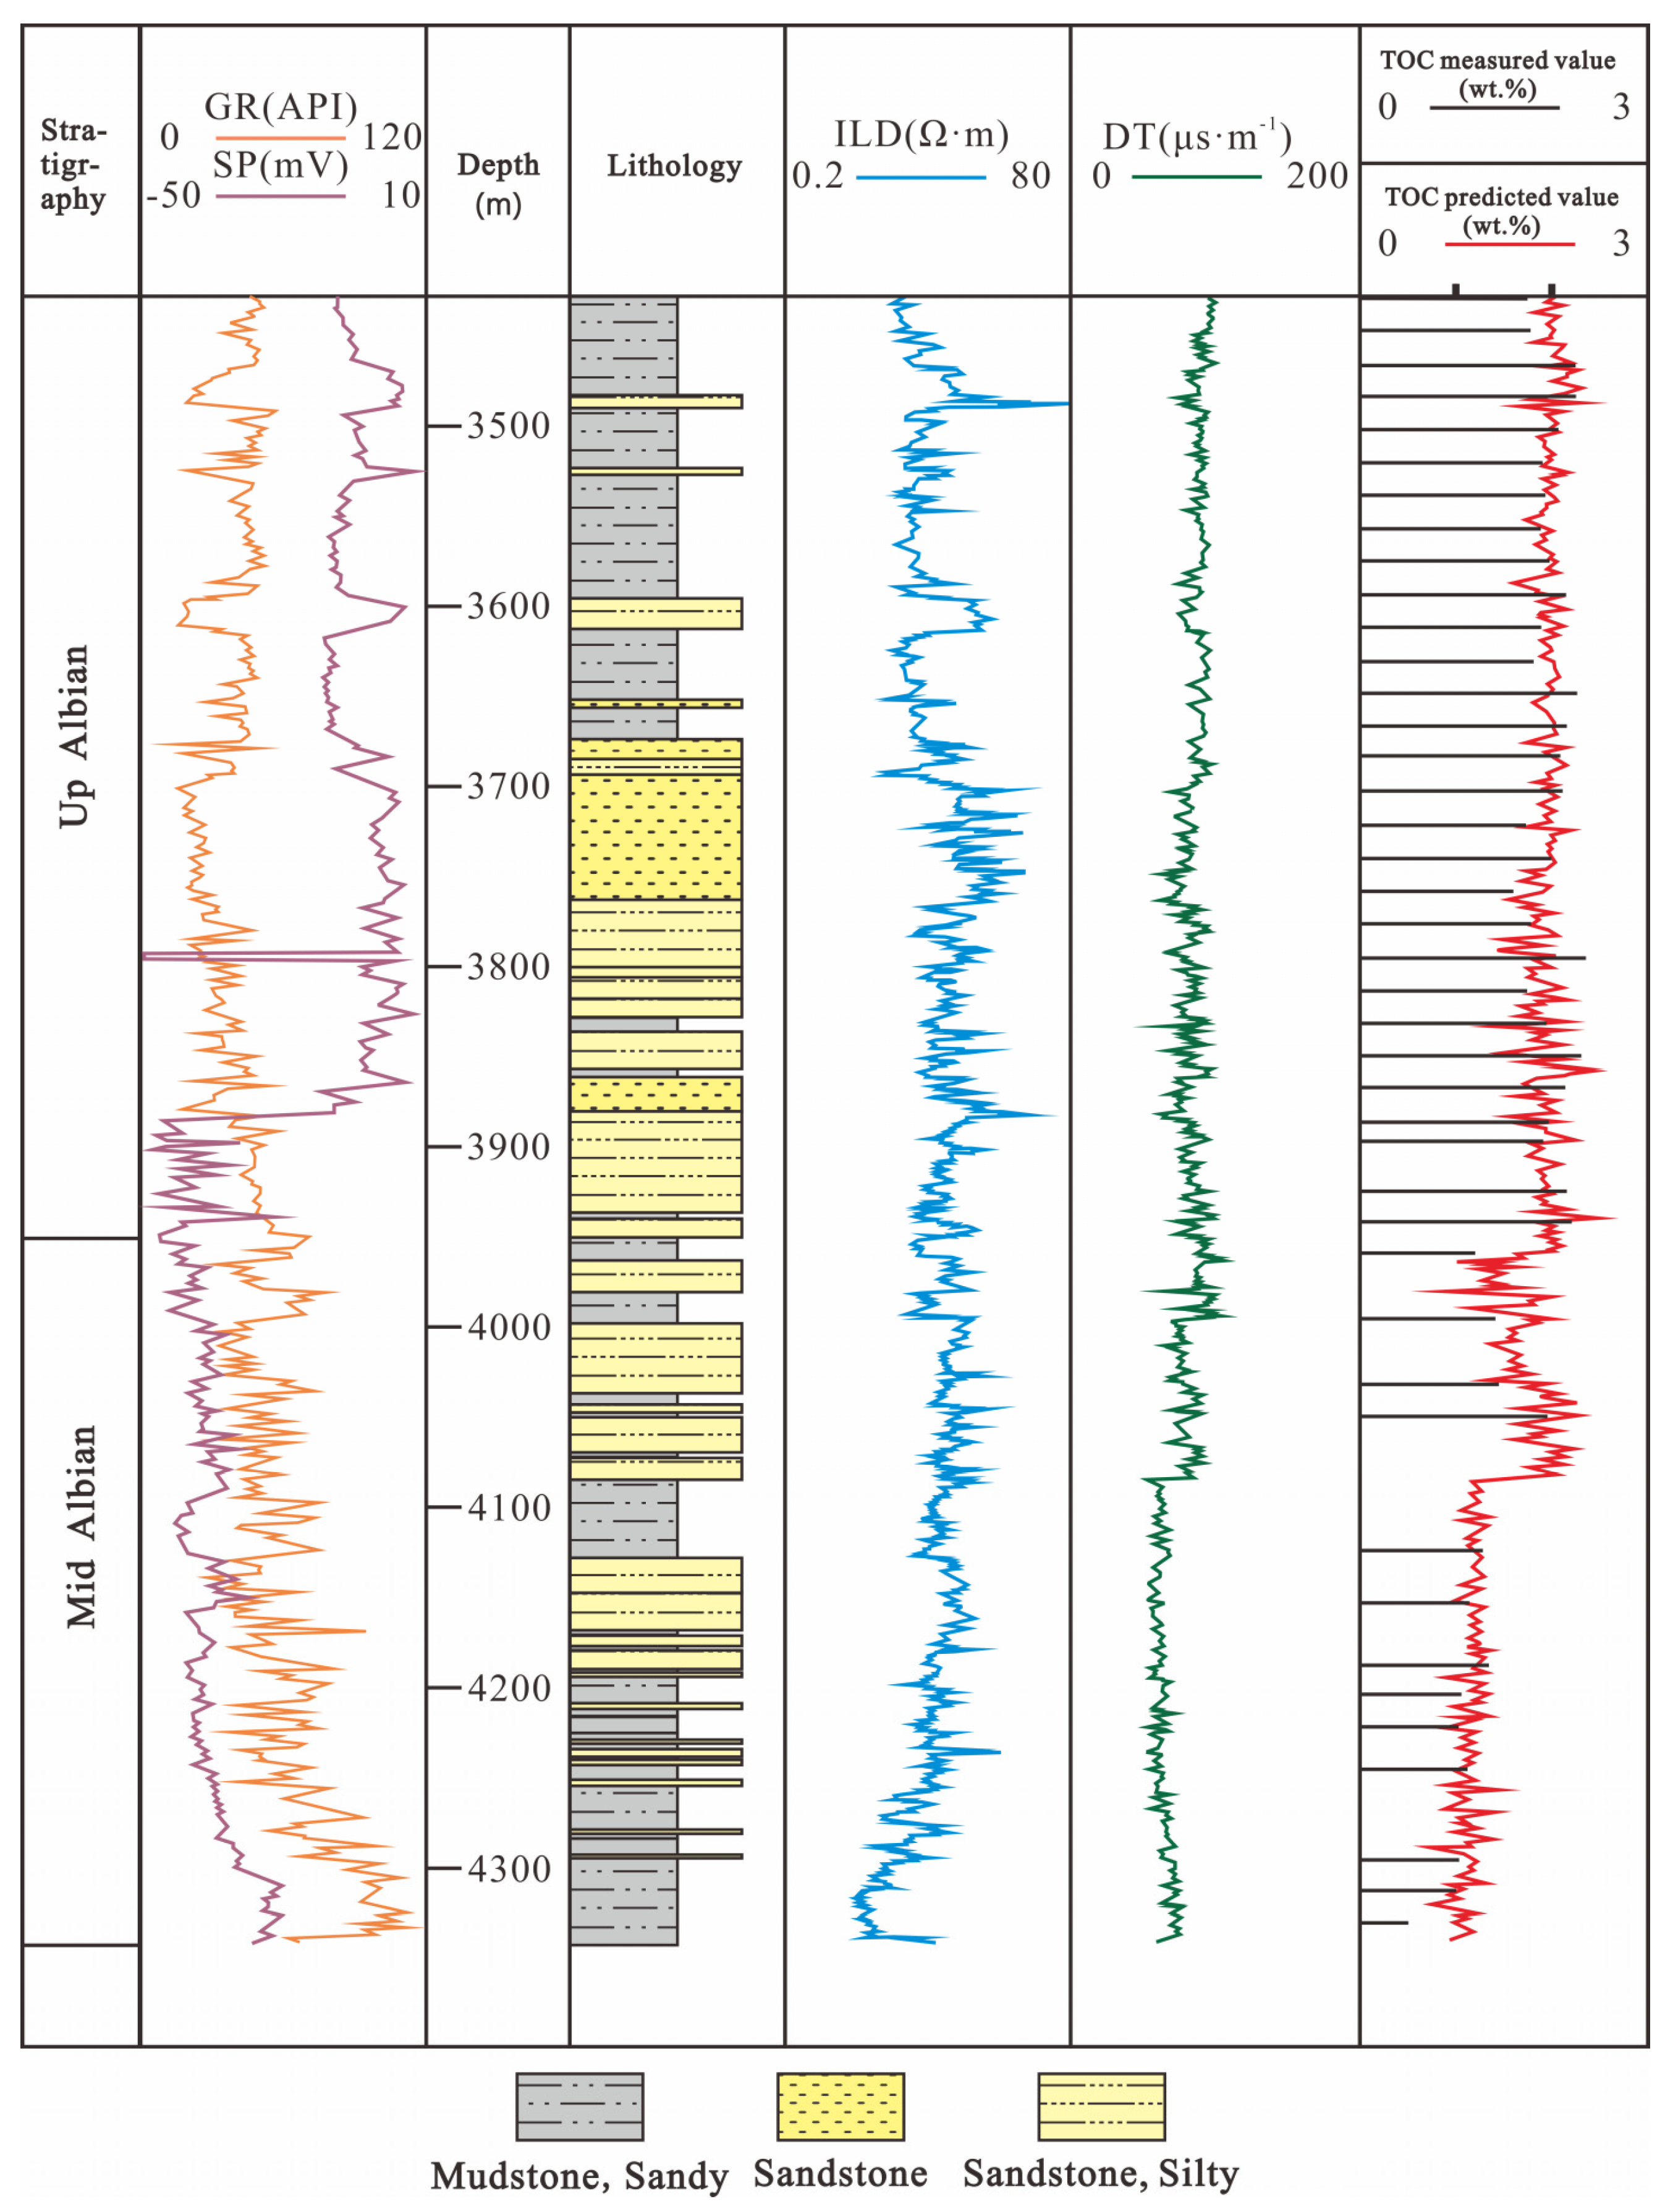
This method was used to predict the source rocks in the area, and the measured TOC value was compared with the predicted log TOC value. We calculated the correlation coefficient R2 = 0.8083, indicating that the prediction accuracy of TOC was high (Figure 7), and this method was adopted for the whole area. In order to verify the universality of the model, Well X was selected for verification. The predicted total organic carbon content value was compared with the measured total organic carbon content value, and the results showed a high level of agreement between them, indicating that the logging interpretation model made using this method was more accurate (Figure 8).
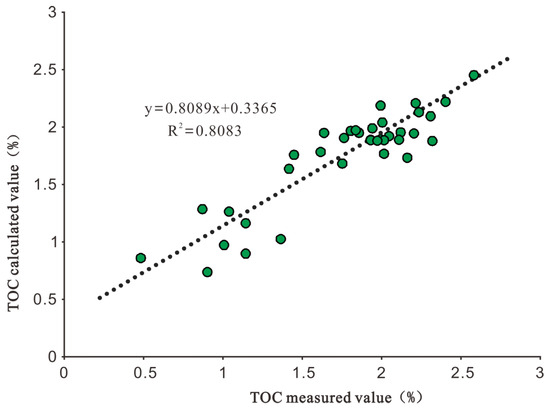
Figure 7.
Correlation between measured the TOC (green circles) and predicted TOC (dotted line) of Lower-Cretaceous-Albian-stage source rocks in the Côte d’Ivoire Basin.

Figure 8.
Comparison between the predicted TOC and measured TOC of a single well of Lower-Cretaceous-Albian-stage source rocks in the Côte d’Ivoire Basin. GR = natural gamma, SP = spontaneous potential, ILD = induction resistivity, DT = sonic differential time.
The method was applied to each single well in the study area to predict the TOC value of the source rock, and the plane distribution of the TOC in the study area was obtained after taking the average value (Figure 9). In the deep basin near Well R, the TOC values are generally high, with an average value greater than 4 wt.%, indicating the good quality of the source rocks. But the TOC value is low in Wells M, N, L, Y, and other wells at the edge of the basin, with a maximum value of about 1 wt.%. From the center of the basin to the edge of the transition area, wells such P and X have TOC values of about 2 wt.%–3 wt.%. The source rocks in the central area of the basin are obviously better than those in the peripheral area.
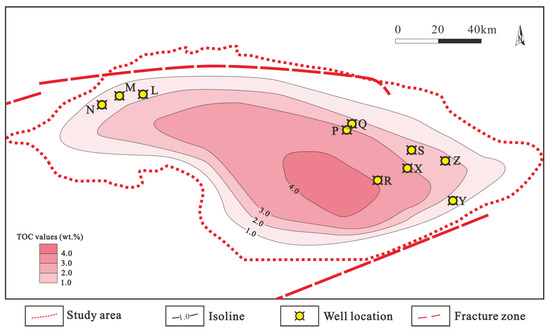
Figure 9.
TOC calculation plane distribution of Lower-Cretaceous-Albian-stage source rocks in the Côte d’Ivoire Basin.
5.2. Seismic Method
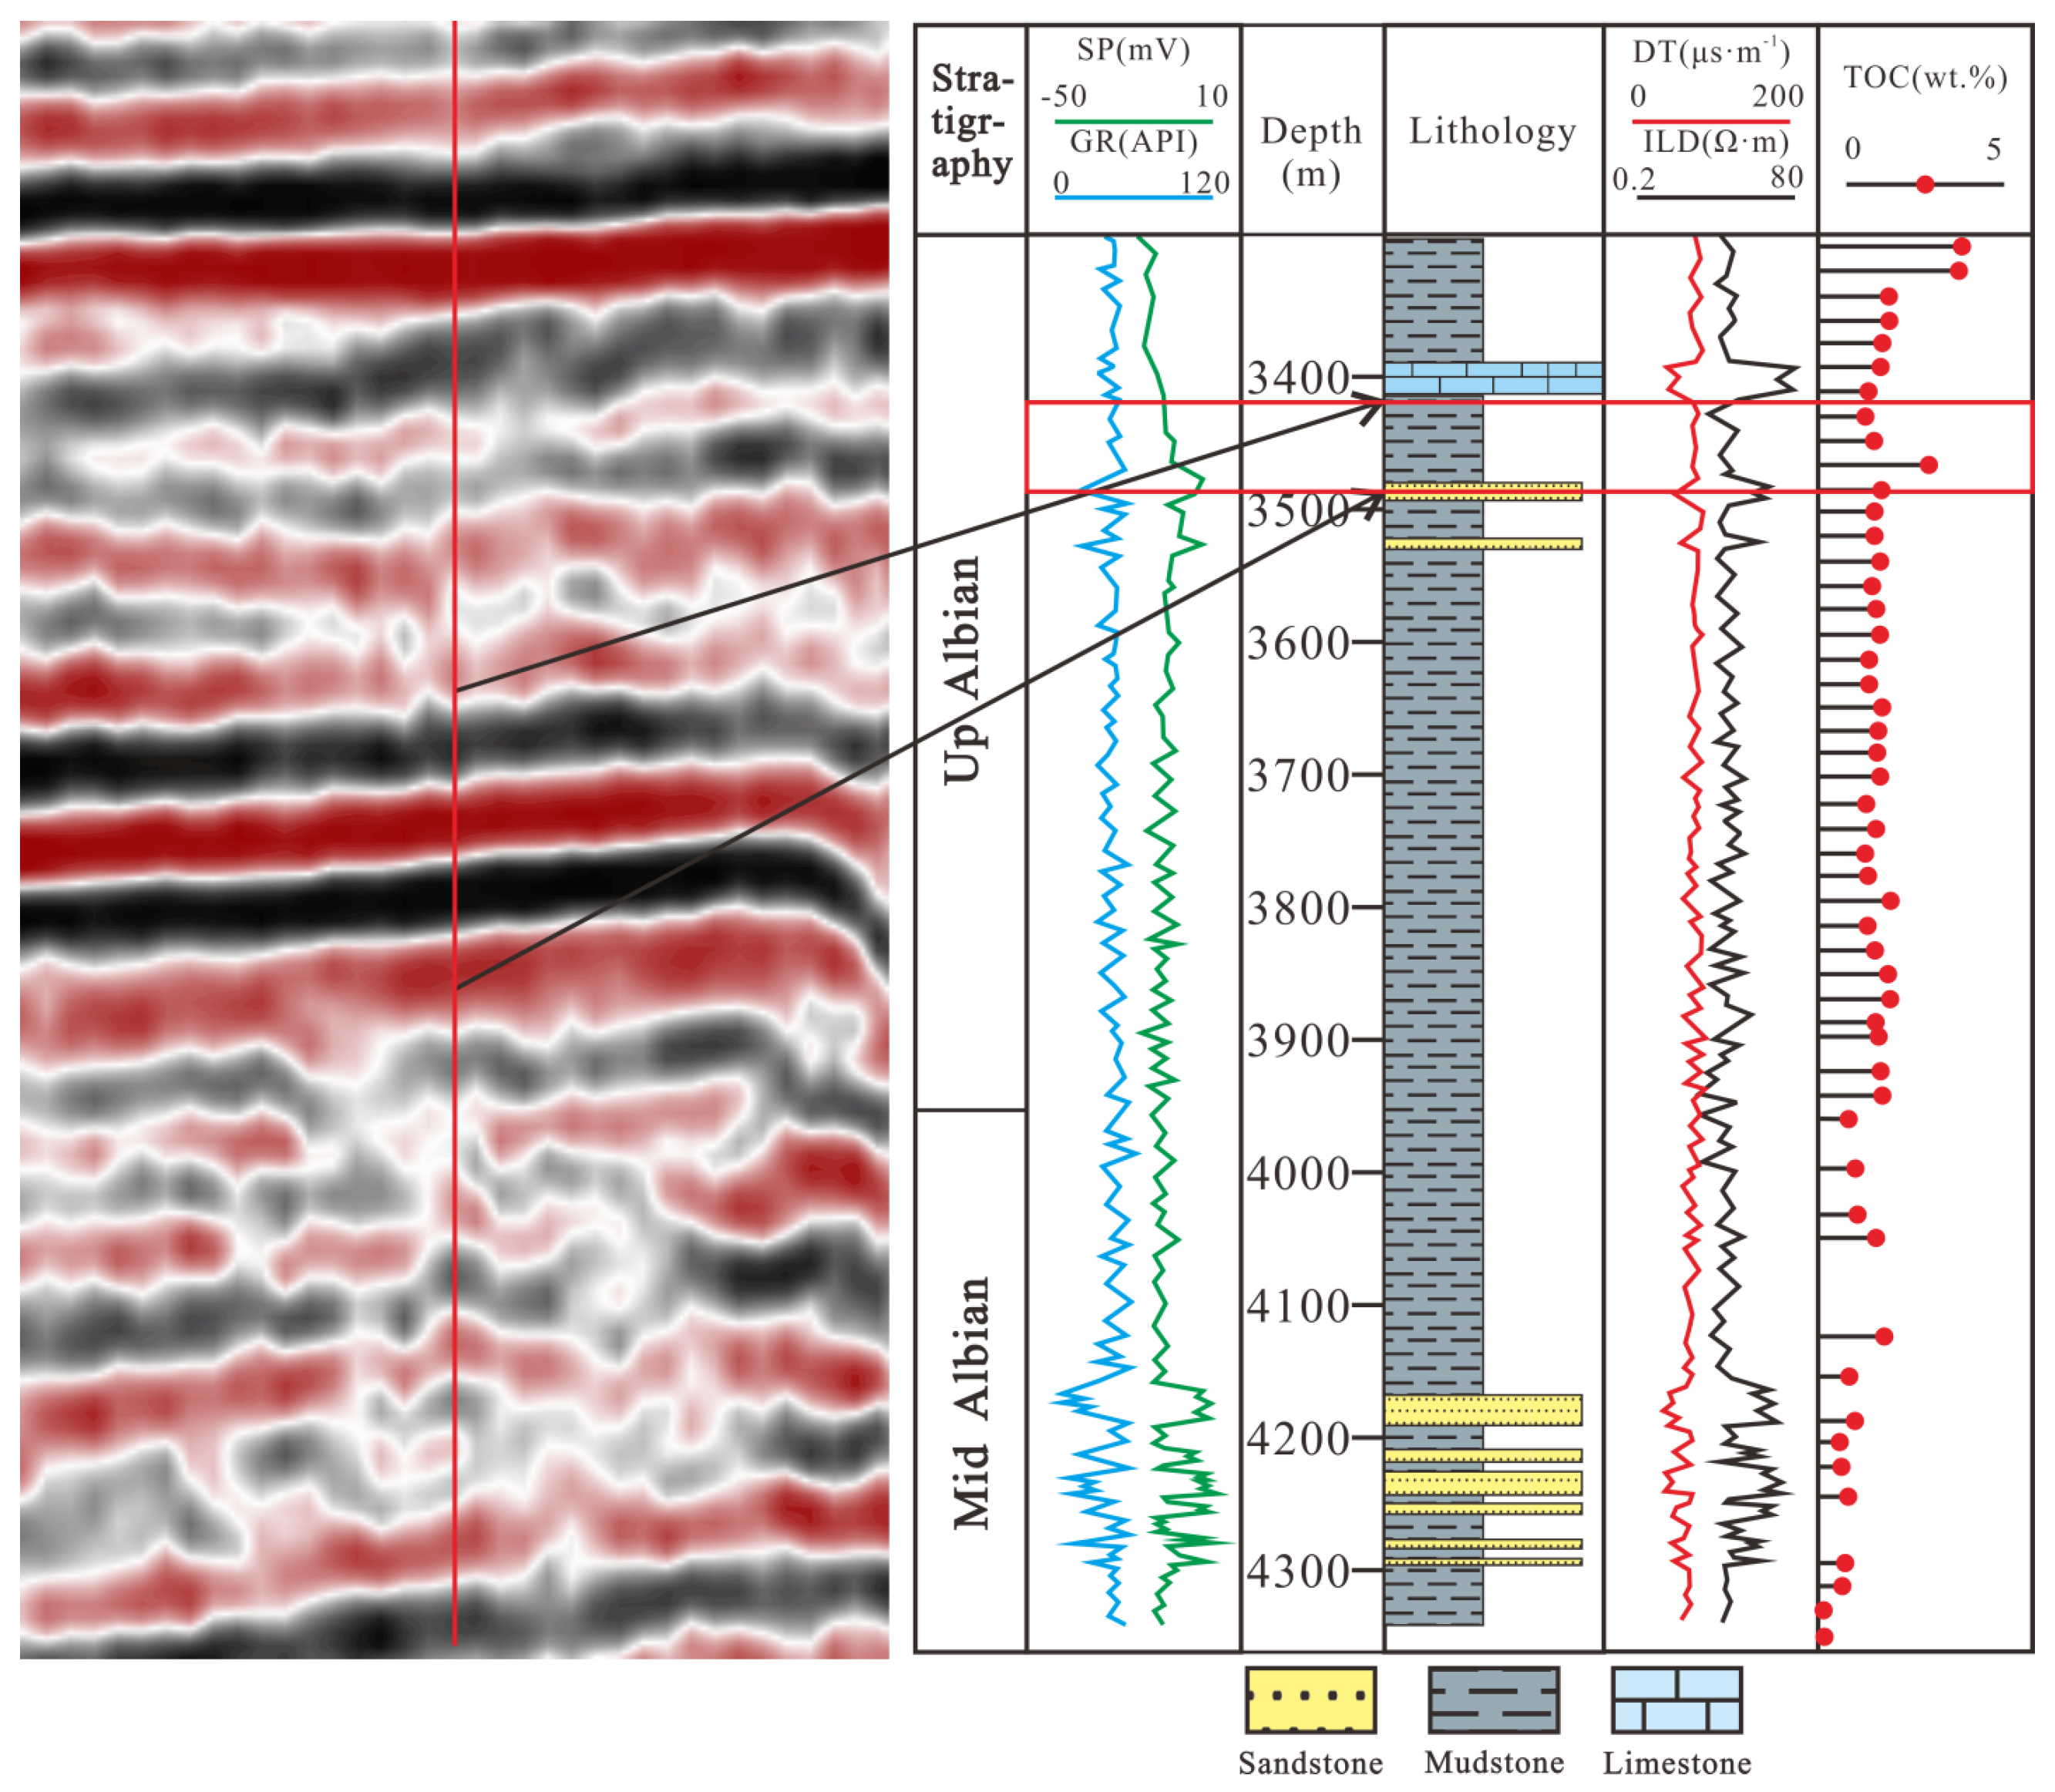
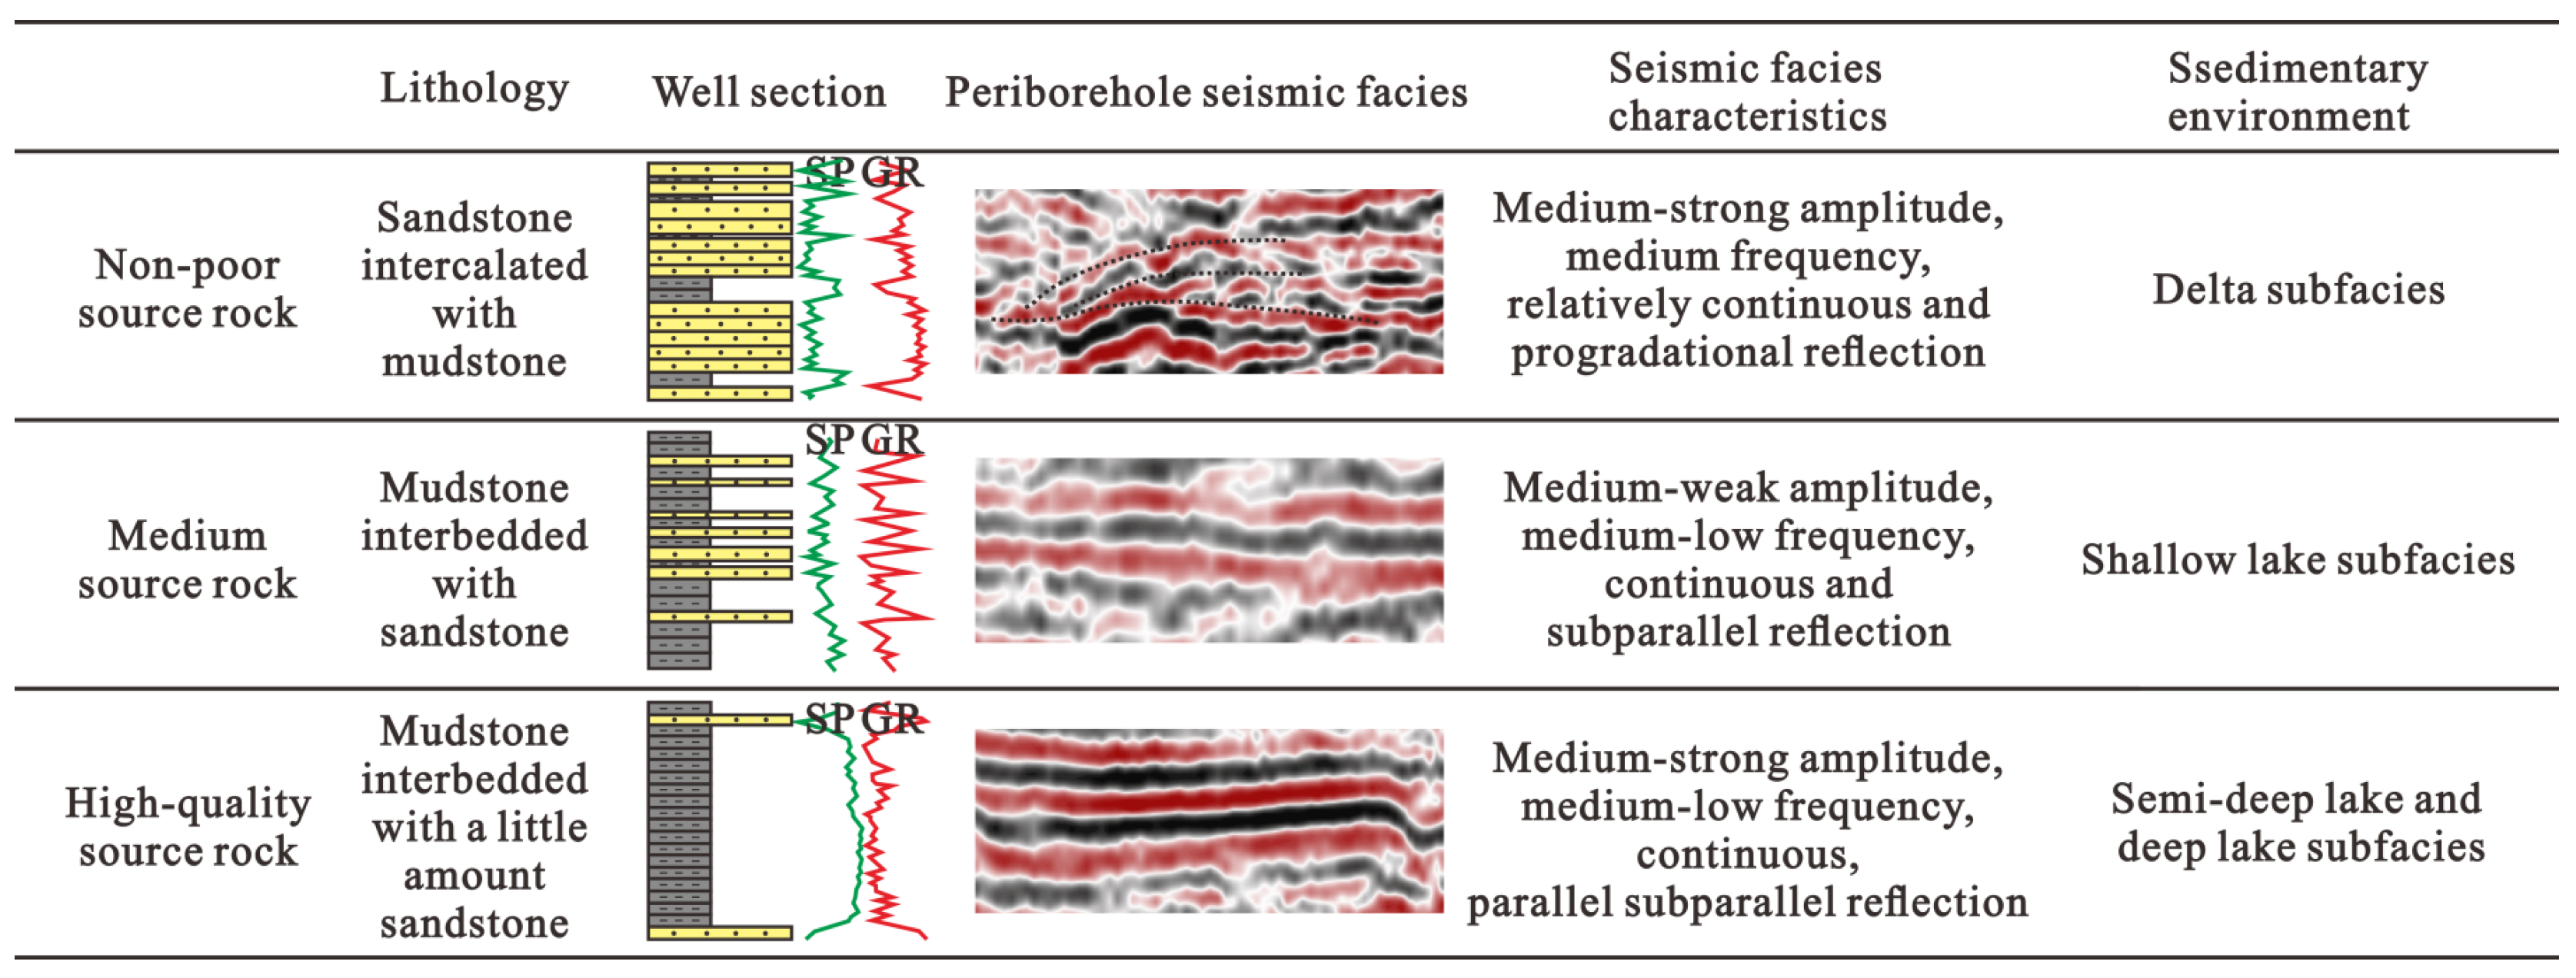
Since the study area is large, the number of wells is small and there are no wells in the deep basin, it is necessary, after predicting the longitudinal distribution of the source rock via logging, to predict the lateral distribution of the source rock by analyzing the seismic data. The seismic method is suitable for basins with a low degree of exploration and with few wells drilled [45]. On the basis of the tectonic stratigraphic framework and DT data from 10 single wells in the study area, we compared the TOC curve of Well R in the study area with the seismic profile, identified the seismic facies characteristics of the source rocks (Figure 10), established a unified seismic facies standard, and converted the seismic facies into sedimentary facies [46]. The results show that the following three main types of seismic facies are developed in the study area: (1) the non-poor source rocks with a TOC value less than 1 wt.% are mainly characterized by a medium-strong amplitude, medium frequency, and relatively continuous and progradational reflection structures in the seismic profile, which have mainly developed in the continental slope and gentle slope zones of the basin and constitute delta subfacies deposits; (2) the medium source rocks with a TOC between 1 and 2 wt.% are mainly characterized by a medium-weak amplitude, medium-low frequency, and continuous and subparallel reflection structures, which have mainly developed in the continental slope of the study area and the transition area between the uplift and the deep basin. According to their location, they conform to the characteristics of dark mudstone deposition in the shallow lake subfacies; (3) high-quality source rocks with a TOC greater than 2 wt.% are mainly characterized by a medium-strong amplitude, a medium-low frequency, and continuous, parallel, or subparallel reflection, belonging to the seismic facies of deep lakes to semi-deep lake subfacies deposits; they were mainly developed in the depression center of the study area [47] (Figure 11).
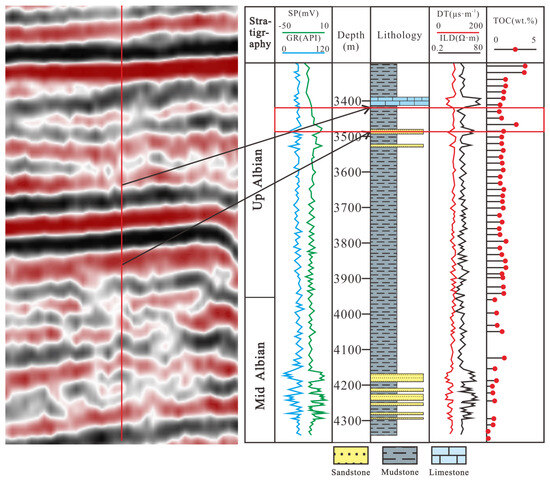
Figure 10.
Response characteristics of the source rock in Well R well earthquake comparison.
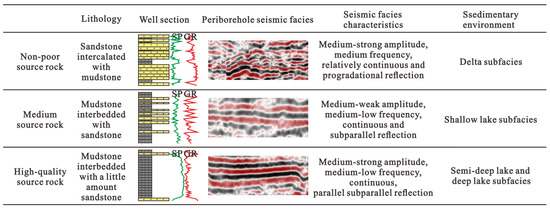
Figure 11.
Seismic facies characteristics of Albian-stage source rocks in the Côte d’Ivoire Basin.
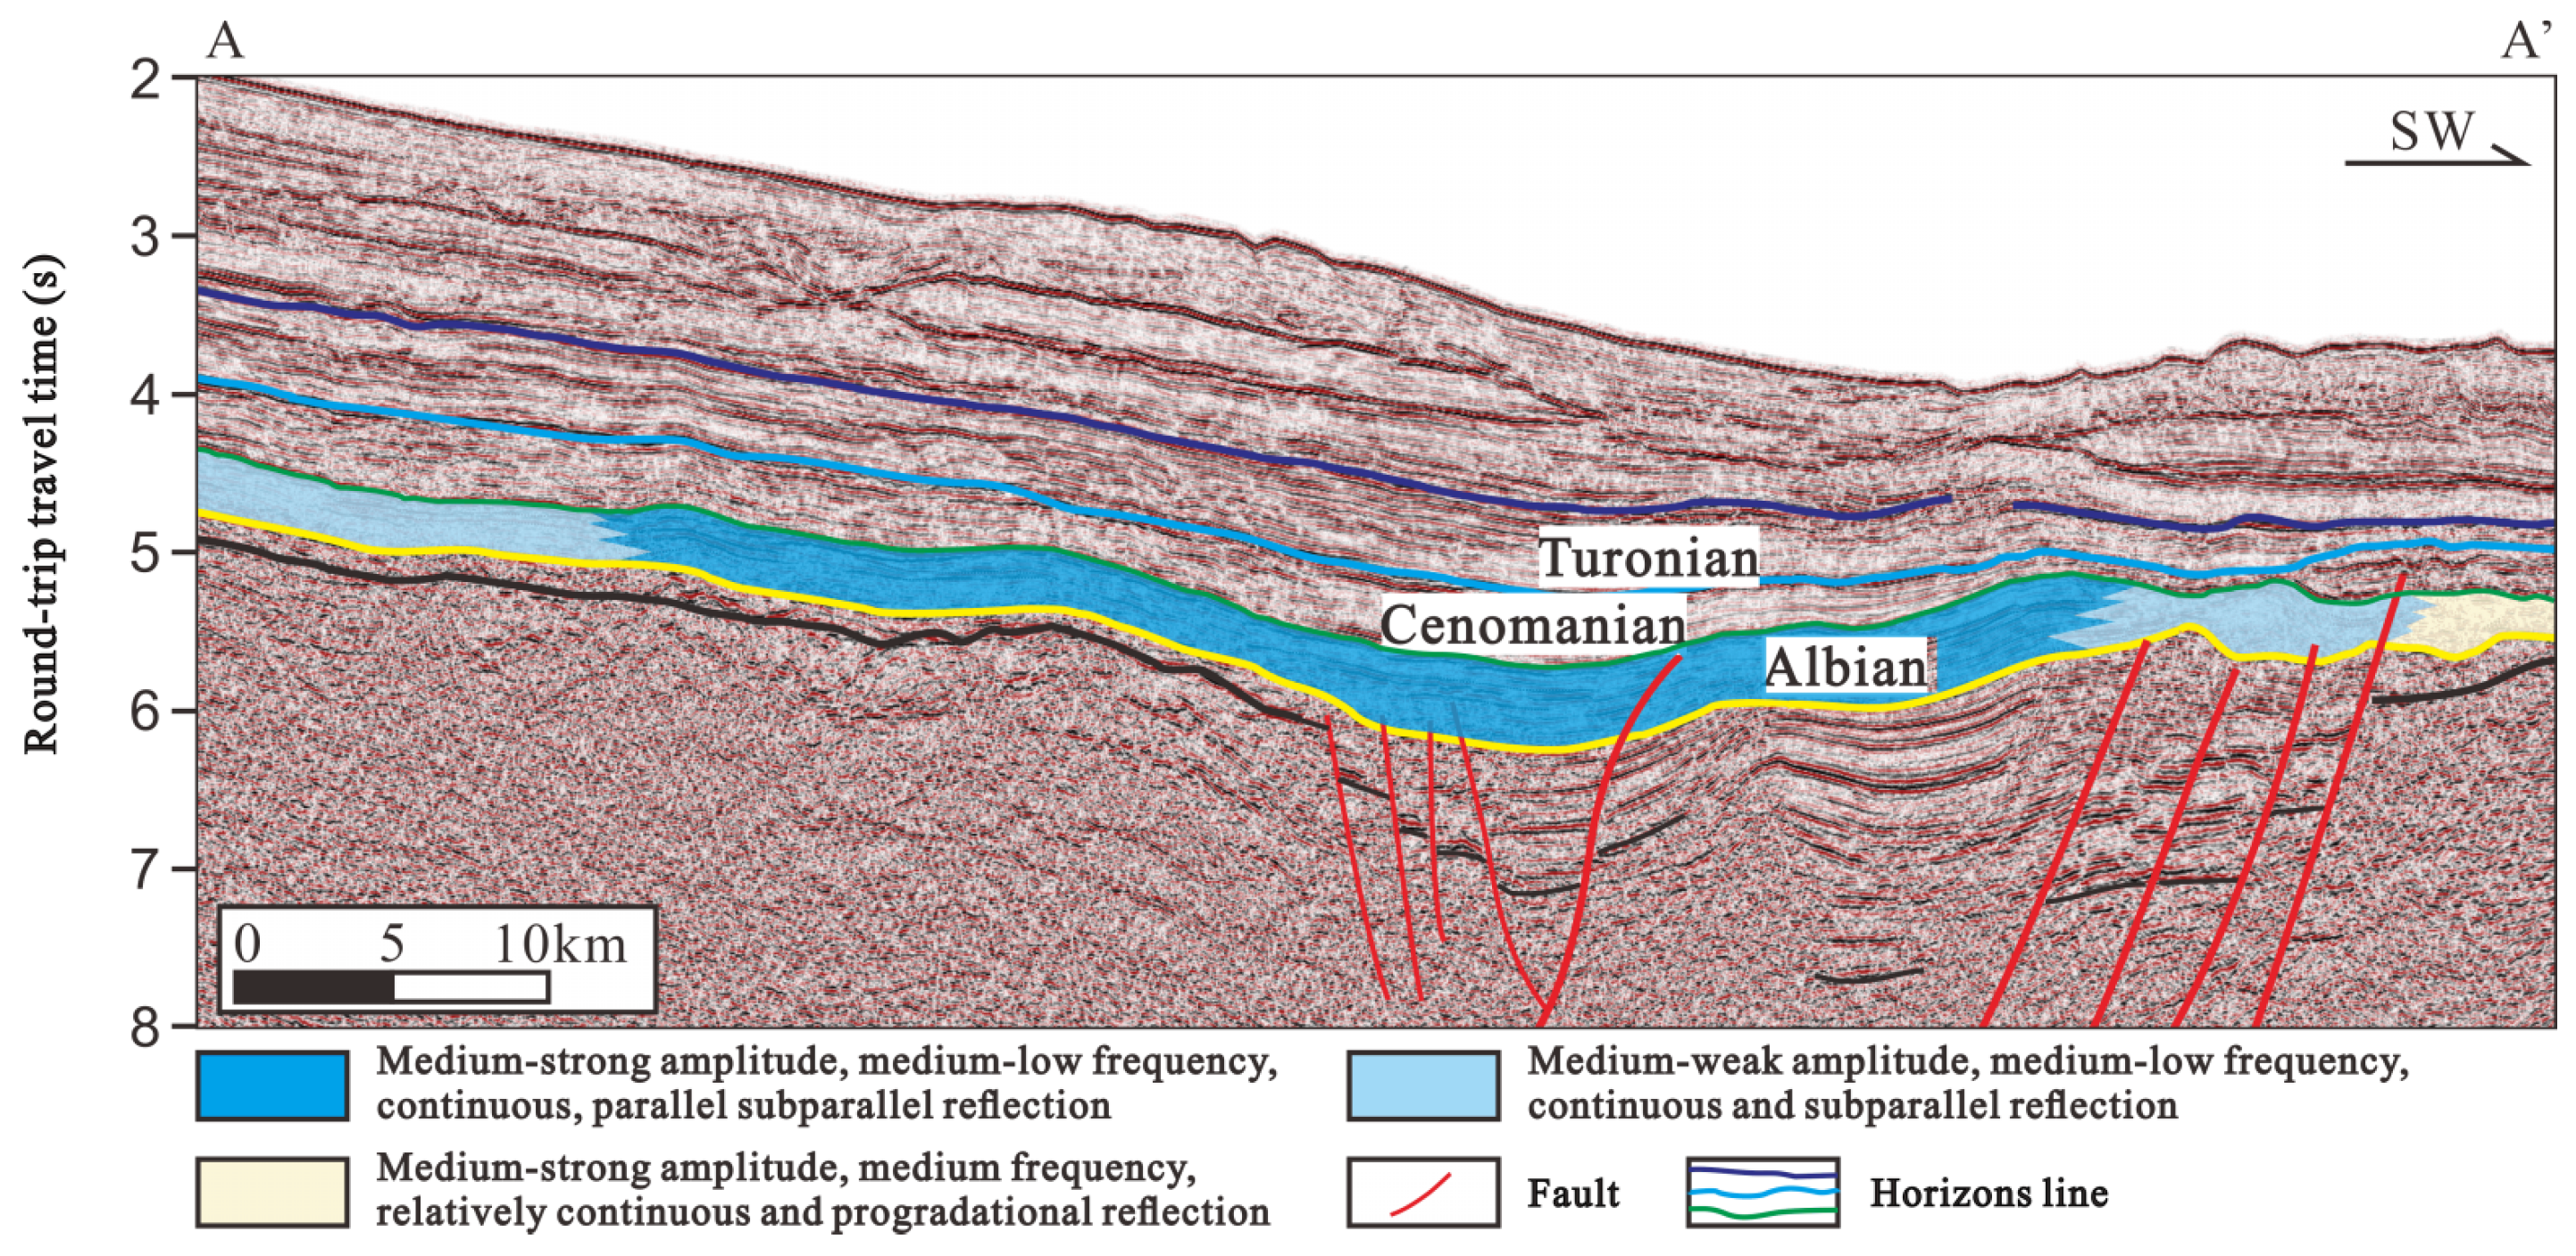
In order to reflect the distribution characteristics of the predicted source rocks, some seismic lines were selected for comprehensive analysis. The A–A’ profile (Figure 12, the location shown in Figure 1) is located between the eastern bulge and the southern bulge of the basin and is a southeastward profile. The seismic facies near the coastline have a medium-weak amplitude, a medium-low frequency, and a continuous and subparallel reflection, showing the sedimentary characteristics of shallow lake facies. To the south, this gradually becomes a medium-strong amplitude, a medium-low frequency, and a continuous, parallel–subparallel reflection, reflecting the semi-deep–deep lake facies. Continuing to the south, and moving gradually closer to the central uplift area, the terrain is uplifted, and the seismic facies develop a medium-weak amplitude, a medium-low frequency, and a continuous and subparallel reflection. The delta facies with a medium amplitude, a medium frequency, and relatively continuous and progradational reflection characteristics appeared in the southernmost part of the section. Therefore, the distribution characteristics of sedimentary facies in the study area can be obtained, which is of great significance for the subsequent prediction of the source rock distribution.
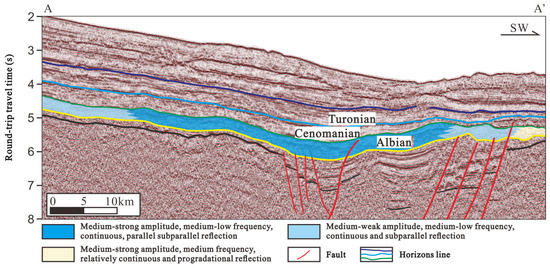
Figure 12.
Albian-stage seismic profile of the Côte d’Ivoire Basin.
5.3. Prediction of Distribution
In the study area, the degree of exploration is low, few wells are drilled, and most of the areas have no drilling, so the source rock thickness can be predicted using the logging acoustic velocity and seismic velocity. The acoustic time difference data of each well were used to make a compaction model, and the superposition velocity obtained in the study was converted to the root mean square velocity, and the layer velocity was calculated using the Dix formula as follows:
where vint is layer velocity; vr,n and vr,n−1 are the root mean square velocity of the nth and n − 1 formation interfaces, respectively, and t0,n and t0,n−1 are the round-trip travel times of the nth and n − 1 formation interfaces, respectively.
Introducing layer velocity into the time-averaged equation can yield the mudstone index:
where vs and vm are the velocities of pure sandstone and pure mudstone at the same depth, respectively; v′int is the layer velocity at this depth; and Pm is the mudstone index.
The thickness of mudstone in the target interval can be calculated using the mudstone index and total formation thickness, which is calculated according to the time–distance relationship:
where Ht is the total thickness of the target interval and Pm is the mudstone index of this layer [48,49]. On this basis, the effective source rock thickness of the Lower-Cretaceous-Albian-stage in the Côte d’Ivoire Basin can be calculated.
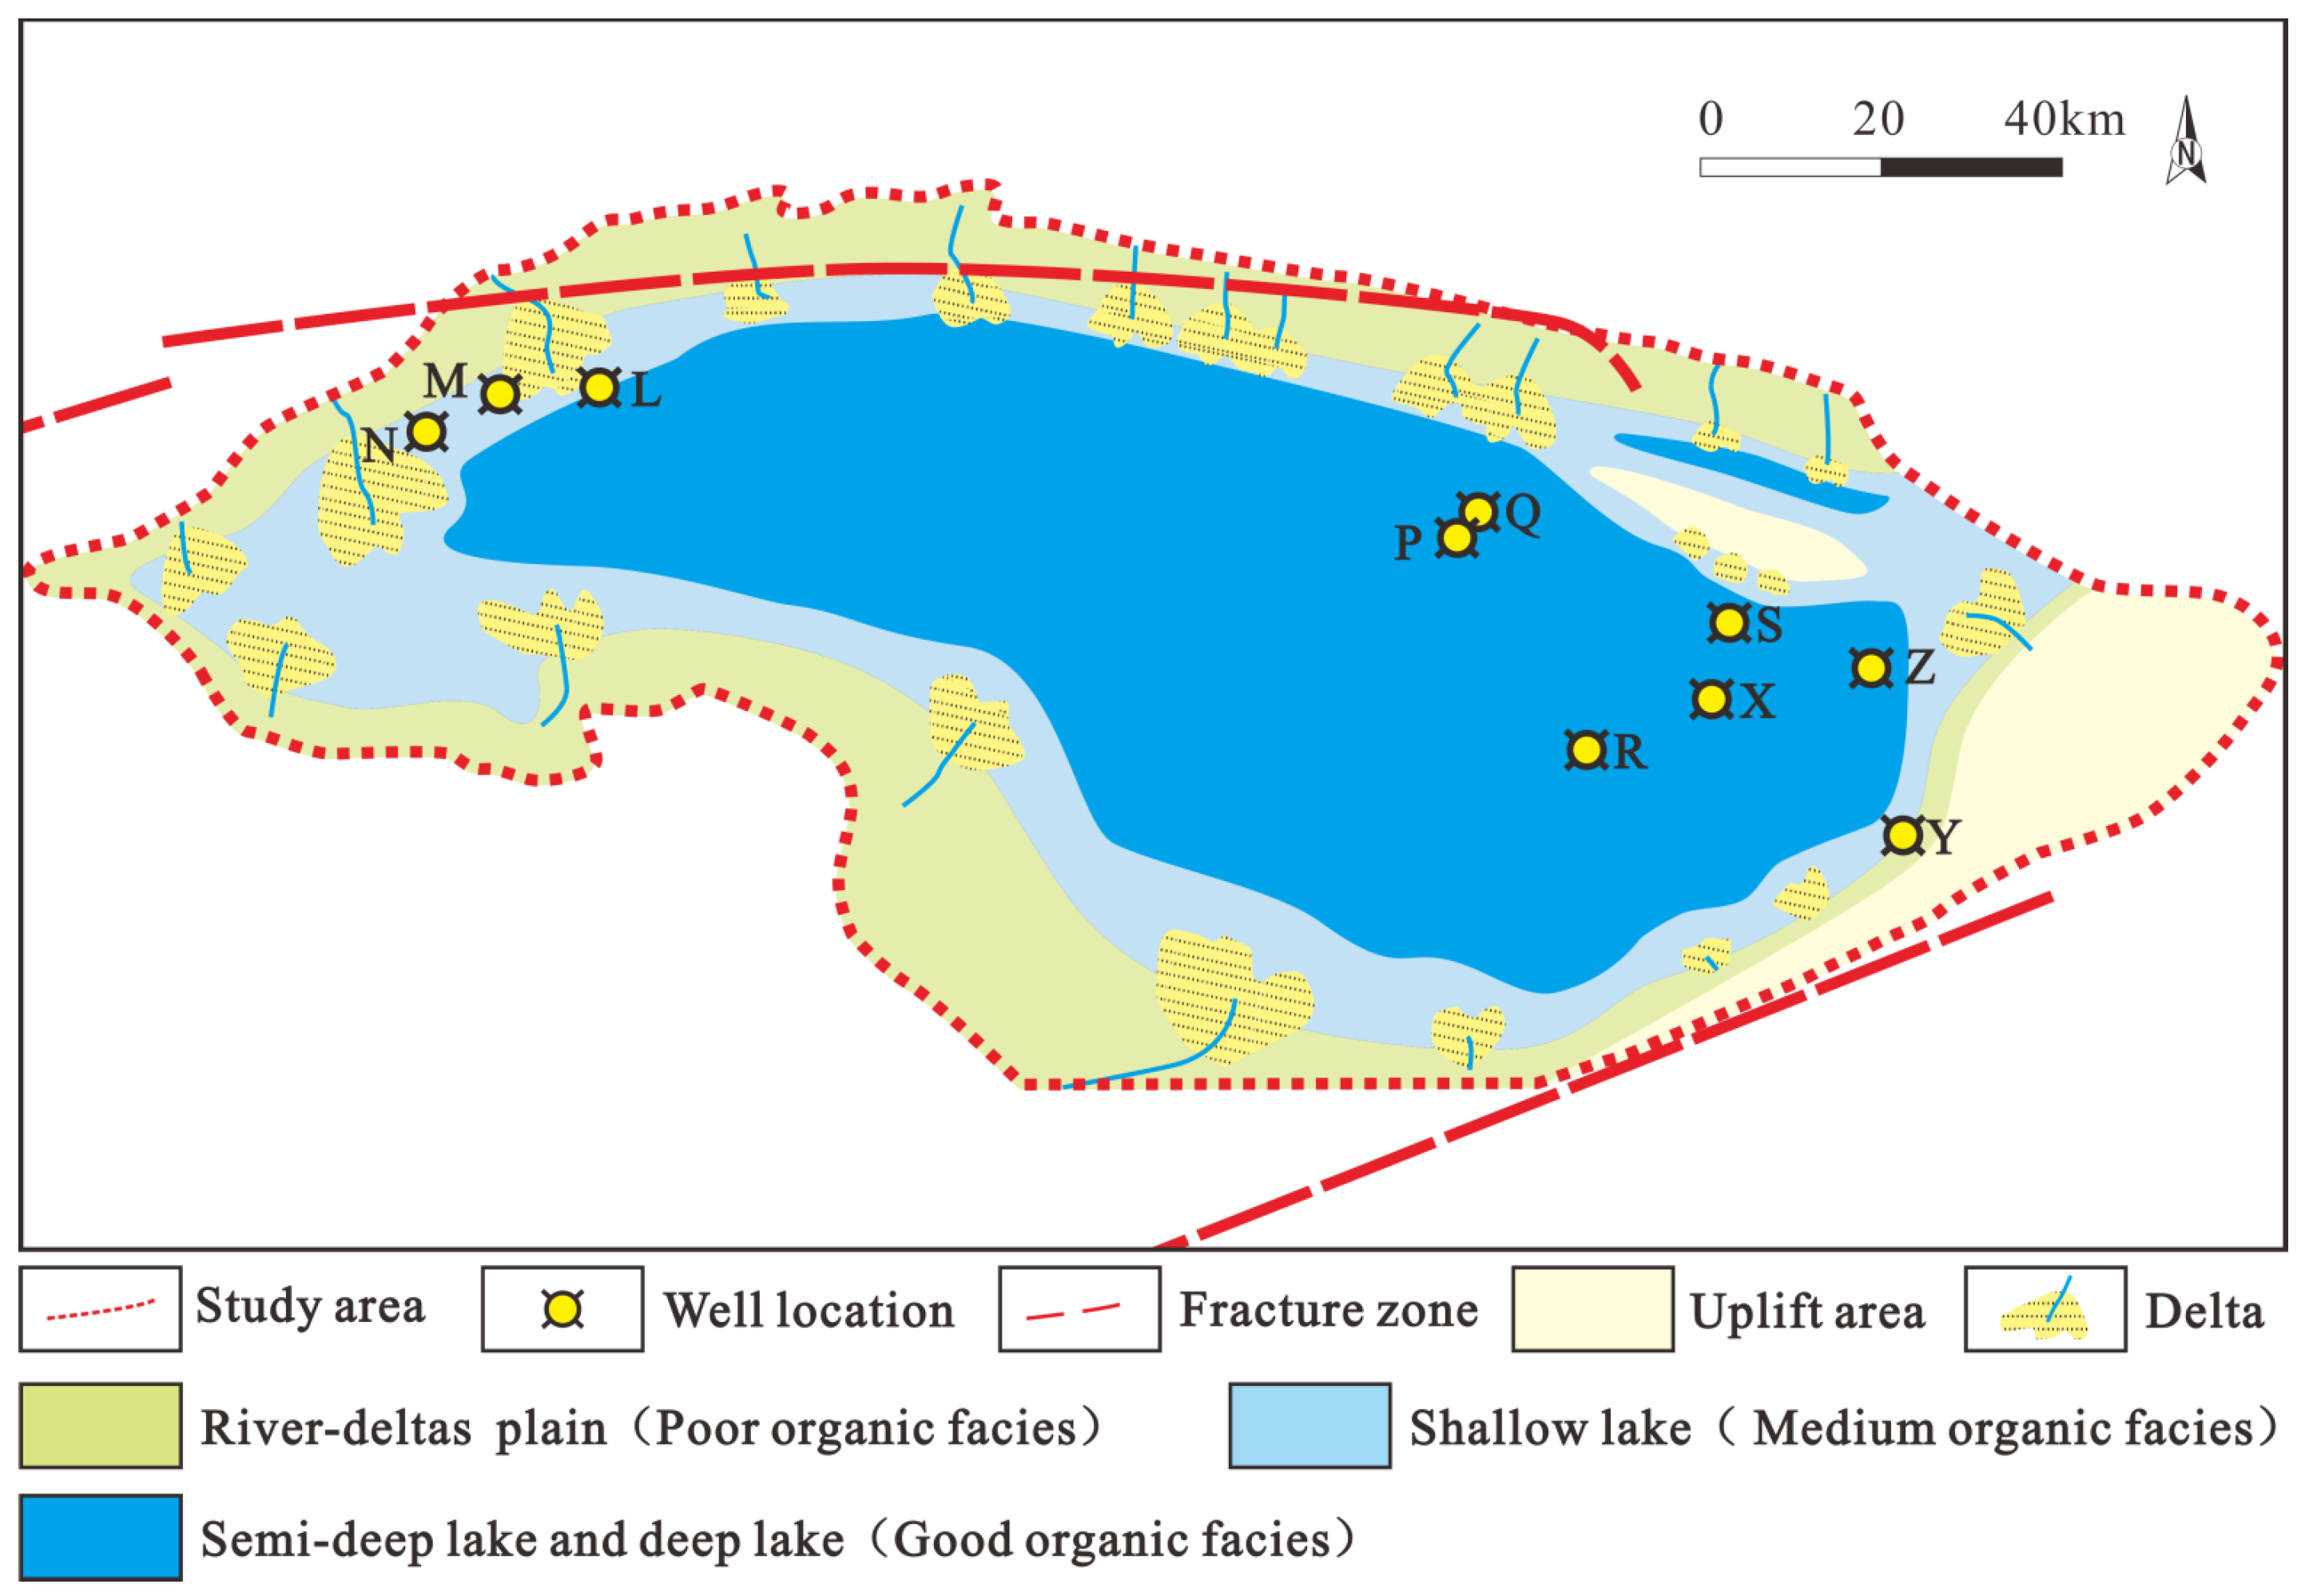
For areas in the study area with less or no drilling, the distribution of the source rocks is predicted by converting the sedimentary facies’ characteristics into organic facies. Based on the overall TOC content predicted by the total organic carbon method in the initial research, the source rocks are divided into three types of organic facies: good, medium, and poor. The good organic facies have a large area, a high overall abundance of organic matter, and greater hydrocarbon generation potential; locally, it meet the standard of high-quality source rocks. The shallow lake facies of the medium organic facies are mainly distributed in a circumferential pattern around semi-deep–deep lake facies, with a medium level of organic matter abundance and a certain degree of hydrocarbon generation potential. The poor organic facies are mainly river-delta plain sediments, distributed in the outer edge of the basin; for the most part, they are not source rocks (Figure 13).
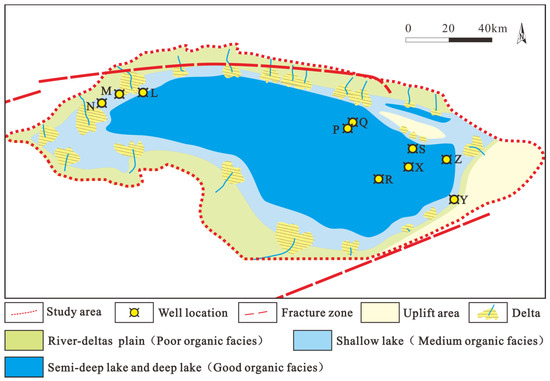
Figure 13.
Distribution prediction of the Lower-Cretaceous-Albian-stage sedimentary facies (organic facies) in the Côte d’Ivoire Basin.
In order to accurately predict the distribution of source rocks, it is necessary to discuss the various characteristics of the source rocks comprehensively [50]. Based on the methods and results mentioned above, the geochemical characteristics, mudstone thickness, and distribution of organic facies are comprehensively analyzed, and the distribution law of the source rocks in the study area is finally obtained (Figure 14). The results show that the Lower-Cretaceous-Albian-stage source rocks in the Côte d’Ivoire Basin have a wide distribution range and have developed in the whole study area. The medium-poor source rocks have mainly developed in shallow lake sediments, which are found in the shelf and uplift areas, with a thickness of about 50~300 m. The high-quality source rocks have widely developed in the semi-deep–deep lake subfacies. The sedimentary center is in the center of the eastern depression in the southwest direction of Well R, with a maximum thickness of 1200 m; it gradually thins to the edge of the basin with the uplift of the terrain, with a minimum thickness of about 300 m. Due to the joint action of the eastern bulge and the southern bulge, a small source rock thickness center is formed in the east of Well R, which develops in the semi-deep–deep lake deposition. The overall east–west trendcomprises gradual thinning toward the basin edge, and the maximum thickness is about 900 m.
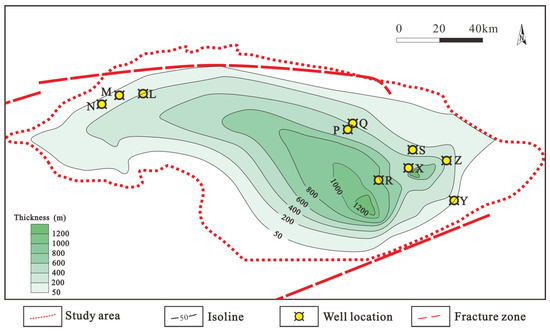
Figure 14.
Prediction of the thickness distribution of the effective source rocks of the Lower-Cretaceous-Albian-stage in the Côte d’Ivoire Basin.
6. Conclusions
- (1)
- The Lower-Cretaceous-Albian-stage source rocks in the Côte d’Ivoire Basin have a good hydrocarbon generation potential with average values of 2.63 wt.% and 4.06 mg/g. The organic matter abundance of the rocks is between 0.47 wt.% and 3.08 wt.% and the average hydrocarbon generation potential is 4.06 mg/g. On the whole, the rocks constitute good and high-quality source rocks. The organic matter type is mainly type II, and it is mainly in the low-mature to mature stages. The TOC is high in the depths of the lake basin and low at the edges, with the average value at the highest point being greater than 4 wt.% and the lowest about 1 wt.%, indicating a high overall abundance of organic matter.
- (2)
- The high-quality source rocks in the the Albian-stage of the Côte d’Ivoire Basin are characterized by a medium amplitude, a low frequency, and continuous, parallel–subparallel reflection. They have widely developed in a semi-deep–deep lake environments, and the lithology is mainly thick dark mudstone. The medium source rocks are characterized by a medium-weak amplitude, a medium-low frequency, and a continuous and subparallel reflection structures in the seismic profiles; they are mainly shallow lake sediments. The poor source rocks have the characteristics of foreprograde reflection and mainly develop in delta deposits.
- (3)
- The good–high-quality source rocks in the basin have mainly developed in the semi-deep–deep lake facies in the center of the eastern depression, with a maximum thickness of 1200 m, while the medium source rocks have developed in the shallow lake subfacies with a thickness of 150–300 m. In the east, there is a small source rock center with a maximum thickness of 900 m.
- (4)
- The Albian stage source rocks in the research area are of good overall quality; they are widely distributed and have significant thickness, exhibiting significant potential for development. The semi-deep to deep lake facies in the center of the lake basin represent a potential area for oil and gas reserve enhancement. As the area is located in the deep sea, it is essential to actively innovate deep sea exploration and development theories and technology, conduct comprehensive research around the Well R and the surrounding areas, and assist oil companies in achieving outstanding results in this region.
Author Contributions
Conceptualization, L.Y. and J.Y.; methodology, L.Y.; software, Y.L.; validation, J.Y., Y.L. and B.W.; formal analysis, B.W.; investigation, Y.L.; resources, Z.W.; data curation, B.W.; writing—original draft preparation, B.W.; writing—review and editing, B.W.; visualization, B.W.; supervision, Z.W.; project administration, Z.W.; funding acquisition, Z.W. All authors have read and agreed to the published version of the manuscript.
Funding
This research was funded by [National Science and Technology Major Project “Study on the Conditions and Rules of Oil and Gas Accumulation in the Passive Continental Margin Basin in the North Section of West Africa”] grant number [2017ZX05032-002-001] And The APC was funded by [2017ZX05032-002-001].
Institutional Review Board Statement
Not applicable.
Informed Consent Statement
Not applicable.
Data Availability Statement
The data presented in this study are available on request from the corresponding author.
Conflicts of Interest
The authors declare no conflict of interest.
References
- Dou, L.R.; Gao, F.; Peng, Y.; Wang, X.; Wang, Z.J.; Wang, K.M. A review of changes in overseas oil and gas investment environments over the past 30 years. Int. Pet. Econ. 2023, 31, 1–13. [Google Scholar]
- Paul, D.; Tracey, H.; Eric, H.; Kathy, K.; Phil, L. Exploration for Cretaceous stratigraphic traps in the Gulf of Guinea, West Africa and the discovery of the Jubilee Field: A play opening discovery in the Tano Basin, Offshore Ghana. Geol. Soc. 2013, 369, 235–248. [Google Scholar]
- Jin, B.; Yu, H.T. Thoughts and suggestions on expanding and deepening Sino-Africa oil and gas cooperation under the Belt and Road Initiative. Int. Pet. Econ. 2018, 26, 58–64. [Google Scholar]
- Gai, H.Y.; Jiang, Y.; Zang, K.; Wang, W. Recognition and characteristic analysis of the transition boundary for transform marginal basin: A case of Cote d’Ivoire Basin, Africa. Bull. Geol. Sci. Technol. 2021, 40, 83–90. [Google Scholar]
- Magoon, L.B.; Dow, W.G. The petroleum system. In The Petroleum System—From Source to Trap; Magoon, L.B., Dow, W.G., Eds.; American Association of Petroleum Geologists: Tulsa, OK, USA, 1994; Memoir 60; pp. 3–24. [Google Scholar]
- Peters, K.E. Guidelines for evaluating petroleum source rock using programmed pyrolysis. AAPG Bull. 1986, 70, 318–329. [Google Scholar]
- Peters, K.E.; Cassa, M.R. Applied source rock geochemistry. In The Petroleum System—From Source to Trap; Magoon, L.B., Dow, W.G., Eds.; American Association of Petroleum Geologists: Tulsa, OK, USA, 1994; Memoir 60; pp. 93–120. [Google Scholar]
- Burton, Z.F.M.; Moldowan, J.M.; Sykes, R.; Graham, S.A. Unraveling petroleum degradation, maturity, and mixing and addressing impact on petroleum prospectivity: Insights from frontier exploration regions in New Zealand. Energy Fuels 2018, 32, 1287–1296. [Google Scholar] [CrossRef]
- Burton, Z.F.M.; Moldowan, J.M.; Magoon, L.B.; Sykes, R.; Graham, S.A. Interpretation of source rock depositional environment and age from seep oil, east coast of New Zealand. Int. J. Earth Sci. 2019, 108, 1079–1091. [Google Scholar] [CrossRef]
- Zhang, F.L.; Qu, H.J.; Zhang, G.C.; Zhao, C.; Feng, Y.W. Petroleum geological features and main controlling factors of hydrocarbon accumulation in deep water areas of Côte d’Ivoire Basin, West Africa. Geol. Sci. Technol. Inf. 2017, 36, 112–117. [Google Scholar]
- Kong, L.W.; Zhao, H.Y.; Liang, J.S.; Cheng, T.; Wang, J.; Zhao, J.Q.; Yu, Y.M. Differences in hydrocarbon accumulation of deep-water turbidite sandstone in a transform continental margin basin: A case study of Côte d’Ivoire Basin, West Africa. Acta Sedimentol. Sin. 2022, 40, 244–254. [Google Scholar]
- Cheng, J.; Duan, T.J.; Ni, C.H.; Yuan, D.F. Petroleum geologic features and accumulation rules of Côte D’Ivoire Basin, West Africa. Pet. Geol. Exp. 2013, 35, 291–295. [Google Scholar]
- Koffi, N.D.; Barton, E.W. Numerous seismic prospects dot concessions of Côte D’Ivoire. Oil Gas J. 1994, 92, 69–72. [Google Scholar]
- Antobreh, A.; Faleide, J.I.; Tsikalas, F.; Planke, S. Rift-shear architecture and tectonic development of the Ghana margin deduced from multichannel seismic reflection and potential field data. Mar. Pet. Geol. 2009, 26, 345–368. [Google Scholar] [CrossRef]
- Qin, Y.Q.; Zhang, Y.G.; Ba, D.; Liang, Y.B.; He, Z.J.; Song, C.P.; Liu, X.B. Geological characteristics and deep water hydrocarbon accumulation patterns of transformed passive continental marginal basins: A case history from basins of West Africa margin in Equatorial Atlantic. Earth Sci. Front. 2016, 23, 229–239. [Google Scholar]
- Liu, J.P.; Pan, X.H.; Ma, J.; Tian, Z.J.; Wan, L.K. Exploration targets in the Côte d’Ivoire-Ghana transform margin in equatorial West Africa. Pet. Explor. Dev. 2010, 37, 43–50. [Google Scholar]
- Benkhelil, J.; Mascle, J.; Tricart, P. The Guinea continental margin: An example of a structurally complex transform margin. Tectonophysics 1995, 248, 117–137. [Google Scholar] [CrossRef]
- Clift, P.D.; Lorenzo, J.; Carter, A.; Hurford, A.J.; ODP LEG 159 Scientific Party. Transform tectonics and thermal rejuvenation on the Côte d’Ivoire-Ghana margin, west Africa. J. Geol. Soc. 1997, 154, 483–489. [Google Scholar] [CrossRef]
- Moulin, M.; Aslanian, D.; Unternehr, P. A new starting point for the South and Equatorial Atlantic Ocean. Earth Sci. Rev. 2010, 98, 1–37. [Google Scholar] [CrossRef]
- Mascle, J.; Blarez, E. Evidence for transform margin evolution from the Côte d’Ivoire–Ghana continental margin. Nature 1987, 326, 378–381. [Google Scholar] [CrossRef]
- Gasperini, L.; Bermoulli, D.; Bonatti, E.; Borsetti, A.M.; Ligi, M.; Negri, A.; Sartori, R.; Salis, K. Lower Cretaceous to Eocene sedimentary transverse ridge at the Romanche Fracture Zone and the opening of the equatorial Atlantic. Mar. Geol. 2001, 176, 101–119. [Google Scholar] [CrossRef]
- Morrison, J.; Boblai, V.; Tea, J.N. A sequence stratigraphic approach to exploration and redevelopment in the Abidjan Margin, Côte d’Ivoire. In Proceedings of the Offshore West Africa Conference and Exhibition, Abidjan, Côte d’Ivoire, 23–25 March 1999; PennWell Publishing: Abidjan, Côte d’Ivoire, 1999; pp. 1–11. [Google Scholar]
- Morrison, J.; Burgess, C.; Cornford, C.; N’Zlasse, B. Hydrocarbon systems of the Abidjan Margin, Côte d’Ivoire. In Offshore West Africa 2000 Conference and Exhibition; PennWell Publishing: Abidjan, Côte d’Ivoire, 2000; pp. 1–13. [Google Scholar]
- Gao, Y.W.; Hao, S.Y.; Wang, Q.; Wang, W.B.; Jiang, S.J.; Fan, Q.X.; Chen, Z.J.; Zhou, Y. Geochemical characteristics and hydrocarbon resources potential of source rocks in Babei Sag, YingenEjinaqi Basin. Oil Gas Geol. 2022, 43, 1445–1458. [Google Scholar]
- Xi, S.L.; Gang, W.Z.; Yang, Q.Y.; Chen, G.; Liu, Y.Z.; Wang, N.; Liu, L. Organic geochemistry and sedimentary paleoenvironment of Chang 7 source rocks in yanchi-dingbian area, Ordos Basin. Geoscience 2019, 33, 890–901. [Google Scholar]
- Burton, Z.; Dafov, L.N. Testing the sediment organic contents required for biogenic gas hydrate formation: Insights from synthetic 3-D basin and hydrocarbon system modelling. Fuels 2022, 3, 555–562. [Google Scholar] [CrossRef]
- Wang, T.G.; Zhong, N.N.; Xiong, B.; Li, X.Q.; Huang, D.F. Organic petrologic methodology for evaluation of hydrocarbon generation potential in source rocks. Acta Pet. Sin. 1994, 15, 9–16. [Google Scholar]
- Espitatie, J.; Laporte, J.L.; Madec, M.; Marquis, F.; Boutefeu, A. Rapid method for source rocks characterization and for determination of petroleum potential and degree of evolution. Oil Gas Sci. Technol. 1977, 32, 23–42. [Google Scholar]
- Tissot, B.P.; Welte, D.H. Petroleum Formation and Occurrence; Springer: Berlin/Heidelberg, Germany, 1984. [Google Scholar]
- Xu, T.; Hou, D.J.; Zhao, Z.B.; Wang, Y.; Xu, C.G.; Wang, F.L. Controlling factors for the development of high-quality source rocks in the East Depression of the Yellow River Estuary in Bohai Bay Basin. J. Northeast Pet. Univ. 2017, 41, 11–20. [Google Scholar]
- Peters, K.E.; Walters, C.C.; Moldowan, J.M. The Biomarker Guide; Cambridge University Press: Cambridge, UK; New York, NY, USA, 2005. [Google Scholar]
- Sinninghe Damsté, J.S.; Kenig, F.; Koopmans, M.P.; Köster, J.; Schouten, S.; Hayes, J.M.; Leeuw, J.W. Evidence for Gammacerane as an Indicator of Water Column Stratification. Geochim. Cosmochim. Acta 1995, 59, 1895–1900. [Google Scholar] [CrossRef]
- Zhang, L.P.; Huang, D.F.; Liao, Z.Q. Gammacerane-Geochemical Indicator of Water Column Stratification. Acta Sedimentol. Sin. 1999, 17, 136–140. [Google Scholar]
- Larter, S.; Wilhelms, A.; Head, I.; Koopmans, M.; Aplin, A.; Di Primio, R.; Zwach, C.; Erdmann, M.; Telnaes, N. The controls on the composition of biodegraded oils in the deep subsurface: Part 1: Biodegradation rates in petroleum reservoirs. Org. Geochem. 2003, 34, 601–613. [Google Scholar] [CrossRef]
- Sachsenhofer, R.F.; Popov, S.V.; Akhmetiev, M.A.; Zaporozhets, N.I. The Type Section of the Maikop Group (Oligocene-Lower Miocene) at the Belaya River (North Caucasus): Depositional Environment and Hydrocarbon Potential. AAPG Bull. 2017, 101, 289–319. [Google Scholar] [CrossRef]
- Hanson, A.D.; Zhang, S.C.; Moldowan, J.M.; Liang, D.G.; Zhang, B.M. Molecular organic geochemistry of the Tarim Basin, Northwest China. AAPG Bull. 2000, 84, 1109–1128. [Google Scholar]
- Tang, X.Q.; Huang, G.H.; Zhang, M.; Han, J.P. Compositional characteristis and geochemical significance of N-alkanes in process of crude oil cracking. Earth Sci. Front. 2009, 16, 372–378. [Google Scholar] [CrossRef]
- Li, S.J. Sedimentary environmental significance of normal alkane and the ratio of pristane to phytane. J. Univ. Pet. 1999, 23, 14–16, 23. [Google Scholar]
- Sun, Q.S.; Zhang, K.; Li, Y.F.; Gao, X.Y.; Sun, S.L.; Zhang, T.; Zong, W.M.; Sun, P. Characteristics and implication of biomarker compounds in source rocks from Beipiao formation in Jinyang Basin, Western Liaoning province. Geol. Resour. 2018, 27, 69–76. [Google Scholar]
- Peters, K.E.; Clark, M.E.; Das, G.U.; McCaffrey, M.A.; Lee, C.Y. Recognition of an Infracambrian source rock based on biomarkers in the Baghewala- 1 oil, India. AAPG Bull. 1995, 79, 1481–1494. [Google Scholar]
- Zhang, S.C.; Zhang, B.M.; Bian, L.Z.; Jin, Z.J.; Wang, D.R.; Zhang, X.Y.; Gao, Z.Y.; Chen, J.F. Development constraints of marine source rocks in China. Earth Sci. Front. 2005, 12, 39–48. [Google Scholar]
- Passry, Q.R.; Creaney, S.; Kulla, J.B.; Moretti, F.J.; Stroud, J. A practical model for organic richness from porosity and resistivity logs. AAPG Bull. 1990, 74, 1777–1794. [Google Scholar]
- Wang, J.G.; Li, Z.G.; Zhu, Z.; Song, L. Calculation of the shale toc extents based on the well logging methods. Pet. Geol. Oilfield Dev. Daqing 2015, 34, 170–174. [Google Scholar]
- Zhu, G.Y.; Jin, Q.; Zhang, L.Y. Using log information to analyse the geochemical characteristics of source rocks in Jiyang depression. Well Logging Technol. 2003, 27, 104–109 + 146. [Google Scholar]
- Zhu, M.L.; Liu, Z.; Zhang, Z.H.; Liu, C.; Yang, P.C.; Li, J.Y.; Cui, F.Z. Seismic prediction of source rock distribution in the Lower Member of Pinghu Formation in the Pingbei Area of Xihu Sag. Mar. Geol. Quat. Geol. 2022, 42, 170–183. [Google Scholar]
- Yin, J.; Wang, Q. Using seismic and log information to identify and predict high-quality source rocks: A case study of the first member of Shahejie Formation in Raoyang Sag, Bohai Bay Basin. Nat. Gas Geosci. 2017, 28, 1761–1770. [Google Scholar]
- Zhao, N.B. Forward—Inverse Comprehensive Evaluation and Development Model of Lacustrine Source Rocks in China Offshore; China University of Geosciences: Wuhan, China, 2022; pp. 68–74. [Google Scholar]
- Wang, Z.S.; Liu, Z.; Sun, Z.P.; Yao, Z.; Liu, P.; Chen, Y.H.; Wang, B.; Chen, J. Preliminary prediction and evaluation of oligocene source rocks in LedongLingshui Sag in deep-water area of Qiongdongnan Basin. J. Cent. South Univ. Sci. Technol. 2014, 45, 876–888. [Google Scholar]
- Sun, Z.; Peng, J.S.; Jiang, S.K.; Ye, T.; Guo, Y. Organic facies and well logging evaluation of source rocks in Centeral-South Sag of Miaoxi Depression and its surrounding areas, Bohai Sea. Lithol. Reserv. 2020, 32, 102–110. [Google Scholar]
- Hao, F. Dynamics of Hydrocarbon Generation and Mechanism of Hydrocarbon Accumulation in Overpressure Basins; Science Press: Beijing, China, 2005. [Google Scholar]


Disclaimer/Publisher’s Note: The statements, opinions and data contained in all publications are solely those of the individual author(s) and contributor(s) and not of MDPI and/or the editor(s). MDPI and/or the editor(s) disclaim responsibility for any injury to people or property resulting from any ideas, methods, instructions or products referred to in the content. |
© 2024 by the authors. Licensee MDPI, Basel, Switzerland. This article is an open access article distributed under the terms and conditions of the Creative Commons Attribution (CC BY) license (https://creativecommons.org/licenses/by/4.0/).