Article

Network Structure Characteristics and Influencing Factors of Urban Agglomerations in China under Impact of COVID-19

School of Landscape Architecture, Zhejiang Agriculture and Forestry University, Hangzhou 311300, China
*
Author to whom correspondence should be addressed.
Appl. Sci. 2024, 14(11), 4368; https://doi.org/10.3390/app14114368
Submission received: 30 April 2024 / Revised: 19 May 2024 / Accepted: 20 May 2024 / Published: 22 May 2024

Abstract

:
In the context of COVID-19, the efforts undertaken for epidemic control have imposed limitations on the multifaceted development of China. This manuscript utilizes Baidu migration data from 2019 to 2023 to classify the current developmental status of urban agglomerations (UAs) in China. The explication of network structure is achieved through the computation of metrics that capture network structural connectivity and hierarchical attributes. Additionally, an inquiry into the spatio-temporal differentiation of the UAs’ network structure is carried out, encompassing three phases: before COVID-19, the normalization stage of COVID-19, and after COVID-19. Furthermore, Quantitative Analysis of Patterns (QAP) is employed to assess the impact of diverse influencing factors. The analysis yields several key findings: ① The impact of COVID-19 on the network structure of China’s UAs manifests in two discernible stages—initial impact disruption and subsequent recovery and reconstruction. ② The exploration of pertinent influencing factors during the primary stage of UA development is impeded. ③ The growth stage and the UAs with a high level of development exhibit have a closely intertwined relationship, fostering a more rational hierarchical structure and demonstrating an enhanced capacity for swift recovery. ④ It is discerned that economic development level, medical facility standards, transportation infrastructure capacity, spatial proximity, and innovation accessibility exert a discernible influence on the network structure of UAs. Importantly, the extent of impact varies across different periods and types of UAs.

1. Introduction

Urban agglomerations (UAs) are important carriers of economic accumulation, industrialization, and urbanization. These spatial entities are characterized by complex networks and connections that collectively define the structural network of UAs [1,2]. Previous studies have demonstrated that UAs possess strong spatial interdependencies and intricate interconnections among constituent cities, displaying network structures akin to those observed in complex networks [2,3,4]. The evolution of these network structures reflects the underlying economic and social development trajectories within these agglomerations [5]. Therefore, investigating the characteristics of UA network structures is of paramount importance. It enhances our understanding of inter-city relationships and development dynamics, providing insights into the cooperation mechanisms and resource synergies within UAs [6]. Such understanding is crucial for promoting the integrated regional development of urban agglomerations [7].
The 19 distinct UAs in China each display unique developmental characteristics influenced by geographical, demographic, industrial, economic, and other factors [8,9]. These agglomerations encompass well-established international hubs like the Yangtze River Delta (YRD), Beijing–Tianjin–Hebei (BTH), and the Pearl River Delta (PRD), alongside others in the early stages of development, characterized by substantial disparities in their developmental statuses and potentials. Consequently, the analysis of Chinese UAs necessitates the consideration of the spatial network attributes of each UA. Therefore, the study of China’s UAs needs to take into account the characteristics of the spatial network within these regions and summarize the development laws of the network structures across different types of UAs through a comprehensive generalization and analysis.
Various countries and regions worldwide face the consequences of various public health disasters, including SARS, Ebola, influenza A, avian influenza, and COVID-19 [10,11,12]. Consequently, scholarly investigations into urban networks under epidemic-type public health disasters predominantly center on city and inter-city networks during these periods [13]. Researchers construct models to elucidate the evolution patterns and characteristics of these networks, comparing structural features before and after public health disasters to substantiate their substantial impact on city aspects such as population, economy, and society, which consequently influence network structures [14,15,16]. Modeling the network structure of UAs during public health disasters elucidates their evolutionary laws and characteristics. Comparative analyses of network structure characteristics substantiate the significant impact on city aspects, subsequently influencing city network structures. Previous research on urban networks was limited by the short duration of epidemics, challenges in data collection, and issues with precision, relying primarily on traditional panel data or big data methodologies to examine structural characteristics and evolutionary patterns. The COVID-19 pandemic of 2020, however, presented a unique scenario in terms of duration and impact compared to previous public health crises. Its prolonged presence and severe consequences significantly altered the network structures of urban agglomerations (UAs) all over the world. In response to the pandemic, most countries engaged in stringent epidemic control measures and entered a phase of prolonged epidemic normalization, which, in China, concluded officially on 8 January 2023. This shift prompted by the epidemic led scholars to investigate the evolution of the network structures of China’s UAs under the influence of the pandemic. These studies uncovered varying impacts of the epidemic on different UA networks. Through qualitative analysis, factors such as urban economy, industry, population, infrastructure, and transportation were identified as critical in influencing the evolution of network structures in urban agglomerations during public health crises of an epidemic nature. Despite these advancements, certain limitations persist in analyzing the network structure of Chinese UAs during public disaster events. Presently, studies predominantly focus on scrutinizing the characteristics and influencing factors of individual UAs, with limited attention given to the classification and comparative analysis of multiple UAs. Furthermore, the temporal scope of research primarily centralizes before or during the normalization stage of COVID-19, with scant exploration of the post-epidemic phase [17,18,19]. Moreover, investigations into the factors influencing the network structure of UAs lean heavily towards qualitative research, lacking sufficient quantitative analyses of these influencing factors. Consequently, there is significant merit in categorizing the present developmental status of UAs in China and exploring the impact of public health disaster events on their network structure before, during, or after the COVID-19 stages [20]. This comprehensive approach is crucial for aiding UAs in managing subsequent similar disasters and fostering integrated development. Additionally, such research will be invaluable for government authorities and planners in optimizing resource allocation across various UAs around the world, facilitating targeted strategies to maximize benefits from cross-city cooperation [21,22]. The outcomes of this study can provide a scientific basis for informed resource allocation and decision-making processes [23].
Presently, scholars primarily investigate the characteristics of UA network structures using complex network theory [24,25]. Additionally, scholars employ network structure measurement methods, including the gravitational model and social network analysis, to scrutinize the characteristics of UA network structures [19,26]. A key focus is the quantification of the hierarchical structure of city networks, which involves calculating city node indicators, including in-degree, out-degree, centrality, and intermediary centrality through centrality analysis [7,27]. This method delineates the influence characteristics of node cities within UAs and the hierarchical features of the network structure. Linkage strength indicators between cities within the UA network are computed using social network analysis to reflect linkage characteristics, providing insights into the development and evolution patterns of UAs [28,29]. Given the regional scale of UAs, data acquisition poses challenges. Scholars simplify and integrate traditional network structure research methods, selecting scientifically sound indicators to characterize UA networks, thereby enhancing the applicability of social network analysis [30,31]. Characteristics of network structures, including connectivity, vulnerability, linkage, and hierarchy, are primarily measured, with UA network structures characterized by indicators of network connectivity and hierarchy due to the fixed nodes constituting the UA network. This study adopts a UA perspective, necessitating a comparison of network structure characteristics among different types of UAs during various epidemic periods and variations in influencing factors. By focusing on the connectivity and hierarchy, employing three representative indicators—degree of centrality, strength of network connections, and network density—through social network analysis, this approach ensures data accuracy, simplifies calculations, and effectively unveils the network structure characteristics of the UAs [32].
Moreover, the network structure of UAs represents a complex system subject to various influencing factors. Scholars have adopted a comprehensive approach drawing from traditional location theory, new economic geography, and relevant theories in evolutionary economic geography. This approach involves considering geospatial, population, economic, cultural, transportation, infrastructure, and industrial aspects [33,34]. Researchers have selected pertinent indicators and analyzed the driving forces and influencing mechanisms of UA challenges through qualitative analysis [35,36], spatial econometric modeling [37], negative binomial regression, QAP correlation analysis, and similar methodologies. In the context of complex network analysis applied to UA network structure research, the variables involved are relational data, which may exhibit multicollinearity, making it challenging to ascertain whether the disturbance term conforms to a normal distribution. The QAP analysis method, a non-parametric matrix processing approach, alleviates the need for considering variable independence and effectively addresses multicollinearity [38,39]. Consequently, QAP analysis is widely employed to examine the factors influencing the network structure of UAs [40,41].
In recent years, the use of urban data has provided a practical basis for understanding the dynamics of UAs [37,42,43]. Previous scholarly investigations into the network structure of UAs primarily relied on the analysis and exploration of traditional static datasets encompassing economic, transportation, and population facets, with a focus on sources such as highway passenger flow data, highway network data, and census data [2,3,44]. However, these datasets posed challenges due to their substantial volume, limited precision, and the capability to only reflect network characteristics over extended periods. In recent years, major Internet companies like Baidu, Tencent, and microblogging platforms have introduced location service data with real-time updates, offering a novel approach through location-based big data for characterizing UA network structures [45,46]. Concurrently, population migration big data, with their ample sample size and the inclusion of migration scale and direction data, is better suited for characterizing the scale and flow direction of inter-city network connections to a considerable extent. Consequently, Baidu migration data have been increasingly used by researchers to construct population migration networks, thereby enhancing the analysis of inter-city network structures [21,47].
In light of these considerations, this study investigates the impact of the COVID-19 pandemic on population flow networks in 19 urban agglomerations (UAs) across China, utilizing Baidu migration big data and complex network analysis techniques. The research delves into a classification-based examination of China’s UA networks under the COVID-19 context, taking into account both the entire temporal span and a long-term perspective. Furthermore, it investigates the stability characteristics of diverse types of UA networks in China at distinct phases of COVID-19, elucidating their evolutionary patterns. Additionally, this study employs QAP correlation analysis to identify the factors influencing the network structure of these nineteen UAs. These factors include economic development levels, medical and transportation facilities, spatial proximity, and innovation and openness. Comparative analyses are conducted to discern the impact of these factors on UA network structure stability, both before and after COVID-19. The objective is to provide insights into how these factors may influence UA network stability in future scenarios. This research aims to offer valuable references for UA planning, positioning, resource allocation, and policy formulation in the face of future public health emergencies.

2. Materials and Methods

2.1. Study Area

The UAs of China represent the principal focus of new urbanization efforts and serve as the strategic core for economic development. These UAs encompass 29.1% of China’s total land area, comprise 75.2% of the nation’s population, and contribute 80.1% of its overall economic output [8]. Notably, the sizes of China’s UAs vary, exhibiting differences in terms of the number of cities encompassed within each UA and their geographical extent. China’s eastern coastal region predominantly hosts these UAs, with noticeably lower density in the western region, particularly in the northwest. This distribution to some extent underscores the geographic imbalances in China’s UA landscape.
The study area comprises the 19 UAs of China proposed in the “Outline of the 14th Five-Year Plan (2021–2025) for National Economic and Social Development and Vision 2035 of the People’s Republic of China” (Figure 1). These are made up of three UAs with high levels of development, nine UAs in the growth stage of development, and seven UAs in the primary stage of development, encompassing a total of 235 cities across China as the primary research subjects [48].

2.2. Data Sources and Processing

(1)
Baidu Migration Big Data
This study utilized Baidu migration data. The migration data are gathered at the administrative unit level, offering a high temporal resolution, with data points collected on a daily basis “https://qianxi.baidu.com (accessed on 17 December 2023)”. Baidu’s Location-Based Services (LBS) open platform provides positioning services to a diverse user base, spanning various age groups and demographics [46]. Consequently, it provides a more accurate depiction of individuals’ daily travel trajectories, making it particularly well suited for analyzing population mobility. To derive the migration scale, a linear mapping function is applied to the scale index [45]. The flows between cities are then computed based on inflow and outflow ratios, thereby reflecting the strength of inter-city connections and forming the network structure of the UAs.
Driven by the repercussions of COVID-19 on the network structure of the UAs, this study took a comprehensive approach by considering the temporal aspects of COVID-19, particularly focusing on key time nodes. The time series is divided into three distinct periods: before COVID-19, spanning from 1 December 2019 to 23 January 2020 (when Wuhan imposed citywide lockdown measures); the normalization stage of COVID-19, extending from 24 January 2020, to 7 January 2023; and after COVID-19, commencing from 8 January 2023 (following the State Council’s approval to lift precautionary measures for Category A infectious diseases related to COVID-19) to 1 June 2023. To minimize the influence of factors such as the Spring Festival and major holidays on population migration patterns, each of these three time periods is constructed using data from 30 selected weekdays, providing an average statistical representation. This data selection process encompassed the Baidu migration data for a total of 235 prefecture-level cities within the nineteen UAs, ultimately resulting in the network structures for each UA in China.
(2)
Urban basic data
In this paper, the basic panel data (GDP, physicians per 10,000 employees, urban highway mileage, and number of university education levels per 10,000 people) of each city in the UAs are derived from the statistical yearbooks of each province in China and are integrated with prefecture-level cities as the unit and standardized to be dimensionless by means of polar deviation normalization. Urban geographic data (geographic distance of cities, number of cross-provincial links) are measured based on the standard geographic coordinate system WGS1984.

2.3. Methodology

This study primarily employs the method of social network analysis to examine the acquired data and formulate the network structure of the UAs. A model for the city network structure is established, allowing for the modeling of network connections between UAs, calculation of pertinent parameters, and visualization of the spatial network construction outcomes. This visualization aids in illustrating the distinctive characteristics of UA spatial network structures. Additionally, two key metrics, network connectivity and network hierarchy, are employed to quantitatively portray the characterization of China’s UA network structure. Furthermore, we conduct QAP analysis to examine alterations in the magnitude of influence exerted by factors on the evolution of the network structure of Chinese UAs under the impact of COVID-19.

2.3.1. Social Network Analysis (SNA)

(1)
Calculation of the strength of network connectedness
Network connectedness refers to the degree or closeness of interconnection between nodes within the network, reflecting the linkage strength between cities in the UA network structure. In this paper, the preliminarily acquired Baidu migration big data are calculated and processed by Equations (1)–(3), and the data of in-migration intensity and out-migration intensity between cities are summed up to obtain the network connectedness of the UAs.
D a b , i n = d a b , i n F a
D a b , o u t = d a b , o u t F a
Q a b = D a b , i n + D a b , o u t
where D a b , i n is the migration intensity of city a to city b on the same day, and d a b , i n is the percentage of the migration intensity from city a to city b on the same day. D a b , o u t is the migration intensity of city b to city a on the same day, and d a b , o u t is the percentage of the migration intensity from city b to city a on the same day. F a is the index of the scale of city a’s migration on the same day, and Q a b is the strength of the network connectedness of the UA.
(2)
Calculation of network density
Network density refers to the degree of connection between the nodes in a network, reflecting the degree of closeness of the node cities in the UA network, and is usually used to characterize the connectedness of the network structure. Network density is generally characterized by the ratio of the number of line elements actually constituting the connection to the number of theoretically existing line elements in the network structure. The calculation formulas are simplified and expressed in Equation (4).
P a = 2 L / [ n ( n 1 ) ]
where Pa is the density of the network of UA a, L is the number of links that are actually connected in the network, and n is the number of nodes in the network.
(3)
Calculation of node centrality
Centrality serves as a fundamental statistical metric within the domain of complex networks, offering insights into the hierarchical aspects of network structure. This metric encompasses point-out degree, point-in degree, and centrality, each of which plays a distinct role. The point-out degree gauges the number and extent of nodes connecting to other nodes, signifying a node’s capacity to propagate information throughout the network. Conversely, the point-in degree reflects the number and magnitude of nodes linked to the node in question, signifying its attractiveness to neighboring nodes within the network. The point centrality degree, which is the summation of the point-out and point-in degrees, encapsulates the influence wielded by each node within the network. This centrality metric characterizes the position and role of cities within the UA network, where higher node centrality corresponds to greater importance and a more elevated status within the network structure. The calculation formulas are Equations (5)–(7):
I B a = n b = 1 D a b , i n ( a b )
O B a = n b = 1 D a b , o u t ( a b )
B a = I B a + O B ( a )
where I B a represents the point-in degree of city a; O B a represents the point-out degree of city a; and B a represents the point-centeredness of city a.
(4)
Calculation of network connectivity
Network connectivity characterizes the degree of connectivity of a network by selecting the number of existing connections in the network, the strength of network connections, and the density of the network. The higher the network connectivity, the more stable the network structure of the UAs is. The calculation formula is Equation (8).
S = Q a P a M m a x ( M )
where S denotes the connectivity of the UA network, Q a denotes the strength of city connections within the UAs, P a denotes the density of the UA network, M denotes the number of redundant connections in the network, and m a x ( M ) denotes the maximum number of possible redundant connections in the network.
(5)
Calculation of network hierarchy
Network hierarchy classifies cities by selecting node centrality and network connectedness, analyses the cities of different hierarchical levels, and selects node hierarchy and linkage hierarchy to describe the hierarchy of the UA network structure. The calculation formula is Equation (9).
β = 1 1 a b B a B b 2 N 1 + 1 m k Q a Q b 2 M 1 2
where β denotes the hierarchy of the network structure, B and Q denote the degree of centrality and the strength of network connectedness, N denotes the number of nodes in the network, and M denotes the number of links in the network; the closer β is to 0 indicates smaller differences in the connections among nodes within the network and that the hierarchy is less obvious, and the closer it is to 1 indicates that the phenomenon of UAs in the network exists and that the hierarchy of the network is more obvious.

2.3.2. Methodology for Analyzing Impact Factors

The variables involved in complex network analysis are all relational data, and there may be multicollinearity among the variables, which makes it difficult to determine whether the interference term obeys the normal distribution. QAP (Quadratic Assignment Procedure) is a non-parametric matrix processing method which does not need to consider the independence of variables, and at the same time, it can better deal with the problem of “multicollinearity” and can better fit the form of network spatial structure. Therefore, it is widely used in the analysis of network structure influencing factors. The QAP model is constructed as shown in Equation (10).
R = f ( r 1 , , r n )
where R represents the stability correlation matrix of China’s UA network structure, and r 1 , , r n represent the matrix of each influencing factor.

2.3.3. Research Framework Graph

The logic of this research is shown in Figure 2.

3. Results

3.1. Spatial Correlation Network of UAs in the Context of COVID-19

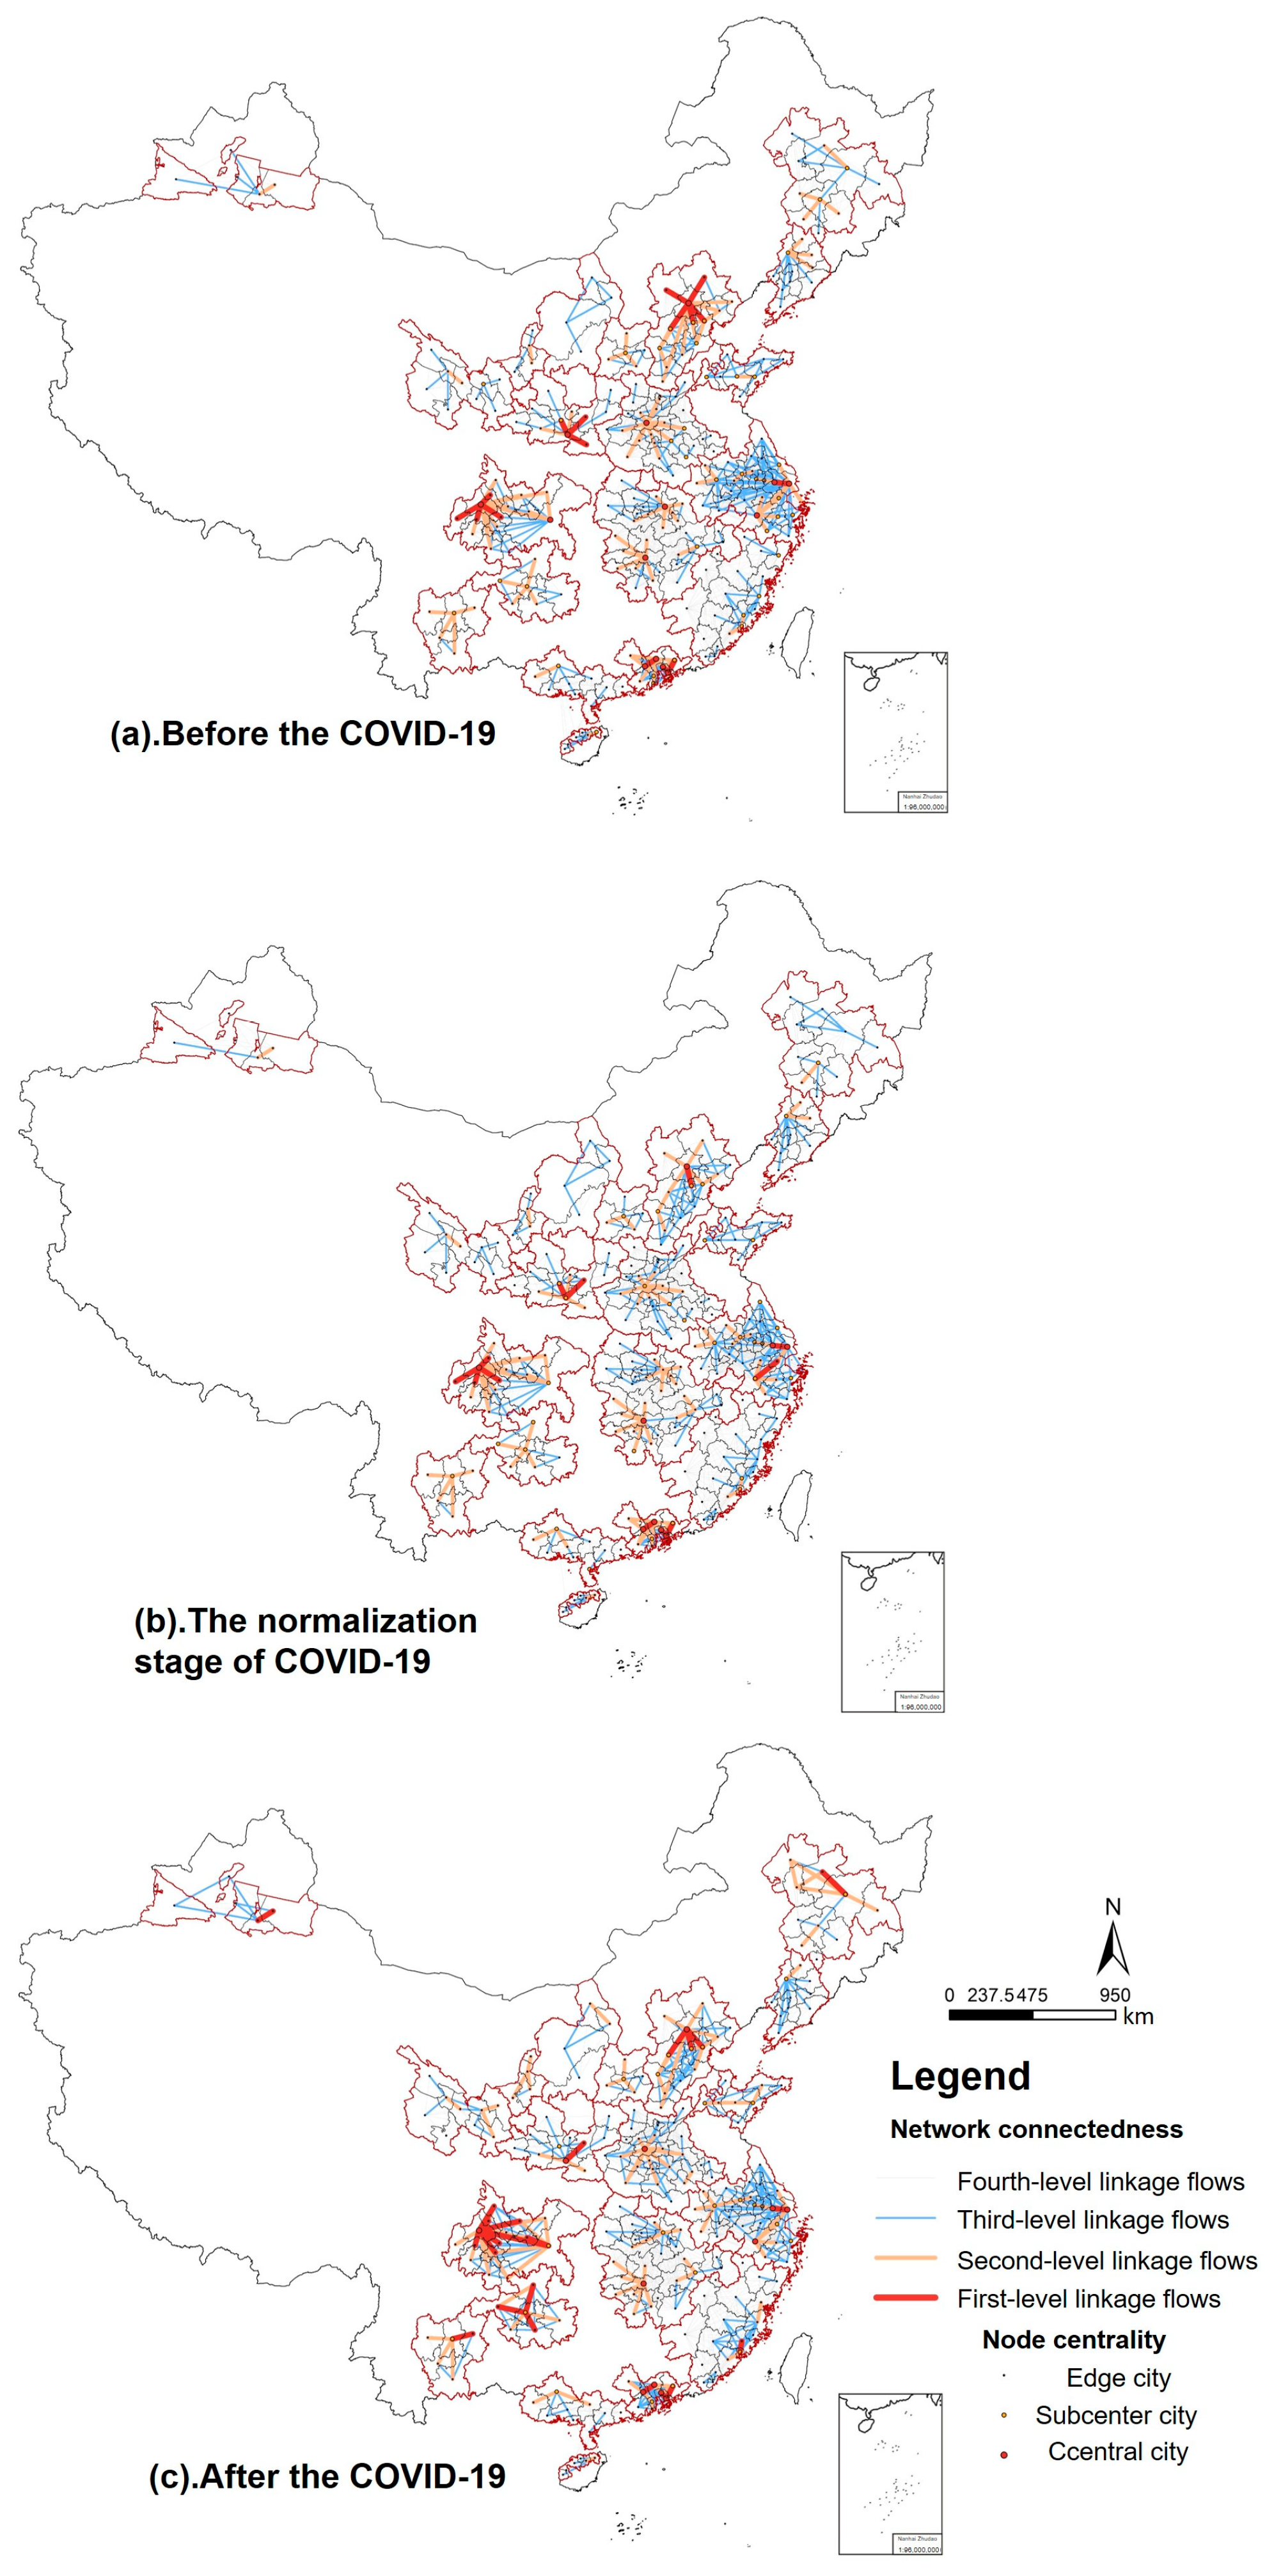
This paper integrated the acquired Baidu migration big data; calculated the UA network connection strength, network density, and the urban centrality of each node; adopted the natural split breakpoint method to divide the acquired 27,493 pairs of OD (Origin-Destination) data of the UAs; and then established the OD network matrix of the nineteen UAs by means of the social network analysis method, and the spatial correlation network diagrams in three time periods are drawn by ArcGIS 10.8 software (Figure 3).
UAs in China are predominantly concentrated in Southeast China, with fewer instances in the northwest. These variations reflect significant disparities in classification and network structures among the UAs. Before COVID-19, the UAs with a high level of development display a more advanced stage of development with tight network connections and higher network density. The central cities exert significant attraction and influence, leading to predominantly first-class and second-class connections within the UAs. This results in a network structure characterized by a remarkable hierarchy and polycentric attributes, with the central cities radiating from a prominent center, thereby forming a closely interlinked network with surrounding cities. Certain cities exhibited pronounced centrality, influencing neighboring cities to establish closely connected network structures. In contrast, the UAs in the growth stage of development demonstrate slightly lower network densities during their mature development stage. The network links between central cities were primarily second-level linkage flows, with fewer first-level linkage flows, resulting in relatively weaker overall network connections. Conversely, the UAs in the primary stage of development are still in their nascent stages of development. City connections are primarily based on third-level and fourth-level linkage flows, yielding lower network density and linkage intensity, signifying that these UAs are still in their developmental stages and have not yet established a stable network structure.
During the normalization stage of COVID-19, the network structure of UAs is significantly impacted by COVID-19, particularly in the UAs with a high level of development. The mature UAs of the Yangtze River Delta, Pearl River Delta, and Beijing–Tianjin–Hebei experience more pronounced effects compared to other UAs. The impacts are predominantly observed in long-distance third-level and fourth-level linkage flows, resulting in a notable overall decrease in their network connections. This manifested as a discernible weakening of the central effect of the central cities and the sub-central cities.
After COVID-19, the network structures of the UAs were under reconstruction. The UAs with a high level of development witnessed significant recovery in network connectivity and hierarchy, with the network structures becoming more stabilized, and hierarchical trends becoming apparent. The network structures of the UAs largely regained their pre-epidemic levels. Beijing–Tianjin–Hebei and Chengdu–Chongqing exhibited first-level and second-level linkage flows surpassing pre-epidemic levels in terms of quantity and values, signifying stronger network links between major cities in these UAs. The UAs in the growth stage of development and in the primary stage of development also displayed signs of recovery, albeit at a relatively slower pace.

3.2. Characteristics of the Network Structure of UAs in the Context of COVID-19

The overall network structure characteristics in the context of COVID-19 are calculated through the Ucinet 6.0 software, including network connectivity and network hierarchy.
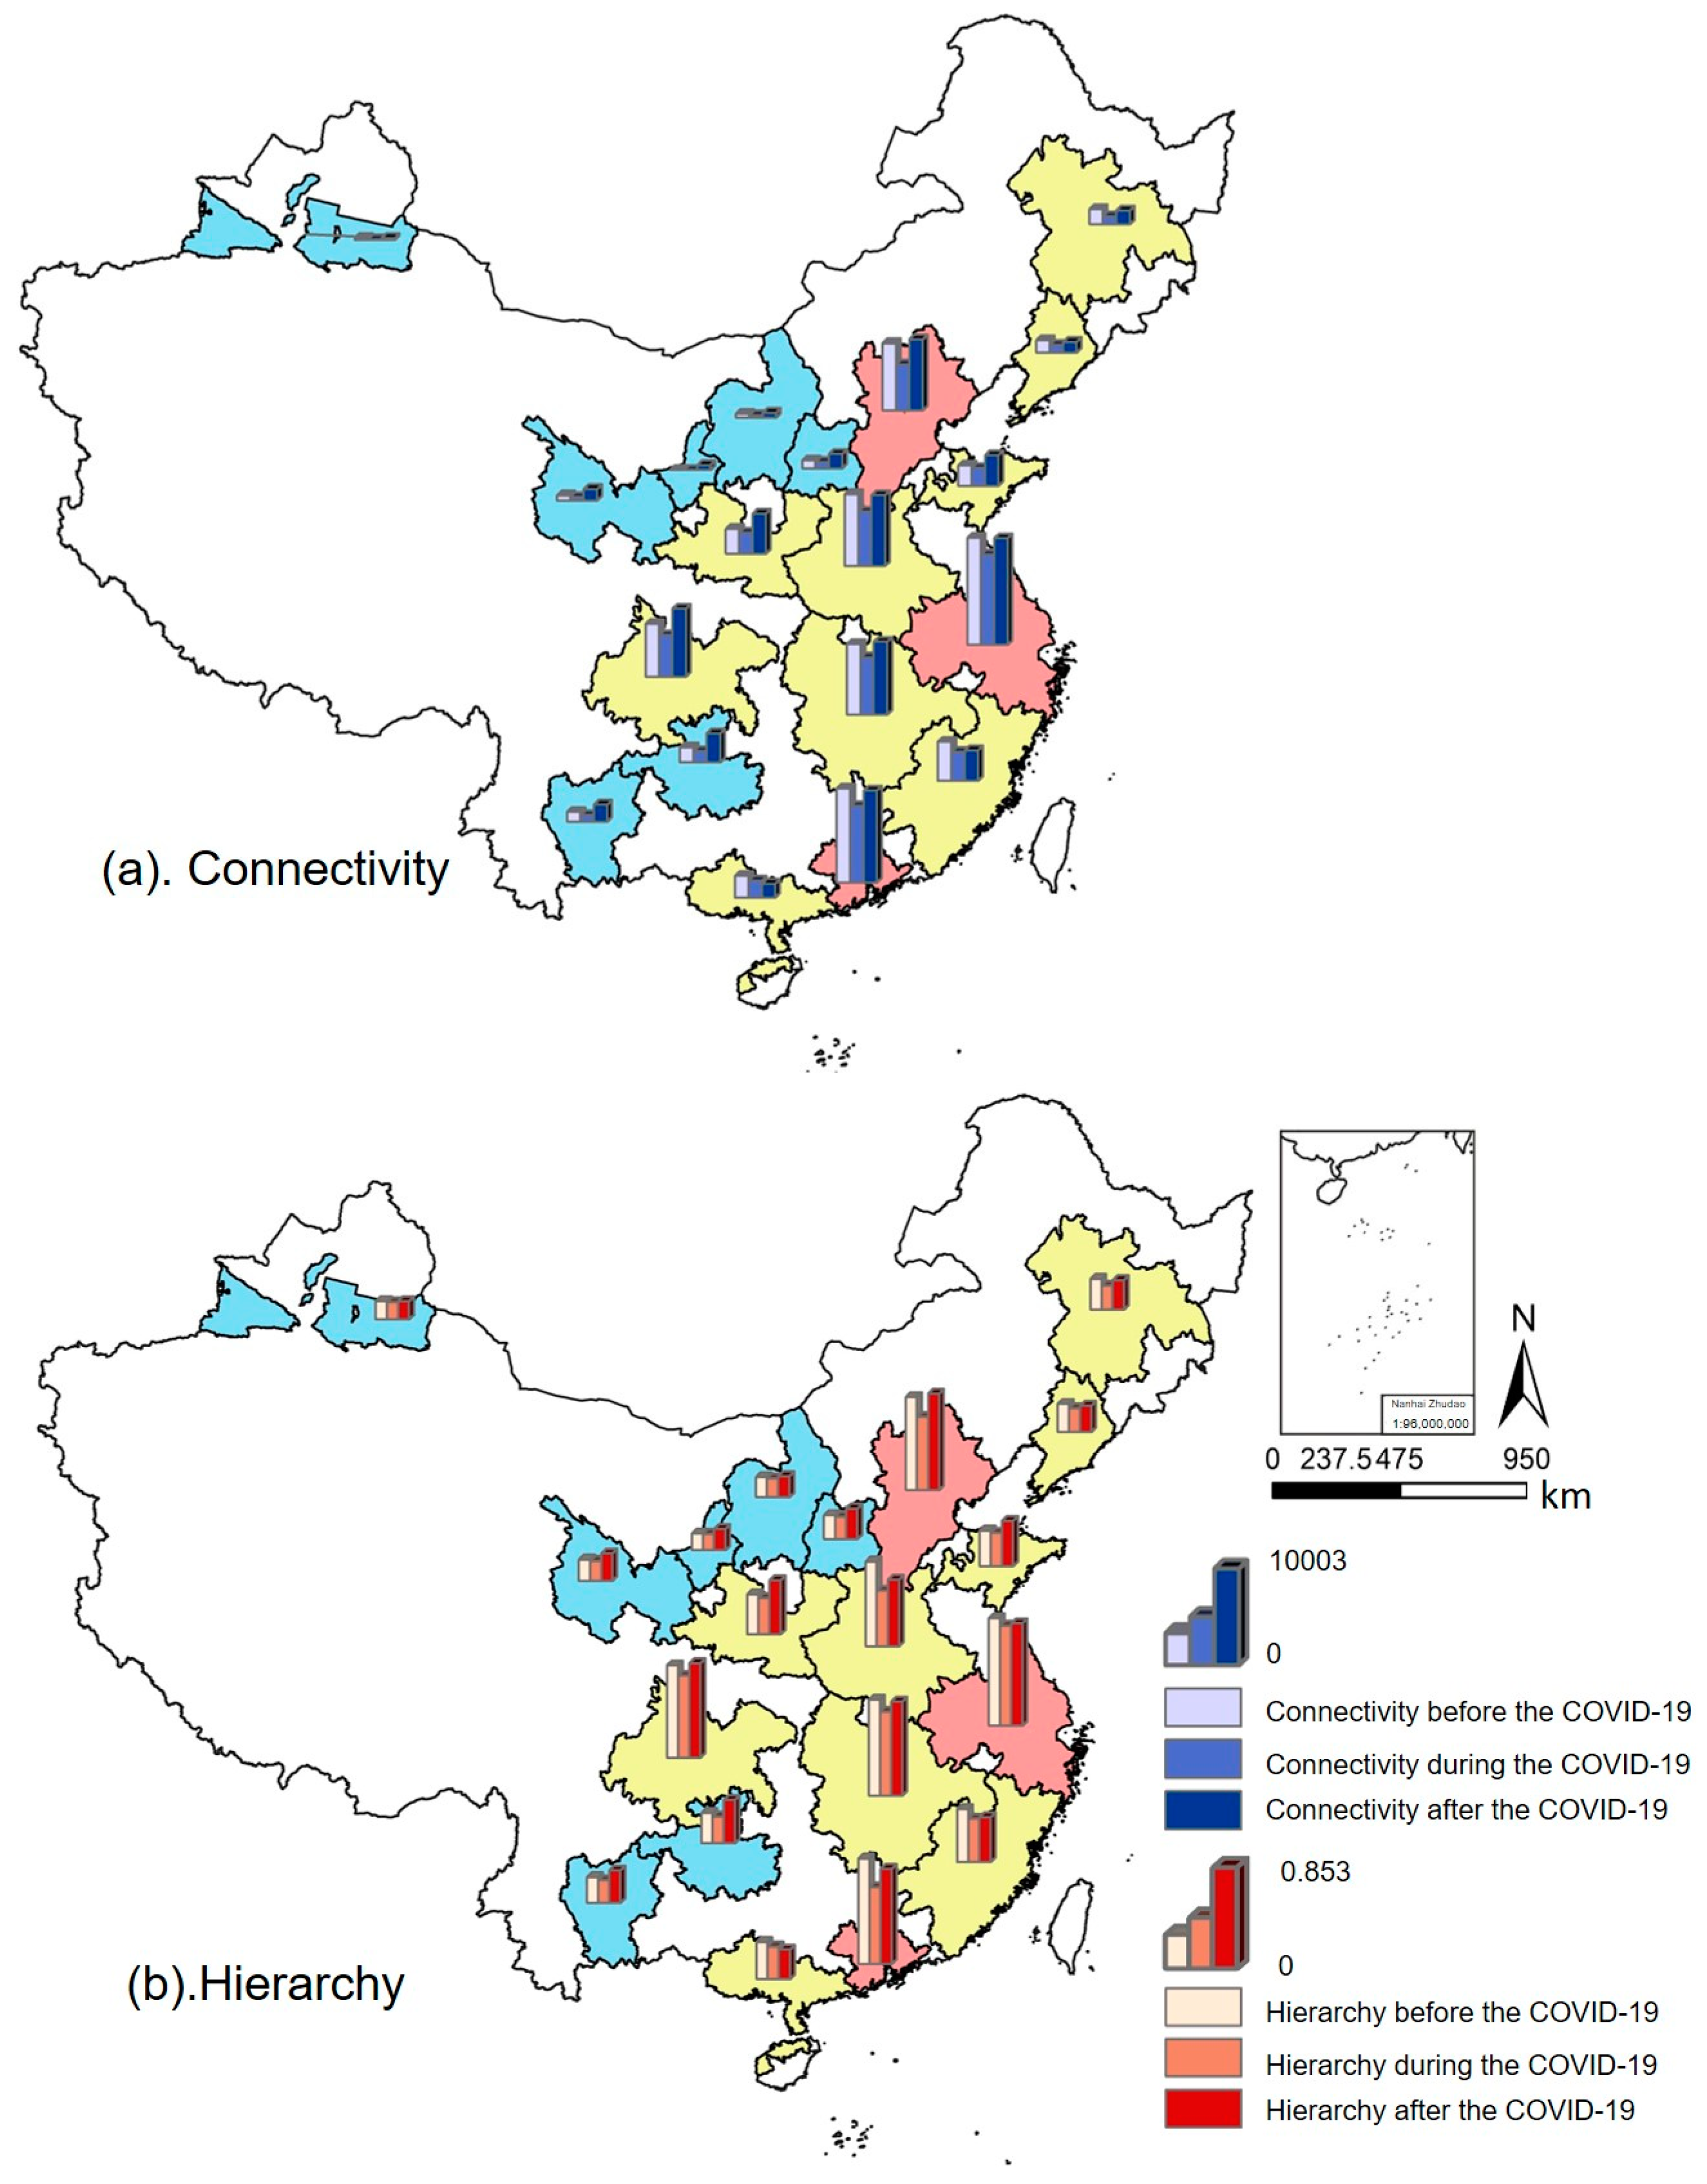
Based on the results obtained from Table 1 and Figure 4, the following insights can be drawn regarding the characteristics of China’s UA network structures under the influence of COVID-19:
Numerically, the connectivity and hierarchy of China’s UA network structures display a common trend of initial decline followed by recovery during COVID-19’s influence. Moreover, varying degrees of impact and recovery are observed among different UAs. Overall, these UAs exhibit three hierarchical levels of network structure characteristics that correspond to their developmental stages. UAs with a high level of development displayed notably higher network connectivity and hierarchy than those in the growth stage of development and in the primary stage of development.
Regarding the development types of UAs, the UAs with a high level of development are severely affected in terms of network connectivity and hierarchy during COVID-19. This decline is correlated with the level of development, signifying that more mature UAs suffered a greater impact from COVID-19. However, these UAs rapidly recovered their network structures after COVID-19, indicating their relatively strong network stability. They could respond quickly and undergo reconstruction after being affected by public health emergencies.
In the UAs in the growth stage of development, the influence on network connectivity and hierarchy tends to be comparatively subdued. The network structures of these UAs displayed an inherent immaturity before COVID-19, marked by a generally feeble connectivity and hierarchy. Consequently, the impact during COVID-19 was less pronounced. Nonetheless, these UAs demonstrated a relatively inadequate recovery of network structure stability after COVID-19, underscoring the imperative for heightened stability and reinforced connections across various dimensions. This indicates an ongoing journey towards achieving a mature level of network structure.
UAs in the primary stage of development displayed low network structure stability before COVID-19, with a relatively minor impact during COVID-19. These UAs exhibited significant post-pandemic recovery and exceeded pre-pandemic levels, indicating their rapid development and progress.
In summary, the evolution pattern of network structure in China’s UAs can be broadly summarized as a two-stage process: disruption due to COVID-19 followed by recovery and reconstruction. The COVID-19 pandemic had a considerable impact on UA network structures, with varying degrees of influence observed across different UAs, leading to noticeable spatial differences. Further in-depth research is needed to explore the factors affecting the UA network structures during COVID-19.

3.3. Influencing Factor Analysis of the Network Structure of UAs in the Context of COVID-19

3.3.1. Selection of Factors Influencing the Network Structure of UAs in the Context of COVID-19

The UA network structure, functioning as a complex network system, is subject to the influence of a multitude of factors. Within this framework, the selection of variables corresponds to five dimensions: economic development level, medical facility capacity, transportation infrastructure capacity, spatial proximity, and innovation accessibility. These selected variables are then employed to unveil the factors exerting an impact (Table 2). The analytical methodology involves conducting correlation analysis and regression analysis employing the Quadratic Assignment Procedure (QAP).

3.3.2. QAP Correlation Analysis

By employing the QAP for correlation analysis encompassing 5000 random permutations, we acquired outcomes related to the evaluation of factors impacting the UA network structures in China before and after COVID-19 (Figure 5). In this framework, a significance level of ≥0.1 suggests that the influencing factors failed to achieve statistical significance, while a significance level of ≤0.1 attests that the influencing factors met the criteria for statistical significance, indicating a meaningful correlation with network structure.
Note: In the table, areas shaded in light red signify that the results did not pass the significance level test, indicating an absence of discernible correlation in the variable matrix. Conversely, green shading indicates that the variable successfully passes the significance level test, with the depth of color indicating the magnitude of correlation, wherein darker hues signify higher correlation levels.
Based on the findings presented in Figure 5, UAs in the primary stage of development exhibit a greater number of factors that did not achieve statistical significance in the significance level test. Consequently, these factors are deemed statistically insignificant for subsequent regression analysis. In contrast, UAs in other developmental stages displayed more pronounced results in the correlation analysis, qualifying them for inclusion in the regression analysis built upon the outcomes of the QAP correlation analysis.

3.3.3. QAP Regression Analysis

This study excludes the UAs that did not meet the significance level threshold as indicated in Figure 5, then selects 10,000 random permutations to obtain the QAP regression analysis results, as shown in Figure 6.
Note: In the table, areas shaded in light red signify that the results did not pass the significance level test, indicating an absence of discernible correlation in the variable matrix. Conversely, green shading indicates that the variable successfully cleared the significance level test, with the depth of color indicating the magnitude of correlation, wherein darker hues signify higher correlation levels.
Since the constructed dimension involves a difference matrix, significant negative variable regression results suggest that a smaller disparity in the variable matrix is conducive to enhancing the stability of UA network structures. Conversely, when variable regression results are significantly positive, it implies that a greater disparity in the variable matrix is less favorable for improving the stability of UA network structures. The dependent variable in this analysis is the spatial correlation matrix representing UA network stability. The independent variables consist of absolute difference matrices for various variable values. These matrices are standardized to eliminate dimensional influence.
A comparative examination of the data in Figure 6 yielded the following outcomes:
Spatial proximity exerts a significant adverse influence on the UA network structures. This arises from the heightened geographical distances and the presence of cross-provincial connections between cities, which escalate the costs associated with intercity interactions. Consequently, this scenario imposes restrictions on communication and collaborative efforts among cities within UAs. Consequently, After COVID-19, the deleterious impact of spatial proximity on the UA network structures is exacerbated.
The level of economic development exhibits discernible variations among the UAs. Notably, this influencing factor demonstrates a significant negative correlation with UAs in the mature stage of development, signifying that such mature UAs prominently feature a central city that assumes a leading role within the UA network. The greater the divergence in economic development levels, the more conspicuous the radiative influence of the central city, contributing to the stabilization of the network structure. Simultaneously, under the impact of COVID-19, this influencing factor exerts a negative impact on mature UAs. Furthermore, COVID-19 intensifies the adverse effects of this influencing factor on these UAs. Scholars have substantiated that COVID-19 disproportionately affects the central city of UAs, consequently diminishing the hierarchical structure of the UA network.
For UAs in the growth stage of development, the correlation is notably positive, with little change observed before and after COVID-19. This pattern is attributed to the less prominent role of the central city in these UAs, making greater differences in urban economic development detrimental to network structure. Additionally, COVID-19 has a more extensive influence on these UAs, resulting in minimal hierarchical changes in the network structure. Consequently, the impact of this influencing factor remains relatively stable before and after COVID-19.
Furthermore, the impact of the level of medical facilities, transportation facilities, and innovation accessibility on the network structure varies significantly for each UA before and after COVID-19. Before COVID-19, the level of medical facilities was not the primary factor influencing network structure. However, during the normalization stage of COVID-19, the level of medical facilities emerged as the principal factor affecting the UA network structures, with a greater impact than observed before COVID-19. This shift indicates a heightened demand for medical facilities in UAs under the influence of COVID-19. Consequently, the UAs with a high level of development experienced a lower impact from this factor on network structure. Conversely, other UAs in the developmental and growth stages, lacking sufficient medical resources, are unable to establish robust resource-sharing systems among cities, making this factor less crucial to the network structures. Hence, the influence of this factor on network structure is more pronounced for such UAs.
The impact of transportation facilities and innovation and accessibility levels exhibits a positive association with the UA network structures, both before and after COVID-19. However, during the normalization stage of COVID-19, this influencing factor did not significantly affect the majority of UAs, and those influenced exhibited a noticeable reduction in the degree of impact. This observation suggests that policies and controls related to transportation influenced by COVID-19 profoundly affected inter-city transportation links within UAs.

4. Discussion

4.1. Discussion of the Characteristics of the Network Structures of Different Types of UAs

4.1.1. Discussion of Methodological Implications of the Research

This paper constructs the network structure of nineteen UAs in China and applies social network analysis to calculate the indicators, and the results show that different UAs present different network structure characteristics. Therefore, based on the characteristics of UA network structure, the nineteen UAs in China are divided into three levels. The conclusion of this network structure characteristic reflects the application of the social network analysis method in the study of urban agglomeration network structures. Meanwhile, this paper constructs a regression model and extracts the factors influencing UA network structure, and the correlation weights and regression coefficients of each factor are obtained by QAP analysis method, the mechanism of influencing the network structure of UAs of different levels is analyzed, and the influence of multiple covariance of each factor in the calculation is excluded, which reflects the innovation of the QAP analysis method in the research on the influencing factors of UA network structure.

4.1.2. Impact of COVID-19 on the Overall UA Network Structure

In a broader context, the network structure of UAs undergoes notable influences due to COVID-19. Throughout the normalization stage of COVID-19, the network patterns within each UA underwent disruption, characterized by a conspicuous reduction in the strength of network connections and a weakening of hierarchical characteristics in the UA network structure. The centralizing effect of both the central city and the sub-central city noticeably attenuated (Figure 3b). These results are similar to those of other articles [17,31]. After COVID-19, the network structures of the UAs commenced a recovery phase, stabilizing and manifesting hierarchical characteristics once again (Figure 3c). This diminished network connectivity may have adverse effects on collaboration and economic development within UAs. The implementation of epidemic control measures widened the gap between the central city and its neighboring cities, decelerating the polycentric trend within the UAs [17]. This implies a relatively weakened position of the central city during COVID-19, and the developmental focus within the UAs shifted from being concentrated on a few core cities. Distinctive epidemic control mechanisms across provinces introduced inter-provincial boundary effects between UAs, impeding the integrated development of these UAs.

4.1.3. Impact of COVID-19 on the Network Structure of UAs with a High Level of Development

Throughout the normalization stage of COVID-19, the UAs with a high level of development experienced more pronounced effects from COVID-19 on their network structure, with more severe impacts on network structure indicators [49]. The overall value of affected network linkage notably decreased, accompanied by a significant weakening of the central influence from both the central city and sub-central city. The linkage and hierarchical characteristics of their network structure decreased significantly, demonstrating more pronounced effects compared to the other two types of UAs. Moreover, there is a noticeable impact of inter-provincial boundaries, more prominent than observed in the other two types of UAs. After COVID-19, the network connection of this particular UA type demonstrated substantial recovery, restoring the network structure before COVID-19 (Figure 4).
Among the factors influencing the network structure of UAs in the mature stage of development, the level of economic development and spatial proximity exhibited a negative correlation, with the negative effect significantly intensified after COVID-19. The negative correlation level of the economic development is greater than that of spatial proximity, and the influence of geographical distance on spatial proximity is more substantial than the impact of inter-provincial boundaries. The overall positive correlation among the level of medical facilities, level of transportation facilities, and level of innovation and accessibility is evident, with the level of medical facilities having a less significant impact before COVID-19 and a considerably heightened impact during the normalization stage of COVID-19 (Figure 6). The levels of transportation facilities and innovation and openness experienced significant weakening during the normalization stage of COVID-19 [18,49].

4.1.4. Impact of COVID-19 on the Network Structure of UAs in the Growth Stage of Development

The impact on the UAs in the growth stage of development is relatively modest. Notably, the effects are particularly evident in the increased prominence of inter-provincial borders, a discernible reduction in the central city’s capacity to exert influence on surrounding cities, and a decrease in network structure linkage. After COVID-19, the recovery of the network structure of the UAs in the growth stage of development is marginally slower compared to that of the UAs with a high level of development.
As for spatial proximity, it demonstrates an overall negative correlation effect, with the interprovincial boundary effect exerting a more substantial influence than geographic distance. Economic development levels exhibit negative correlations. This indicates that the central cities in these UAs have begun to assume a leading role in radiation. The levels of medical facilities, transportation facilities, and innovation and accessibility all show positive correlations. However, during the normalization stage of COVID-19, the levels of transportation facilities, innovation, and accessibility cease to be the primary factors influencing the network structure of these UAs (Figure 6).

4.1.5. Impact of COVID-19 on the Network Structure of UAs in the Primary Stage of Development

The impact on the UAs in the primary stage of development, while present, is not as pronounced compared to the other types of UAs. After COVID-19, the network structure of UAs in the primary stage of development exhibits corresponding recovery characteristics, albeit with a relatively slower recovery trend. Following QAP analysis, it is deduced that this categorization is attributed to the inclusion of fewer cities, limited sample size in the study, slow developmental progress, reliance on a single industry, and insufficient population carrying capacity. Consequently, the network structure, formed by the big data of the floating population, is deemed immature and less stable, hindering a comprehensive understanding and impeding the effective exploration of relevant influencing factors due to its poor stability (Figure 5).

4.2. Policy Promotion Strategy

COVID-19 has exerted a significant influence on the network structure of the UAs in China, revealing a multitude of challenges in the trajectory of UA development. Drawing upon the aforementioned analysis and findings, this study proposes the following recommendations for the integration and construction processes of UAs in China.

4.2.1. Foster Scientific and Rational Evolution of UA Network Structures

Comprehend the distinctive features inherent in various types of UA network structures, facilitate the close interconnection of nodes within UA networks, and judiciously formulate the hierarchical framework of UAs. The UAs with a high level of development are advised to enhance the pivotal role of the central node city, reinforce linkages between the central city and its adjacent counterparts, stimulate the development of neighboring node cities, and mitigate the impact of inter-provincial boundaries. The UAs in the growth stage of development should intensify the development of the central city, amplify its influence, and foster the scientific and rational evolution of UA network structures. In the primary stage of development, emphasis should be placed on nurturing the central city, establishing early radiation influence, and augmenting the connectivity among other cities within the UAs, thereby expediting the network structure’s rapid development.

4.2.2. Upgrading the Economic Development of UAs

Give precedence to the elevation of economic development levels in UAs at the growth and primary stages. UAs should enhance economic collaboration and exchanges, facilitate the sharing and complementarity of resources for regional integration, narrow the urban–rural income gap, fortify social equity and balanced development within UAs, elevate the overall economic development level, and foster the collective advancement of UAs.

4.2.3. Enhance the Quality of Medical Services

Amidst epidemics, the adequacy of medical resources is pivotal for the stable operation of UAs. Governments should bolster the construction and spatial planning of health institutions, augment the number of practicing physicians, enhance the quality of medical services, and encourage close collaboration among medical facilities within UAs to foster regional medical integration, ensuring effective responses to public health events.

4.2.4. Promoting the Integration of UAs

Optimize the impact of inter-provincial boundaries during the growth and primary stages of UAs. Governments should reinforce inter-provincial cooperation, eliminate administrative barriers hindering the integration of UAs, facilitate the flow of resources and exchanges between provinces, and dismantle provincial impediments to foster collaborative and unified governance in UAs.

4.3. Limitations and Future Work

The study of relevant influencing factors for UAs in the primary stage of development is a challenge, as these areas are characterized by fewer cities, limited study samples, slower development, a singular industry focus, and insufficient population carrying capacity. Consequently, the network structure constituted by the big data of the floating population in these UAs is considered immature, less stable, and poses challenges for a thorough understanding of influencing factors. However, it is acknowledged that this approach might not entirely capture the multifaceted characteristics of UA network structures, given that urban linkage networks are complex entities encompassing various elements such as population, economy, information, and transportation. In addition, the current status and differences in the development of urban agglomerations in different countries and regions can have a complex impact on the network structure of urban agglomerations, and thus the evolution of the network structure of other urban agglomerations on a global scale needs to be further analyzed. Future investigations could employ analogous methodologies to examine other facets of urban networks, including economy, information, knowledge, and beyond. Subsequent studies should aim to address these limitations and delve more deeply into these issues.

5. Conclusions

This study, specifically focusing on the nineteen UAs in China, aims to scrutinize the spatial and temporal characteristics within the linkage network of UAs. The temporal dimension is explored across three stages, providing a multi-scale, multi-dimensional perspective. The study elucidates the temporally and spatially divergent characteristics of China’s UA network structures and their respective influences under COVID-19, leading to the formulation of conclusive findings: (1) COVID-19 has an impact on the structure of the UA network structure. The transformation of the network structure of Chinese UAs unfolds through two distinct phases: impact damage and recovery and reconstruction. (2) COVID-19’s influence on the network structure is primarily evident in alterations to network connection strength, changes in network density, variations in the impact of central cities, and the emergence of inter-provincial boundary effects. Distinct stages of development in UAs exhibit varying degrees of impact and recovery during different periods of COVID-19. (3) The network structure of UAs exhibits strong correlations with economic development levels, medical facility standards, and geographic proximity.
Our results revealed that UA network structure is influenced by a multifaceted interplay of factors, requiring a comprehensive analysis for effective policy formulation in UA construction.

Author Contributions

Conceptualization, J.W. and L.X.; methodology, J.W.; software, J.W.; validation, J.W.; formal analysis, J.W.; investigation, J.W.; resources, J.W.; data curation, J.W.; writing—original draft preparation, J.W.; writing—review and editing, J.W., L.X., Y.S., Z.L. and Q.M.; visualization, J.W.; supervision, L.X., Y.S., Z.L. and Q.M.; project administration, L.X.; funding acquisition, L.X. All authors have read and agreed to the published version of the manuscript.

Funding

This research was funded by the Natural Science Foundation of Zhejiang Province (Grant No. LZ23D010001).

Data Availability Statement

Publicly available datasets were analyzed in this study. This data can be found here: https://qianxi.baidu.com (accessed on date 19 May 2024).

Conflicts of Interest

The authors declare no conflicts of interest. The funders had no role in the design of the study; in the collection, analyses, or interpretation of data; in the writing of the manuscript; or in the decision to publish the results.

References

  1. Fang, C.; Cui, X.; Li, G.; Bao, C.; Wang, Z.; Ma, H.; Sun, S.; Liu, H.; Luo, K.; Ren, Y. Modeling regional sustainable development scenarios using the Urbanization and Eco-environment Coupler: Case study of Beijing-Tianjin-Hebei urban agglomeration, China. Sci. Total Environ. 2019, 689, 820–830. [Google Scholar] [CrossRef] [PubMed]
  2. Qiao, W.; Huang, X. The impact of land urbanization on ecosystem health in the Yangtze River Delta urban agglomerations, China. Cities 2022, 130, 103981. [Google Scholar] [CrossRef]
  3. Wu, J.; Huang, Y.; Jiang, W. Spatial matching and value transfer assessment of ecosystem services supply and demand in urban agglomerations: A case study of the Guangdong-Hong Kong-Macao Greater Bay area in China. J. Clean. Prod. 2022, 375, 134081. [Google Scholar] [CrossRef]
  4. Lin, S.; Chen, Z.; He, Z. Rapid Transportation and Green Technology Innovation in Cities—From the View of the Industrial Collaborative Agglomeration. Appl. Sci. 2021, 11, 8110. [Google Scholar] [CrossRef]
  5. Zhong, C.; Arisona, S.M.; Huang, X.; Batty, M.; Schmitt, G. Detecting the dynamics of urban structure through spatial network analysis. Int. J. Geogr. Inf. Sci. 2014, 28, 2178–2199. [Google Scholar] [CrossRef]
  6. Weladee, S.; Sanit, P. The Spatial Distribution of Taxi Stations in Bangkok. Sustainability 2023, 15, 14080. [Google Scholar] [CrossRef]
  7. Lasota, M.; Zabielska, A.; Jacyna, M.; Gołębiowski, P.; Żochowska, R.; Wasiak, M. Method for Delivery Planning in Urban Areas with Environmental Aspects. Sustainability 2024, 16, 1571. [Google Scholar] [CrossRef]
  8. Fang, C. Important progress and future direction of studies on China’s urban agglomerations. J. Geogr. Sci. 2015, 25, 1003–1024. [Google Scholar] [CrossRef]
  9. Yue, M.; Ma, S. LSTM-Based Transformer for Transfer Passenger Flow Forecasting between Transportation Integrated Hubs in Urban Agglomeration. Appl. Sci. 2023, 13, 637. [Google Scholar] [CrossRef]
  10. Keil, R.; Ali, H. Governing the sick city: Urban governance in the age of emerging infectious disease. Antipode 2007, 39, 846–873. [Google Scholar] [CrossRef]
  11. Das, D.; Zhang, J.J. Pandemic in a smart city: Singapore’s COVID-19 management through technology & society. Urban Geogr. 2021, 42, 408–416. [Google Scholar]
  12. Mandavilli, A. SARS epidemic unmasks age-old quarantine conundrum. Nat. Med. 2003, 9, 487. [Google Scholar] [CrossRef] [PubMed]
  13. Jia, J.S.; Lu, X.; Yuan, Y.; Xu, G.; Jia, J.; Christakis, N.A. Population flow drives spatio-temporal distribution of COVID-19 in China. Nature 2020, 582, 389–394. [Google Scholar] [CrossRef]
  14. Batty, M. The New Science of Cities; MIT Press: Cambridge, MA, USA, 2013. [Google Scholar]
  15. Stouffer, S.A. Intervening Opportunities: A Theory Relating Mobility and Distance. Am. Sociol. Rev. 1940, 5, 845–867. [Google Scholar] [CrossRef]
  16. Rogerson, P.A. Parameter estimation in the intervening opportunities model. Geogr. Anal. 1986, 18, 357–360. [Google Scholar] [CrossRef]
  17. Jiang, X.; Wei, W.; Wang, S.; Zhang, T.; Lu, C. Effects of COVID-19 on urban population flow in China. Int. J. Environ. Res. Public Health 2021, 18, 1617. [Google Scholar] [CrossRef] [PubMed]
  18. Mu, X.; Fang, C.; Yang, Z.; Guo, X. Impact of the COVID-19 epidemic on population mobility networks in the Beijing–Tianjin–Hebei urban agglomeration from a resilience perspective. Land 2022, 11, 675. [Google Scholar] [CrossRef]
  19. Zhang, W.; Chong, Z.; Li, X.; Nie, G. Spatial patterns and determinant factors of population flow networks in China: Analysis on Tencent Location Big Data. Cities 2020, 99, 102640. [Google Scholar] [CrossRef]
  20. Wang, Y.; Sun, Q.; Yang, S.; Pei, R.; Xiao, G.; Liu, B. Human factors analysis and risk assessment during the spread of the Covid-19 epidemic: A case study of the 2019 Wuhan outbreak in China. Hum. Ecol. Risk Assess. Int. J. 2022, 28, 1124–1145. [Google Scholar] [CrossRef]
  21. Yang, H.; Zhai, G.; Zhang, Y. Ecological vulnerability assessment and spatial pattern optimization of resource-based cities: A case study of Huaibei City, China. Hum. Ecol. Risk Assess. Int. J. 2021, 27, 606–625. [Google Scholar] [CrossRef]
  22. Luan, X.; Xiang, P.; Jia, F. The Interconnectivity and Spatio-Temporal Evolution of Rail Transit Network Based on Multi-Element Flows: A Case Study of Beijing-Tianjin-Hebei Urban Agglomeration, China. Land 2024, 13, 249. [Google Scholar] [CrossRef]
  23. Yang, M.; Zhai, G. Measurement and Influencing Factors of Economic Resilience over a Long Duration of COVID-19: A Case Study of the Yangtze River Delta, China. Land 2024, 13, 175. [Google Scholar] [CrossRef]
  24. Castells, M. The Informational City: Information Technology, Economic Restructuring, and the Urban-Regional Process; Blackwell Oxford: Hoboken, NJ, USA, 1989; Volume 1. [Google Scholar]
  25. de Vries, J.J.; Nijkamp, P.; Rietveld, P. Exponential or Power Distance-Decay for Commuting? An Alternative Specification. Environ. Plan. A Econ. Space 2009, 41, 461–480. [Google Scholar] [CrossRef]
  26. Zhong, Y.; Chen, Y.; Qiu, J. Study on the Spatial Structure of the Complex Network of Population Migration in the Poyang Lake Urban Agglomeration. Sustainability 2023, 15, 14789. [Google Scholar] [CrossRef]
  27. Brashears, M.E. Exponential Random Graph Models for Social Networks: Theory, Methods, and Applications. Contemp. Sociol. 2014, 43, 552–553. [Google Scholar] [CrossRef]
  28. Jiang, X.; Wang, S. Research on China’s urban population mobility network: Based on Baidu migration big data. Chin. J. Popul. Sci. 2017, 2, 35–46. [Google Scholar]
  29. Liu, H.; Wang, L.; Li, Q.; Yan, C. Spatial and temporal patterns of city connection networks in the Yellow River Basin based on Tencent’s big data of population migration. Econ. Geogr. 2020, 40, 28–37. [Google Scholar]
  30. Wu, K.; Li, C.; Liu, J.; Hao, H. Identification of growth boundary of core areas in an urban agglomeration based on spatial syntax theory. Geogr. Res. 2020, 39, 1418–1426. [Google Scholar] [CrossRef]
  31. Liang, Z.; Huang, J.; Wei, F.; Shen, J.; Li, S. Identifying the spatial range of urban agglomerations in China based on night light remote sensing and POI data. Geogr. Res 2020, 39, 92–102. [Google Scholar]
  32. Lu, Z.; Li, W.; Zhou, S. Constructing a resilient ecological network by considering source stability in the largest Chinese urban agglomeration. J. Environ. Manag. 2023, 328, 116989. [Google Scholar] [CrossRef]
  33. Li, H.; Hu, X.-B.; Guo, X.; Liu, H. An improved model considering traditional network properties to assess spatial vulnerability of a network system. Hum. Ecol. Risk Assess. Int. J. 2017, 23, 519–533. [Google Scholar] [CrossRef]
  34. Liu, H.; Zhou, L.; Tang, D. Exploring the impact of urbanization on ecological quality in the middle reaches of the Yangtze River Urban Agglomerations, China. Hum. Ecol. Risk Assess. Int. J. 2023, 29, 1276–1298. [Google Scholar] [CrossRef]
  35. Lu, Y.; Zhai, G.; Zhou, S.; Shi, Y. Risk reduction through urban spatial resilience: A theoretical framework. Hum. Ecol. Risk Assess. Int. J. 2021, 27, 921–937. [Google Scholar] [CrossRef]
  36. Liu, D.; Wang, Y.; Wang, L.; Xu, L.; Chen, H.; Ma, Y. Analysis of Spatiotemporal Changes in the Gravitational Structure of Urban Agglomerations in Northern and Southern Xinjiang Based on a Gravitational Model. Land 2024, 13, 29. [Google Scholar] [CrossRef]
  37. Porat, I.; Benguigui, L. Global migration topology analysis and modeling of directed flow network 2006–2010. Phys. A Stat. Mech. Its Appl. 2021, 561, 125210. [Google Scholar] [CrossRef]
  38. Krackardt, D. QAP partialling as a test of spuriousness. Soc. Netw. 1987, 9, 171–186. [Google Scholar] [CrossRef]
  39. Butts, C.T. Social network analysis: A methodological introduction. Asian J. Soc. Psychol. 2008, 11, 13–41. [Google Scholar] [CrossRef]
  40. Rank, O.N. Formal structures and informal networks: Structural analysis in organizations. Scand. J. Manag. 2008, 24, 145–161. [Google Scholar] [CrossRef]
  41. Feng, X.; Pan, C.; Xu, F. The Spatial Structure and Influencing Factors of the Tourism Economic Network in the Yangtze River Delta Urban Agglomeration. Tour. Hosp. 2024, 5, 60–79. [Google Scholar] [CrossRef]
  42. De Montis, A.; Barthélemy, M.; Chessa, A.; Vespignani, A. The structure of interurban traffic: A weighted network analysis. Environ. Plan. B Plan. Des. 2007, 34, 905–924. [Google Scholar] [CrossRef]
  43. Colizza, V.; Barrat, A.; Barthélemy, M.; Vespignani, A. The role of the airline transportation network in the prediction and predictability of global epidemics. Proc. Natl. Acad. Sci. USA 2006, 103, 2015–2020. [Google Scholar] [CrossRef] [PubMed]
  44. Xu, J.; Li, A.; Li, D.; Liu, Y.; Du, Y.; Pei, T.; Ma, T.; Zhou, C. Difference of urban development in China from the perspective of passenger transport around Spring Festival. Appl. Geogr. 2017, 87, 85–96. [Google Scholar] [CrossRef]
  45. Wang, C.; Yan, J. An inversion of the constitution of the Baidu migration scale index. Dianzi Keji Daxue Xuebao/J. Univ. Electron. Sci. Technol. China 2021, 50, 616–626. [Google Scholar]
  46. Zeyu, X.; Mian, Y. Impacts of Fighting COVID-19 on China’s Population Flows: An Empirical Study Based on Baidu Migration Big Data. Popul. Res. 2020, 44, 74–88. [Google Scholar]
  47. Zhang, C.; Li, Y.; Xiong, S.; Lu, X.; Zhu, X. Regional environmental risk assessment and management guide for rapid urbanization process of a city cluster in China. Hum. Ecol. Risk Assess. Int. J. 2016, 22, 283–301. [Google Scholar] [CrossRef]
  48. Fang, C.; Mao, Q.; Ni, P. The Controversy and Exploration of Scientific Selection and Grading Development of Chinese Urban Agglomeration. J. Geogr 2015, 70, 515–527. [Google Scholar]
  49. Chen, S.; Zhou, R.; Gao, J. Spatial-temporal characteristics of population flow during Spring Festival travel rush in Yangtze River Delta urban agglomeration based on Tencent migration data. Hum. Geogr. 2020, 35, 130–138. [Google Scholar]
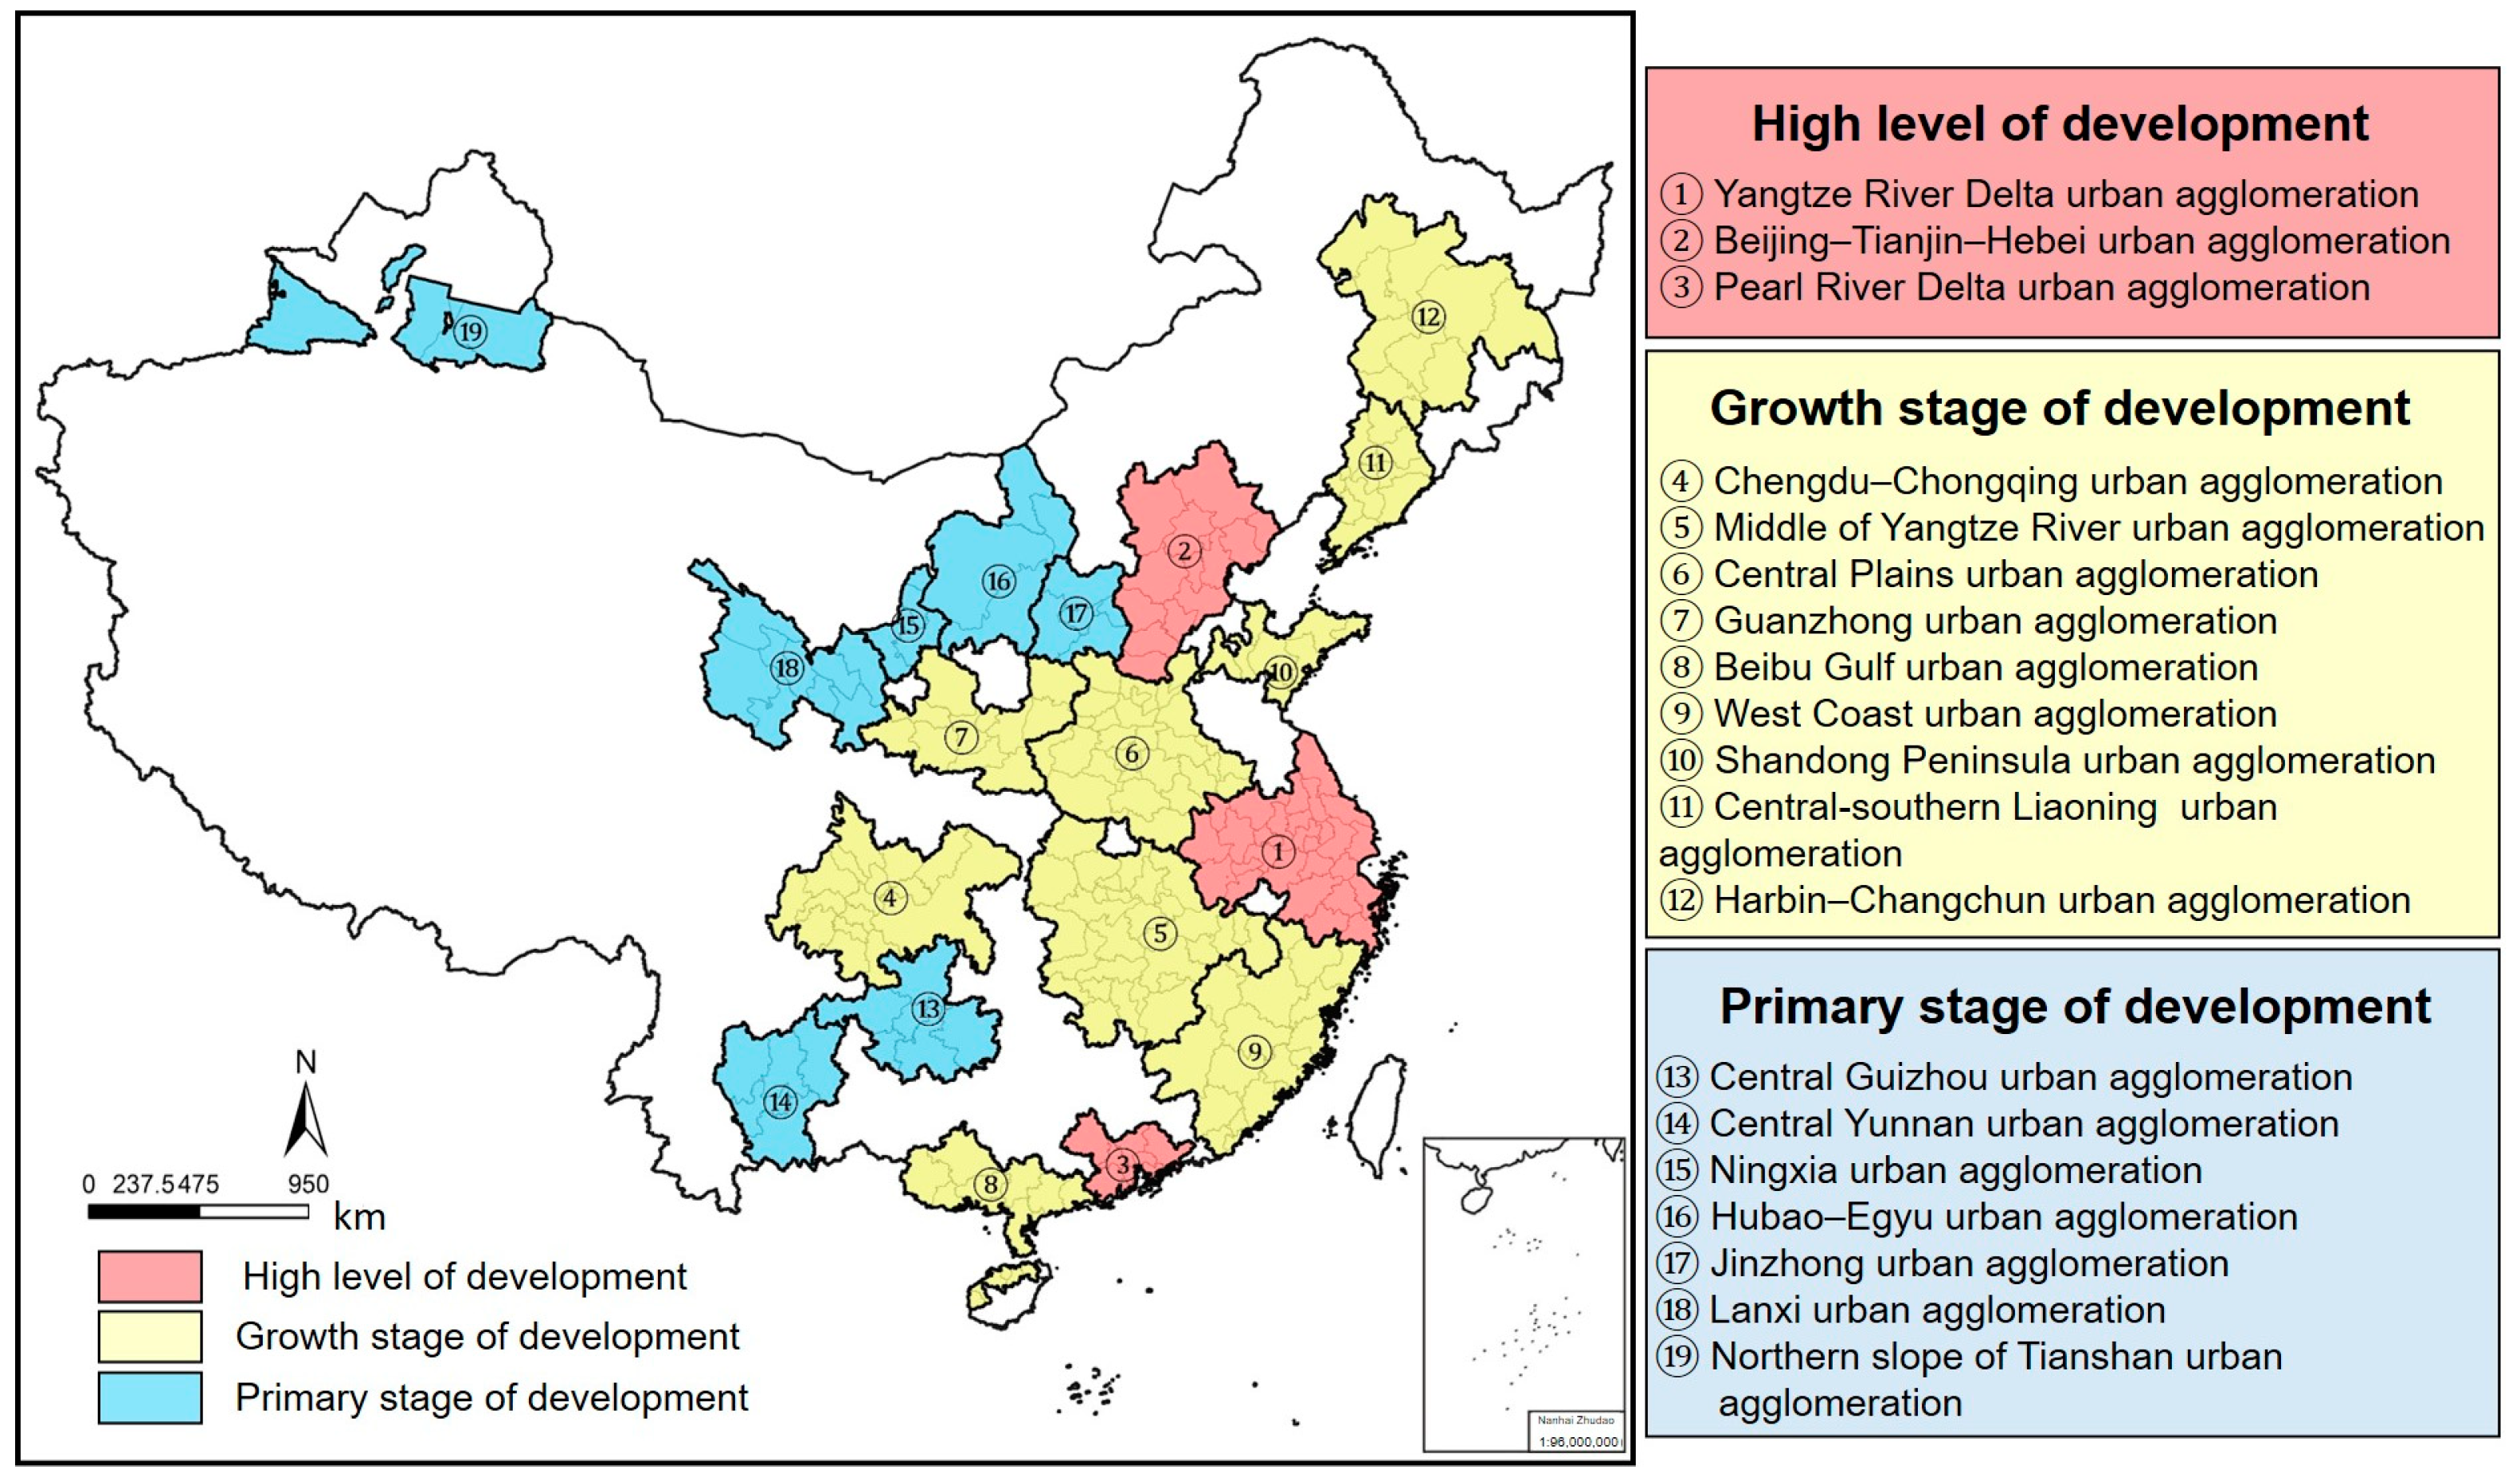
Figure 1. Distribution and types of UAs in China.
Applsci 14 04368 g001
Figure 2. Research logic diagram.
Applsci 14 04368 g002
Figure 3. Network structure of UAs in China at different time periods under COVID-19.
Applsci 14 04368 g003
Figure 4. Results for network indicators for various UAs at different time periods under the impact of COVID-19.
Applsci 14 04368 g004
Figure 5. QAP correlation analysis of UA network structures in the context of COVID-19.
Applsci 14 04368 g005
Figure 6. QAP regression analysis of UA network structures in the context of COVID-19.
Applsci 14 04368 g006
Table 1. Calculation results of centrality of UAs in different time periods under the influence of COVID-19.
UA Before COVID-19The Normalization Stage of COVID-19After COVID-19
ConnectivityHierarchyConnectivityHierarchyConnectivityHierarchy
10,0030.85385240.79499630.814
64470.83845630.58167960.797
88450.83773050.60986550.785
61870.73351880.64965290.749
62540.76355770.66563480.746
58790.67443170.44359840.532
27110.31623710.28826510.308
24380.29420200.25921310.265
39700.42130600.34532040.357
22980.28220850.26422200.279
15950.22411860.18914360.212
18630.24612180.19217410.236
18160.24214870.21430730.347
13640.20410790.18120220.259
5280.1344940.1329500.172
9550.1718240.15915310.218
8370.1627100.1529350.168
12040.19110640.17918010.241
6450.1445460.1366540.145
Table 2. The explanatory variables influencing the network structure of UAs in the context of COVID-19.
Influencing FactorsVariablesDescription of Variables
Economic Development LevelGross Domestic Product (GDP) (XGDP)Matrix of differences in GDP
Medical Facility CapacityPhysicians per 10,000 population (XMP)Matrix of differences in physicians per 10,000 population
Transportation Infrastructure CapacityMiles of city roads (XTM)Matrix of differences in miles of city roads
Spatial ProximityGeographic distance from city to city (XS)Matrix of differences in geographic distance
Number of cross-province links (XK)0 for inter-province links, 1 for cross-province links
Innovation AccessibilityUniversity education per 10,000 population (XG)Matrix of differences in university education per 10,000 population
Disclaimer/Publisher’s Note: The statements, opinions and data contained in all publications are solely those of the individual author(s) and contributor(s) and not of MDPI and/or the editor(s). MDPI and/or the editor(s) disclaim responsibility for any injury to people or property resulting from any ideas, methods, instructions or products referred to in the content.