Abstract
High-performance computing (HPC) relies heavily on network security, particularly when supercomputing services are provided via public networks. As supercomputer operators, we introduced several security devices, such as anti-DDoS, intrusion prevention systems (IPSs), firewalls, and web application firewalls, to ensure the secure use of supercomputing resources. Potential threats are identified based on predefined security policies and added to the firewall rules for access control after detecting abnormal behavior through anti-DDoS, IPS, and system access logs. After analyzing the status change patterns for rule policies added owing to human errors among these added firewall log events, 289,320 data points were extracted over a period of four years. Security experts and operators must go through a strict verification process to rectify policies that were added incorrectly owing to human error, which adds to their workload. To address this challenge, our research applies various machine- and deep-learning algorithms to autonomously determine the normalcy of detection without requiring administrative intervention. Machine-learning algorithms, including naïve Bayes, K-nearest neighbor (KNN), OneR, a decision tree called J48, support vector machine (SVM), logistic regression, and the implemented neural network (NN) model with the cross-entropy loss function, were tested. The results indicate that the KNN and NN models exhibited an accuracy of 97%. Additional training and feature refinement led to even better improvements, increasing the accuracy to 98%, a 1% increase. By leveraging the capabilities of machine-learning and deep-learning technologies, we have provided the basis for a more robust, efficient, and autonomous network security infrastructure for supercomputing services.
1. Introduction
Network security is critical in high-performance computing (HPC) environments, particularly in the provision of supercomputing services. Security device configuration and operation are integral components of the HPC infrastructure. Many of these security devices use separate log-collection and analysis servers to detect cyberattacks, gather logs from target nodes, and collect events from network security devices for abnormal detection [1,2]. An abnormal detection event is considered a potential threat and processed as a DROP policy object to prevent attack attempts when it exceeds a predetermined threshold [3]. Tightening these thresholds enhances security and increases the firewall load [4]. Consequently, the risk of incorrectly adding a DROP policy object increases as attack attempts become more frequent. Several studies have focused on the classification of abnormalities. Machine-learning algorithms such as naïve Bayes, K-nearest neighbors (KNN), one rule (OneR), and J48 were used to classify firewall logs [5,6]. Their firewall log-generation tools generated a training dataset of 500,000 instances. According to the performance analysis, KNN was the classifier with the highest accuracy. The machine-learning algorithms in [7] were used to generate and analyze a training dataset comprising 5,000,000 instances. The KNN classifier outperformed the other classifiers. Support vector machine (SVM) was used to classify the firewall logs in [8]. Various activation functions, including linear, polynomial, sigmoid, and radial-basis functions (RBFs) were used for the SVM classification. Among these, the SVM with the sigmoid function and a training dataset of 65,532 instances showed the best performance. Several neural network (NN) models have been applied to develop basic classification models for deep learning-based classification, as seen in [9,10,11]. In the previously mentioned studies, machine-learning algorithms were used to classify DROP or PASS actions from firewall event logs. However, the trained dataset was exclusively generated using firewall log-generation tools and did not originate from a real service environment. The existing issues in these studies were addressed as follows:
- The gathered firewall event logs contain vast amounts of data, which vary with the status of cyberattacks. To extract the required data for analysis from this raw data, a database specifically tailored for research must be created. A suitable database that conforms to the specific properties of the collected logs must be constructed to efficiently store and process big data. This database should be designed to handle the high-speed processing demands inherent in big-data analysis.
- When abnormal events are detected, they are classified as attacks based on set thresholds and added to block policies. However, human errors, such as administrator mistakes, can lead to policy mishaps. Proactively identifying and correcting misclassifications by monitoring and analyzing traffic data during firewall event changes improves the cyber security response.
- The machine-learning analysis of firewall logs is limited because the firewall has only a five-tuple policy rule. To enhance the accuracy in real service networks, additional methods or artificial intelligence (AI)-based models must be explored. Improved models provide automated threat detection and response capabilities to administrators.
To address the three previously mentioned issues, we collected, integrated, and analyzed events from the network security equipment of the Supercomputer Nurion over a four-year period in the existing HPC service environment. This process involved the following steps: parsing, extracting, pre-processing, training, evaluating, and detecting. First, we removed consecutive duplicate values from the raw data and parsed the features necessary for extraction. Because of the vast amount of raw data, we developed a parser capable of parallel processing in an HPC cluster environment. A continuous increase in abnormal detection counts was discovered when traffic data where policies were erroneously added to the firewall rules owing to human error were analyzed. We defined patterns at the moments when the firewall event state changed to PASS–DROP–PASS or DROP–PASS, and extracted data monthly, classifying the patterns as firewall rule policy errors. Using this extracted four-year dataset of firewall rule policy errors and by accurately adding firewall rule policy data, we created training datasets in equal proportions. To achieve the highest accuracy, we used various pre-processing methods, algorithms, and techniques. We developed machine-learning classification algorithms and deep-learning models and explored suitable methods using various data-scaling techniques. We compared the results classified by the NN model with the cross-entropy loss function and attempted to improve the accuracy by refining the features and training the model with finer granularity. The contributions of this study can be summarized as follows:
- Enhancement of network security in the HPC service environment: We analyzed over four years of event data from the network security equipment of the Supercomputer Nurion to improve the network security in the HPC service environment.
- Detection and analysis of firewall rule policy errors: We analyzed traffic data with policies erroneously added owing to human error to identify continuous abnormal detection. We also defined patterns when the firewall event state changes to categorize firewall policy errors.
- Application of machine-learning algorithms and deep learning models: We trained the datasets using classification algorithms such as naïve Bayes, KNN, OneR, J48, logistic regression, SVM, and an NN model with cross-entropy loss function to detect security events and increase accuracy.
- Various attempts to improve accuracy: We improved the accuracy of our analysis using various techniques such as data pre-processing, algorithms, and feature refinement.
This paper is outlined as follows: Section 2 provides an introduction to related works. Section 3 presents the overall architecture and methods for firewall data refinement. This includes details on data pre-processing and the implemented training model. Section 4 presents a comparative analysis and discussion of the results. In the final section, the conclusions and directions for future work are described.
2. Related Works
Table 1 provides an overview of various aspects of cybersecurity covered by previous studies. Each row represents a specific study referenced in the related work section, while the columns represent different aspects or topics related to cybersecurity. Anomaly detection indicates whether the study contributes to techniques or methods for detecting anomalies in systems or networks [12,13,14,15]. Firewall log analysis specifies if the study focuses on the analysis of firewall logs to identify patterns or anomalies. Machine learning indicates whether the study employs machine-learning algorithms or techniques for cybersecurity applications [16,17,18,19,20,21,22]. Deep learning implies that the study utilizes deep-learning models or techniques for cybersecurity tasks [23]. Adversarial attacks indicate whether the study addresses the challenges posed by adversarial attacks, such as evasion or poisoning attacks [24,25,26,27].
He et al. [1] focused on anomaly detection techniques, particularly in system log analysis, emphasizing the importance of analyzing system logs for identifying potential security threats. Lee et al. [4] conducted a detailed analysis of firewall logs, highlighting the traffic and overhead analysis of pre-filtering ACL firewall on HPC service networks. As-Suhbani and Khamitkar [5] and Esmaeil et al. [7] explored machine-learning algorithms for the classification of firewall logs and for discovering anomalous rules in firewall logs, respectively. Ertam and Kaya [8] and Zhu et al. [9] utilized machine-learning techniques, including multiclass SVMs and softmax loss function improvement using scalable batch normalization, for firewall log analysis. Uçar and Ozhan [6] and Mohammadian et al. [28] analyzed firewall policies, focusing on the effectiveness of different policy configurations, using machine-learning and data-mining techniques. Wu et al. [11] and Dawadi et al. [29] surveyed network attack detection methods and proposed a deep learning-enabled web application firewall for detecting web attacks, respectively, emphasizing the role of deep learning in cybersecurity. Saleous and Trabelsi [30] enhanced the performance of firewall filters using NNs, and Mohammadian et al. [28] developed a gradient-based approach for adversarial attacks on deep learning-based NIDSs, addressing the challenges associated with adversarial attacks in cybersecurity. Pinto et al. [31] surveyed intrusion detection systems based on machine-learning techniques and highlighted the importance of machine learning in protecting critical infrastructures.

Table 1.
Overview of various aspects of cybersecurity, including anomaly detection, firewall log analysis, machine learning, deep learning, and adversarial attacks, surveyed in previous studies.
Table 1.
Overview of various aspects of cybersecurity, including anomaly detection, firewall log analysis, machine learning, deep learning, and adversarial attacks, surveyed in previous studies.
| Reference | Anomaly Detection | Firewall Log Analysis | Machine Learning | Deep Learning | Adversarial Attacks | Errors |
|---|---|---|---|---|---|---|
| [1] | √ | √ | ||||
| [4] | √ | √ | ||||
| [5,7] | √ | √ | √ | |||
| [8,9] | √ | √ | √ | |||
| [6,10] | √ | |||||
| [11,29] | √ | √ | √ | |||
| [30,32] | √ | √ | √ | |||
| [33,34] | √ | √ | √ | |||
| [28] | √ | √ | √ | |||
| [31] | √ | √ | ||||
| Ours | √ | √ | √ | √ | √ |
Furthermore, these related reports mention various keywords such as “Human Error”, “Error Prevention”, or “Error Reduction”. He et al. [1] focused on system log analysis for anomaly detection, which may indirectly address human errors by identifying abnormal system behaviors that could result from human mistakes. Esmaeil et al. [5] and Esmaeil et al. [7] discussed the classification of firewall logs and anomalous rules, which could involve identifying errors in log data and implementing strategies to eliminate or reduce such errors. Pinto et al. [31] surveyed intrusion-detection systems based on machine-learning techniques, which may include discussions on error rates and approaches to improve detection accuracy or reduce false alarms. These related studies deal with errors, whereas our study focuses on human errors that are extensively processed and analyzed. To explain the uniqueness of our study, we provide additional explanations as follows. We analyzed the data collected over a four-year period in a real service-providing environment—the operational environment of the HPC service network. Herein, we describe the configuration of the service network environment, security equipment, and abnormal-detection data collected from these devices. We also define and explain human error data extracted from the collected raw data.
2.1. HPC Service Network Environment
The fifth national supercomputer (KISTI-5), established and operated by KISTI in 2018, consists of the main system, Nurion, and the auxiliary system, Neuron. Nurion and Neuron have theoretical performances of 25.7 and 3.5 PFlops, respectively. Both provide login nodes for terminal access to industrial and academic researchers and DataMover nodes for data transfer. Furthermore, web servers are operated to provide HPC services through Jupyter notebooks and web services. To safeguard the system from external access, network security is reinforced through redundant configurations of anti-DDoS, intrusion prevention systems, firewalls, and web application firewalls. In particular, the firewall uses the five-tuple policy rule to control traffic entering from external sources into internal networks and outbound traffic from internal sources to external sources. The diagram below in Figure 1 illustrates the KISTI-5 supercomputer service network structure.
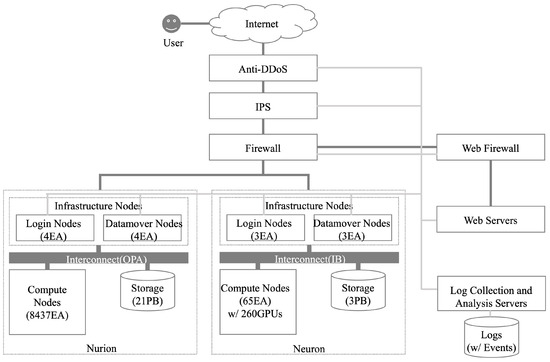
Figure 1.
Diagram of KISTI-5 supercomputer service network.
Nurion provides services to remote users via the Internet. Therefore, pass policy rules are applied to the service ports of each infrastructure node to accommodate several unspecified users. However, external cyberattacks are not limited to specific infrastructure nodes, but attempt to simultaneously target multiple nodes. Therefore, it is crucial to detect and block them promptly to prevent damage. To address this issue, we set the firewall’s highest-priority drop policy rules. This allows us to register IP addresses for cyberattacks and prevent them from spreading to other infrastructure nodes.
2.2. Abnormal Detection
To detect cyberattacks, we established a log-collection and -analysis server to integrate and collect logs from each infrastructure node and events from network security devices. The logs and events were then analyzed to detect abnormal behaviors. We categorized cyberattacks that targeted the services used on each infrastructure node into SSH, FTP, and HTTP web server attacks. Furthermore, we included scanning attacks that target arbitrary IPs or ports. We also distinguished between the attack IPs received from the National Cyber Security Center. For each targeted service, we added abnormal events detected above a certain threshold as objects to the DROP policy to prevent attempted attacks on other infrastructure nodes. As shown in Figure 2, we implemented different thresholds for various time windows to detect brute-force attacks that occur rapidly within a short time as well as low and slow attacks that attempt to breach over an extended period. Time windows and thresholds can be arbitrarily set according to the characteristics of the services. However, for the current Nurion supercomputer, we used four time windows to detect abnormal behaviors.
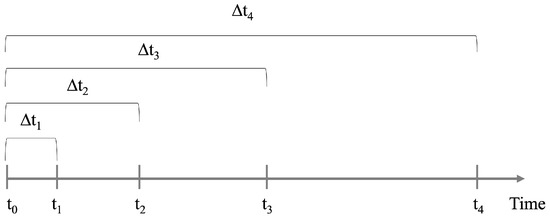
Figure 2.
Time windows of abnormal detection.
2.3. Human Error
We collected and analyzed firewall event logs for over four years. Upon parsing and extracting the raw data, we discovered approximately 4.6 billion detected instances. We identified 289,320 instances of firewall rule-policy errors attributed to administrator and user errors. At these firewall event state changes, we defined patterns as PASS–DROP–PASS or DROP–PASS to indicate human error. Figure 3 (top image) illustrates the exponential increase in the number of rule policies correctly detected by firewalls from December 2018 to December 2021. This increase signifies the successful enforcement of the firewall’s stringent policies and the escalation of the daily load. Figure 3 (bottom image) shows the monthly extraction of human error. The irregular and unbalanced occurrence of incorrectly detected policies was evident. Although this pattern has remained consistent since the second half of 2020, there are no established rules governing its occurrence.
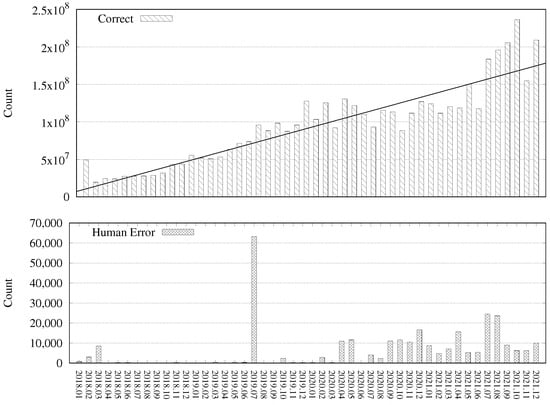
Figure 3.
Total counts of “correct” policy and “human error”.
3. Methodology
The entire analysis process adopted the architecture shown in Figure 4. It is divided into data pre-processing, training, and testing processes. Data pre-processing includes log parsing, data extraction, feature selection, and data scaling. These processes account for 90% of the entire process. We directly implemented and trained machine- and deep-learning models and analyzed the results through the testing process. We then automated the process of refining the firewall rules. We reduced the calculation time by deploying appropriate computational resources and considering the computing characteristics of each process.
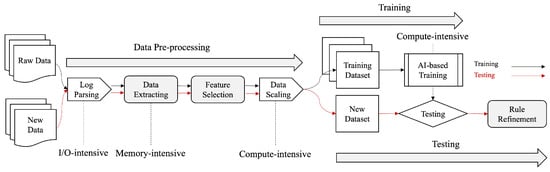
Figure 4.
Overall architecture.
3.1. Data Pre-Processing
3.1.1. Log Parsing
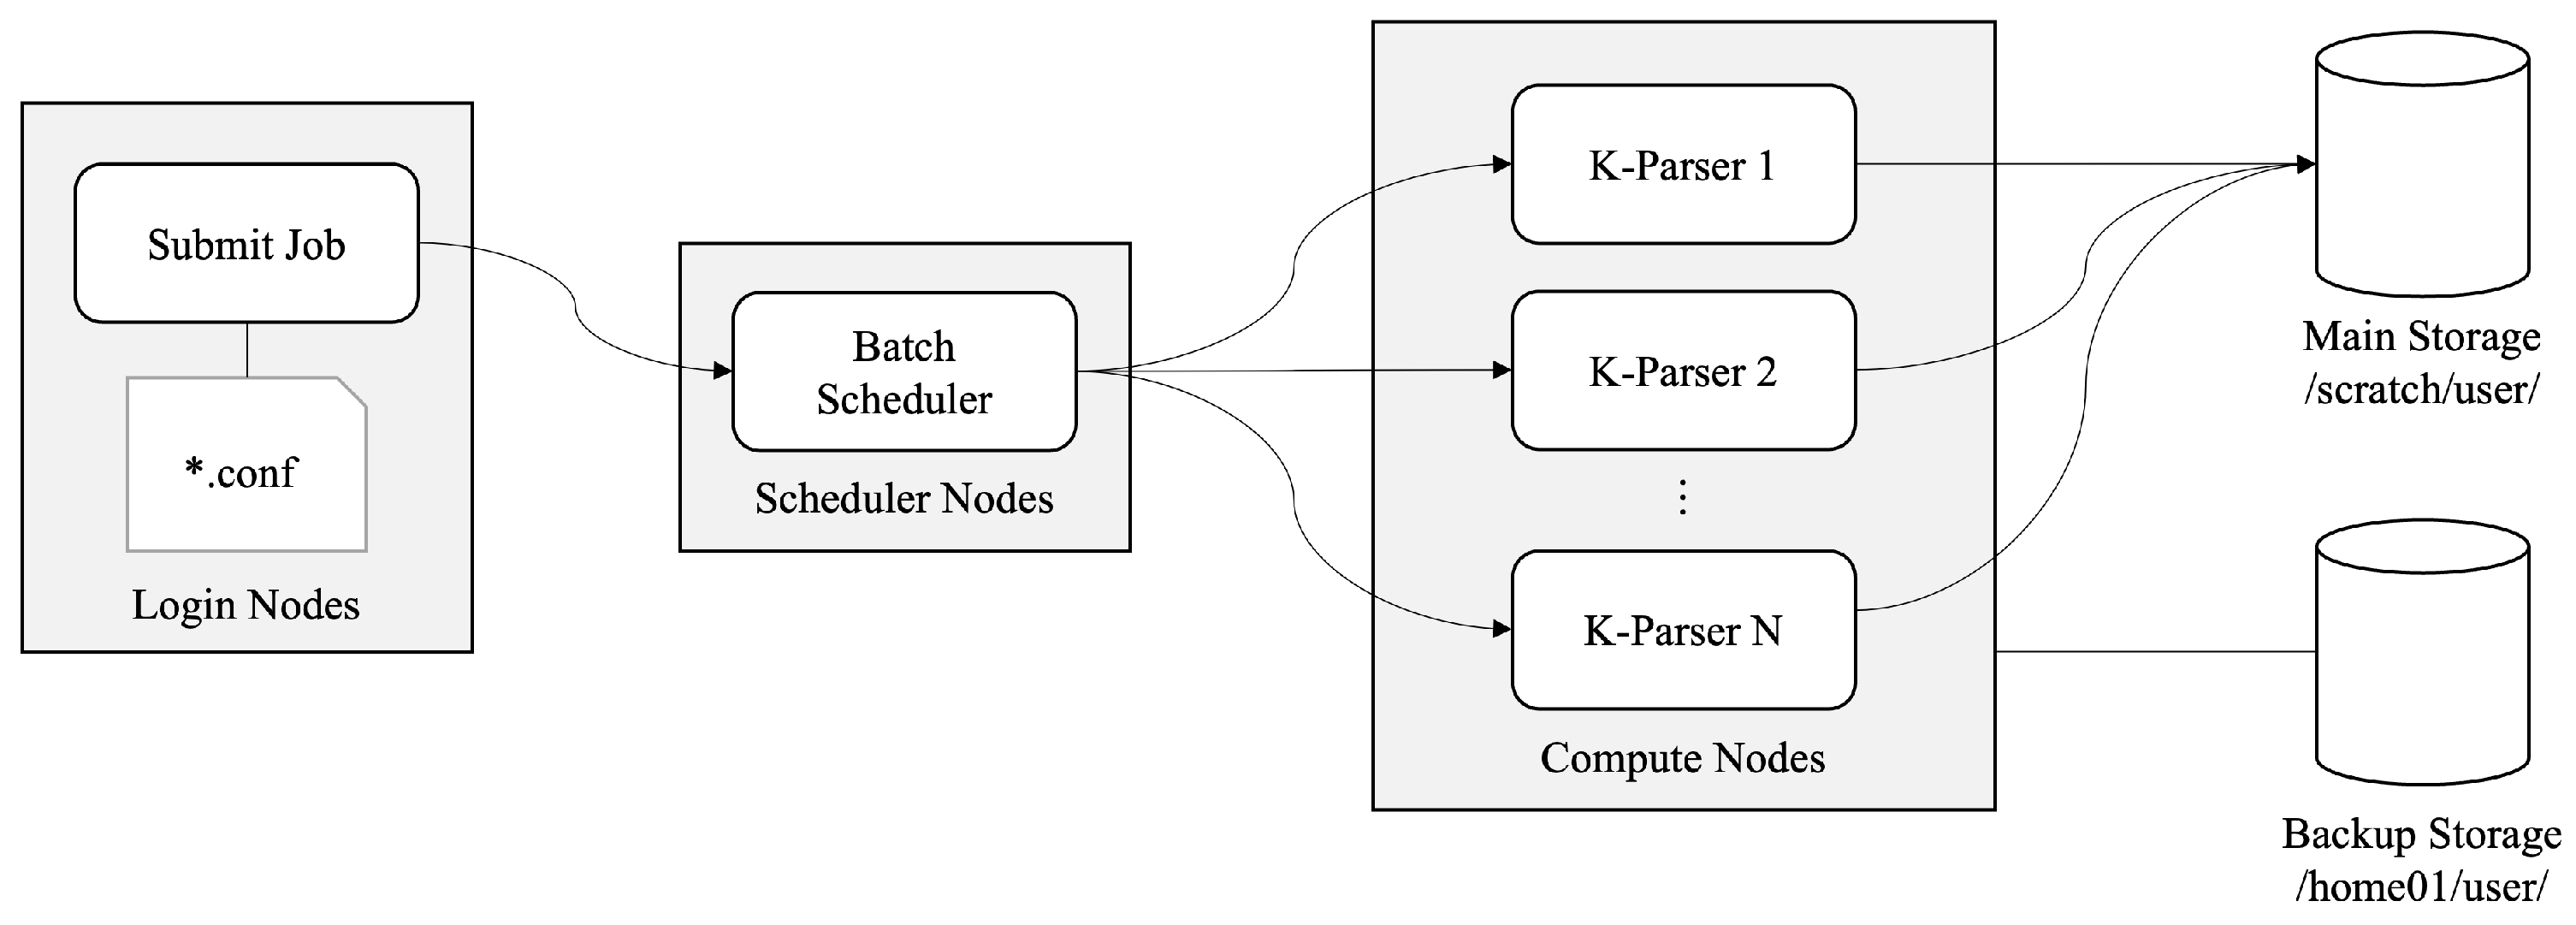
The raw data collected over four years comprised 1460 files that exceed 3.4 TB. Owing to I/O-intensive computing, we developed a K-parser that uses the HPC’s distributed environment to generate and process one process per day in parallel. Figure 5 shows the configuration file *.conf, which is modified on the HPC login node to simultaneously set the number of files to be processed, specify the required computational resources in the scheduler, and submit the job through the batch scheduler. K-parser is executed in parallel according to the number of submitted tasks and is stored in HDF5 format in a designated directory in a parallel file system environment. Similarly, in the files saved daily in HDF5 format, the start time of the attack event, the end time of the event, the source IP and port, the destination IP and port, and the DROP or PASS actions are parsed and stored in a key-value form. The file size created by the log-parsing process was reduced to 1.4 TB. The processing time varied depending on the daily file size; however, the average daily processing time was approximately 5 min. We allocated 365 computing resources from Nurion computing nodes, executed four K-parsers per node, and completed the process in less than 10 min.

Figure 5.
Workflow of parallel parsing. (* stands for the day format).
3.1.2. Data Extracting
To extract human errors, a labeled dataset was created by marking as human errors any instances of PASS–DROP–PASS and DROP–PASS patterns within a certain time range for the same source and destination IP addresses and ports in the firewall rule event log. We created an algorithm that reads HDF5 files monthly, removes redundant data, and determines the state-change values. Because this process uses a large amount of memory depending on the size of the data, we calculated it using large memory resources that are easily memory-intensive. In Algorithm 1, a and b denote the monthly collected lists for the PASS and DROP data, respectively. Both a and b are dictionary types with a key (k) and a value (v). The source IP, source port, destination IP, and destination port are defined as k. The index of the data sequence is defined as v. From a and b, the latest PASS data m and DROP data n, which have the maximum number of indices, are extracted using two loops. Through the intersection of m and n, the duplicates of the PASS and DROP data were removed and combined to obtain t. In the third loop, if two v exist for the same k, we compared the corresponding v and extracted the human error e to assess whether the first v is greater than the second v. The remaining were detected correctly and returned to c. The number of e instances extracted in this manner was 289,320. From January 2018 to December 2021, we extracted values randomly from c every month according to the ratio of e in c to create a labeled dataset. Extracting e from one month took approximately 1.5 h, and it was executed on a 1.5 TB memory node.
| Algorithm 1 Extracting algorithm |
|
3.1.3. Feature Selection
According to Table 2, we extract the source IP (Src.IP), destination IP (Dst.IP), source port (Src.Port), and destination port (Dst.Port) as X inputs in the labeled dataset. The human error value, TRUE or FALSE, is designated as the Y output corresponding to the action (note that the IP addresses and ports displayed in Table 2 are for illustrative purposes only and do not represent actual data). Before classification, all of the IP addresses were converted into integers.
Table 2.
Four-feature selection from firewall rules.
Src.IP and Dst.IP are in an IPv4 address that is divided into four sections, each separated by a dot according to its hierarchical structure. Each section represents 8 bits of the 32-bit IPv4 address [32]. To improve the accuracy of the tested classifiers, we increased the number of features before classification based on IPv4’s section-based spatial structure partitioning. Given the limited features extracted from the five-tuple policy, we divided the existing features to test them. Shown in Table 3, all of the IPs were segmented into four parts: labeled a, b, c, and d, and expanded from four to ten. The detailed results of the prediction accuracy comparison are presented in the following section.
Table 3.
Ten-feature selection from firewall rules.
3.1.4. Data Scaling
Data scaling is necessary for each feature value in a dataset if the features have different data ranges. Specifically, if the data are not scaled before deep-learning training, they may not be trained effectively or function properly. To improve the classifier model with deep learning and ensure effective data scaling, we trained each for 100 epochs using the following scikit-learn data scalars: MaxAbs, MinMax, Normalize, Power, Quantile, Robust, and Standard.
As shown in Figure 6, the Quantile scaler achieved the highest F1-score accuracy of 0.96, whereas the MinMax scaler achieved the lowest F1-score. Training loss analysis (top image in Figure 7) showed that the filled triangle graph representing Quantile had the lowest loss (the lower the better), followed by the empty triangle representing Power. Robust showed the highest instability and loss compared with the F1-score. The bottom image in Figure 7 illustrates the accuracy of the results. Similarly, the filled triangle representing the Quantile scalar had the highest accuracy (the higher the better), followed by the empty triangle representing the Power scalar. Robust showed the lowest accuracy. Based on these data-scaling results, we used the Quantile scalar to preprocess the data before training the deep-learning model.
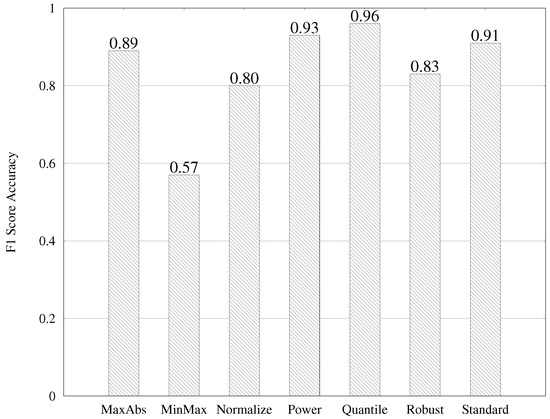
Figure 6.
F1-score accuracy comparison of data scalars.
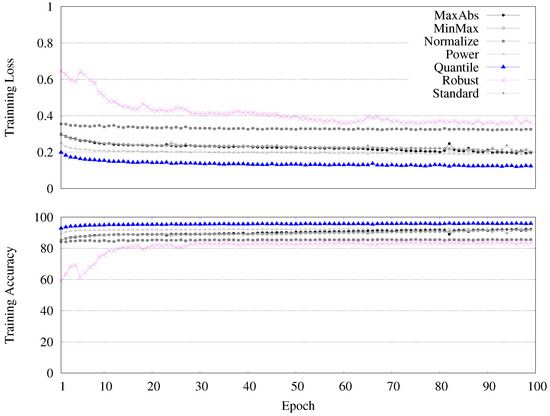
Figure 7.
Training loss and accuracy comparison of data scalars.
3.2. Machine-Learning Algorithms
3.2.1. Naïve Bayes
For naïve Bayes, we used the Gaussian naïve Bayes (GNB) classifier GaussianNB() provided by scikit-learn 1.4.0 with normalize = True to predict the model owing to the simple and fast implementation of GNB. GNB primarily involves the application of Bayes’ theorem [35] for classification, with the simple assumption that the features are conditionally independent for a given class label and follow a Gaussian distribution. The theorem is mathematically expressed as (in Equation (1)):
where P(class|data) represents the probability of a class for given data, i.e., the posterior probability; P(data|class) is the likelihood of the data for a given class; P(class) is the prior probability of the class; and P(data) is the probability of the data, also known as the evidence. In summary, while naïve Bayes classifiers are simple and efficient algorithms that operate well in several scenarios, their assumption of feature independence can be a limitation for datasets with correlated or complex interacting features. Thus, considering this disadvantage and assessing whether the independence assumption holds true for a given dataset before applying naïve Bayes classifiers are crucial steps.
3.2.2. KNN
For KNN, we used the KNeighborsClassifier() provided by scikit-learn 1.4.0 with neighbors (k). The main equation of the KNN algorithm [7] allows computation of the distances between the new data point and all of the data points in the training set, the selection of the k nearest neighbors based on these distances, and performing predictions based on the labels (for classification) or values (for regression) of these neighbors. In this experiment, we used this equation, mathematically expressed below, for classification (in Equation (2)):
Here, is the predicted class label for the new data point ; are the class labels of the k nearest neighbors; I is the indicator function that returns 1 if the condition inside the parentheses is true and 0 otherwise; y is the class label being considered; and returns the class label with the highest count among the k nearest neighbors. In this experiment, we tested k from 1 to 10, and k = 3 showed the highest score. While KNN is a simple and versatile algorithm without a training phase, and it does not assume the underlying data distribution, this algorithm has limitations related to computational complexity, memory usage, and sensitivity to feature scaling, in addition to exhibiting the curse of dimensionality and requiring an appropriate choice of the number of neighbors k.
3.2.3. OneR
OneR is a simple and interpretable algorithm used for classification tasks. The main concept of the OneR algorithm [7] is to select one feature (predictor) and one value of that feature (rule) for performing predictions. It operates by selecting the best rule (feature and value pair) based on misclassification minimization, and no function is provided by any packages. In this experiment, we developed the pseudocode of the partial code in the code block in Listing 1 as follows:
| Listing 1: Psedocode of OneR. |
|
The functions TrainFeatureValue(), TrainOnFeature(), and Predict() implement the main concept of the feature–value pair. Although OneR offers simplicity, interpretability, and low computational costs, it has limitations in terms of expressiveness, robustness to outliers and noise, performance, and overfitting. This algorithm is suitable for simple classification tasks with well-behaved data.
3.2.4. J48
For J48, which is also known as a decision tree classifier, we used DecisionTreeClassifier provided by scikit-learn 1.4.0. J48 constructs a decision tree recursively by splitting the dataset based on the attribute that provides the best information gain or gain ratio at each node [7]. Information gain measures the reduction in uncertainty about the class label after a split. In this experiment, information gain, which measures the reduction in entropy, is achieved by splitting the data on a particular attribute. It is calculated using the following equation (in Equation (3)):
where is the information gain of attribute A on dataset D; is the entropy of dataset D; is the number of instances in dataset D; is the number of instances in dataset D with a value v for attribute A; and is the entropy of dataset (the subset of D with a value v for attribute A). While J48 offers simplicity, interpretability, and versatility in handling mixed data types, it exhibits overfitting, a high variance, instability, and biases toward certain features. The careful tuning of hyperparameters and tree pruning techniques can help mitigate some of these disadvantages. We tuned the number of max_depth to be 16 with the entropy criterion for DecisionTreeClassifier.
3.2.5. SVM
For SVM, we used svm provided by scikit-learn 1.4.0. SVM is a powerful and versatile algorithm that can be applied to a wide range of classification tasks, including both linearly and non-linearly separable data, and has the ability to control the trade-off between model complexity and generalization performance [8]. SVM supports various kernel functions, such as linear functions, polynomial functions, RBFs, and sigmoid functions, which can be selected based on the data characteristics and problem domain. In this experiment, we tested all types of kernels and found that SVM with a polynomial kernel showed the best score. The SVM algorithm identifies the optimal hyperplane that separates classes in the feature space. In the case of linearly separable classes, the hyperplane is represented by the equation of a hyperplane (for linearly separable data refer to Equation (4); for non-linearly separable data with kernel refer to Equation (5)):
where w is the weight vector (normal to the hyperplane), x is the input feature vector, b is the bias or intercept term, and is the feature-mapping function. The optimization problem for finding w and b can be represented as (in Equation (6)):
In this experiment, we used the svm.SVC() function with a polynomial kernel, degree = 3, and C = 2.0 parameters. SVMs are powerful and versatile models that perform well in many classification tasks. However, they may not be suitable for every situation, especially when computational resources are limited or interpretability is crucial.
3.2.6. Logistic Regression
For logistic regression, we used LogisticRegression() provided by scikit-learn 1.4.0. Logistic regression models the probability that a given input belongs to a particular class. It extends linear regression by using a logistic function (also known as the sigmoid function) to transform the output of a linear combination of input features into a probability value between 0 and 1 [36]. The equation of the sigmoid function is expressed as (in Equation 7):
where represents the sigmoid function, z is the input variable, and e is the base of the natural logarithm. The sigmoid function takes any real number z as the input and outputs a value between 0 and 1, representing the probability of occurrence of an event. It has an S-shaped curve with values close to 0 and 1 for large negative and positive inputs, respectively, and a value of approximately 0.5 is obtained at z = 0. Logistic regression is advantageous owing to its simplicity, interpretability, and efficiency with small datasets. However, it may struggle to capture complex non-linear relationships and is sensitive to outliers.
3.3. Implemented NN Model
PyTorch was used to implement the multiclass-classification NN model. It comprises four fully connected linear layers and an output layer. The rectified linear unit (ReLU) was used as the activation function after each linear layer, except after the output layer. Dropout regularization with a probability of 0.5 was applied after the ReLU activation function in the first layer. Dropout helps prevent overfitting by randomly dropping a proportion of the units during training. Batch normalization was applied after each linear layer, except after the output layer. It normalized the activation of each layer, facilitating faster training and better generalization. The batch size of the model parameter value was set to 4096, and the learning rate was set to 0.007. The description of each layer is as follows:
- layer_1: A linear layer with 4 (and 10) input features, implying that the input to this layer has either 4 or 10 features. It has 4096 output features and is followed by a ReLU activation function, batch normalization (batchnorm1), and dropout with a probability of 0.5.
- layer_2: A linear layer with 4096 input features (output from layer_1) and 512 output features. It is followed by batch normalization (batchnorm2).
- layer_3: A linear layer with 512 input features (output from layer_2) and 128 output features. It is followed by batch normalization (batchnorm3).
- layer_4: A linear layer with 128 input features (output from layer_3) and 64 output features. It is followed by batch normalization (batchnorm4).
- layer_out: A linear layer with 64 input features (output from layer_4) and 2 output features. This is the final output layer for classification, with two classes, and is followed by a bias term.
We used a cross-entropy loss function [37], called CrossEntropyLoss, provided by PyTorch with class weights as well as the Adam optimizer with a specified learning rate of 0.007. This model was trained on Neuron, a GPU-based cluster, using the Adam optimizer with a cross-entropy loss function. We trained approximately 400 epochs with two A100 GPUs for 578,640 instances of the dataset. Python 3.10.6, PyTorch 1.13.1, CUDA 11.6, and scikit-learn 1.4.0 were used to implement this model, whose code block Listing 2 is provided below:
| Listing 2: Model Description. |
|
4. Result and Discussion
Figure 8 compares the F1-score average accuracies of the different classification algorithms with four and 10 features. KNN (neighbors = 3) showed the best performance among the tested machine-learning classification algorithms, with an accuracy of 0.97. The implemented NN model and J48 had the highest accuracy of 0.98 using 10 features. Naïve Bayes showed a decent performance, improving slightly from 0.79 with four features to 0.83 with 10 features. SVM with a kernel polynomial showed the highest accuracy compared to linear, RBF, and sigmoid, particularly with 10 features. OneR and logistic regression showed consistent performance for both feature sets. These results demonstrate that the algorithm and number of features used significantly affect the classification accuracy, with more complex models, such as KNN, J48, and NN, achieving higher accuracy when the feature set was expanded.
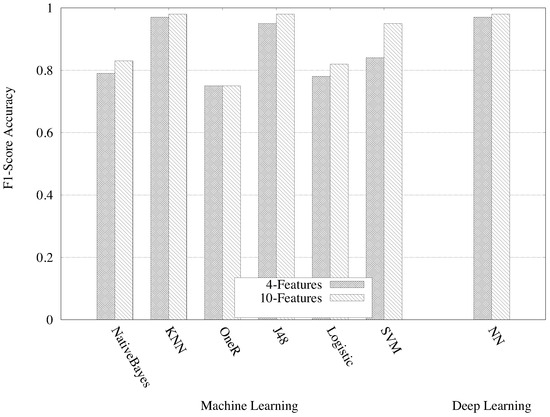
Figure 8.
F1-score average accuracy: performance improvement comparison between machine-learning algorithms and the proposed deep-learning model with different feature selections.
Figure 9 compares the improvement of different classification algorithms using four and ten features. SVM (polynomial) showed the highest improvement in the F1-score average accuracy, with an 11.36% increase. Logistic regression also showed a notable improvement, with a 4.70% increase. Naïve Bayes showed a moderate improvement of 4.59%, whereas J48 showed a significant improvement of 2.94%. The NN model maintained a consistent improvement of 1.02%. KNN (neighbors = 3) and OneR had relatively small improvements of 0.33% and 0.21%, respectively. These results demonstrate the various levels of accuracy improvement achieved by the various classification algorithms. Notably, the SVM with a polynomial kernel showed the highest improvement in classification performance.
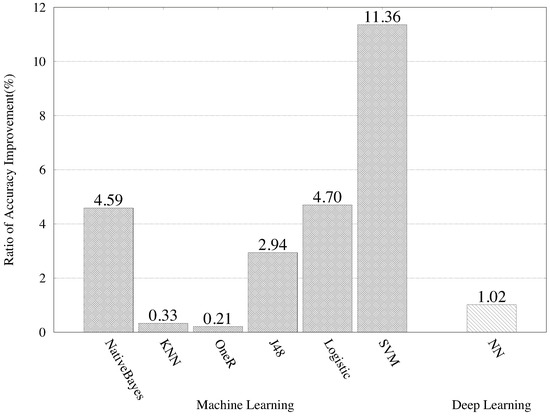
Figure 9.
F1-score average accuracy: improvement comparison of machine-learning algorithms and deep-learning model with different feature selections.
Because more features provide more decision paths for classifying the data, models such as KNN, NN, and J48 can make better use of the additional information provided, which improves the accuracy. With 10 features, J48 can create more complex decision boundaries, which increases the accuracy. An SVM captures complex relationships in data better and performs well with an increased feature space. Models such as linear decision boundaries and logistic regression showed improved accuracy, indicating that the data may have become more separable with more features. Naïve Bayes and OneR showed mixed results, implying that the nature of the dataset and the assumptions they made regarding the data distribution might have impacted their performance.
Ultimately, the optimal choice depends on various factors such as the specific requirements of the problem, computational resources, interpretability needs, and the balance between model complexity and accuracy. For a well-rounded option, KNN (neighbors = 3) or NN are recommended.
Figure 10 shows the training and validation accuracies and losses when using four and ten features and training for over 400 epochs. Regarding the loss comparison in the upper image, the training loss (gray line) decreases rapidly during the initial epochs and then gradually decreases, reaching approximately 0.12. The validation loss (gray line) also follows a similar trend, beginning at 0.20 and decreasing steadily to approximately 0.10 at the end of the epochs. The training loss (blue line) begins at approximately 0.21 and steadily decreases to approximately 0.08. The validation loss (blue line) follows a similar trend, starting from approximately 0.14 and decreasing steadily to approximately 0.08 at the end. Regarding the accuracy comparison in the bottom image, the training accuracy (gray line) begins at 87.56% and increases steadily to approximately 96.1% at the end. The validation accuracy (gray line) begins at 92.92% and increases to approximately 96.8% at the end. The training accuracy (blue line) begins at 91.80% and increases steadily to approximately 97.7% at the end. The validation accuracy (blue line) begins at 95.39% and increases to approximately 97.7% at the end.
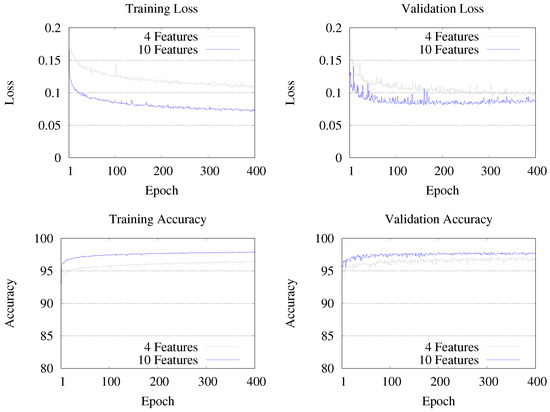
Figure 10.
Accuracy and loss (both in training and validation): comparison of deep-learning model with different feature selections.
Both models showed a consistent decrease in both the training and validation losses; this result indicates that they were learning effectively. The ten-feature model outperformed the four-feature model in terms of losses, indicating that the inclusion of additional features improved the model’s ability to generalize unseen data. Regarding accuracy trends, both models showed consistent improvement over the epochs. The ten-feature model outperformed the four-feature model in terms of accuracy on both the training and validation sets. This indicates that the model can learn more and perform better as a result of the additional information provided by the extra features. There seems to be a slight indication of overfitting in both models, particularly towards the later epochs, where the training loss continues to decrease, whereas the validation loss plateaus or slightly increases. However, this effect was more evident in the four-feature model than in the ten-feature model. This implies that the 10-feature model was more robust and less overfitting. Based on the provided data, the 10-feature model appeared to perform better in terms of loss and accuracy in both the training and validation sets. This model provides better generalization and predictive ability than the four-feature model. In conclusion, the 10-feature model exhibited better performance in terms of loss and accuracy, suggesting that it was the preferred model for this dataset. However, to make a more informed decision, it is essential to consider factors such as computational resources, model complexity, and practical application requirements.
5. Conclusions
This study addresses the critical challenges in network security within HPC environments by analyzing firewall event logs using machine- and deep-learning models. We collected and integrated events from Supercomputer Nurion’s network security equipment over a four-year period. This allowed us to significantly contribute to improving network security in the HPC service environment. Our analysis process involved parsing, extracting, and pre-processing vast firewall event logs to create labeled datasets for training. We developed a tailored database for efficient big-data storage and processing, ensuring that the high-speed demands of real service networks were satisfied. Our method successfully detected and classified human error-caused firewall rule policy errors by identifying patterns when the firewall event state changes.
We implemented various machine-learning algorithms (naïve Bayes, KNN, OneR, J48, logistic regression, and SVM) and a deep-learning model (NN with cross-entropy loss function) by experimenting with different feature sets and data-scaling techniques. The results demonstrate the effectiveness of these models in classifying security events and improving their accuracy. Our comparative analyses showed that models such as KNN, J48, and the NN model performed exceptionally well with expanded feature sets, achieving high accuracy in classifying firewall event logs. An SVM with a polynomial kernel also showed significant performance improvements with increased features.
The findings of this study provide valuable insights into the effective use of machine-learning and deep-learning models for network security analyses in HPC environments. Our proposed solutions and methodologies provide the basis for enhanced network security measures, the proactive identification of policy errors, and automated threat-detection and -response capabilities. Future studies will focus on refining the models, exploring additional classification algorithms, and implementing real-time security-monitoring systems based on these findings.
Author Contributions
Conceptualization, G.L.; Formal analysis, J.-K.L.; Writing—original draft, J.-K.L.; Writing—review & editing, G.L.; Project administration, T.H. All authors have read and agreed to the published version of the manuscript.
Funding
This research has been performed as a project of Project No. K24L2M1C1 (The national flagship supercomputer infrastructure implementation and service) supported by the Korea Institute of Science and Technology Information (KISTI).
Institutional Review Board Statement
Not applicable.
Informed Consent Statement
Not applicable.
Data Availability Statement
The original contributions presented in the study are included in the article, further inquiries can be directed to the corresponding author.
Acknowledgments
This research was supported by the Korea Institute of Science and Technology Information(KISTI) (No. K24L2M1C1).
Conflicts of Interest
The authors declare no conflicts of interest.
References
- He, S.; Zhu, J.; He, P.; Lyu, M.R. Experience Report: System Log Analysis for Anomaly Detection. In Proceedings of the 2016 IEEE 27th International Symposium on Software Reliability Engineering (ISSRE), Ottawa, ON, Canada, 23–27 October 2016; pp. 207–218. [Google Scholar] [CrossRef]
- Putra, M.A.R.; Ahmad, T.; Hostiadi, D.P. Analysis of botnet attack communication pattern behavior on computer networks. Int. J. Intell. Eng. Syst. 2022, 15, 533–544. [Google Scholar]
- Maosa, H.; Ouazzane, K.; Ghanem, M.C. A hierarchical security event correlation model for real-time threat detection and response. Network 2024, 4, 68–90. [Google Scholar] [CrossRef]
- Lee, J.-K.; Hong, T.; Li, G. Traffic and overhead analysis of applied pre-filtering ACL firewall on HPC service network. J. Commun. Netw. 2021, 23, 192–200. [Google Scholar] [CrossRef]
- As-Suhbani, H.E.; Khamitkar, S.D. Classification of Firewall Logs Using Supervised Machine Learning Algorithms. Int. J. Comput. Sci. Eng. (JCSE) 2019, 7, 301–304. [Google Scholar] [CrossRef]
- Uçar, E.; Ozhan, E. The Analysis of Firewall Policy Through Machine Learning and Data Mining. Wirel. Pers. Commun. 2017, 96, 2891–2909. [Google Scholar] [CrossRef]
- Khamitkar, S.D.; As-Suhbani, H.E. Discovering Anomalous Rules In Firewall Logs Using Data Mining And Machine Learning Classifiers. Int. J. Sci. Technol. Res. 2020, 9, 2491–2497. [Google Scholar]
- Ertam, F.; Kaya, M. Classification of firewall log files with multiclass support vector machine. In Proceedings of the 2018 6th International Symposium on Digital Forensic and Security (ISDFS), Antalya, Turkey, 22–25 March 2018; pp. 1–4. [Google Scholar] [CrossRef]
- Zhu, Q.; He, Z.; Zhang, T.; Cui, W. Improving Classification Performance of Softmax Loss Function Based on Scalable Batch-Normalization. Appl. Sci. 2020, 10, 2950. [Google Scholar] [CrossRef]
- Wu, Y.; Wei, D.; Feng, J. Network Attacks Detection Methods Based on Deep Learning Techniques: A Survey. Sec. Commun. Netw. 2020, 2020, 1–17. [Google Scholar] [CrossRef]
- Du, M.; Li, F.; Zheng, G.; Srikumar, V. DeepLog: Anomaly Detection and Diagnosis from System Logs through Deep Learning. In Proceedings of the 2017 ACM SIGSAC Conference on Computer and Communications Security (CCS ’17), Dallas, TX, USA, 30 October–3 November 2017; Association for Computing Machinery: New York, NY, USA, 2017; pp. 1285–1298. [Google Scholar] [CrossRef]
- Ali, M.N.; Imran, M.; Din, M.S.U.; Kim, B.S. Low rate DDoS detection using weighted federated learning in SDN control plane in IoT network. Appl. Sci. 2023, 13, 1431. [Google Scholar] [CrossRef]
- Wu, C.; Chen, S. A heuristic intrusion detection approach using deep learning model. In Proceedings of the 2023 International Conference on Information Networking (ICOIN), Bangkok, Thailand, 1–14 January 2023; pp. 438–442. [Google Scholar]
- Garcia, J.F.C.; Blandon, G.E.T. A deep learning-based intrusion detection and preventation system for detecting and preventing Denial-of-Service attacks. IEEE Access 2022, 10, 83043–83060. [Google Scholar] [CrossRef]
- Kumar, D.; Pateriya, R.K.; Gupta, R.K.; Dehalwar, V.; Sharma, A. DDoS detection using deep learning. Proc. Comput. Sci. 2023, 218, 2420–2429. [Google Scholar] [CrossRef]
- Saeed, A.M.; Wang, D.; Alnedhari, H.A.; Mei, K.; Wang, J. A survey of machine learning and deep learning based dga detection techniques. In Proceedings of the International Conference on Smart Computing and Communication, Kochi, India, 1–3 July 2021; pp. 133–143. [Google Scholar]
- Hassaoui, M.; Hanini, M.; El Kafhali, S. A comparative study of neural networks algorithms in cyber-security to detect domain generation algorithms based on mixed classes of data. In Proceedings of the International Conference on Advanced Intelligent Systems for Sustainable Development, Rabat, Morocco, 22–27 May 2022; pp. 240–250. [Google Scholar]
- Maiga, A.-A.; Ataro, E.; Githinji, S. Intrusion Detection With Deep Learning Classifiers: A Synergistic Approach of Probabilistic Clustering and Human Expertise to Reduce False Alarms. IEEE Access 2024, 12, 17836–17858. [Google Scholar] [CrossRef]
- Islam, M.S.; Uddin, M.A.; Ahmed, D.M.S.; Moazzam, G. Analysis and evaluation of network and application security based on next generation firewall. Int. J. Comput. Digit. Syst. 2023, 13, 193–202. [Google Scholar] [CrossRef] [PubMed]
- Liao, R.; Wang, S. Malicious domain detection based on semi-supervised learning and parameter optimization. IET Commun. 2024, 18, 386–397. [Google Scholar] [CrossRef]
- Park, K.H.; Song, H.M.; Yoo, J.D.; Hong, S.Y.; Cho, B.; Kim, K.; Kim, H.K. Unsupervised malicious domain detection with less labeling effort. Comp. Secur. 2022, 116, 102662. [Google Scholar] [CrossRef]
- Ghadermazi, J.; Shah, A.; Jajodia, S. A Machine Learning and Optimization Framework for Efficient Alert Management in a Cybersecurity Operations Center. Digit. Threat. Res. Pract. 2024; just accepted. [Google Scholar] [CrossRef]
- Hnamte, V.; Nhung-Nguyen, H.; Hussain, J.; Hwa-Kim, Y. A novel two-stage deep learning model for network intrusion detection: LSTM-AE. IEEE Access 2023, 11, 37131–37148. [Google Scholar] [CrossRef]
- Imran, M.; Siddiqui, H.U.R.; Raza, A.; Raza, M.A.; Rustam, F.; Ashraf, I. A performance overview of machine learning-based defense strategies for advanced persistent threats in industrial control systems. Comput. Secur. 2023, 134, 103445. [Google Scholar] [CrossRef]
- Kumar, G.S.C.; Kumar, R.K.; Kumar, K.P.V.; Sai, N.R.; Brahmaiah, M. Deep residual convolutional neural network: An efficient technique for intrusion detection system. Expert Syst. Appl. 2024, 238, 121912. [Google Scholar] [CrossRef]
- Xu, H.; Sun, L.; Fan, G.; Li, W.; Kuang, G. A hierarchical intrusion detection model combining multiple deep learning models with attention mechanism. IEEE Access 2023, 11, 66212–66226. [Google Scholar] [CrossRef]
- Hnamte, V.; Hussain, J. Dependable intrusion detection system using deep convolutional neural network: A novel framework and performance evaluation approach. Telemat. Informat. Rep. 2023, 11, 100077. [Google Scholar] [CrossRef]
- Mohammadian, H.; Ghorbani, A.A.; Lashkari, A.H. A gradient-based approach for adversarial attack on deep learning-based network intrusion detection systems. Appl. Soft Comput. 2023, 137, 110173. [Google Scholar] [CrossRef]
- Dawadi, B.R.; Adhikari, B.; Srivastava, D.K. Deep Learning Technique-Enabled Web Application Firewall for the Detection of Web Attacks. Sensors 2023, 23, 2073. [Google Scholar] [CrossRef] [PubMed]
- Saleous, H.; Trabelsi, Z. Enhancing Firewall Filter Performance Using Neural Networks. In Proceedings of the 2019 15th International Wireless Communications & Mobile Computing Conference (IWCMC), Tangier, Morocco, 24–28 June 2019; pp. 1853–1859. [Google Scholar] [CrossRef]
- Pinto, A.; Herrera, L.-C.; Donoso, Y.; Gutierrez, J.A. Survey on intrusion detection systems based on machine learning techniques for the protection of critical infrastructure. Sensors 2023, 23, 2415. [Google Scholar] [CrossRef] [PubMed]
- Beverly, R.; Sollins, K. An internet protocol address clustering algorithm. In Proceedings of the Third Conference on Tackling Computer Systems Problems with Machine Learning Techniques (SysML’08), San Diego, CA, USA, 13–15 February 2018; USENIX Association: Long Beach, WA, USA, 2018. [Google Scholar]
- Tuan, T.A.; Long, H.V.; Taniar, D. On detecting and classifying dga botnets and their families. Comput. Secur. 2022, 113, 102549. [Google Scholar] [CrossRef]
- August, T.; Dao, D.; Niculescu, M.F. Economics of ransomware: Risk interdependence and large-scale attacks. Manag. Sci. 2022, 68, 8979–9002. [Google Scholar] [CrossRef]
- Rish, I. An empirical study of the naive Bayes classifier. In IJCAI 2001 Workshop on Empirical Methods in Artificial Intelligence; IBM: Boulder, CO, USA, 2001; Volume 3, pp. 41–46. [Google Scholar]
- Maalouf, M. Logistic regression in data analysis: An overview. Int. J. Data Anal. Tech. Strateg. 2011, 3, 281–299. [Google Scholar] [CrossRef]
- Agarwala, A.; Pennington, J.; Dauphin, Y.; Schoenholz, S. Temperature check: Theory and practice for training models with softmax-cross-entropy losses. arXiv 2020, arXiv:2010.07344. [Google Scholar]


Disclaimer/Publisher’s Note: The statements, opinions and data contained in all publications are solely those of the individual author(s) and contributor(s) and not of MDPI and/or the editor(s). MDPI and/or the editor(s) disclaim responsibility for any injury to people or property resulting from any ideas, methods, instructions or products referred to in the content. |
© 2024 by the authors. Licensee MDPI, Basel, Switzerland. This article is an open access article distributed under the terms and conditions of the Creative Commons Attribution (CC BY) license (https://creativecommons.org/licenses/by/4.0/).