Article

Effect of Sodium Laureth Sulfate on Contact Angles of High-Impact Polystyrene and Acrylonitrile–Butadiene–Styrene from Recycled Refrigeration Equipment

by
Benita Malinowska
1,2,*,
Julio León Munoz Esteban
3,
Evgeniy Pakhlov
2,4 and
Konrad Terpiłowski
2
1
Polish Recycling Corporation, 20-234 Lublin, Poland
2
Department of Interfacial Phenomena, Maria Curie-Skłodowska University, 20-031 Lublin, Poland
3
Erasmus Student Mobility Programme, University of Jaén, 23071 Jaén, Spain
4
Chuik Institute of Surface Chemistry, Ukrainian Academy of Sciences, 03680 Kiev, Ukraine
*
Author to whom correspondence should be addressed.
Appl. Sci. 2024, 14(11), 4407; https://doi.org/10.3390/app14114407
Submission received: 13 February 2024 / Revised: 9 March 2024 / Accepted: 13 May 2024 / Published: 22 May 2024
(This article belongs to the Section Applied Industrial Technologies)

Abstract

:
This paper investigates the effects of sodium laureth sulfate (SLES) on the wettability of the surface of the two most common recycled plastics in refrigeration equipment: HIPS (high-impact polystyrene) and ABS (acrylonitrile–butadiene–styrene). These plastics, in the form of flakes, were identified on the basis of their FTIR spectra, and then, they were subjected to a study of contact angles using the sessile droplet method. The solutions for the angle analysis included tap water with the addition of SLES. The results of this study showed that at SLES concentrations of 0.1 g/L and 0.2 g/L, the differences in the contact angles for HIPS and ABS were 10.76° and 10.10°, respectively. This research confirmed the potential of using SLES as a support for the flotation separation of plastics with similar densities and surface characteristics, such as HIPS and ABS.

1. Introduction

The global production of WEEE (waste electrical and electronic equipment) is increasing constantly. The continuous expansion in the consumption and the short life-span of electric and electronic devices have led to the increasing accumulation of WEEE [1]. WEEE plastics include mainly polystyrene (PS), acrylonitrile–butadiene–styrene (ABS) and polypropylene (PP), comprising about 84.74 wt% of total WEEE plastics [2]. These plastics are characterized by high recycling potential, but their processing is difficult due to minute differences in their densities. Moreover, the molecular structure of ABS and HIPS is similar to that of the monomer styrene, thereby leading to similar surface characteristics: a dielectric constant and hydrophilicity [3].
Therefore, separating plastic mixtures into individual components is considered to be a challenge in solid waste management [4]. There are many methods for separating plastic mixtures, such as the following:
  • Magnetic density separation [5];
  • Triboelectrification [6];
  • Hydrocyclone separation [7];
  • Selective flotation [8].
Selective flotation separation is based upon the selective attachment of air bubbles to the plastic surface, resulting in the floating or sinking of proper plastics. This is an effective replacement for other methods because it is characterized by high efficiency, low cost and great accuracy. As most plastics have a naturally hydrophobic surface, the selective enhancement of surface hydrophilicity for one or more components in mixtures becomes necessary. Air bubbles generated in the flotation process are more likely to attach to the hydrophobic surface [9].
The selectivity of flotation separation depends on the method of surface modification. Some methods can make plastic surfaces hydrophilic, such as the following:
  • Boiling treatment [8];
  • Microwave treatment [10];
  • Chemical oxidation [11].
What is more, some wetting agents are effective for changing the surface characteristics of some plastics (e.g., quebracho, methyl cellulose, lignosulfonates or tannic acid) [12]. It is necessary to improve the flotation separation of acrylonitrile–butadiene–styrene (ABS) and polystyrene (PS) plastics because, as already mentioned, ABS and HIPS are common plastics coexisting in waste electrical and electronic equipment (WEEE) [13]. Moreover, HIPS and ABS are not compatible plastics and, as such, the recyclate will be characterized by reduced properties and difficult processing [14]. Restoring plastics with properties as close as possible to virgin properties will allow such plastics to be recycled multiple times. The purer the composition of the regranulate made from recycled plastics, the better the properties of the elements made of such regranulate.
In the study [15], the substance used to change the surface characteristics of PS and ABS was chlorine oxide [IV] in an amount of 0.5 g/L. The flotation of plastics was performed in distilled water. A temperature of 70 °C and a 60 min treatment time were applied. The difference in the contact angles after the application of ClO2 for PS was 3.10°, and for ABS it was 12.10°. In the paper [16], in order to change the surface characteristics of PS and ABS, a solution of NaOCl in distilled water was used. A concentration of 0.05 M/L sodium hypochlorite, a temperature of 67.5°C and a 59.5 min treatment time were used. The difference in the contact angles for PS was 0.15°, and for ABS, 13.64°. In the paper [17], it was stated that a solution of potassium manganate in deionized water at a concentration of 50 mM/L was used to change the nature of the surface. Applying a temperature of 60 °C and a 30 min treatment time, differences in the contact angles of 1.16° for PS and 13.64° for ABS were obtained. Using a solution of K2FeO4 in distilled water, differences in the contact angles of 0.41° for PS and 10.89° for ABS were obtained in the paper [18]. A temperature of 60 °C, 0.15 M/L of potassium ferrite and 15 min of treatment time were used. In the PhD thesis [19], tannic acid was used to change the nature of PS and ABS surfaces. The differences in the contact angles were 0.86° for PS and 19.14° for ABS. The novelty was the use of a SLES surfactant to change the surface characteristics mainly of ABS plastic (slightly changing those of HIPS), which became more hydrophilic, owing to which it sank to the bottom of the flotation solution (air bubbles attach to a more hydrophobic surface, i.e., to the HIPS surface).
The aim of this study was to investigate the effects of the surfactant SLES, i.e., ethoxylated sodium lauryl sulfate (sodium lauryl ether sulfate, sodium laureth sulfate), on the wetting of HIPS and ABS surfaces [Figure 1].
In the factory of the Polish Recycling Corporation, a number of electronic devices are processed in order to obtain useful materials. Refrigeration appliances, refrigerators and freezers account for a large amount of processed equipment. In the case of recirculation using grinding, there is a problem with the separation of two polymers, HIPS and ABS, which are commonly used as materials for the inner walls of refrigerators. This research was carried out at the Department of Interfacial Phenomena of Maria Curie-Sklodowska University, which has extensive experience in the study of polymer wettability and all types of investigations on surfactants. The new method had to be more efficient and cheaper than those currently used. This research was financed by the Ministry of Science of the Republic of Poland as part of an implementation doctoral thesis.

2. Materials and Methods

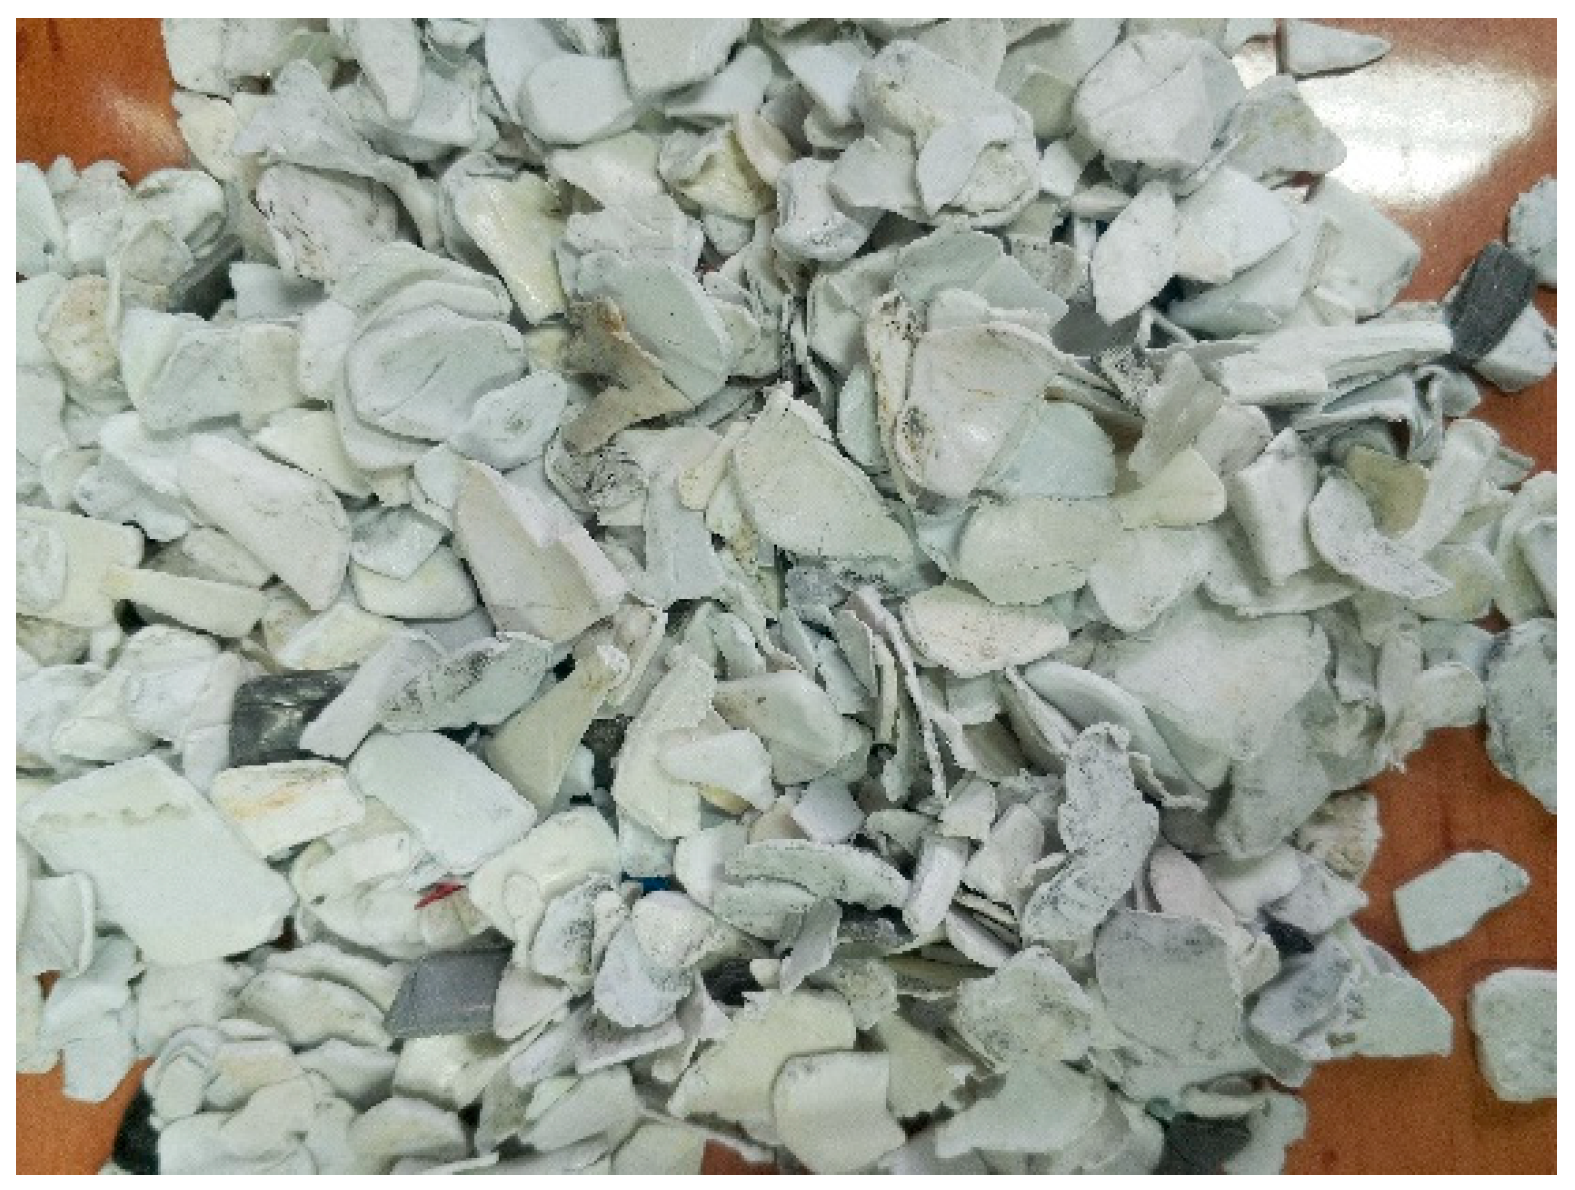
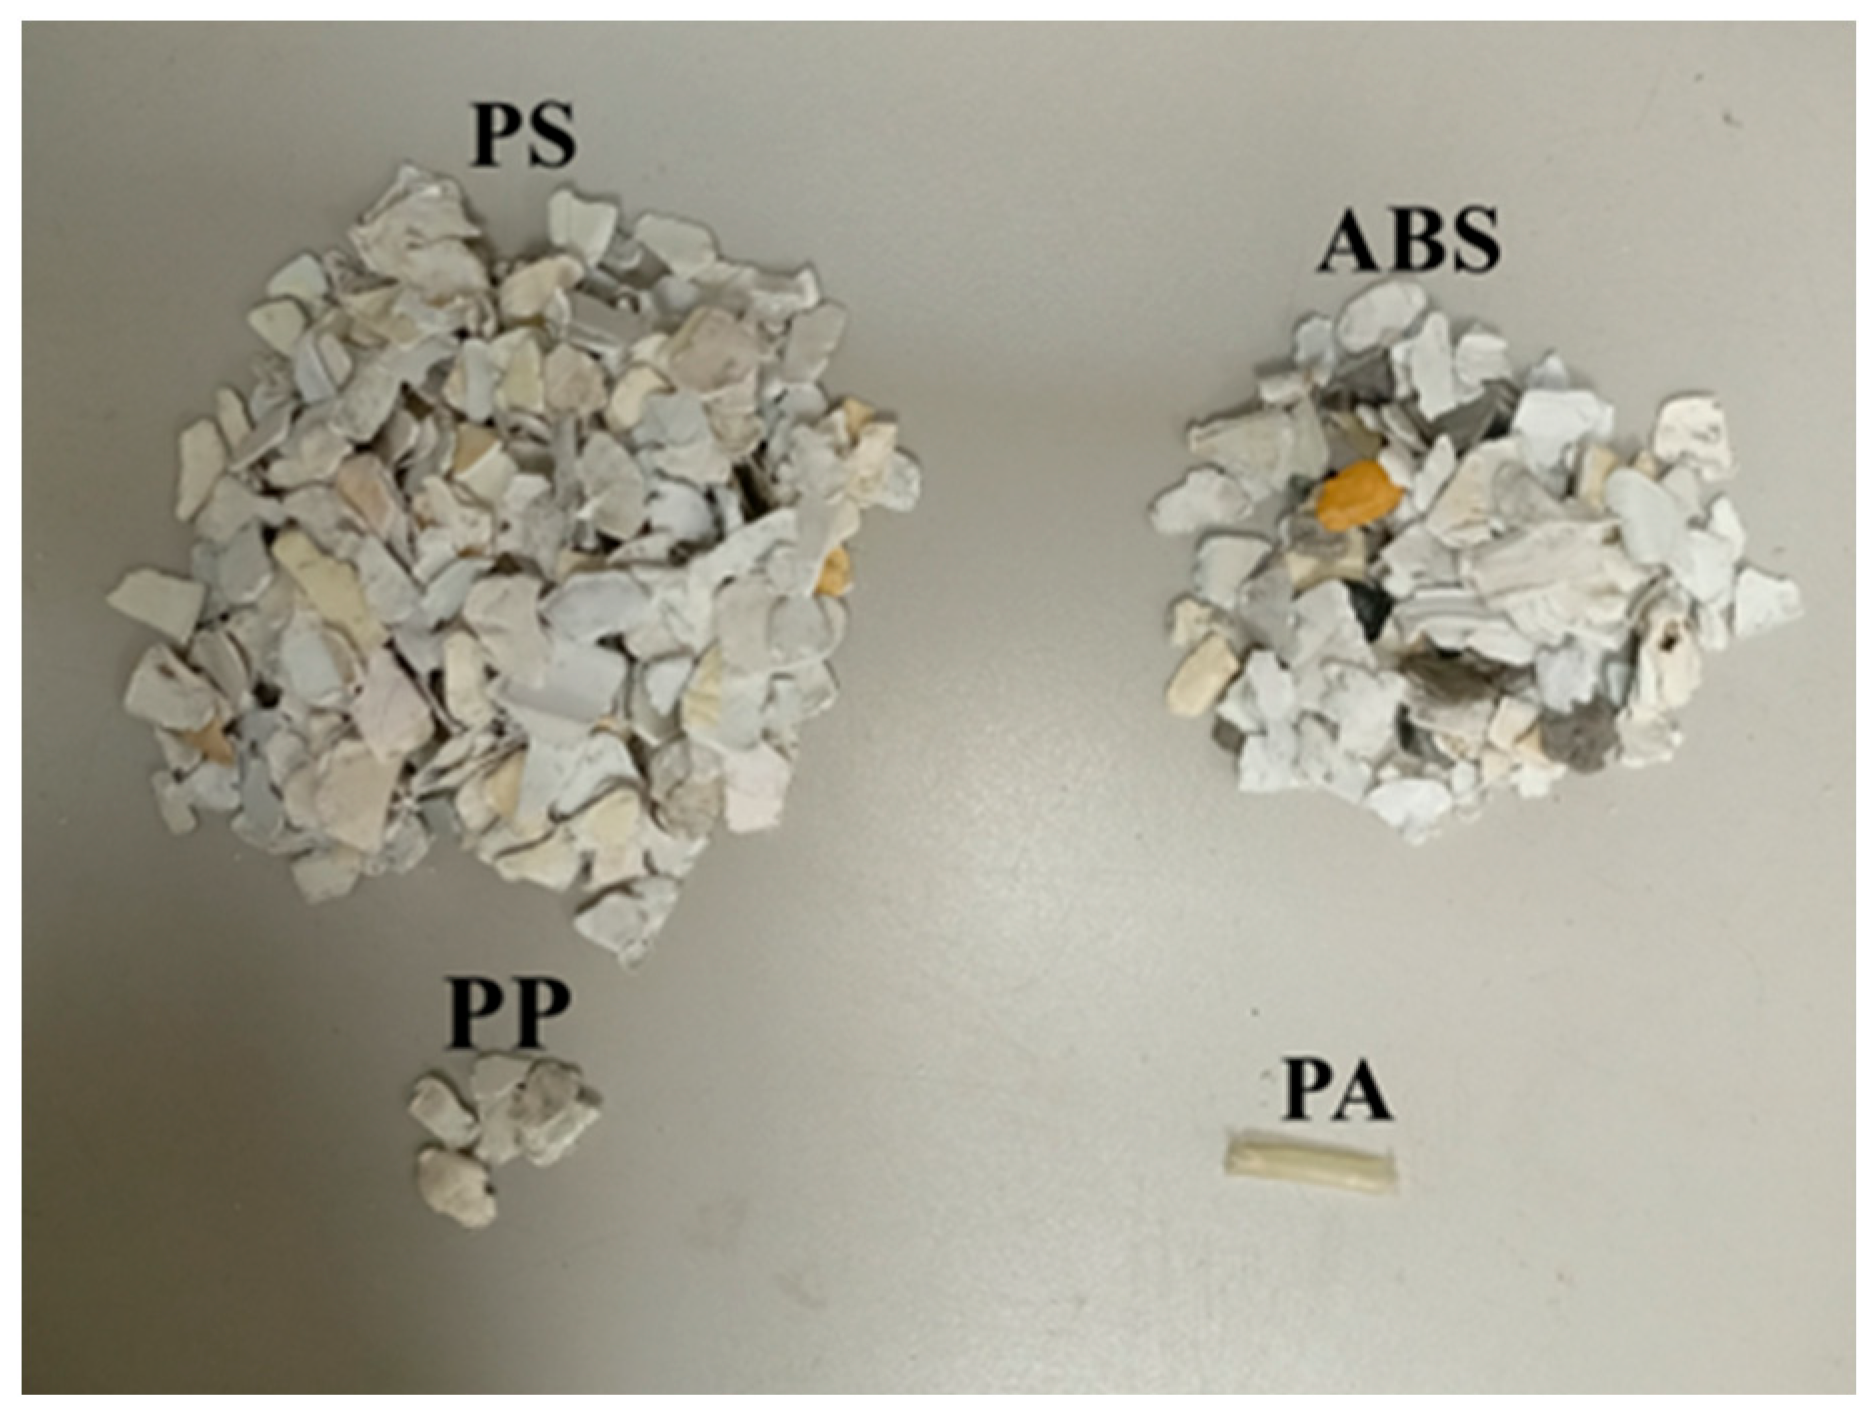
2.1. Method of Selection of the Representative Sample

The tested materials were approximately 1.5 cm thick high-impact polystyrene (HIPS) and acrylonitrile–butadiene–styrene (ABS) flakes (Figure 2). Plastics were created as a result of the recycling of refrigeration equipment: refrigerators, freezers and refrigerator–freezers for commercial or domestic use.
In the papers [1,4], the size of the ABS and PS flakes tested was 2.0–4.0 mm. In the study [2], the ABS and PS tested were sieved into fractions of 0.9–2.0 mm, 2.0–2.5 mm, 2.5–3.2 mm and 3.2–4.0 mm. In the paper [3], selected waste plastics with sizes of 5–10 mm were used for the research. In papers [1,2,3,4], the samples were crushed using laboratory crushers. The material used in this study was already collected in a ground form (and in such a form, it would be subjected to flotation on a larger scale) and was not crushed further.
The sample was collected by the Polish Recycling Corporation—a plant specializing in processing waste electrical and electronic equipment (WEEE). The unit samples were taken manually from 3 randomly selected collection bags (BigBags) directly from the line (during material processing) from three different diagonal places of the raw material entering into the BigBag and put into a plastic container. Each incremental sample had a similar weight (approximately 0.5 kg). The bulk sample was made by combining and thoroughly mixing the incremental samples as well as homogenizing them. The total sample was reduced by the quartering method, resulting in the laboratory sample weighing approximately 0.2 kg for laboratory tests.
The method of quartering consists of making a cone, flattening it and dividing it into 4 equal parts. The next step is to discard the two opposite parts and leave the other two for a further decrease. Then, it is necessary to build a cone again, taking the material from one quarter, and then from the others. The heaped cone is successively flattened and divided into four equal parts, of which two opposite ones should be discarded, and the next two should be left for further reduction. The operations are repeated until a sufficient sample mass is obtained [20].
As follows from the paper [21], the sampling process should be monitored from the beginning to reduce the total sampling error. It is important to identify and prevent errors soon enough. The basic sampling error is inherent in the properties of the material (among others, the size, shape, grain density, and composition of the materials). It is very important to homogenize the samples thoroughly before each step of their combination and reduction. It is important to get to know the heterogeneity characteristics of the materials. The use of the representative method of mass reduction is recommended, and the quartering method applied in this paper is such a method. In addition, it is recommended to grind the sample (grain size reduction), which would reduce the value of the basic sampling error, but in the case of these tests, this action was undesirable (plastic flakes must be intact for subsequent tests). The larger the sample weight, the more representative the sample is. At the same time, however, the current analytical volumes steadily decreased with increasing precision of the analytical instruments. The analytical results refer to a smaller and smaller volume, but nevertheless, these results are supposedly representative of the entire batch. This is the root cause of any sampling and representativeness issues. This is why it is so important to follow the proper sampling procedure from the very beginning.

2.2. Pre-Identification of HIPS and ABS with Handheld NIR Spectrometer

Pre-identification of HIPS and ABS from the plastic mixture was performed using a portable NIR (Near Infrared Spectroscopy) spectrometer from Thermo Scientific, Waltham, MA, USA (MicroPHAZIR RX). This is a hand-held device which, based on near infrared, is able to recognize the plastic under study. After the analysis, the name of the tested material (e.g., PP, PVC, PET, etc.) is displayed on the spectrometer screen. The identified plastic flakes were placed in two separate, appropriately labeled string bags.

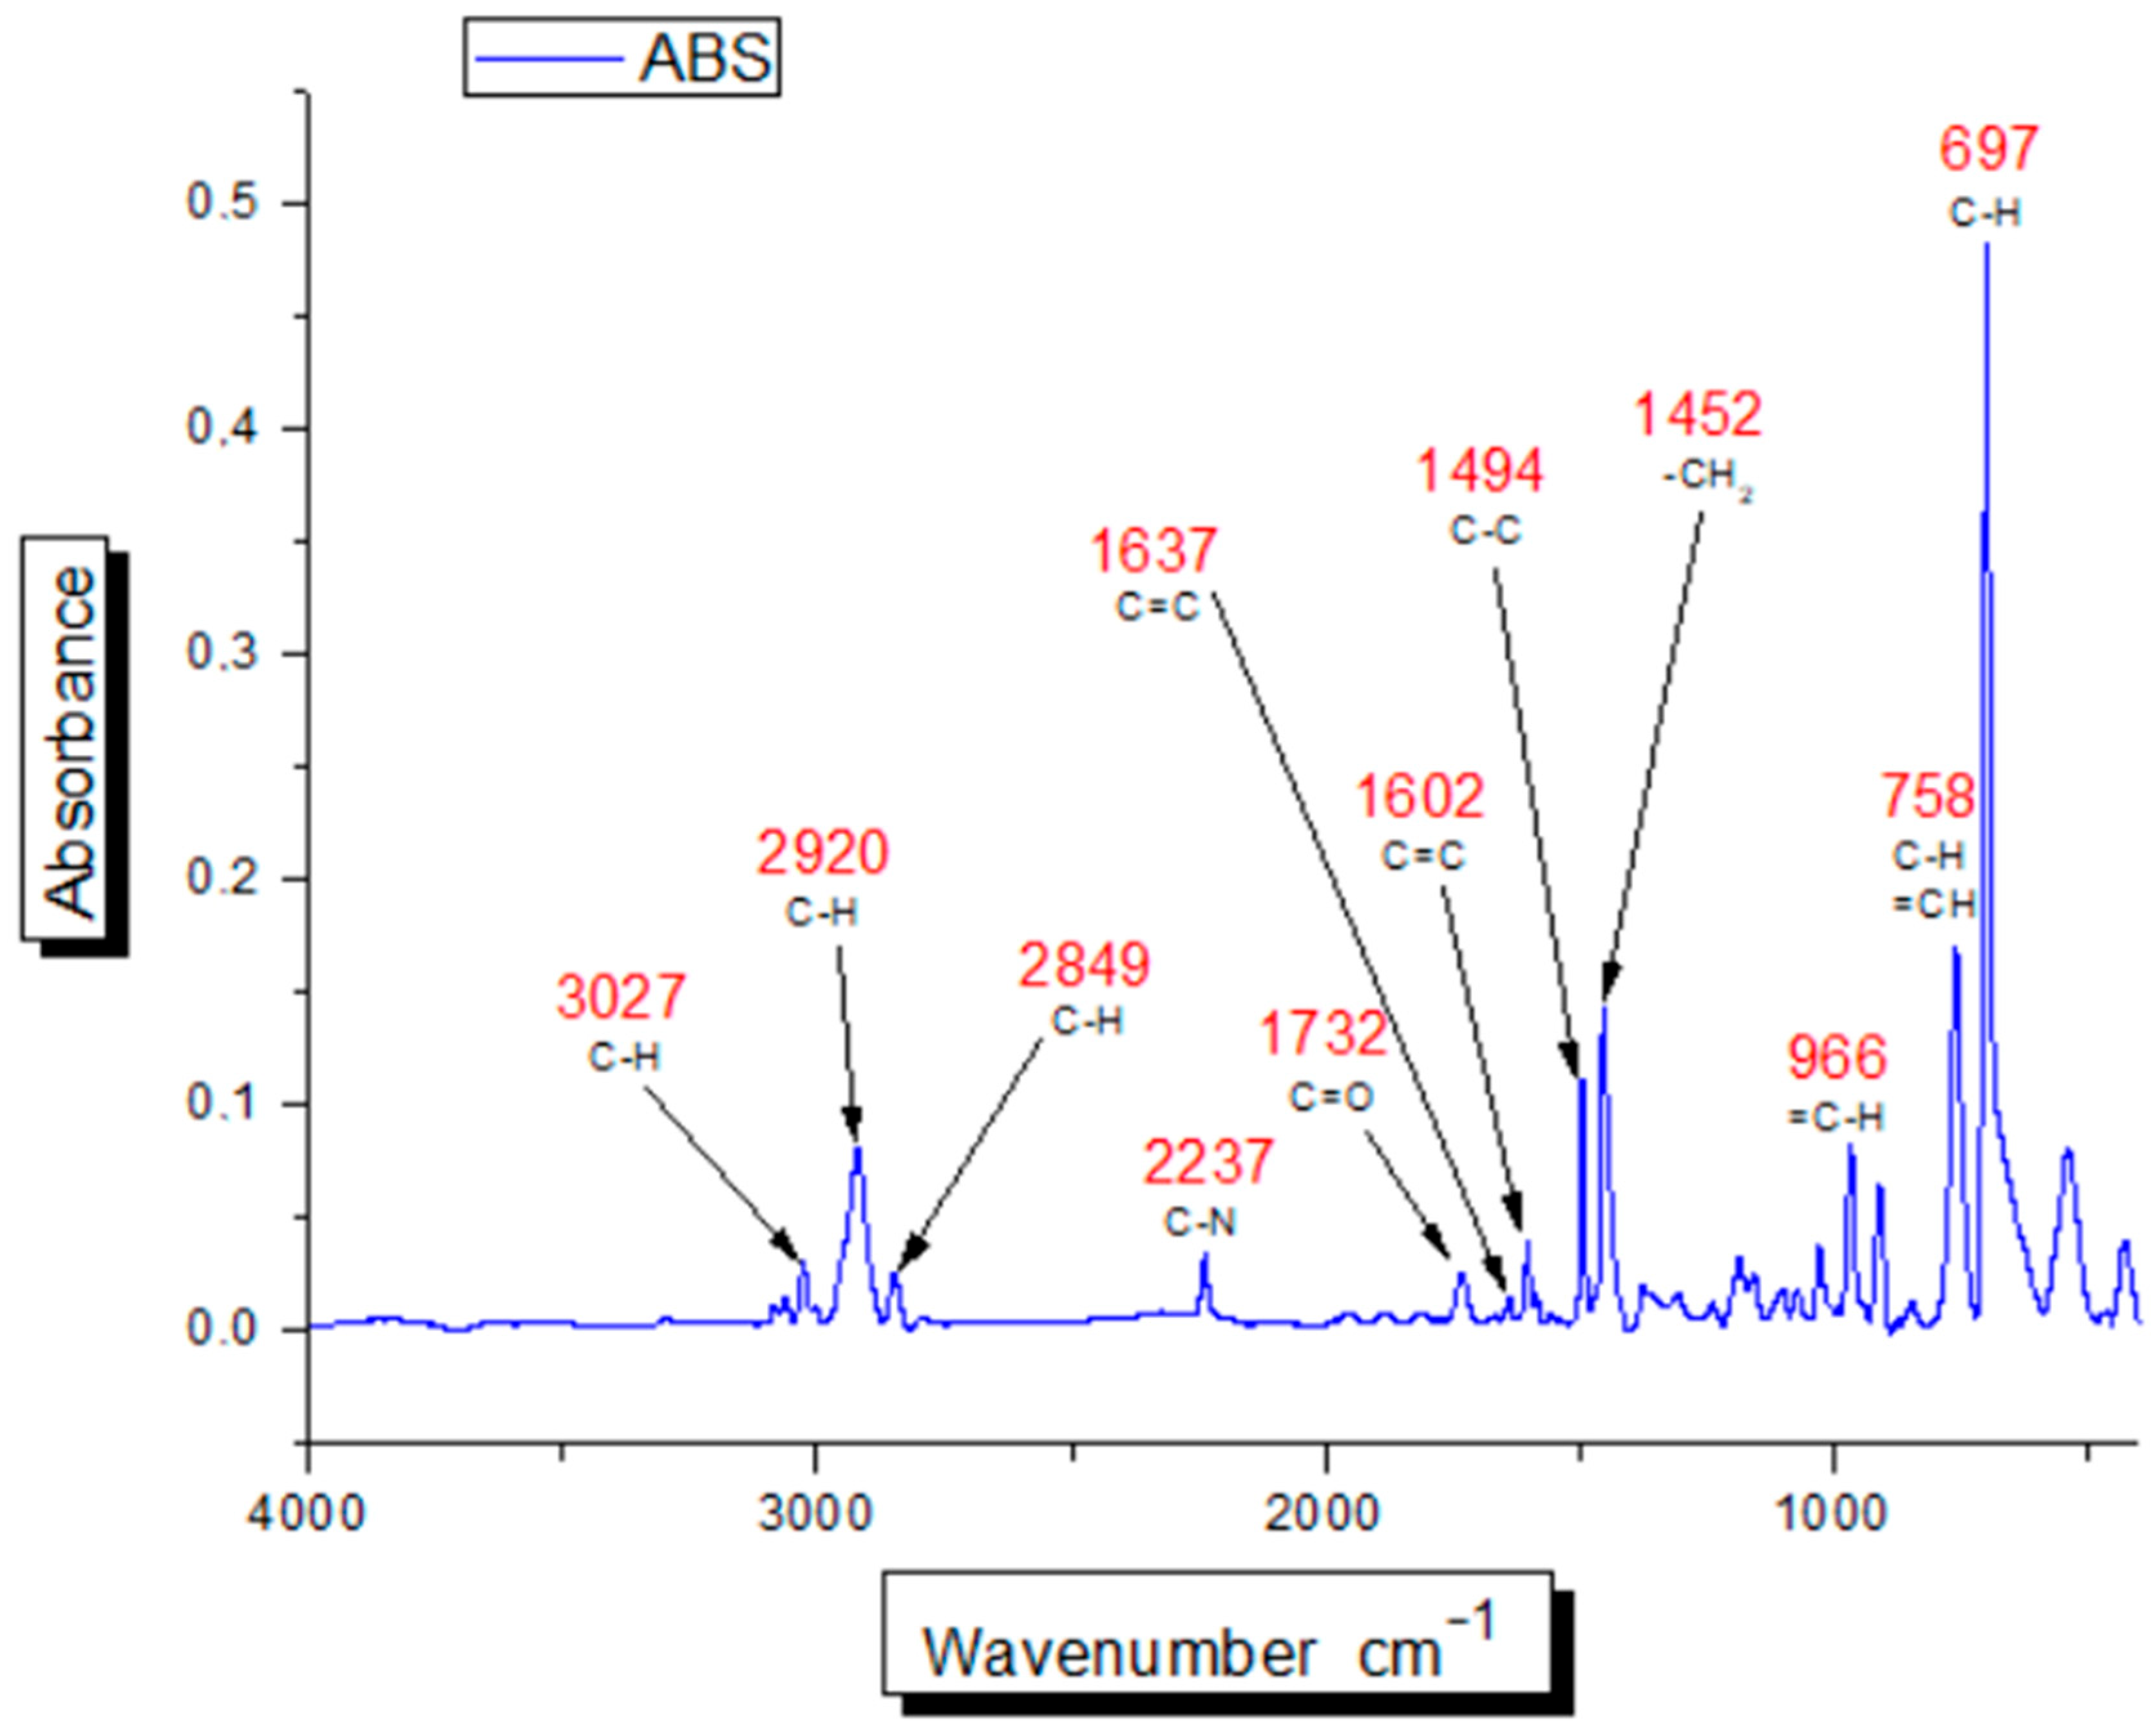
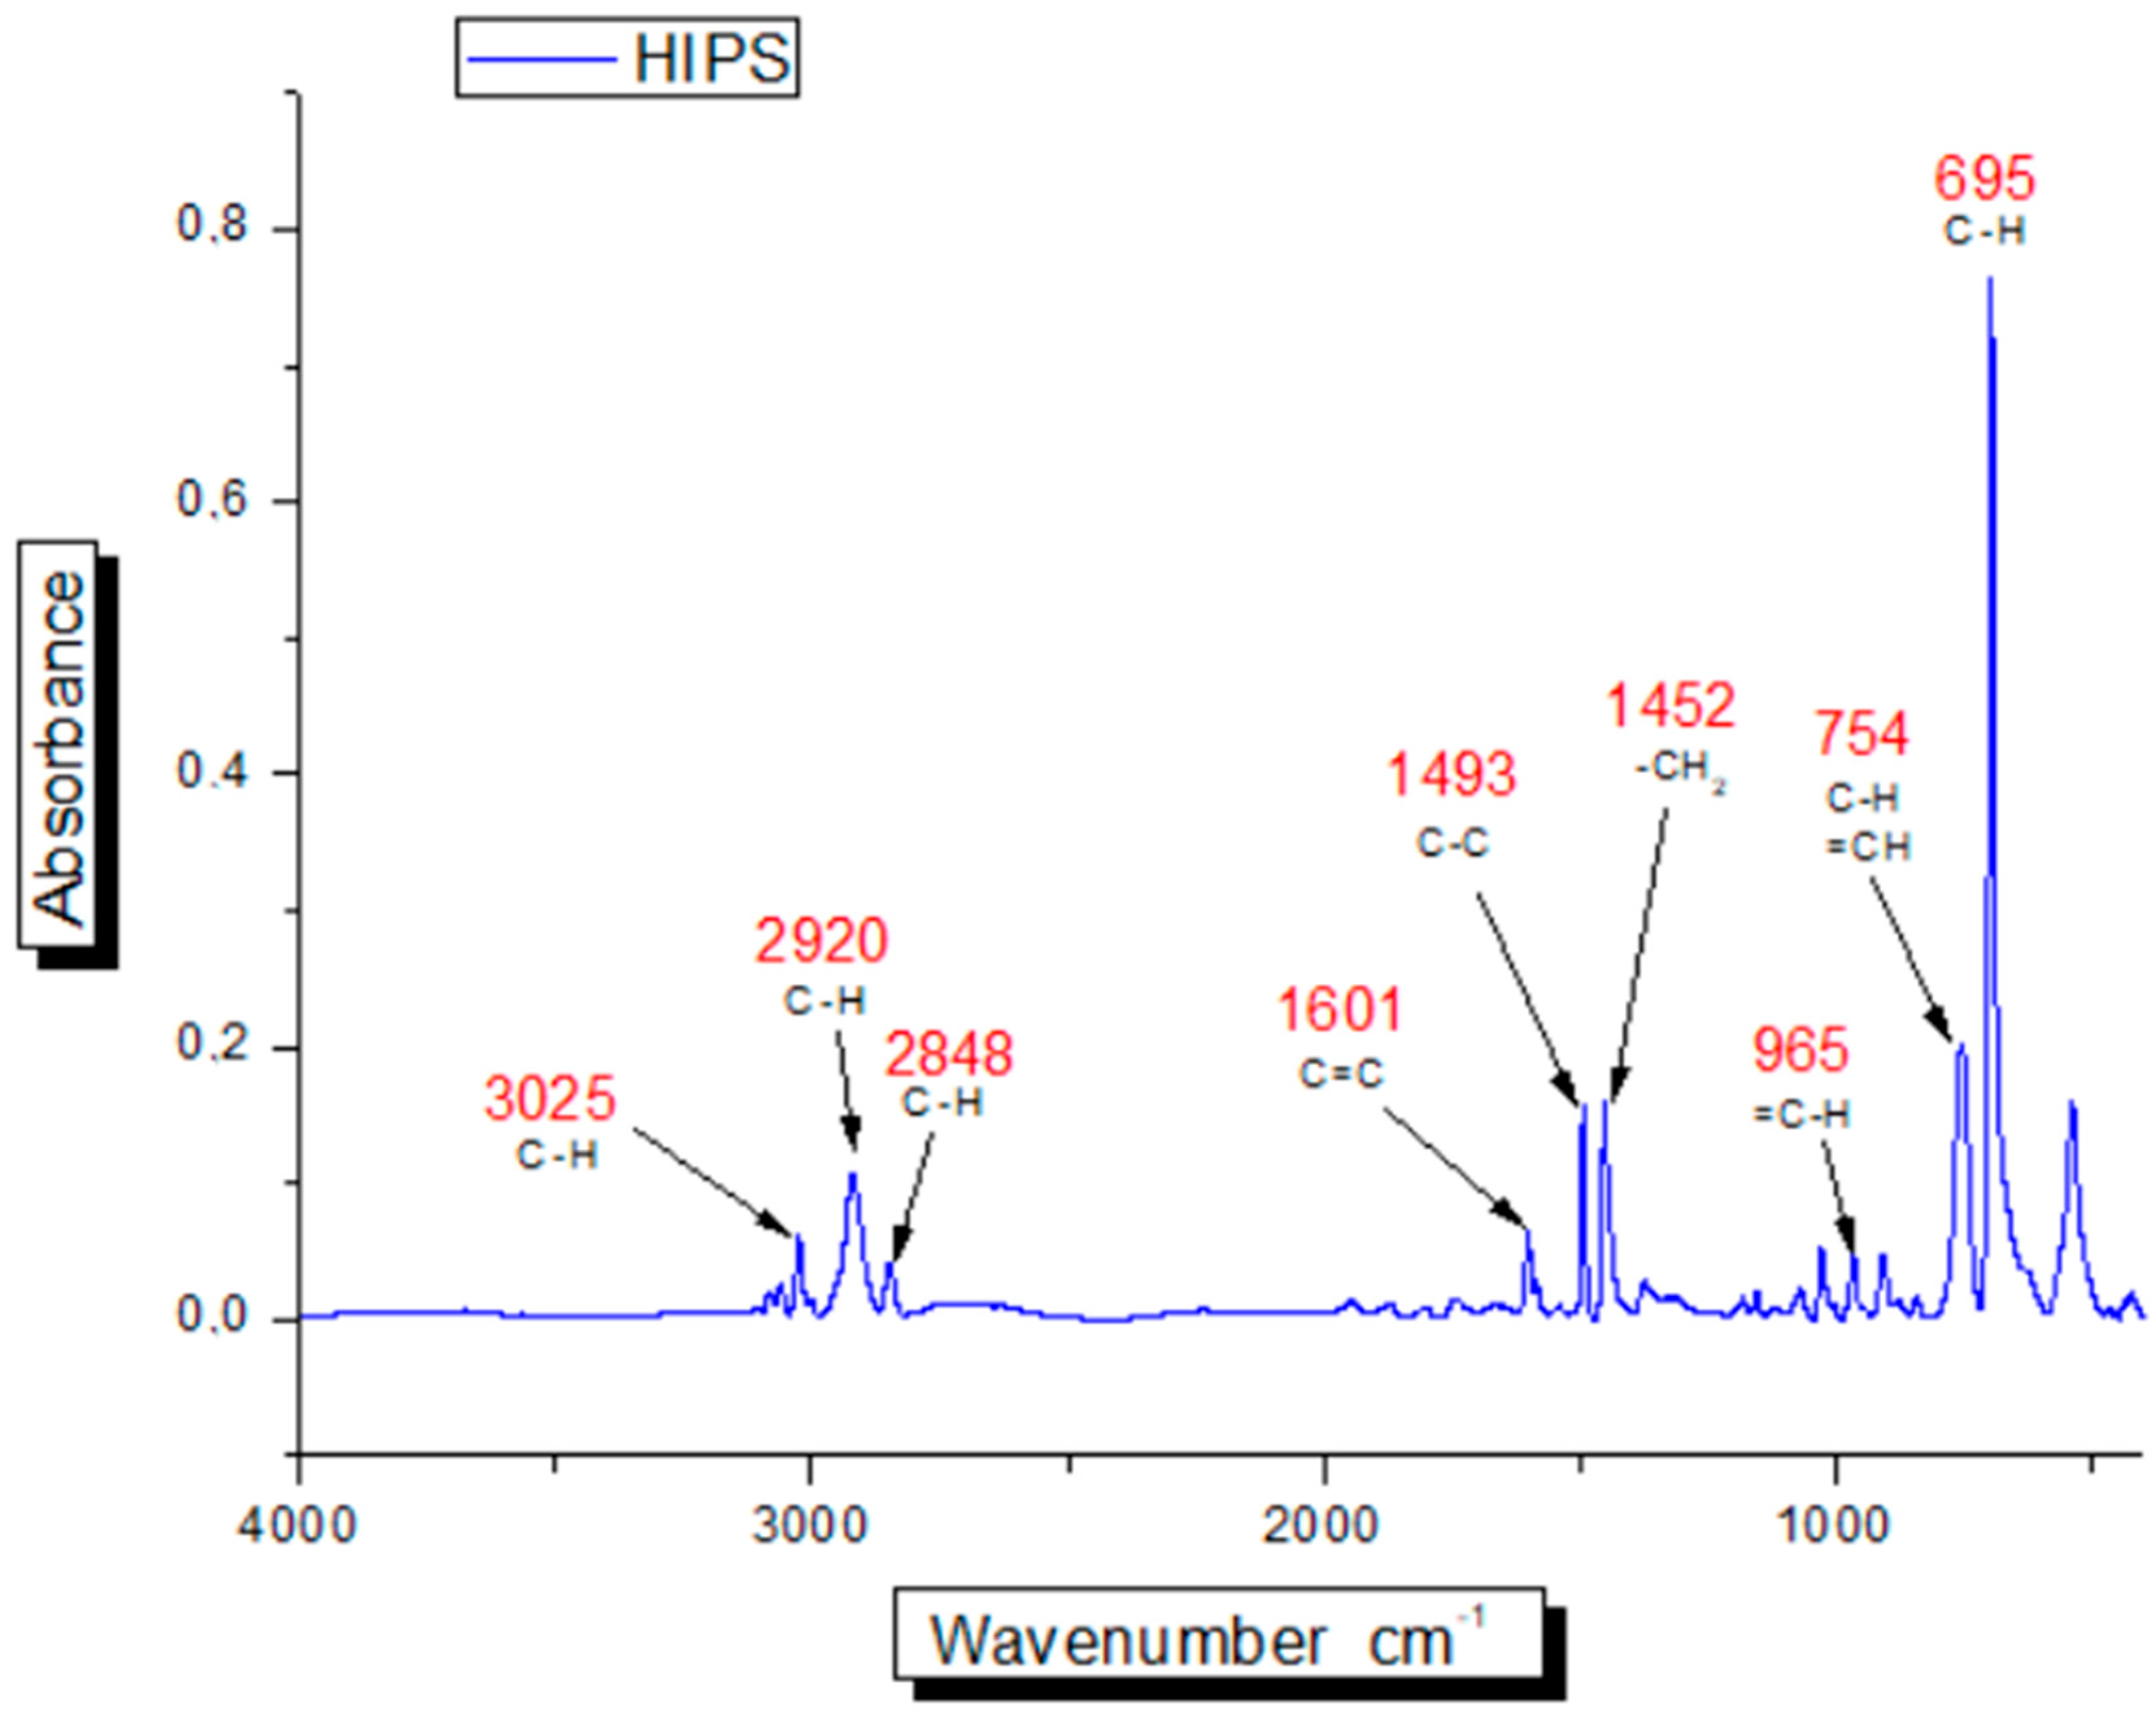
2.3. Identification of HIPS and ABS Using Stationary FTIR Spectrometer

The pre-identified HIPS and ABS flakes were re-analyzed more thoroughly using a stationary FTIR spectrometer (Thermo Scientific, Nicolet iS10). More accurate identification was necessary due to the similar appearance of the IR HIPS and ABS spectra, which negatively affected the correctness of the results obtained after the analysis using the handheld IR spectrometer.

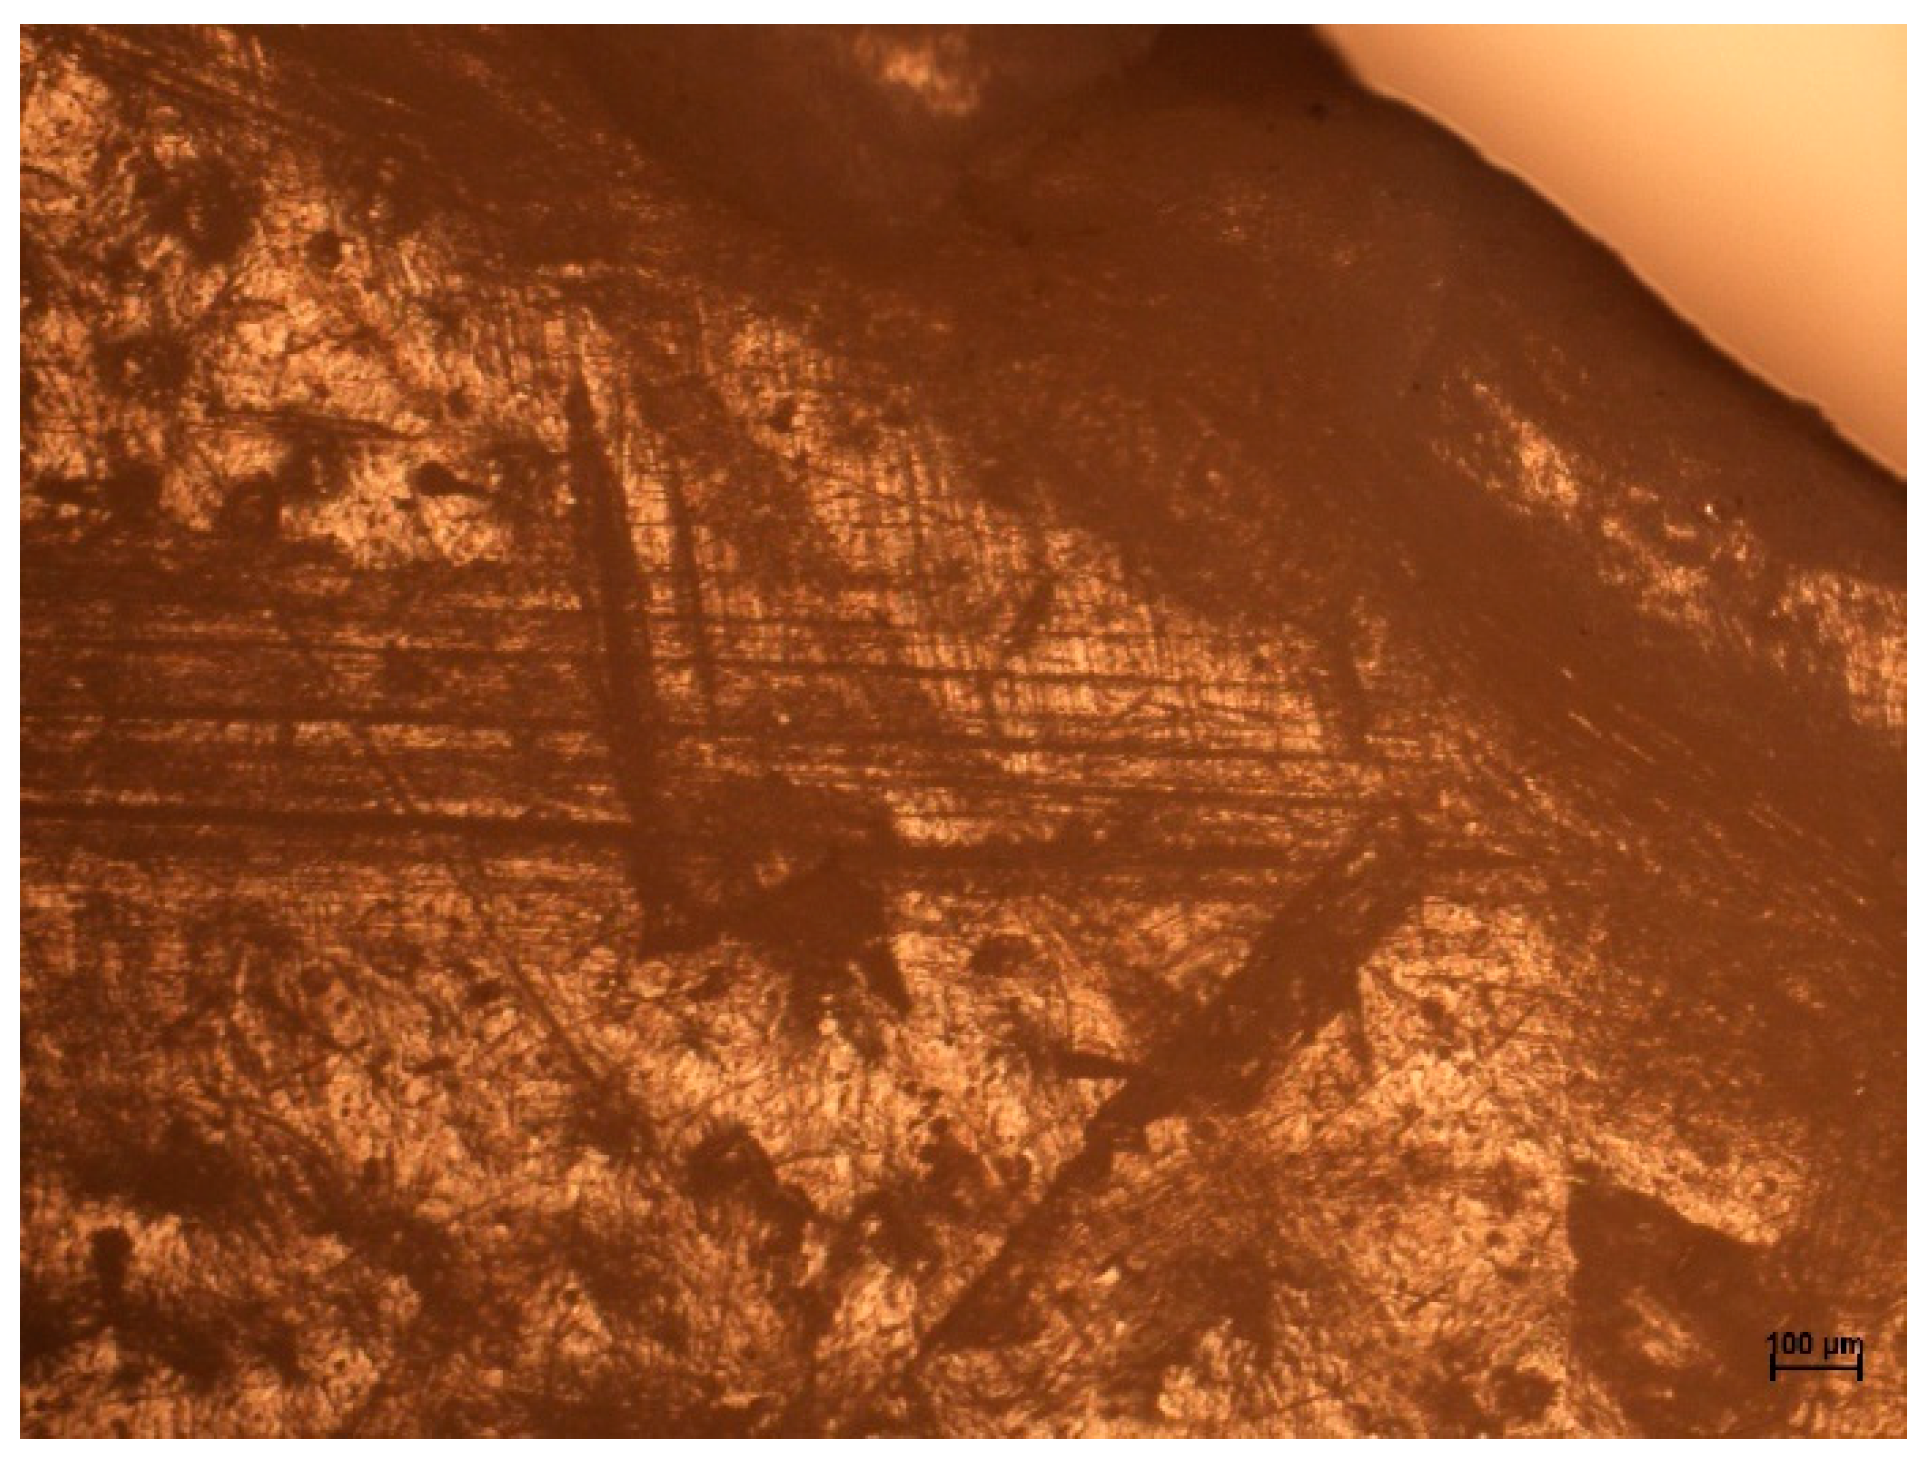
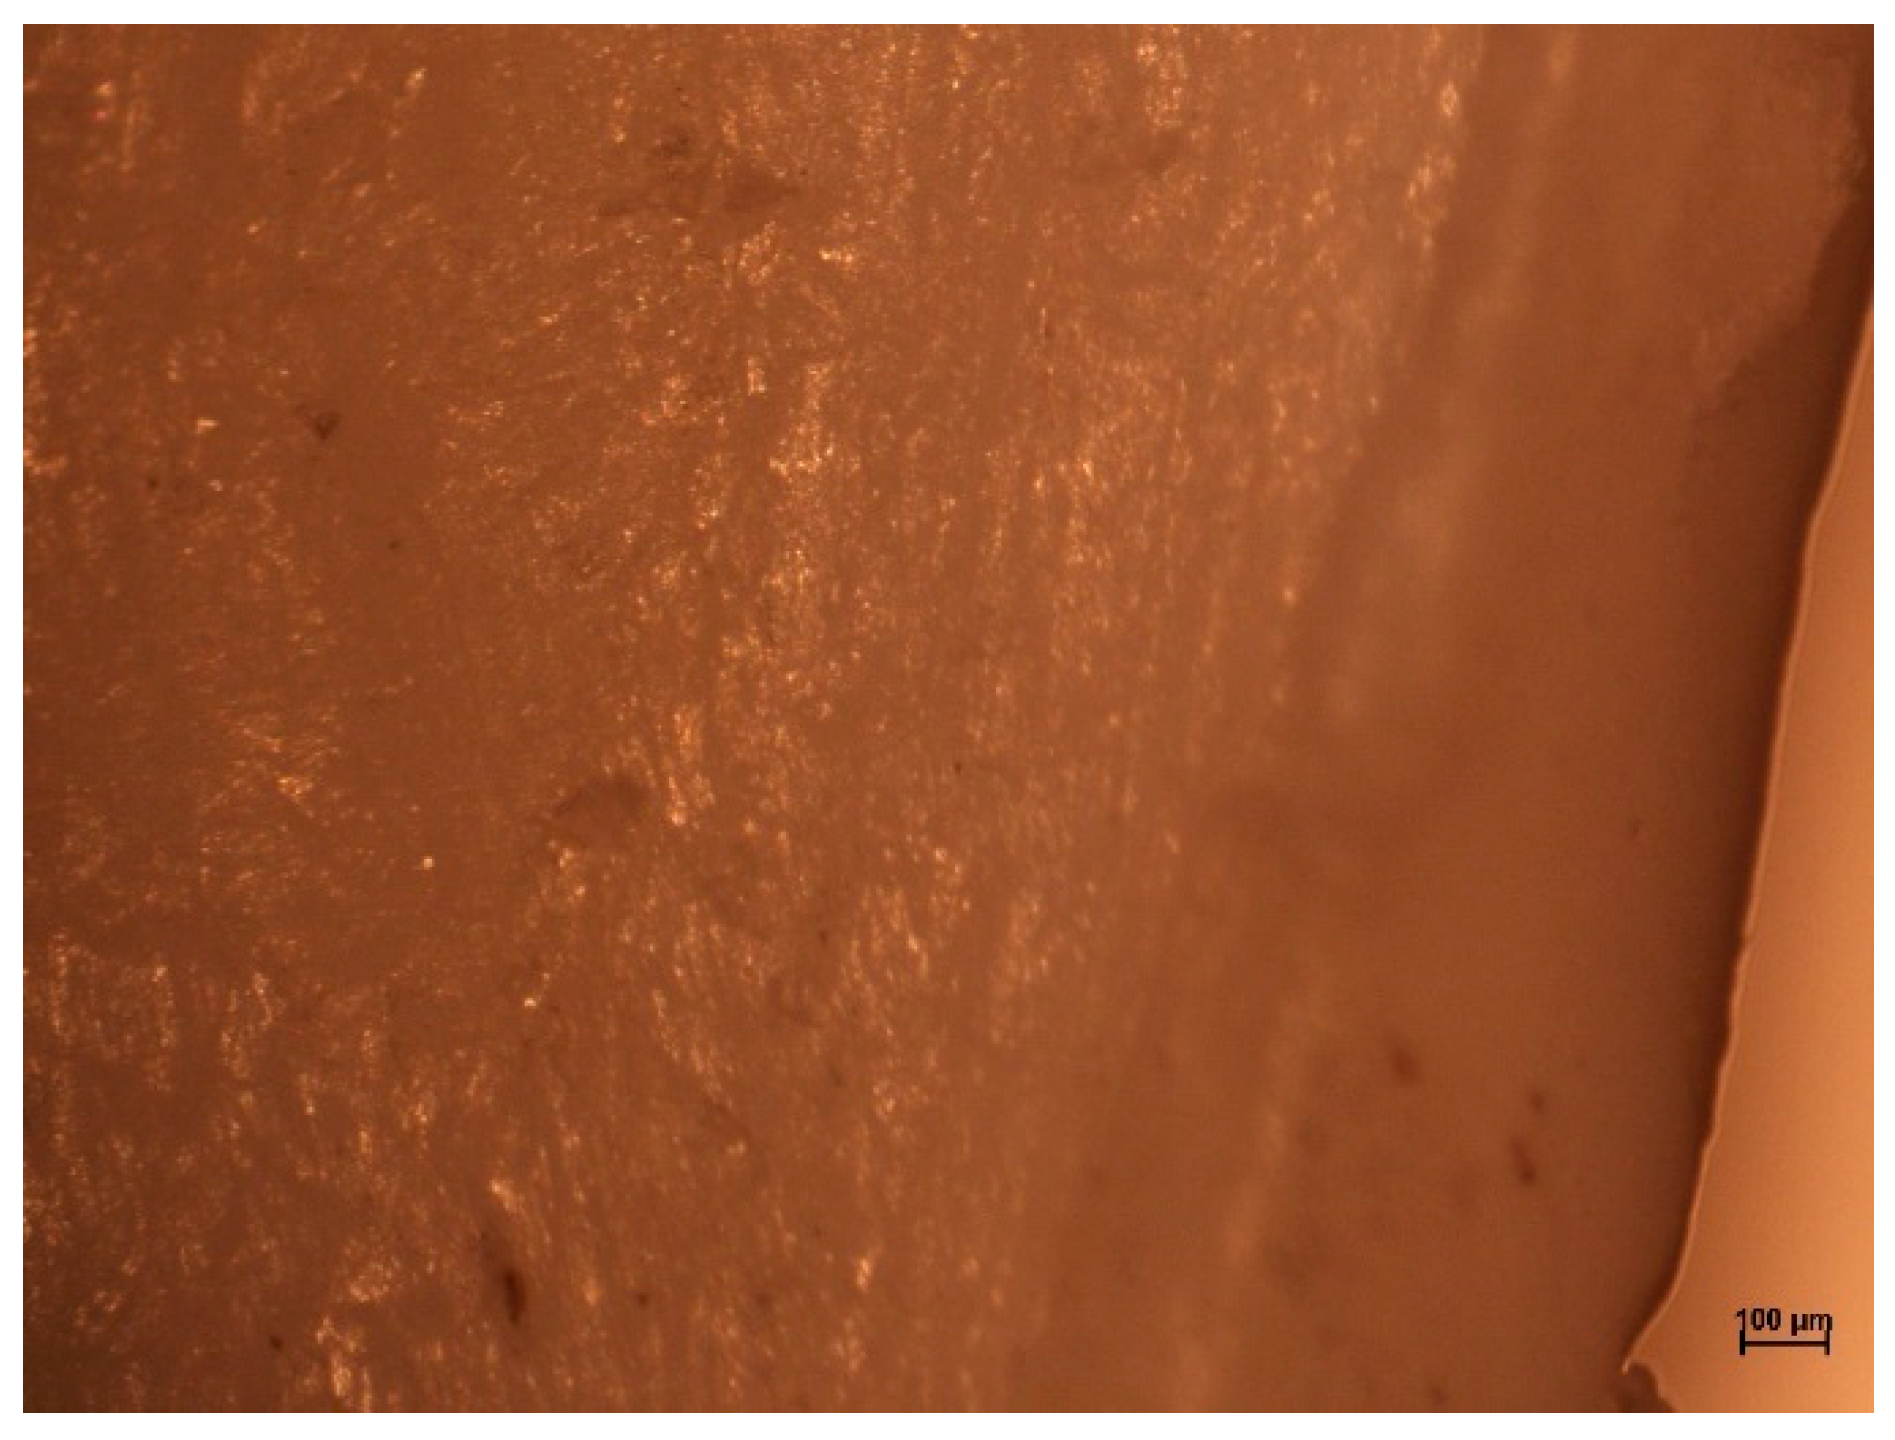
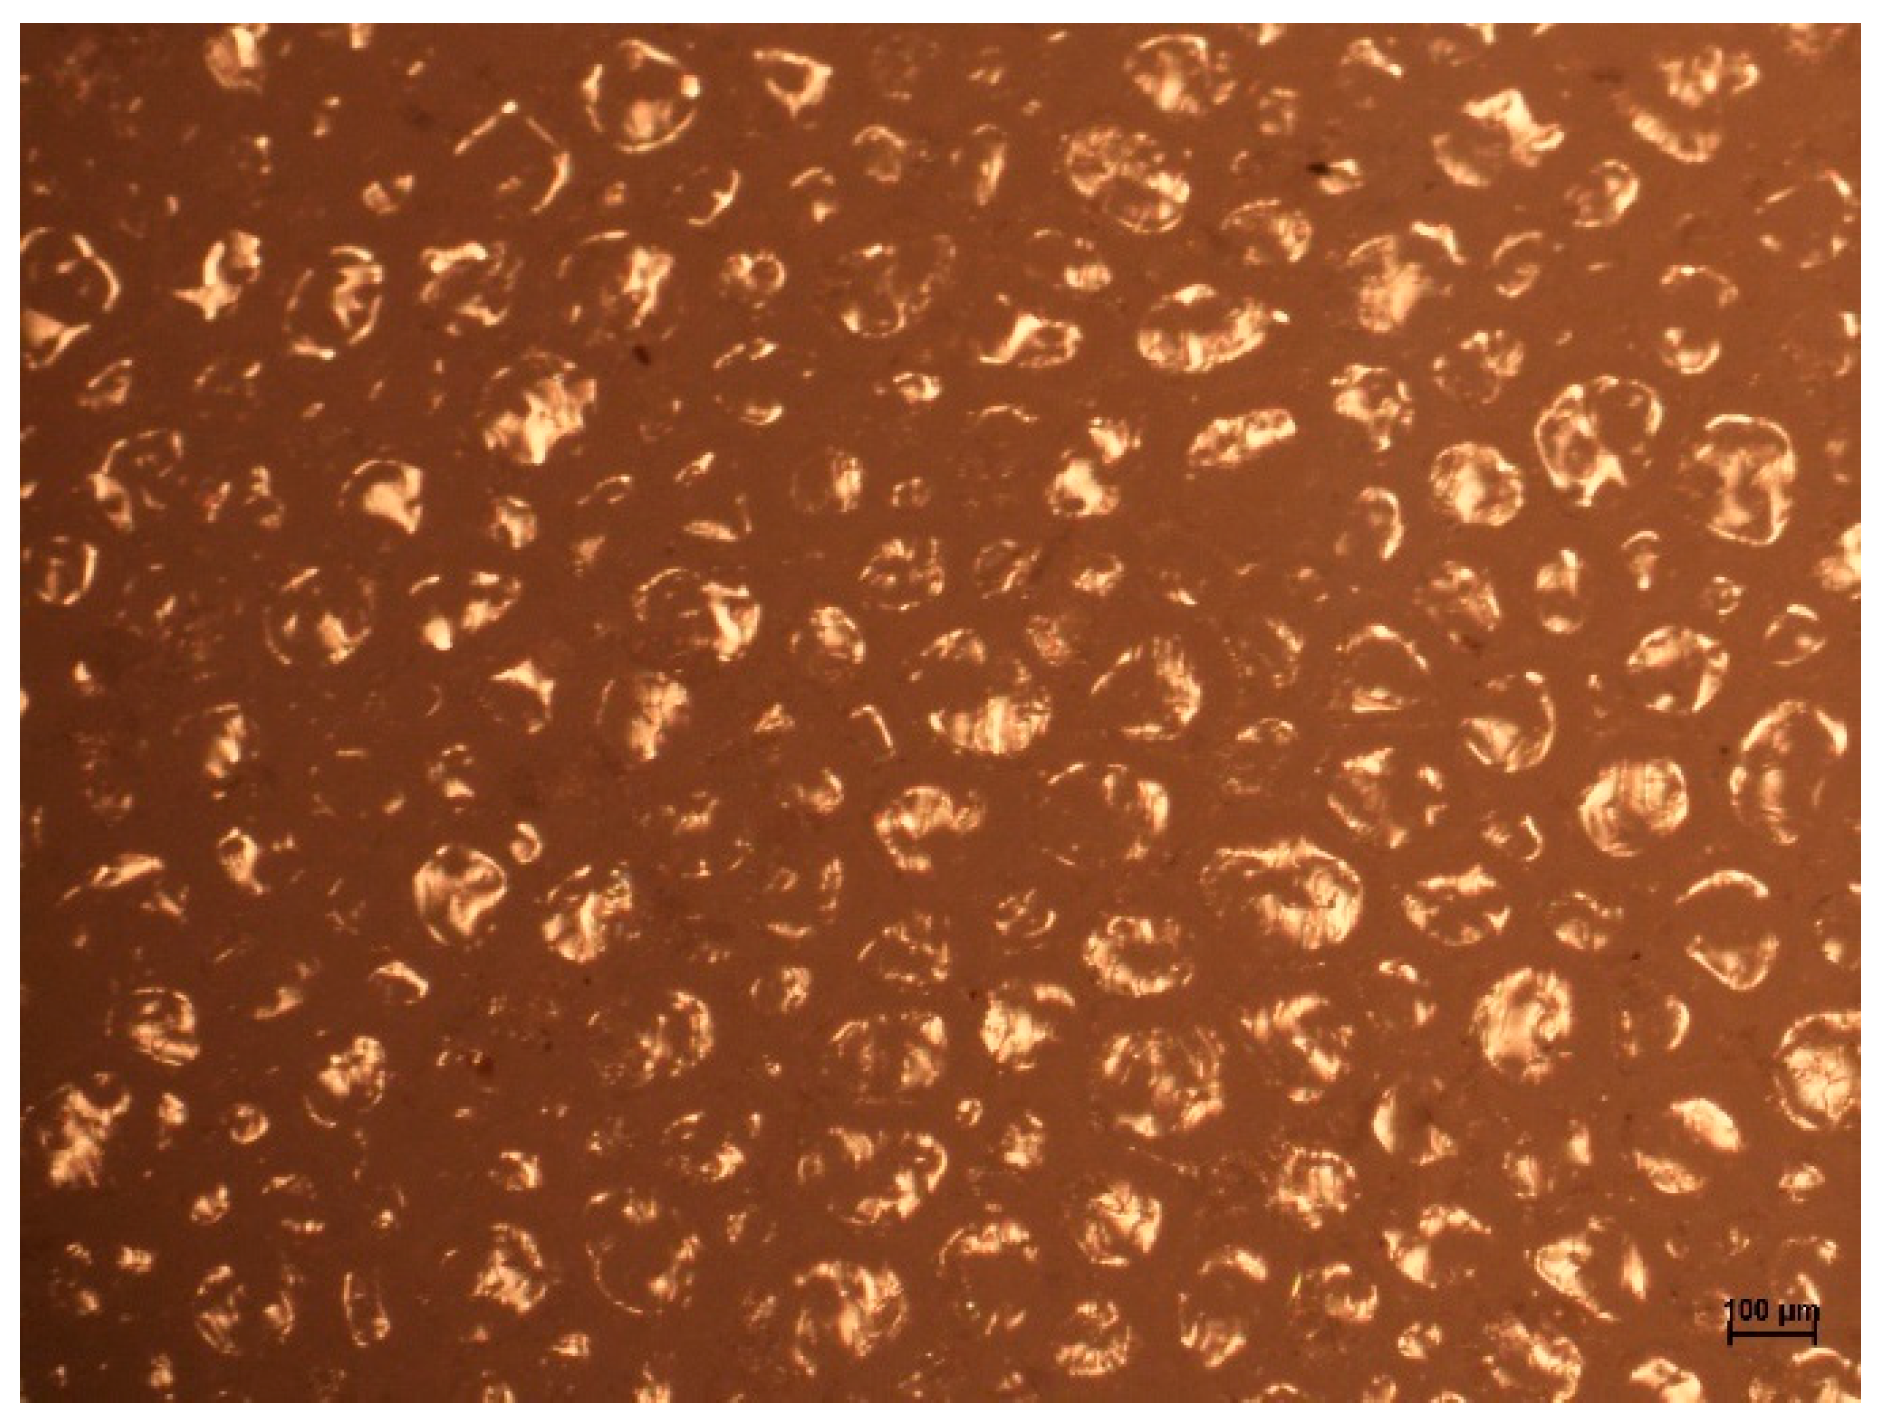
2.4. Optical Microscopy Examinations of HIPS and ABS Flakes

In order to take microscopic images of the surface of plastic flakes, a Nikon MULTIZOOM AZ 100 (Tokyo, Japan) microscope was used, and 40× magnification of the image was applied. The photos were taken in the reflected light mode.

2.5. Testing the Moisture Content of HIPS and ABS Flakes

Moisture content measurement was performed using the moisture analyzer manufactured by RADWAG MA 210.X2.A (RADWAG, Warsaw, Poland) following the gravimetric principle (the moisture level was determined on the basis of the mass loss of the sample during heating). Before carrying out the test, we checked whether there were contaminants on the underside of the aluminum weighing pan. That levelling of the device was checked, and the ambient temperature and humidity level were examined using an EXTECH M029 hygrometer. A moisture content test was carried out under conditions of 19.90 °C and air humidity of 35.50%. After that, the device was started and the displayed drying parameters were set. The interval (time interval between recording measurements) for HIPS was 60 s, and for ABS, 1 s. The heating time lasted 3 min. The heating temperature for HIPS was 80 °C, and for ABS, 88 °C. A manual method of drying for samples sensitive to heat stress (mild profile) was used. This profile was used because in the areas where the material layer is thicker, the top layers of the sample can heat up too much and the inner layers too little, which can lead to burning or crust formation. The resulting crust makes it difficult to dry the bottom layer, which generates measurement errors. Moreover, the surface of plastics tends to heat up quickly. The drying temperatures were selected based on the production standards. Drying was completed manually when little or no change in the sample weight over time was observed. A sample consisting of randomly selected plastic flakes weighing approx. 13–14 g was placed on the pan in the thinnest and most even layer possible. This allowed it to be completely dried in the shortest possible time, leaving no undried areas. Once the sample was ready, drying began and the process was monitored on the device display. The dried samples were removed from the aluminum pan and their surface was immediately analyzed to exclude traces of burning or stickiness. The tests were carried out 5 times for each type of plastic. Moisture content calculations were made according to Formula (1):
W 1 = m 1 m 2 m 1 × 100 % ,
where m1 is the initial sample weight [g] and m2 is the sample weight after drying [g].

2.6. Rheological Examination of MFR and MVR Parameters

In order to carry out the test, a nozzle and a plunger were inserted into a cleaned plastometer (Bagsik XLR 400B, Bagsik, Gliwice, Poland). Using the display and buttons, the test program, ISO:1133 load weight and sample cut-off time were selected, and the appropriate temperature for the polymer was set [22]. After heating the plastometer, the plunger was removed and about 10 g of the previously prepared sample was poured through the funnel, which was in the form of pieces cut to approximately 1 mm. The piston was put back into the hole, and after 2 min, the temperature inside the device stabilized. Weights were applied to the piston (according to the pre-set load) and the test began. We obtained extrusion samples, which were weighed and we identified those whose weight not differed significantly from the mean weight of all samples (outliers). The result of the average weight of the samples was entered into the plastometer. The test results (density of the sample at a given temperature and mass as well as the volumetric melt coefficient) were generated automatically by the plastometer. We used a temperature of 200 °C, a load of 5 kg and no polymer cut-off for PS, and 220 °C, 10 kg and a polymer cut-off time of 5 s for ABS. The tests were carried out 5 times for each type of material.

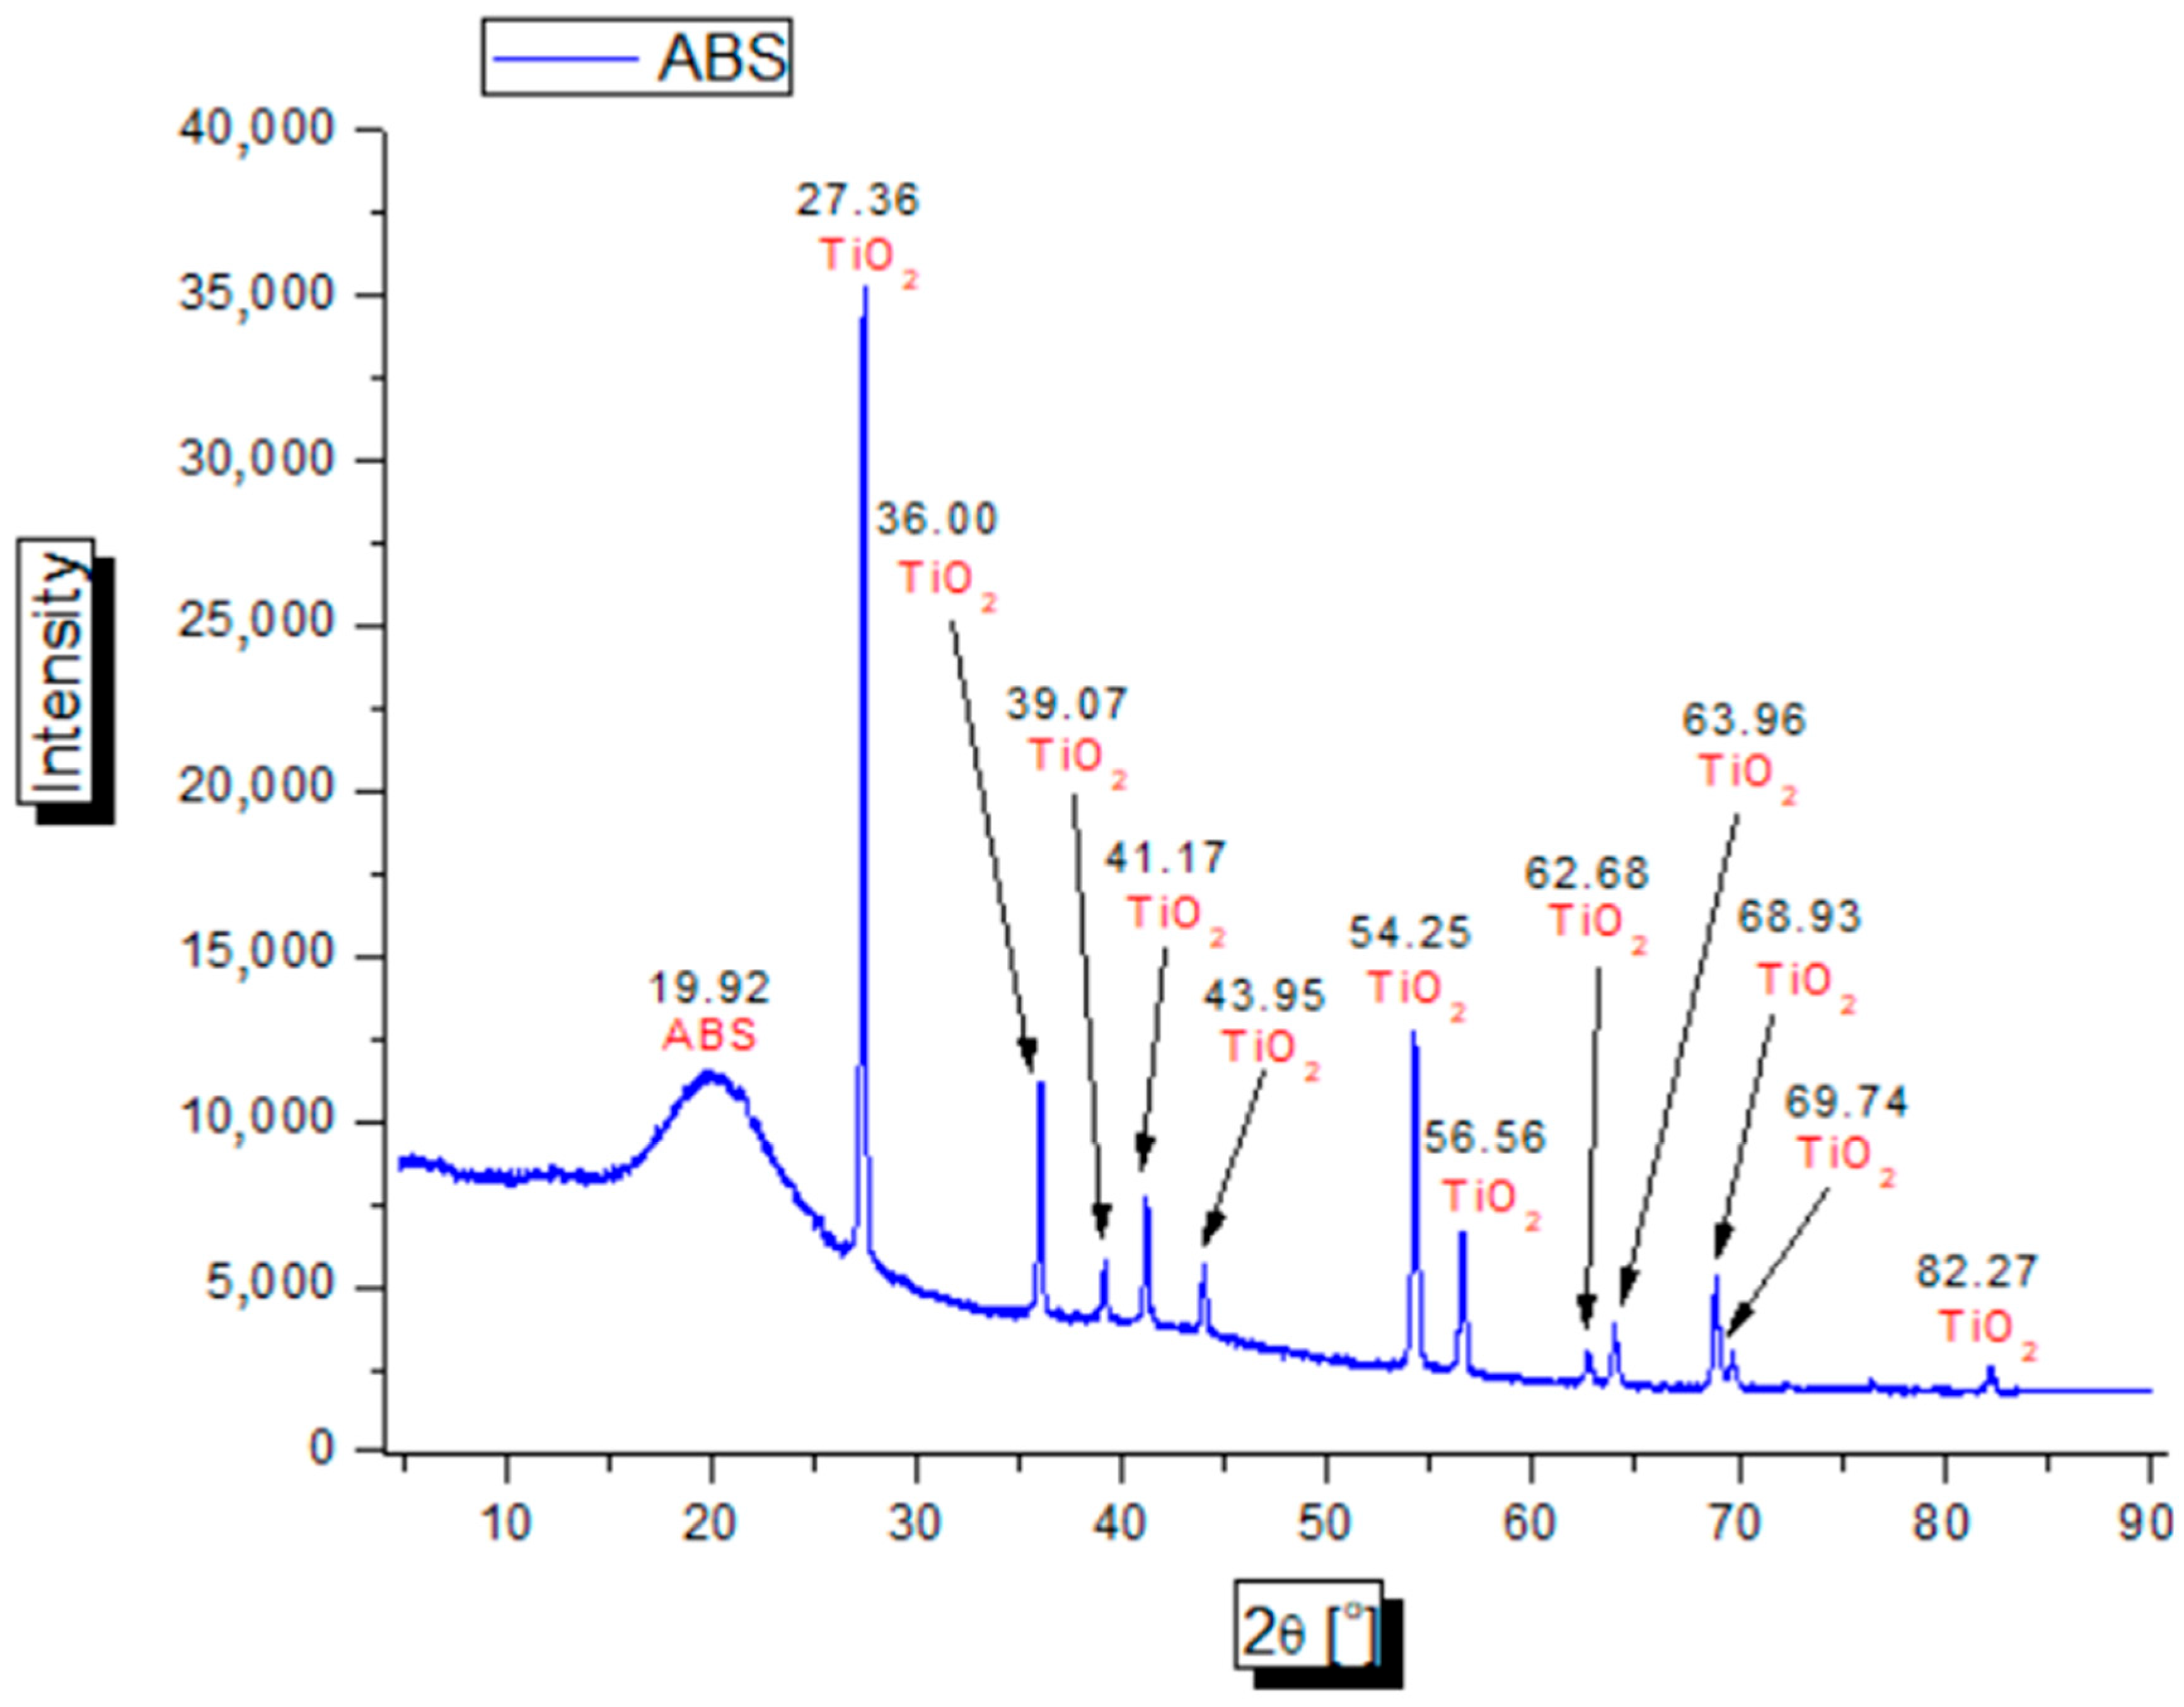
2.7. X-ray Diffraction (XRD) Testing

A surface examination of ABS and HIPS coatings in the form of flakes was performed using an Empyrean X-ray diffractometer manufactured by Malvern Panalytical (Almelo, The Netherlands, year of production: 2012) applying CuKα radiation. Diffractograms were obtained at room temperature, in an angular range of 2θ from 6° to 95°, with a step of 0.02°.

2.8. The Theoretical Number of the Bubbles That Should Attach to the Surface of HIPS and ABS Flakes to Have a Density Lower than That of Tap Water

In order to investigate the theoretical number of air bubbles that should attach to the surface of the plastic so that the bubble–HIPS and bubble–ABS aggregates have a density lower than that of water, we used the following Formula (2) [23]:
φ a = φ p V p ( V p + n V b ) ,
where φa is the density of the bubble–particle aggregate [g/cm3], φp is the density of the plastic particle [g/cm3], Vp is the volume of the plastic particle [g/cm3], Vb is the volume of each bubble [g/cm3], and n is the number of bubbles attaching to the particle surface [pcs.].
In order to carry out the test, 4 samples composed of 100 pieces of HIPS plastic and 4 samples including 100 pieces of ABS plastic were prepared due to their size (<2.5 mm, 2.5–4 mm, 4–8 mm and >8 mm). Then, each flake was weighed using a RADWAG MA 210.X2.A balance with an accuracy of 3 decimal points. Then, the average of all outcomes was calculated. The next step was to investigate the average density of HIPS and ABS flakes. For this purpose, a RADWAG solid density test kit (model AS 220/C/2) was applied. The obtained results were substituted into the formula for the theoretical density of the bubble–particle aggregates.

2.9. Scanning Electron Microscope (SEM) Surface Analysis

The surface morphology of the remaining samples was studied using a Quanta™ 3D FEG SCANNING ELECTRON MICROSCOPE (FEI) equipped with a field-emission electron cannon (FEG) and an Everhart–Thornley detector (EDT), which is a secondary electron detector (SED). The images were taken at a pressure of about 2 × 10⁻⁴ Pa in high-vacuum mode with a sputtered conductive coating of Au/Pd. The other parameters of the experiment, such as beam acceleration voltage and magnification, are shown in the legends for the individual SEM images.

2.10. Optical Profilometry

To study the samples’ topography, i.e., to obtain height maps and calculate the surface roughness parameters, a ContourGT-K1 3D Optical Profiler (Bruker) was used, allowing for non-contact analysis. The sampling area was 1261 μm × 946 μm, which was approximately equivalent to that occupied by the 6 μL droplet used for contact angle measurements. The tests were carried out with a 5× lens with a FOV 1× converter (lens), using the VXI technique, which is a combination of the VSI and PSI modes. The green light from the LED source was used. The results were compiled using the included Vision64® software version 5.41.

2.11. Examination of HIPS and ABS Contact Angles by the Sessile Drop Method

On the correctly identified HIPS and ABS flakes, a wettability test was carried out using the sessile drop method. For this purpose, 15 solutions of tap water (taken in PKR) from SLES were made. To measure the contact angles, the contact angle meter (GBX, Rhône-Alpes, France) was used. A drop was placed on the plastic surface and, with the help of VisionDrop, its angle was measured by repeating the action 20 times for each solution and for each plastic. Next, the average results and their standard deviations were calculated.

3. Results

3.1. Pre-Identification of HIPS and ABS with the Handheld NIR Spectrometer

Testing the sample with the handheld NIR spectrometer revealed the presence of the following plastics in the sample: PS, ABS, PP and PA (Figure 3). PP and PA were not used for further studies.
A mass analysis was performed for the examined sample, and its results are presented in Table 1.
The majority of the sample included HIPS flakes, the percentage of which was 57.44%. The ABS content was 39.24%. The sample contained small amounts of PP and PA (2.75% and 0.57%, respectively). In the paper [24], large cooling devices consisted of 76% PS, 8% PP, 6% ABS and 4% PVC. These differences in composition may be due to the lack of repeatability of the refrigeration equipment being processed (different manufacturers).
In the study [1], PS and ABS of different colors were used to make it easier to distinguish them. The use of single-colored plastics, e.g., white PS and black ABS, has a negative impact on sample differentiation. In papers [1,2,3,4], the mass ratio of the analyzed plastics was 1:1, which did not translate into the real composition of the refrigerator, in which PS was the most abundant.

3.2. Identification of HIPS and ABS Using Stationary FTIR Spectrometer

Figure 4 shows the FTIR analysis for ABS and HIPS plastics. The peaks located at 697 cm−1, 758 cm−1, 2849 cm−1, 2920 cm−1 and 3027 cm−1 correspond to a single bond between carbon and hydrogen (C-H). The band wavelength at 1494 cm−1 corresponds to single bonds between two carbon atoms (C-C). A characteristic bond can be distinguished between carbon and nitrogen (2237 cm−1). Vibrations of the methyl group are visible at a frequency of 1452 cm−1. The peaks observed at 1602 cm−1 and 1637 cm−1 correspond to the double bond between two carbon atoms (C=C). Vibrations of the C=O groups are visible at approximately 1732 cm−1. The spectrum shows vibrations at wavelengths of 758 cm−1 and 966 cm−1, corresponding to those of the =C-H group [16,25,26].
Figure 5 shows the FTIR analysis for the HIPS plastic. The peaks observed at 695 cm−1, 754 cm−1, 2848 cm−1, 2920 cm−1 and 3025 cm−1 correspond to the single bond between carbon hydrogen atoms (C-H). Vibrations of the methyl group (-CH2) are visible at a frequency of 1452 cm−1. The peaks located at 754 cm−1 and 965 cm−1 correspond to the double bond of carbon (=C-H). Vibrations of the C=C groups are visible at approximately 1601 cm−1. The spectrum shows vibrations at a wavelength of 1493 cm−1, corresponding to those of the C-C bond [16,25,26].
Most of the peaks of the HIPS and ABS spectra overlap. Unambiguous identification is made on the basis of the presence (it is an ABS flake) or the absence (it is a HIPS flake) of a peak around a spectrum length of 2237 cm−1.

3.3. Optical Microscopy Examinations of HIPS and ABS Flakes

Figure 6, Figure 7, Figure 8 and Figure 9 show the microscopic images of the HIPS and ABS surfaces.
The microscopic images show uneven surfaces of the examined plastics, e.g., scratches and indentations, as a result of the grinding process of refrigerators from which the polymers for this research were obtained. We see no influence on the quality of polymer tiles obtained in this process. This can affect the results of the contact angles and thus their standard deviations. However, surface rolling can have a positive effect on the flotation process.

3.4. Testing the Moisture Content of HIPS and ABS Flakes

Table 2 and Table 3 present the results of the moisture content test for the HIPS and ABS samples.
The average moisture content for HIPS flakes was 0.081%, and for ABS flakes, 0.167%. The standard deviation for the HIPS result is 0.015%, and for the ABS result, 0.024%. The moisture content of ABS is larger than that of HIPS due to the fact that ABS is characterized by hygroscopic properties [27]. It should be noted that the moisture content in the plastic depends largely on the prevailing environmental conditions. The heavier the sample, the longer the time it took to dry it to a constant weight. In addition, the samples were not sticky or burnt after the drying process.

3.5. Rheological Examination of MFR and MVR Parameters

The results of the flow measurements for HIPS and ABS are presented in Table 4 and Table 5.
The average values of MFR, MVR and density for HIPS at the given temperature (200 °C) were 3.83 g/10 min, 3.88 cm3/10 min and 0.99 g/cm3, respectively. The standard deviations for the HIPS results were as follows: MFR—0.44 g/10 min, MVR—0.43 cm3/10 min and density—0.01 g/cm3.
The average values of MFR, MVR and density for ABS at the given temperature (220 °C) were 31.73 g/10 min, 31.25 cm3/10 min and 1.02 g/cm3, respectively. The standard deviations for the ABS results were as follows: MFR—1.20 g/10 min, MVR—1.77 cm3/10 min and density—0.02 g/cm3.
According to the paper [28], the MFI value for ABS was 35.40 g/10 min, and for HIPS, it was 4.90 g/10 min. The same test parameters as in this research were used for the materials (for ABS, 220 °C/10 kg, and for PS, 200 °C/5 kg). The materials were obtained from post-consumption electronic devices. The values obtained in this study are lower, but the relationship is the same—HIPS has a lower MFI than ABS.
The obtained average MFR and MVR results indicate that HIPS and ABS from the recycled refrigerators and fridge–freezers are recyclable.

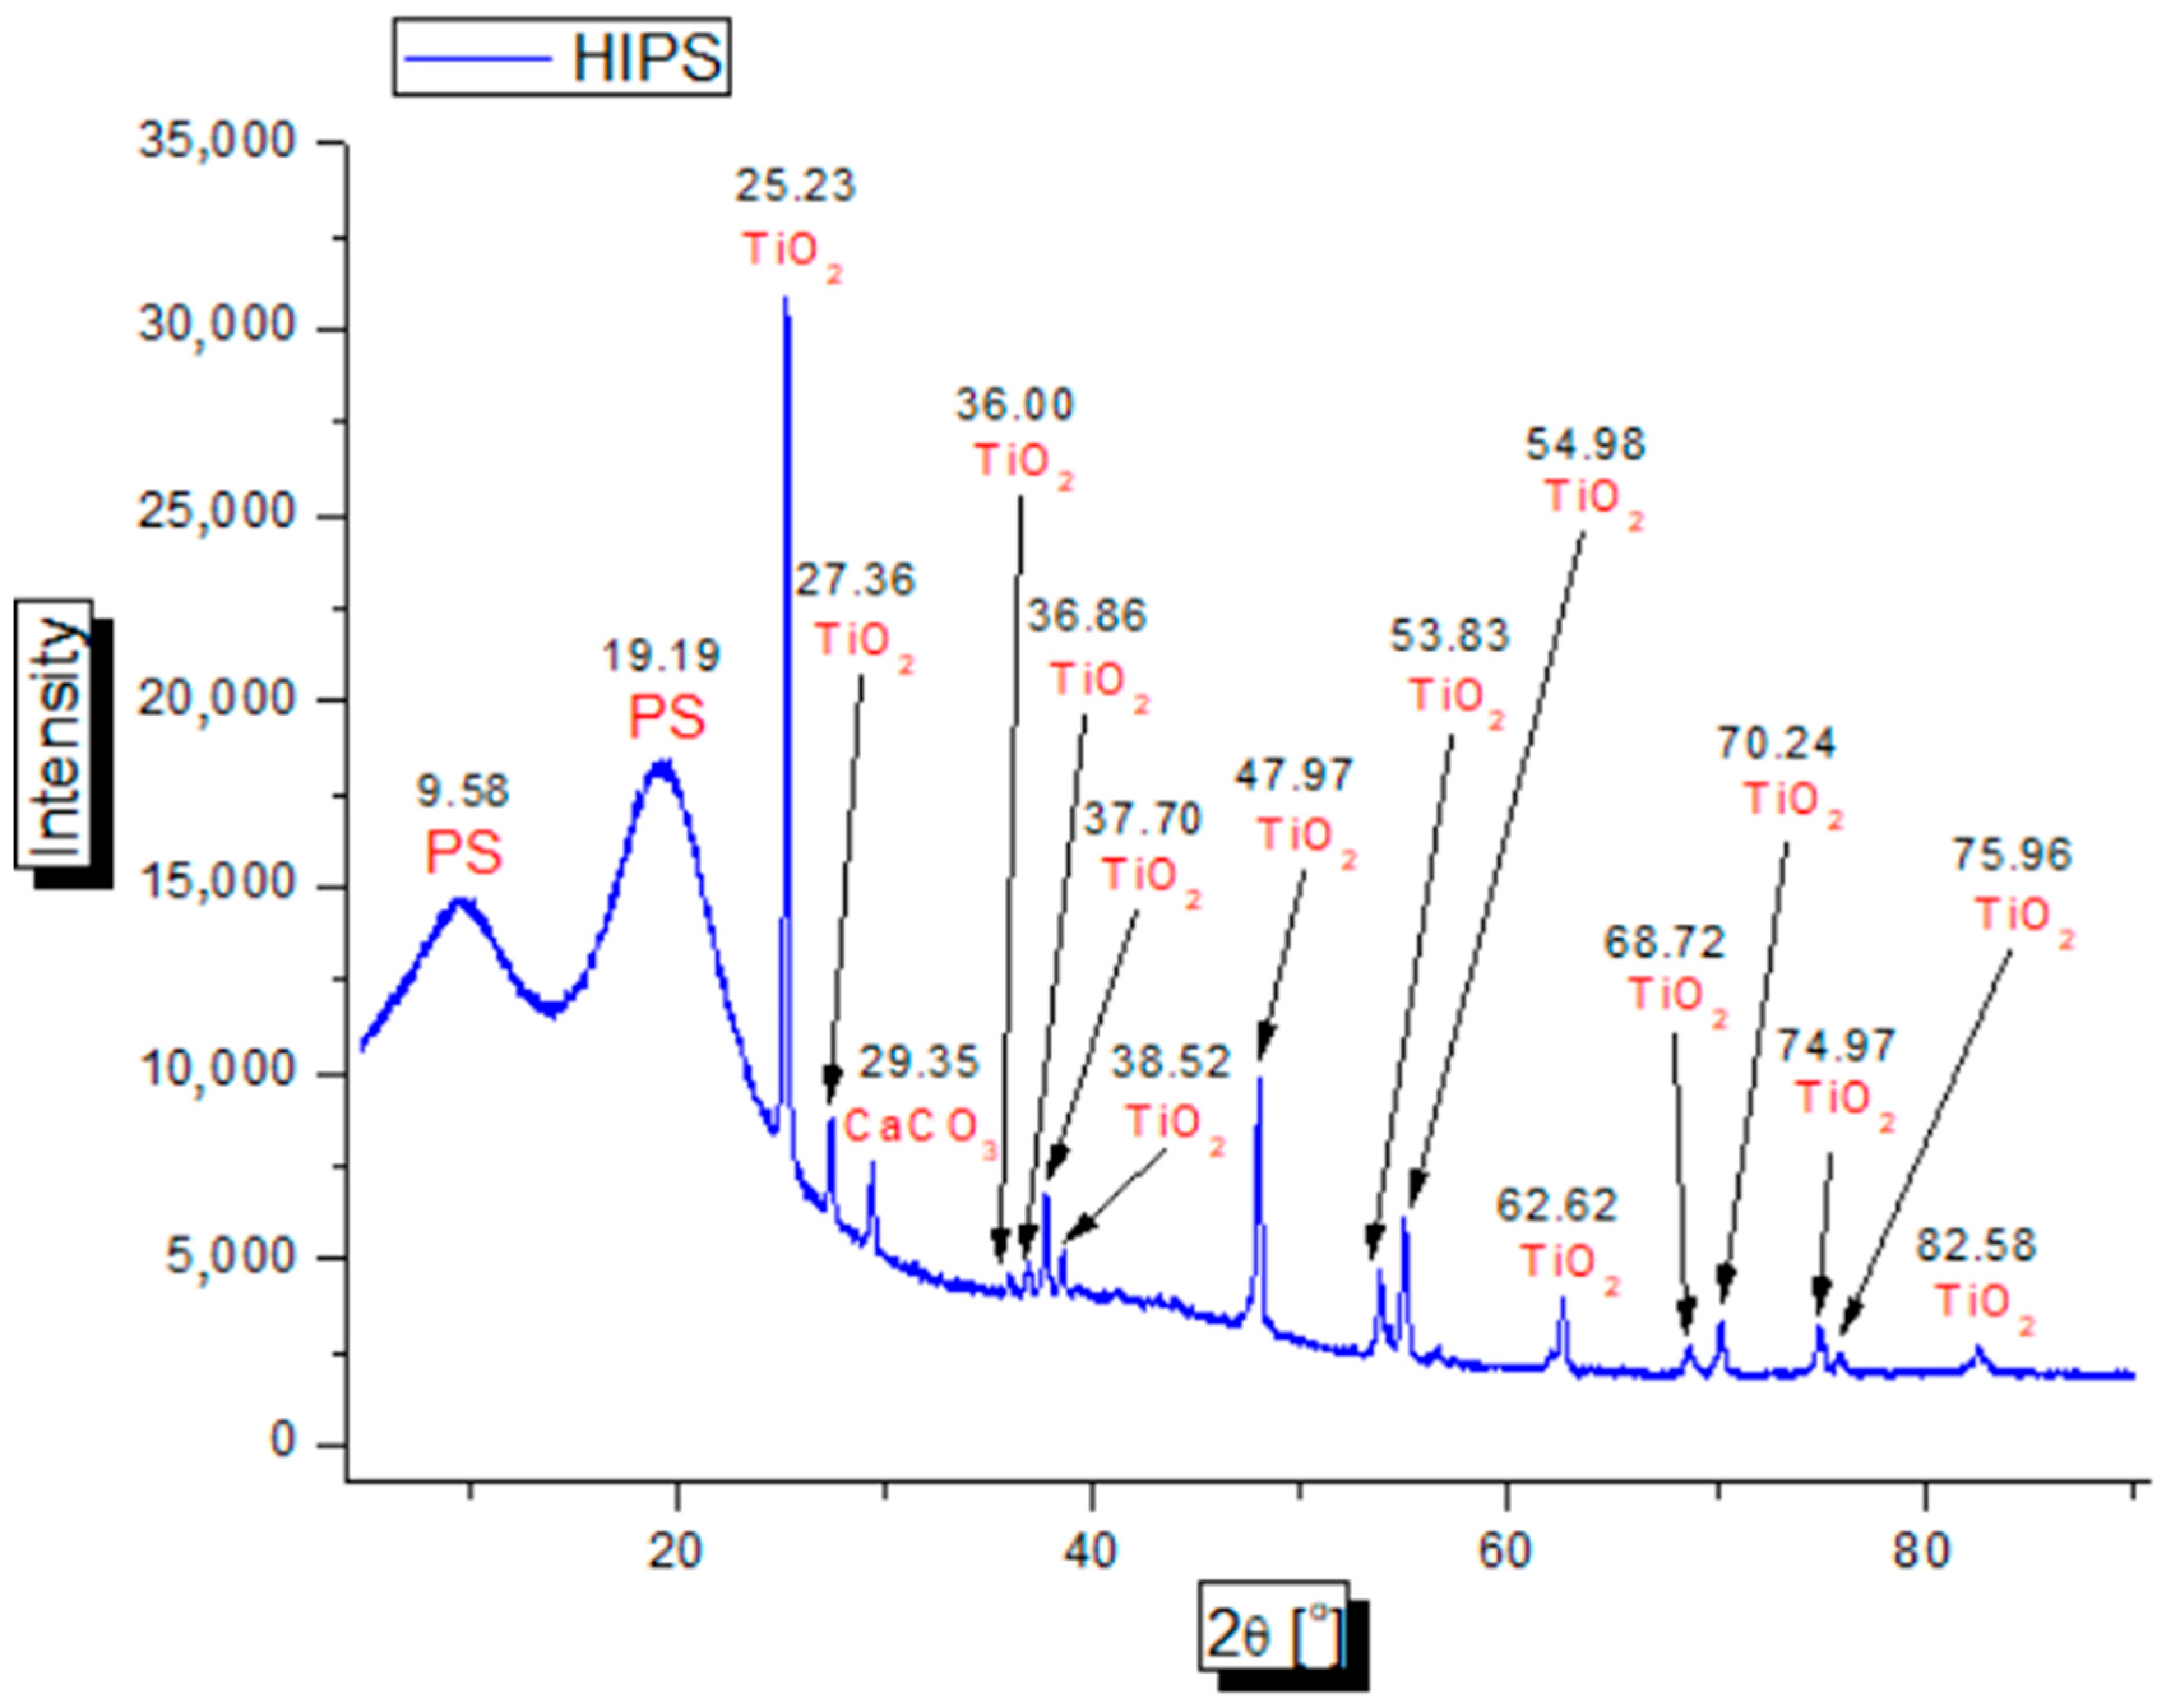
3.6. Study of X-ray Diffraction (XRD)

Figure 10 shows the XRD spectrum for ABS. This material has a characteristic peak of around 19.92 degrees. The appearance of this peak indicates that it is an amorphous material [29]. In the tested sample, there was an additive in the form of titanium oxide (peaks 27.36°, 36.00°, 39.07°, 41.17°, 43.95°, 54.25°, 56.56°, 62.68°, 63.96°, 68.93°, 69.74°, 82.27°), which is used in dyes applied in polymers [29,30,31,32,33].
Figure 11 presents the XRD spectrum of plastic PS. The XRD spectrum of polystyrene has two characteristic peaks (9.58° and 19.19°). Polystyrene is also an amorphous material; hence, the specific appearance of peaks is observed. In the spectrum for polystyrene, a peak for titanium oxide, also derived from the addition of dye (36.00°, 39.07°, 41.17°, 43.95°, 54.25°, 56.56°, 62.68°, 63.96°, 68.93°, 69.74°, 82.27°), and a peak derived from calcium carbonate (29.35°) were observed [29,30,31,32,34,35,36].

3.7. The Theoretical Number of the Bubbles That Should Attach to the Surface of HIPS and ABS Flakes to Have a Density Lower than That of Tap Water

Table 6 presents the selected research results along with the calculated averages for the obtained results. The standard deviation for >8 mm HIPS flakes is 0.104 g, for >8 mm ABS flakes is 0.295 g, for 4–8 mm HIPS is 0.084 g and for 4–8 mm ABS is 0.034 g.
The results of the density test for the HIPS and ABS flakes are presented in Table 7.
The density of the HIPS flakes is lower by approximately 30 g/dm3 than that of ABS. This may be due to the additives. All flakes have a density higher than that of demineralized water. The standard deviation for HIPS density is 0.014 g/cm3 and for ABS density is 0.028 g/cm3. In the paper [3], the densities of ABS and HIPS are 1.045 and 1.034 g/cm3, respectively. In the study [4], the ABS and PS samples have average densities of 1.050 g/cm3 and 1.040 g/cm3. The differences in densities are in the second decimal place and may be due to the differences in the materials used for the studies. The PS and ABS in papers [1,2,3,4] were obtained from WEEE, and the HIPS and ABS used in this study are from waste refrigeration equipment. Even if in all cases these plastics came from used refrigerators, the differences in the manufacturers, years of manufacture and used additives may be the reason for differences in densities. It can be noticed that is ABS has a density lower than that of PS in each of these studies.
The results of the theoretical number of the bubbles that should attach to the surface of HIPS and ABS flakes to have a density smaller than that of tap water are presented in Table 8.
The theoretical number of air bubbles that should attach to the surface of an ABS flake larger than 8 mm to have a density greater than that of water was 19. For a HIPS flake larger than 8 mm, the value was 10. For HIPS and ABS flakes with a size of 4 to 8 mm, the size was 4. For the remaining HIPS and ABS flakes, only one air bubble would cause these flakes to float on the surface of water.
In the paper [23], the theoretical numbers of air bubbles needed to float PS in water were as follows: for a flake size from 4.0 mm to 5.6 mm—five, from 2.8 mm to 4.0 mm—three and for 1.0–2.8 mm—one. Calculations were not made for ABS flakes. The relationship is as follows—the smaller the size of the material, the fewer air bubbles are needed for the material to have a density lower than that of water. In this research, for a material with a size of 4–8 mm, one less air bubble was needed in order for the material to be less dense than water.

3.8. Scanning Electron Microscopy (SEM) Surface Analysis

When analyzing the surface mapping of polymers obtained by the SEM technique (Figure 12), it should be stated that they have a rougher surface compared to the types of polymers used for research by the other scientists, including Vidakakis et al. [37], who studied HIPS with different fillers to increase strength. On the crushed SEM representations of the base plate, it can be seen that it is much smoother than the materials examined in this manuscript, while the addition of the filler increases the roughness. It should be remembered that the mappings presented in Figure 12 represent a very small surface area; however, we can draw the conclusion that the surface of the polymers corresponds to the surface characteristic of filler materials [38], and the presence of fillers was determined by XRD testing (Figure 10 and Figure 11). The roughness distribution shown in Figure 12C can be called a typical two-phase distribution where the filler particles are dispersed in the PS matrix [39]. The visible longitudinal scratches in Figure 12A,B,D,E were created as a result of milling.

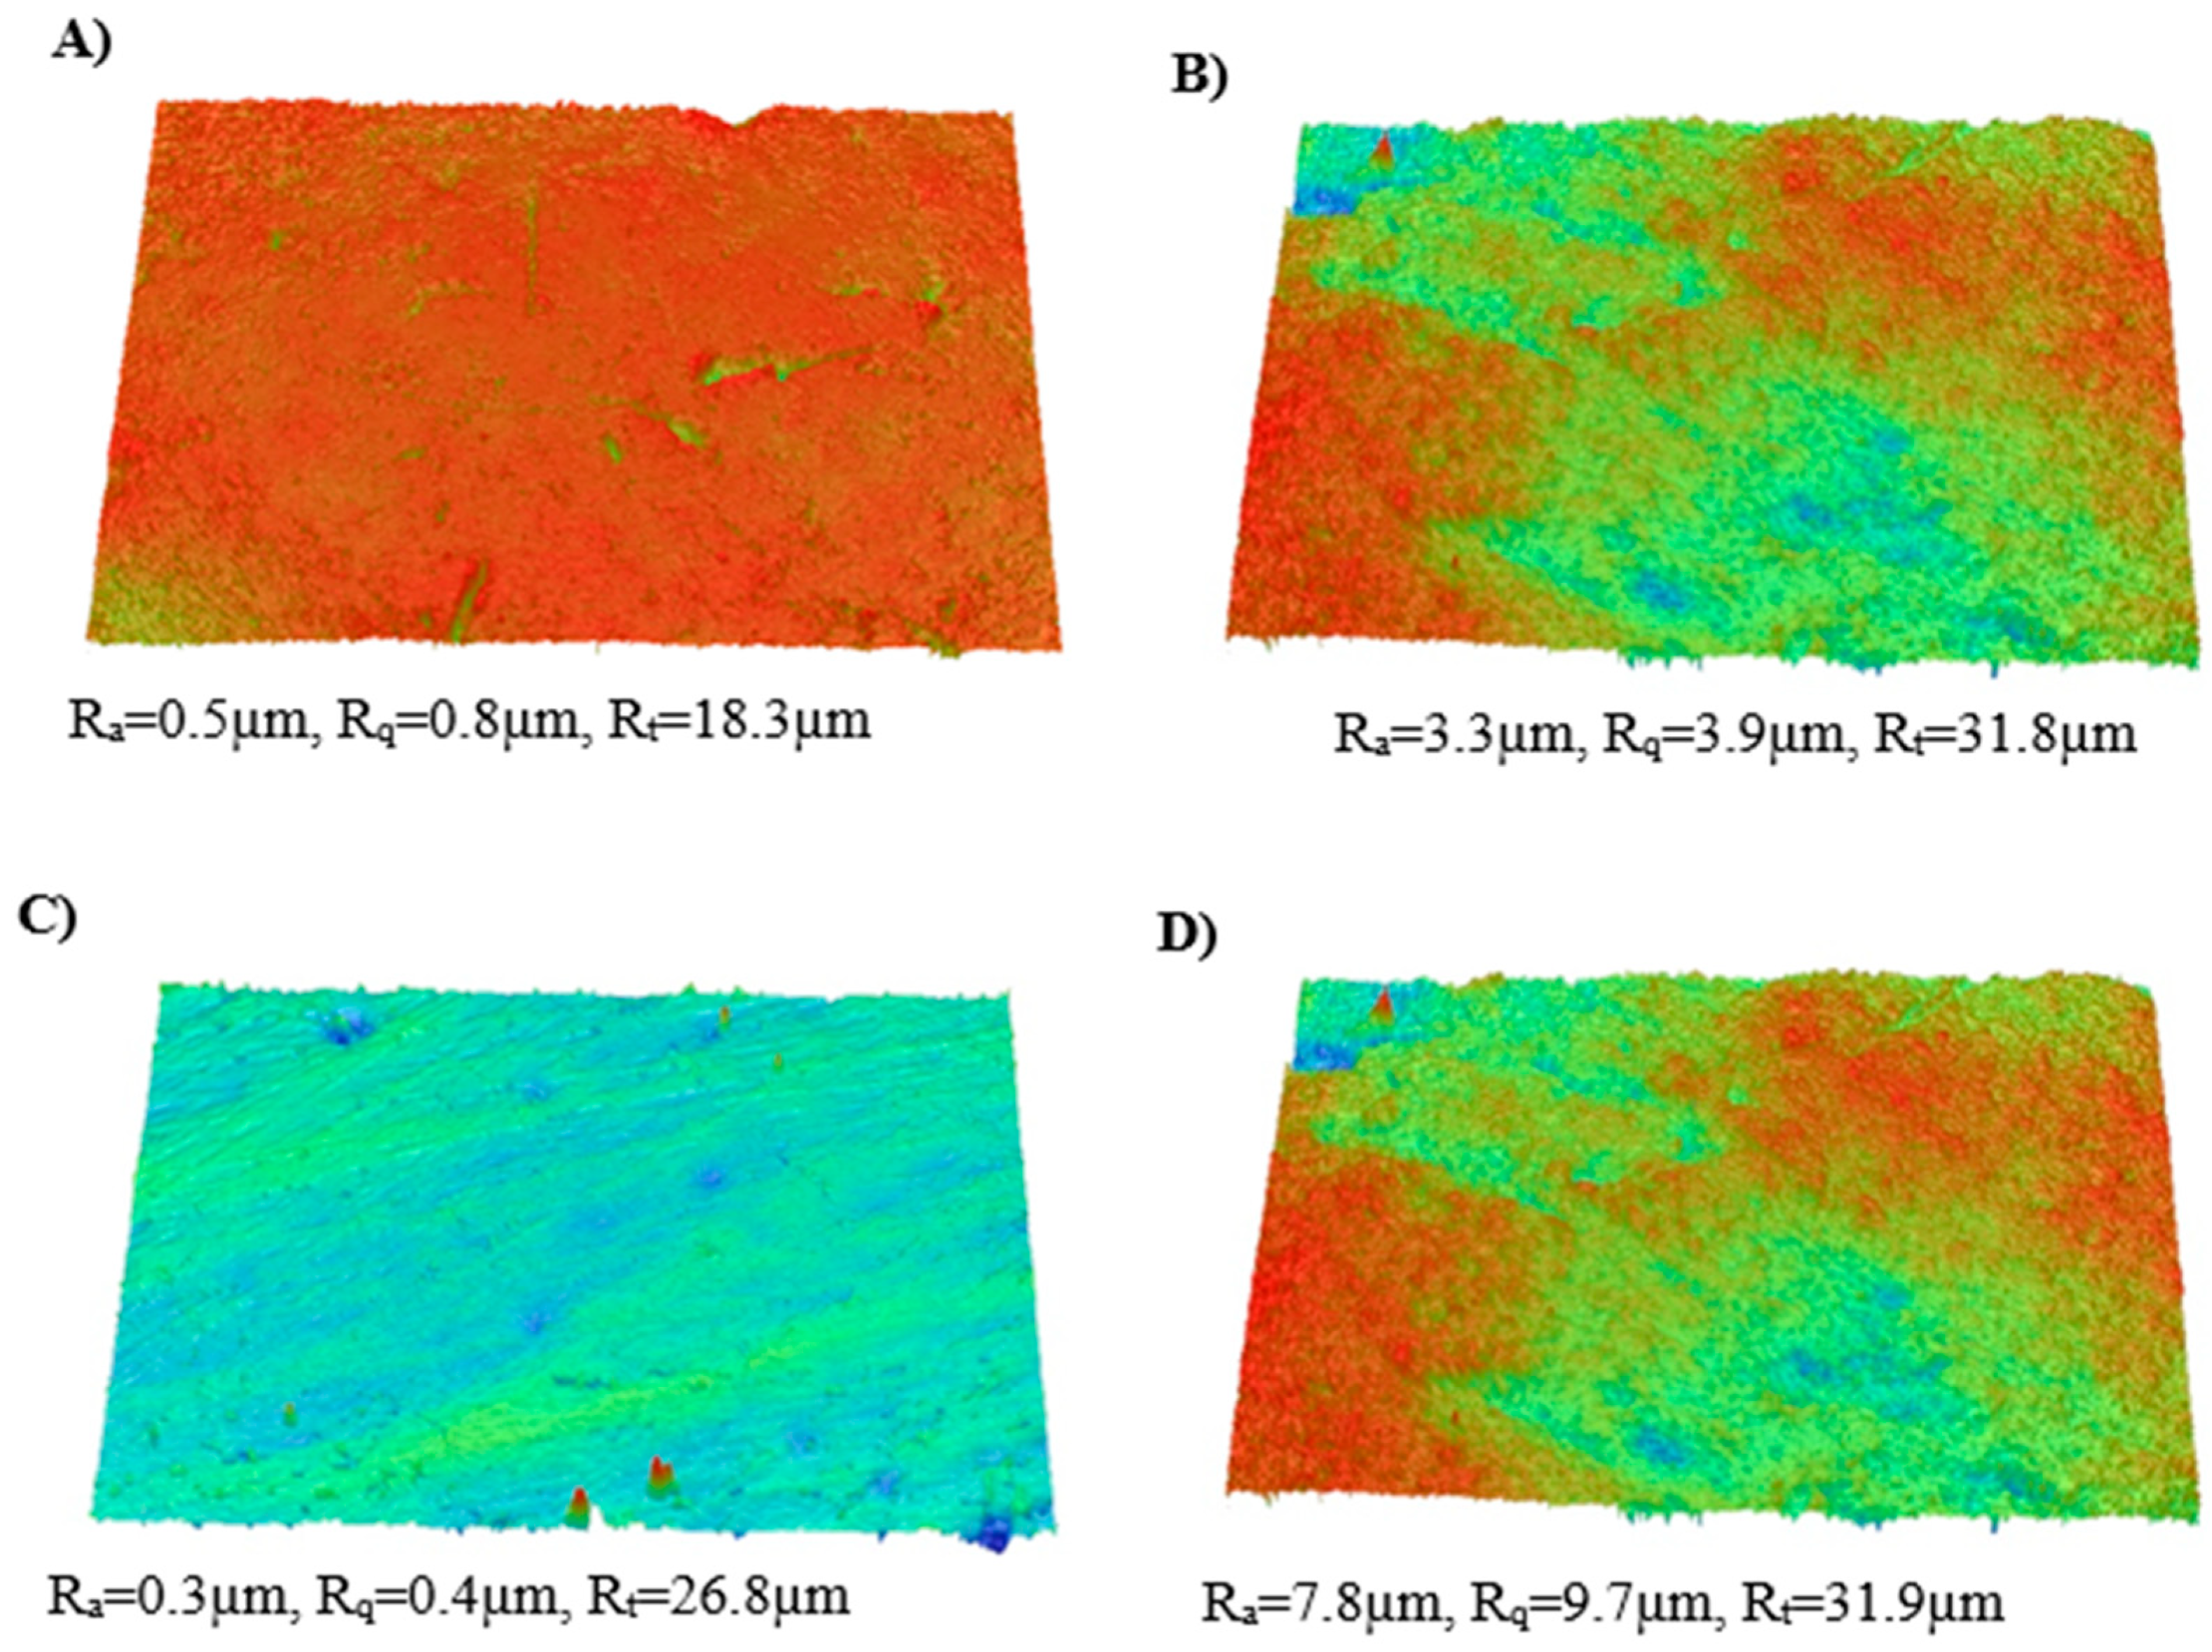
3.9. Optical Profilometry

The surface roughness has a significant impact on the contact angle of the test liquids on the tested surfaces. The SEM decoilers presented above (Figure 12) provide a lot of information about the structure of the surface while being high-magnification projections, i.e., they present a small area. For this reason, in order to verify the topography of the surface better by optical profilometry, we made surface maps with a size of 0.90 × 1.30 mm, which corresponds to the area occupied by the droplet when measuring contact angles. The tested material is a technological material. Five plates from each group were examined, and Figure 13 shows the results obtained for the smoothest and roughest surfaces. In our opinion, it is of no use to calculate the average, because the obtained material is heterogeneous. The surface topography of the laboratory HIPS [40] is in the order of nanometers, similarly to ABS [41], where the average surface roughness for the untreated polymer was 53.10 nm. The tested materials come from a wide range of household appliances and vary in roughness, which can increase due to the material itself. In this case, the roughness is on a micro-scale and reaches up to several tens of micrometers (Figure 13). Taking into account the roughness parameter Rt, it can be concluded that the materials’ roughness levels are in a comparable range.

3.10. Examination of HIPS and ABS Contact Angles by the Sitting Drop Method

The averaged test results with the standard deviations are given in Table 9. The difference in the contact angles for HIPS and ABS using only tap water is 0.70°. The largest differences in the contact angles occur at concentrations of 0.10 and 0.20 g/L SLES, being 10.76° and 10.10°, respectively (Figure 14). The standard deviations for the contact angles range from 2.90 to 5.48.
The results for the solution including only tap water (0.00 g/L SLES) confirm the information reported in the literature about the similar degrees of wettability of HIPS and ABS [15,16,17,18,19]. In the paper [15], the difference between the contact angles of HIPS and ABS using only distilled or deionized water was 3.10°; in [16], 0.15°; in [17], 1.16°; and in [18], 0.41°, and that presented in the master’s thesis [19] was 0.86°. Comparing the results of the difference in the contact angles after the change in the nature of the HIPS and ABS surfaces presented in the papers [15,16,17,18,19], the result obtained in this paper is the smallest—amounting to 10.76°. This result is similar to that obtained in the paper [18] (10.89°). It should be noted that the presented studies were carried out at room temperature, and in [15,16,17,18], an elevated temperature (from 60 °C to 70 °C) was used. This reduces energy consumption in the process. The other advantages distinguishing the results obtained in these studies are the low concentration of NaCl (0.10 or 0.20 g/L NaCl), and the easy availability of salt and its favorable price. According to Table 9, the wettability for the other concentrations did not bring the expected results (the difference in the contact angles was too small). The high standard deviation ranges are due to unevenness and impurities on the surface of recycled plastics, which was one of the biggest challenges of this study (Figure 6, Figure 7, Figure 8 and Figure 9). Such a surface has an impact on the obtained results of contact angle tests because a rough surface will mean that the contact angle will never be constant [42,43].
The described surface topography (Figure 12 and Figure 13) has a significant impact on the values of the measured contact angles, especially on the significant values of the standard deviations of the measurement (Figure 14). When proposing a model of surface wettability, the Wenzel model should be chosen [44]. This indicates that the droplets penetrate the rough surfaces, wetting them completely. This can be explained by the roughness scale, which is dominated by micro sizes and the low surface tension of the solutions used, which additionally promotes wetting.
Another challenge is the material composition of HIPS and ABS, which is not constant in terms of composition. The reason for this is the processing of refrigerators in the Polish Recycling Corporation from different manufacturers and from different years of production. Older refrigerators may not comply with the current EU standards for the use of appropriate smoking-retardant additives [45]. Moreover, milling is a result of processing industrial and household refrigerators, which additionally indicates that the composition of milling is also not constant.
This research was carried out with the use of tap water, despite the fact that the composition of such water is not constant. The reason for this is the use of conditions as close as possible to production ones, where flotation on a larger scale with distilled or deionized water would be a more expensive undertaking.
The results of moisture content studies for HIPS and ABS indicate that these plastics do not tend to absorb moisture, which does not create an additional problem for flotation studies.
Melt flow rate tests (MFR and MVR) are the basis for the selection of a recycling method for HIPS and ABS plastics. Owing to these results, the plastics processing company can determine which method is most suitable.
XRD testing revealed the presence of TiO2, which most likely comes from the white pigment. Moreover, in addition to titanium oxide, HIPS contains calcium carbonate, which is a frequently used filler affecting the properties of the material and reducing its price. The mass percentages of additives can vary depending on the manufacturer’s objective.
The study of the minimum number of air bubbles that should attach to the surface of the plastic so that it has a density lower than that of water showed that one air bubble should attach to HIPS and ABS surfaces with the sizes between 0 mm and 4 mm. Plastics with larger dimensions, i.e., more than 4 mm, need more air bubbles to reduce their density to the appropriate value. It should be noted that these are theoretical values. The presence of air bubbles is necessary for correct and effective flotation based on the hydrophilic and hydrophobic properties of the surfaces of the floated elements.
The results of tests of contact angles before changes in surface characteristics obtained in the papers [15,16,17,18,19] for PS and ABS were higher than those obtained in this paper. The contact angles in the papers [15,16,17,18,19] for the surface of PS ranged from 81.01° to 102.58°, while the contact angle of HIPS obtained in these studies was 72.30°. As far as ABS is concerned, the contact angles in the papers [15,16,17,18,19] ranged from 80.15° to 102.58°, and in this paper, it was 73.00°. The reason for obtaining smaller contact angles of HIPS and ABS plastics before changing the nature of their surface may be the difference in the surface morphology of the analyzed plastics (the plastics examined in this paper could be more or less rough or dirty). Furthermore, in the studies [15,16,17,18,19], analyses of contact angles were performed using deionized or distilled water, and tap water was used in this study. The contact angles in papers [15,16,17,18,19] using surface-altering substances were also higher, and the reasons for such results could be similar to those already mentioned in this paragraph. The only correlation was observed for the difference in the contact angles of PS and ABS before the application of the substance changing the characteristics of the surface. These differences ranged from 0.15° to 3.10°, which confirms the very similar surface characteristics of PS and ABS plastics and justifies the objective of this research.
It is true that HIPS and ABS make up the largest part of refrigerator grinding products. There were also other plastics (PP and PA) in the mill, but their quantities were insignificant, so they were not given much attention in this paper. The fact that these plastics can be found in the upper fraction or in the lower fraction was ignored.
Owing to the FTIR analysis of HIP and ABS flakes, a clear distinction was made between these plastics. This was due to the presence of a characteristic peak in the area of the 2237 cm−1 wavelength from the C-N bond, which occurs in ABS plastic. This means that the use of FTIR is a very good method by which HIPS and ABS can be easily identified.

4. Applications

A potential application of HIPS and ABS could be the production of components that do not come into contact with food and drinking water. Contact with food and drinking water is not a safe option for the reuse of these plastics due to the lack of information about the presence of hazardous substances (e.g., chlorinated flame retardants) [45]. Such elements can include storage containers, trash cans, pipes, brush and mop rods, furniture elements, suitcases and travel trunks, dustpans or coat hangers. It should be noted that this paper does not examine the mechanical properties of HIPS and ABS, which is necessary to get to know their strength and to conduct a more detailed analysis of the potential use of recycled HIPS and ABS. In addition, it is necessary to pay attention to the hygroscopic properties of ABS and consider its possible use for elements that have frequent contact with water [27]. What is more, before further processing of PS and ABS, it is necessary to consider drying them. The MFR and the MVR results obtained for these plastics will be very helpful in the potential application of HIPS and ABS—they will suggest the most appropriate processing method for the processing company and help to select processing parameters.

5. Conclusions

By conditioning the solution with the surfactant SLES chemically, the hydrophobicity of HIPS and ABS surfaces was reduced. For SLES concentrations of 0.10 and 0.20 g/L, a difference in the contact angles of approximately 10° is a satisfactory result that confirms the potential of using SLES as a surfactant to support the flotation of HIPS and ABS mixtures. The contact angle for these two results for HIPS is higher than that of ABS. This indicates that HIPS, as a more hydrophobic material (in the presence of air bubbles), should float on the surface of the flotation solution, and ABS, as a more hydrophilic material, should sink to the bottom. The uneven surface of the plastics, which can be seen in the microscopic images, had an impact on the results of the contact angles and standard deviations. The surfaces are completely wettable by surfactant solutions in accordance with Wenzel’s model for the wettability of rough surfaces.
In the future, further investigations are planned using a heavy liquid., i.e., a solution of tap water and NaCl and in the presence of SLES as the surfactant supporting flotation. Another direction of research could be investigating the effect of plastic surface cleaning on their contact angle. Moreover, HIPS and ABS surface wettability tests can be used to test solutions of other surfactants in tap water. The testing of contact angles on other plastics present in the mill obtained from refrigerators (i.e., PP and PA) could be also carried out.

Author Contributions

Conceptualization, K.T. and B.M.; methodology, K.T. and B.M.; investigation, B.M., E.P. and J.L.M.E.; data curation, E.P.; writing—original draft preparation, B.M.; writing—review and editing, K.T.; visualization, B.M.; supervision, K.T.; project administration, K.T.; funding acquisition, B.M. All authors have read and agreed to the published version of the manuscript.

Funding

This research was funded by the Ministry of Education (Poland), grant number DWD/6/0413/2022.

Data Availability Statement

Data is contained within the article.

Acknowledgments

The materials used for the experiments were from the Polish Recycling Corporation WEEE recycling plant (Poland). The tests of moisture content, NIR spectrometer analysis and MFI coefficients were carried out at the Research and Development Centre of the Polish Recycling Corporation.

Conflicts of Interest

Author Benita Malinowska was employed by the company Polish Recycling Corporation. The remaining authors declare that the research was conducted in the absence of any commercial or financial relationships that could be construed as a potential conflict of interest.

References

  1. Afroz, R.; Masud, M.M.; Akhtar, R.; Duasa, J.B. Survey and analysis of public knowledge. awareness and willingness to pay in Kuala Lumpur. Malaysia—A case study on household WEEE management. J. Clean. Prod. 2013, 52, 185–193. [Google Scholar] [CrossRef]
  2. Cucchiella, F.; D’Adamo, I.; Koh, S.C.L.; Rosa, P. Recycling of WEEEs: An economic assessment of present and future e-waste streams. Renew. Sust. Energy Rev. 2015, 51, 263–272. [Google Scholar] [CrossRef]
  3. Dodbiba, G.; Shibayama, A.; Miyazaki, T.; Fujita, T. Triboelectrostatic separation of ABS. PS and PP plastic mixture. Mater. Trans. 2003, 44, 161–166. [Google Scholar] [CrossRef]
  4. Fraunholcz, N. Separation of waste plastics by froth flotation—A review. Part I. Miner. Eng. 2004, 17, 261–268. [Google Scholar] [CrossRef]
  5. Bakker, E.J.; Rem, P.C.; Fraunholcz, N. Upgrading mixed polyolefin waste with magnetic density separation. Waste Manag. 2009, 29, 1712–1717. [Google Scholar] [CrossRef] [PubMed]
  6. Li, J.; Wu, G.; Xu, Z. Tribo-charging properties of waste plastic granules in process of tribo-electrostatic separation. Waste Manag. 2015, 35, 36–41. [Google Scholar] [CrossRef] [PubMed]
  7. Fu, S.; Fang, Y.; Yuan, H.; Tan, W.; Dong, Y. Effect of the medium’s density on the hydrocyclonic separation of waste plastics with different densities. Waste Manag. 2017, 67, 27–31. [Google Scholar] [CrossRef]
  8. Censori, M.; La Marca, F.; Carvalho, M.T. Separation of plastics: The importance of kinetics knowledge in the evaluation of froth flotation. Waste Manag. 2016, 54, 39–43. [Google Scholar] [CrossRef]
  9. Truc, N.T.T.; Lee, B.K. Combining ZnO/microwave treatment for changing wettability of WEEE styrene plastics (ABS and HIPS) and their selective separation by froth flotation. Appl. Surf. Sci. 2017, 420, 746–752. [Google Scholar] [CrossRef]
  10. Mallampati, S.R.; Lee, C.; Park, M.H.; Lee, B. Processing plastics from ASR/ESR waste: Separation of poly vinyl chloride (PVC) by froth flotation after microwave- assisted surface modification. J. Mater. Cycles Waste Manag. 2018, 20, 91–99. [Google Scholar] [CrossRef]
  11. Wang, J.; Wang, H. Fenton treatment for flotation separation of polyvinyl chloride from plastic mixtures. Sep. Purif. Technol. 2017, 187, 415–425. [Google Scholar] [CrossRef]
  12. Wang, H.; Wang, C.; Fu, J. Floatability of polymer materials modulated by frothers. Waste Manag. 2013, 33, 2623–2631. [Google Scholar] [CrossRef] [PubMed]
  13. Pascoe, R.D. The use of selective depressants for the separation of ABS and HIPS by froth flotation. Miner. Eng. 2005, 18, 233–237. [Google Scholar] [CrossRef]
  14. Wang, C.; Wang, H.; Wu, B.; Liu, Q. Boiling treatment of ABS and PS plastics for flotation separation. Waste Manag. 2014, 34, 1206–1210. [Google Scholar] [CrossRef] [PubMed]
  15. Zhang, Y.; Jiang, H.; Wang, H.; Wang, C. Flotation separation of acrylonitrile-butadiene-styrene and polystyrene in WEEE based on oxidation of active sites. Miner. Eng. 2020, 146, 106131. [Google Scholar] [CrossRef]
  16. Guo, C.; Zou, Q.; Wang, J.; Wang, H.; Chen, S.; Zhong, Y. Application of surface modification using sodium hypochlorite for helping flotation separation of acrylonitrile-butadiene-styrene and polystyrene plastics of WEEE. Waste Manag. 2018, 82, 167–176. [Google Scholar] [CrossRef]
  17. Cui, Y.; Li, Y.; Wang, W.; Wang, X.; Lin, J.; Mai, X.; Song, G.; Naik, N.; Guo, Z. Flotation separation of acrylonitrile-butadienestyrene (ABS) and high impact polystyrene (HIPS) from waste electrical and electronic equipment (WEEE) by potassium permanganate surface modification. Sep. Purif. Technol. 2021, 269, 118767. [Google Scholar] [CrossRef]
  18. Wang, J.; Liu, W.; Wang, H.; Wang, C.; Huang, W. Separation of acrylonitrile-butadiene-styrene and polystyrene waste plastics after surface modification using potassium ferrate by froth flotation. Waste Manag. 2018, 78, 829–840. [Google Scholar] [CrossRef] [PubMed]
  19. Baigabelov, A. Investigation of Surface Treatment and Density Separation for Selective Recycling of Plastics; Montana Tech Library: Butte, MT, USA, 2019. [Google Scholar]
  20. Campos, M.; Campos, R. Applications of quartering method in soils and foods. Int. J. Eng. Res. Appl. 2017, 7 Pt 2, 35–39. [Google Scholar] [CrossRef]
  21. Petersen, L.; Minkkinen, P.; Esbensen, K.H. Representative sampling for reliable data analysis: Theory of Sampling. Chemom. Intell. Lab. Syst. 2005, 77, 261–277. [Google Scholar] [CrossRef]
  22. ISO 1133-1:2022; Plastics—Determination of the Melt Mass-Flow Rate (MFR) and Melt Volume-Flow Rate (MVR) of Thermoplastics. ISO: Geneva, Switzerland, 2022.
  23. Shen, H.; Forssberg, E.; Pugh, R.J. Selective flotation separation of plastics by particle control. Resour. Conserv. Recycl. 2001, 33, 37–50. [Google Scholar] [CrossRef]
  24. Martinho, G.; Pires, A.; Saraiva, L.; Ribeiro, R. Composition of plastics from waste electrical and electronic equipment (WEEE) by direct sampling. Waste Manag. 2012, 32, 1213–1217. [Google Scholar] [CrossRef] [PubMed]
  25. Wang, H.; Zhang, Y.; Wang, C. Surface modification and selective flotation of waste plastics for effective recycling—A review. Sep. Purif. Technol. 2019, 226, 75–94. [Google Scholar] [CrossRef]
  26. Turku, I.; Kasala, S.; Kärki, T. Characterization of Polystyrene Wastes as Potential Extruded Feedstock Filament for 3D Printing Lappeenranta University of Technology. Recycling 2018, 3, 57. [Google Scholar] [CrossRef]
  27. Notomi, M.; Kishimoto, K.; Shibuya, T.; Koizumi, T. Effects of moisture absorption on fracture behaviors of acrylonitrile-butadiene-styrene resin. J. Appl. Polym. Sci. 1999, 72, 435–442. [Google Scholar] [CrossRef]
  28. Turku, I.; Karki, T. Recyclability of plastic waste extracted from electrical devices. In IOP Conference Series: Materials Science and Engineering; IOP Publishing: Bristol, UK, 2019; p. 012001. [Google Scholar]
  29. Bandeira, L.C.; Campos, B.M.; Ciuffi, K.J.; Nassar, E.J.; Silva, J.V.; Oliveira, M.F.; Maia, I.A. Calcium Phosphate Coatings by Sol-Gel on Acrylonitrile-butadiene-styrene Substrate. J. Braz. Chem. Soc. 2017, 28, 943–949. [Google Scholar] [CrossRef]
  30. Saja, S.; Al-Taweel, S.S. New route for synthesis of pure anatase TiO2 nanoparticles via utrasoundassisted sol-gel method. Chem. Pharm. Res. 2016, 8, 620–626. [Google Scholar]
  31. Prabhu, T.V.; Chandrasekaran, J.; Thangaraju, D.; Vivek, P.; Gopi, S. Fabrication and performance analysis of set standard natural dye-sensitized solar cell (N-DSSC) using extracted Terminalia kattapa (Red), Azadirachia indica (Green), and Clitoria ternatea (Blue) dyes with virgin Degussa p25 photo-anode. J. Mater. Sci. Mater. Electron. 2022, 33, 17331–17342. [Google Scholar] [CrossRef]
  32. Thamaphat, K.; Limsuwan, P. Phase Characterization of TiO2 Powder by XRD and TEM. Agric. Nat. Resour. 2008, 42, 357–361. [Google Scholar]
  33. Hurley, N.; Li, L.; Koenigsmann, C.; Wong, S. Surfactant-Free Synthesis of Three-Dimensional Perovskite Titania-Based Micron-Scale Motifs Used as Catalytic Supports for the Methanol Oxidation Reaction. Molecules 2021, 26, 909. [Google Scholar] [CrossRef]
  34. Ankasi, D.W.; Dikio, E.D. Comparative Study of Polystyrene and Polymethylmethacrylate Wastes as Adsorbents for Sorption of Pb2+ from Aqueous Solution. Asian J. Chem. 2014, 26, 8295–8302. [Google Scholar] [CrossRef]
  35. Sahebian, S.; Zebarjad, S.M.; Sajjadi, S.A.; Sherafat, Z.; Lazzeri, A. Effect of both uncoated and coated calcium carbonate on fracture toughness of HDPE/CaCO3 nanocomposites. J. Appl. Polym. Sci. 2007, 104, 3688–3694. [Google Scholar] [CrossRef]
  36. Uddin, M.J.; Cesano, F.; Chowdhury, A.R.; Trad, T.; Cravanzola, S.; Martra, G.; Mino, L.; Zecchina, A.; Scarano, D. Surface Structure and Phase Composition of TiO2 P25 Particles After Thermal Treatments and HF Etching. Front. Mater. 2020, 7, 192. [Google Scholar] [CrossRef]
  37. Vidakis, N.; Petousis, M.; Maniadi, A.; Koudoumas, E.; Liebscher, M.; Tzounis, L. Mechanical Properties of 3D-printed acrylonitrile–butadiene–styrene, TiO2 and ATO Nanocomposites. Polymers 2020, 12, 1589. [Google Scholar] [CrossRef]
  38. Che Ismail, N.H.; Akil, H.M. Improving the Flexural Properties of Abs/Muscovite Composites by Introducing Modified Muscovite, The Effect of Filler Type on the Mechanical, Thermal and Rheological Properties of Cellulose-filled Thermoplastic. J. Phys. Conf. Ser. 2018, 1082, 01201. [Google Scholar] [CrossRef]
  39. Vilaplana, F.; Ribes-Greus, A.; Karlsson, S. Analytical strategies for the quality assessment of recycled high-impact polystyrene: A combination of thermal analysis, vibrational spectroscopy, and chromatography. Anal. Chim. Acta 2007, 604, 18–28. [Google Scholar] [CrossRef]
  40. Fricker, A.L.; McPhail, D.S.; Keneghan, B.; Pretzel, B. Investigating the impact of cleaning treatments on polystyrene using SEM, AFM and ToF–SIMS. Herit. Sci. 2017, 5, 28. [Google Scholar] [CrossRef]
  41. Martinez, M.A.; Abenojar, J.; Lopez de Armentia, S. Environmentally Friendly Plasma Activation of Acrylonitrile–Butadiene–Styrene and Polydimethylsiloxane Surfaces to Improve Paint Adhesion. Coatings 2018, 8, 428. [Google Scholar] [CrossRef]
  42. Kubiak, K.J.; Wilson, M.C.T.; Mathia, T.G.; Carval, P. Wettability versus roughness of engineering surfaces. Wear 2011, 271, 523–528. [Google Scholar] [CrossRef]
  43. Nakae, H.; Inui, R.; Hirata, Y.; Saito, H. Effect of surface roughness on wettability. Pergamon 1998, 46, 2313–2318. [Google Scholar] [CrossRef]
  44. Wenzel, R.N. Resistance of solid surfaces to wetting by water. Ind. Eng. Chem. 1936, 28, 988–994. [Google Scholar] [CrossRef]
  45. Mallampati, S.R.; Lee, B.H.; Mitoma, Y.; Simion, C. Selective sequential separation of ABS/HIPS and PVC from automobile and electronic waste shredder residue by hybrid nano-Fe/Ca/CaO assisted ozonisation process. Waste Manag. 2017, 60, 428–438. [Google Scholar] [CrossRef] [PubMed]
Figure 1. Scheme of flotation recycling—flotation tank with air bubbles and the plastics: HIPS and ABS.
Applsci 14 04407 g001
Figure 2. Laboratory sample for the “Pre-identification of HIPS and ABS with the handheld NIR spectrometer” test.
Applsci 14 04407 g002
Figure 3. Laboratory sample after the analysis with the NIR spectrometer.
Applsci 14 04407 g003
Figure 4. FTIR spectrum of one of the tested ABS flakes.
Applsci 14 04407 g004
Figure 5. FTIR spectrum of one of the tested HIPS flakes.
Applsci 14 04407 g005
Figure 6. Microscopic image of the surface of the ABS flake at 40× magnification.
Applsci 14 04407 g006
Figure 7. Microscopic image of the surface of the ABS flake at 40× magnification.
Applsci 14 04407 g007
Figure 8. Microscopic image of the surface of the HIPS flake at 40× magnification.
Applsci 14 04407 g008
Figure 9. Microscopic image of the surface of the HIPS flake at 40× magnification.
Applsci 14 04407 g009
Figure 10. XRD spectrum made for ABS along with its interpretation.
Applsci 14 04407 g010
Figure 11. XRD spectrum for HIPS along with its interpretation.
Applsci 14 04407 g011
Figure 12. Images taken with a scanning electron microscope. (AC) HIPS plates; (DF) magnifications of 5000, 1000 and 25,000, respectively.
Applsci 14 04407 g012
Figure 13. Optical profilometry (0.9 × 1.3 mm): (A,B) HIPS; (C,D) PS plates. Ra—the average roughness as calculated over the entire measured array, Rq—the root-mean-squared roughness calculated over the entire measured array, Rt—the peak-to-valley difference calculated over the entire measured array.
Applsci 14 04407 g013
Figure 14. Plot of contact angle’s dependence on SLES concentration.
Applsci 14 04407 g014
Table 1. Results of the test of the sample.
MaterialMass
[g]
% Mass
[%]
PS100.4057.44
ABS68.6039.24
PP4.802.75
PA1.000.57
TOTAL174.80100.00
Table 2. Summary of the results for the moisture content tests in HIPS.
Number of SampleMass before Test
[g]
Moisture Content
[%]
114.1230.064
214.0570.078
314.0790.092
414.0510.071
514.0100.100
STANDARD DEVIATION0.015
AVERAGE0.081
Table 3. Summary of the results for the moisture content tests in ABS.
Number of SampleMass before Test
[g]
Moisture Content
[%]
112.9970.208
214.1650.163
314.0760.142
414.0900.163
513.7010.161
STANDARD DEVIATION0.024
AVERAGE0.167
Table 4. Test results obtained using the plastometer for the HIPS flakes.
Test NumberMFR
[g/10 min]
MVR
[cm3/10 min]
Density
[g/cm3]
13.413.520.97
23.433.470.99
34.124.200.98
43.783.781.00
54.424.441.00
STANDARD DEVIATION0.440.430.01
AVERAGE3.833.880.99
Table 5. Test results obtained using the plastometer for ABS flakes.
Test NumberMFR
[g/10 min]
MVR
[cm3/10 min]
Density
[g/cm3]
132.5232.451.00
230.4829.891.02
333.1233.300.99
432.0431.591.01
530.4829.031.05
STANDARD DEVIATION1.201.770.02
AVERAGE31.7331.251.02
Table 6. The selected research results of the mass of ABS and PS flakes.
No.Mass of
ABS > 8 mm
[g]
Mass of
HIPS > 8 mm
[g]
Mass of
ABS 4–8 mm
[g]
Mass of
HIPS 4–8 mm
[g]
10.9790.2310.0510.248
20.3010.2440.1400.202
30.4220.3870.0960.053
40.4290.4320.0880.181
50.2310.4480.0650.268
STANDARD DEVIATION0.2950.1040.0340.084
AVERAGE0.3500.3690.1160.146
Table 7. Results of the HIPS and ABS flake density test.
No.ABS Density [g/cm3]
at T = 25 °C
HIPS Density [g/cm3]
at T = 25 °C
11.1061.036
21.0281.018
31.0601.047
41.0511.037
51.0541.024
61.0671.019
71.0281.024
81.0271.005
91.0851.011
101.0231.008
STANDARD DEVIATION0.0280.014
AVERAGE1.0531.023
Table 8. Results of calculations of the theoretical number of air bubbles.
Material and Its DimensionsMinimum Number of Air Bubbles
[pcs.]
ABS > 8 mm19
HIPS > 8 mm10
ABS 4–8 mm4
HIPS 4–8 mm4
ABS 2.5–4 mm1
HIPS 2.5–4 mm1
ABS < 2.5 mm1
HIPS < 2.5 mm1
Table 9. The averaged test results of contact angles.
SLES Concentration
[g/L]
HIPS
Contact Angle
Standard
Deviation
ABS
Contact Angle
Standard Deviation
0.0072.304.3673.004.36
0.1061.025.1650.263.93
0.1554.712.9061.574.52
0.2066.805.2356.704.90
0.2552.643.3855.673.50
0.3049.015.4856.483.45
0.4053.384.4253.164.16
0.5041.464.0037.572.70
0.6041.453.6438.323.11
0.7038.334.2137.354.81
0.8052.373.1956.885.58
0.9049.103.0251.393.93
1.0057.423.3354.074.23
1.1044.744.0947.593.90
1.2036.204.3139.193.50
Disclaimer/Publisher’s Note: The statements, opinions and data contained in all publications are solely those of the individual author(s) and contributor(s) and not of MDPI and/or the editor(s). MDPI and/or the editor(s) disclaim responsibility for any injury to people or property resulting from any ideas, methods, instructions or products referred to in the content.

