Article

Assessing the Sustainability of Alternative Shaft Construction Methods

by
António M. G. Pedro
1,*,
Lucas Repsold
2 and
Jorge Almeida e Sousa
3
1
ISISE, ARISE, Department of Civil Engineering, University of Coimbra, 3030-788 Coimbra, Portugal
2
COBA Group, 1649-011 Lisbon, Portugal
3
Department of Civil Engineering, University of Coimbra, 3030-788 Coimbra, Portugal
*
Author to whom correspondence should be addressed.
Appl. Sci. 2024, 14(11), 4476; https://doi.org/10.3390/app14114476
Submission received: 24 April 2024 / Revised: 20 May 2024 / Accepted: 23 May 2024 / Published: 24 May 2024
(This article belongs to the Special Issue Sustainability in Geotechnics)

Abstract

:
Reducing carbon dioxide (CO2) emissions is a global priority. The concrete industry has a major role in this reduction since it accounts for about 8% of global CO2 emissions. Despite significant improvements in the sustainability of the production of concrete, one of the best solutions is still to improve the design and construction methods, such that the required quantities of concrete are reduced. Using, as a reference, a real case study, this study compares alternative shaft construction methodologies from engineering and sustainability points of view, highlighting the advantages and drawbacks of each solution. To achieve this purpose, a back analysis is performed to ensure that the numerical model is accurately calibrated and the shaft construction methods can be adequately assessed. The results show that, while the considered methods are applicable and satisfy engineering requirements, the characteristics of the lining of the shaft could have been optimized, resulting in a reduction in CO2 emissions by at least 50% without compromising the safety of the construction.

1. Introduction

With the aim of creating a more sustainable world, politicians, under the umbrella of United Nations (UN), set up Agenda 2030, where 17 Sustainable Development Goals (SDGs) were established [1]. These SDGs have the ambition of ending poverty and inequality in the world, improving health and education, and spurring economic growth while tackling climate change and preserving nature. Whitin the objective of solving the climate crisis (UN-SDG 13), reducing carbon dioxide (CO2) emissions is one of the most important aspects, which led, at the United Nations Climate Change Conference in 2015, to the Paris Agreement, where 196 parties signed a treaty, which aims to hold “the increase in the global average temperature to well below 2 °C above pre-industrial levels” [2]. To achieve that goal, it is fundamental to promote a major transformation in the construction sector (UN-SDG 9), where concrete manufacturing contributes to its massive carbon footprint, being responsible for at least 8% of global carbon emissions [3,4], with the ingredient cement accounting for most of this [4,5,6,7]. Moreover, its production consumes large amounts of raw materials and freshwater, causing high strain on the environment [8,9].
However, the concrete industry assumes major importance in the economy and growth of any country as it produces an essential material for infrastructure development. As a result, it is expected that the rising global population and urbanization will drive up the demand for cement and concrete by 12–23% by 2050 from current levels [10], with the increase being particularly relevant in countries and regions like China, India, and Africa [5,11]. Hence, improving the sustainability of concrete production and use can have a significant global impact on the climate.
To tackle this objective, the concrete industry has been incorporating various sustainability initiatives into all aspects associated with the production and utilization of concrete [5,7,8,12,13]. An in-depth review of the numerous contributions that have been made to adapt and transform concrete into a sustainable material can be found in Hasanbeigi et al. [7], Adesina [8] and Chen et al. [12]. These new technologies are mainly focused on replacing part of the cement in the production of concrete with low-carbon concrete materials (LCCMs) [12], such as ground granulated blast-furnace slag (GGBF) and fly ash (FA), among others [14,15]. Other strategies consist of improving the energy efficiency of the production of concrete [7] and exploiting the potential of concrete recycling to increase the rate of CO2 uptake [13]. Naturally, one of the best options for reducing concrete emissions is simply using concrete more rationally and efficiently in construction, which requires a better optimization of structures at the design stage and also an improvement in the construction methods employed [16,17]. As pointed out by Basu et al. [18] and Song et al. [19], this optimization should also include geotechnical works, where the comparison of different solutions through life cycle assessments (LCAs) would highlight the most climate-friendly design for that specific structure [19,20]. Following that approach, a few studies have been published on the topic. For instance, Luo et al. [21] analyzed the impact on carbon emissions of installing driven precast and bored piles; Sandanayake et al. [22] evaluated the emissions released by constructing two types of foundations of residential buildings, while Berndt [23] presented a study on the optimization of the concrete mixture in order to reduce the CO2 emissions for large wind turbine foundations; Inui et al. [24], Damians et al. [25], and Pons et al. [26] performed LCAs of different types of retaining walls, trying to establish the most eco-friendly solution for particular scenarios; Chau et al. [27] calculated the emissions for two sections of the UK Channel Tunnel Rail Link; Sauer [28] and Aldrian et al. [29] discussed, in detail, the emissions caused by different types of linings usually adopted in tunnels; and Hu et al. [30] and Von der Tann et al. [31] evaluated the emissions for different design solutions of deep excavations.
In all cases, it is evident that performing an LCA analysis can be very complex, particularly at the design stage, where there is no clear definition of all aspects involved, mainly those associated with construction works. The gap between design, construction methods and sustainability can be bridged by performing back-analysis studies, where the performance of the adopted design and of possible alternative solutions is evaluated to provide suggestions for better design in future projects. Naturally, this process is highly dependent on the quality of the back analysis and on the amount of data available to calibrate and validate the numerical model. Following this methodology, this study assesses the impact of adopting alternative shaft construction methods from both engineering and sustainability points of view. Using, as a reference, the case of the WA2 shaft, built as part of the Dublin Port Tunnel project (DPT) [32], a numerical model is developed incorporating all the geotechnical information available at the shaft site. After a rigorous calibration of the constitutive model adopted for the soil layers and its validation against instrumentation data, alternative sequences for shaft excavation are assessed. These include the simulation of the excavation employing the SBE (Support Before Excavation) technique—where the support, such as diaphragm walls, is installed prior to the excavation—and of the EBS method (Excavation Before Support)—where the support is only installed once excavation is completed, such as in the case of shotcrete lining or precast concrete segments (PCL) [33].

2. The WA2 Shaft

The construction of the DPT, completed in 2006, was a major engineering infrastructure projects in Ireland and aimed to establish a quick connection between the Dublin harbor and the C-ring (M50) and M1 motorways, allowing for a quick transfer of heavy goods, while reducing heavy traffic congestion in the city center, contributing to a more sustainable environment with better air quality and noise reduction [32]. The project comprised the construction of twin-bored tunnels with 12.5 m of external diameter and 2.6 km long. To speed up the construction process, it was decided to build shaft WA2 (concluded in 2001), which served as a launching platform for the twin tunnel excavation. As explained by Cabarkapa et al. [34], after early design optimization studies, the final geometry of the circular shaft was established, consisting of an internal diameter of 56.6 m and a depth of around 29.0 m. The construction followed the SBE method [35], with the support consisting of a 1.5 m thick diaphragm wall. A total of 26 panels were constructed, each being slightly over 7 m wide and approximately 32.5 m deep, with this dimension depending on the position of the top of the bearing stratum, a limestone layer. In addition to the capping beam at the top of the shaft, a ring beam, made of concrete with a section of 2.5 × 2.5 m2 with its top at a depth of 10.5 m, was also executed. The concrete base slab was 1 m thick in the general section and 2 m thick around the breakouts of the tunnels [34]. The geometry and support system installed in the WA2 shaft are illustrated in Figure 1.
At the shaft location, the geology comprised the well-known Dublin boulder clays (DBCs) overlying a carboniferous limestone layer [36]. A detailed assessment of the geological features and geotechnical characteristics of that formation and its units can be found in Skipper et al. [36] and Long and Menkiti [37], respectively. The stratigraphy comprised 2 m of the weathered Upper Brown (UBrBC) unit, followed by the Upper Black (UBkBC) unit, which had a thickness of around 12 m. The third layer was the Lower Brown (LBrBC) unit, with a thickness of 11 m, and, finally, the 7.5 m thick Lower Black (LBkBC) unit was found (see Figure 1). Approximately hydrostatic conditions with a groundwater table located about 2 m below ground level (bottom of UBrBC) were measured by piezometers installed at the site.

3. Numerical Model

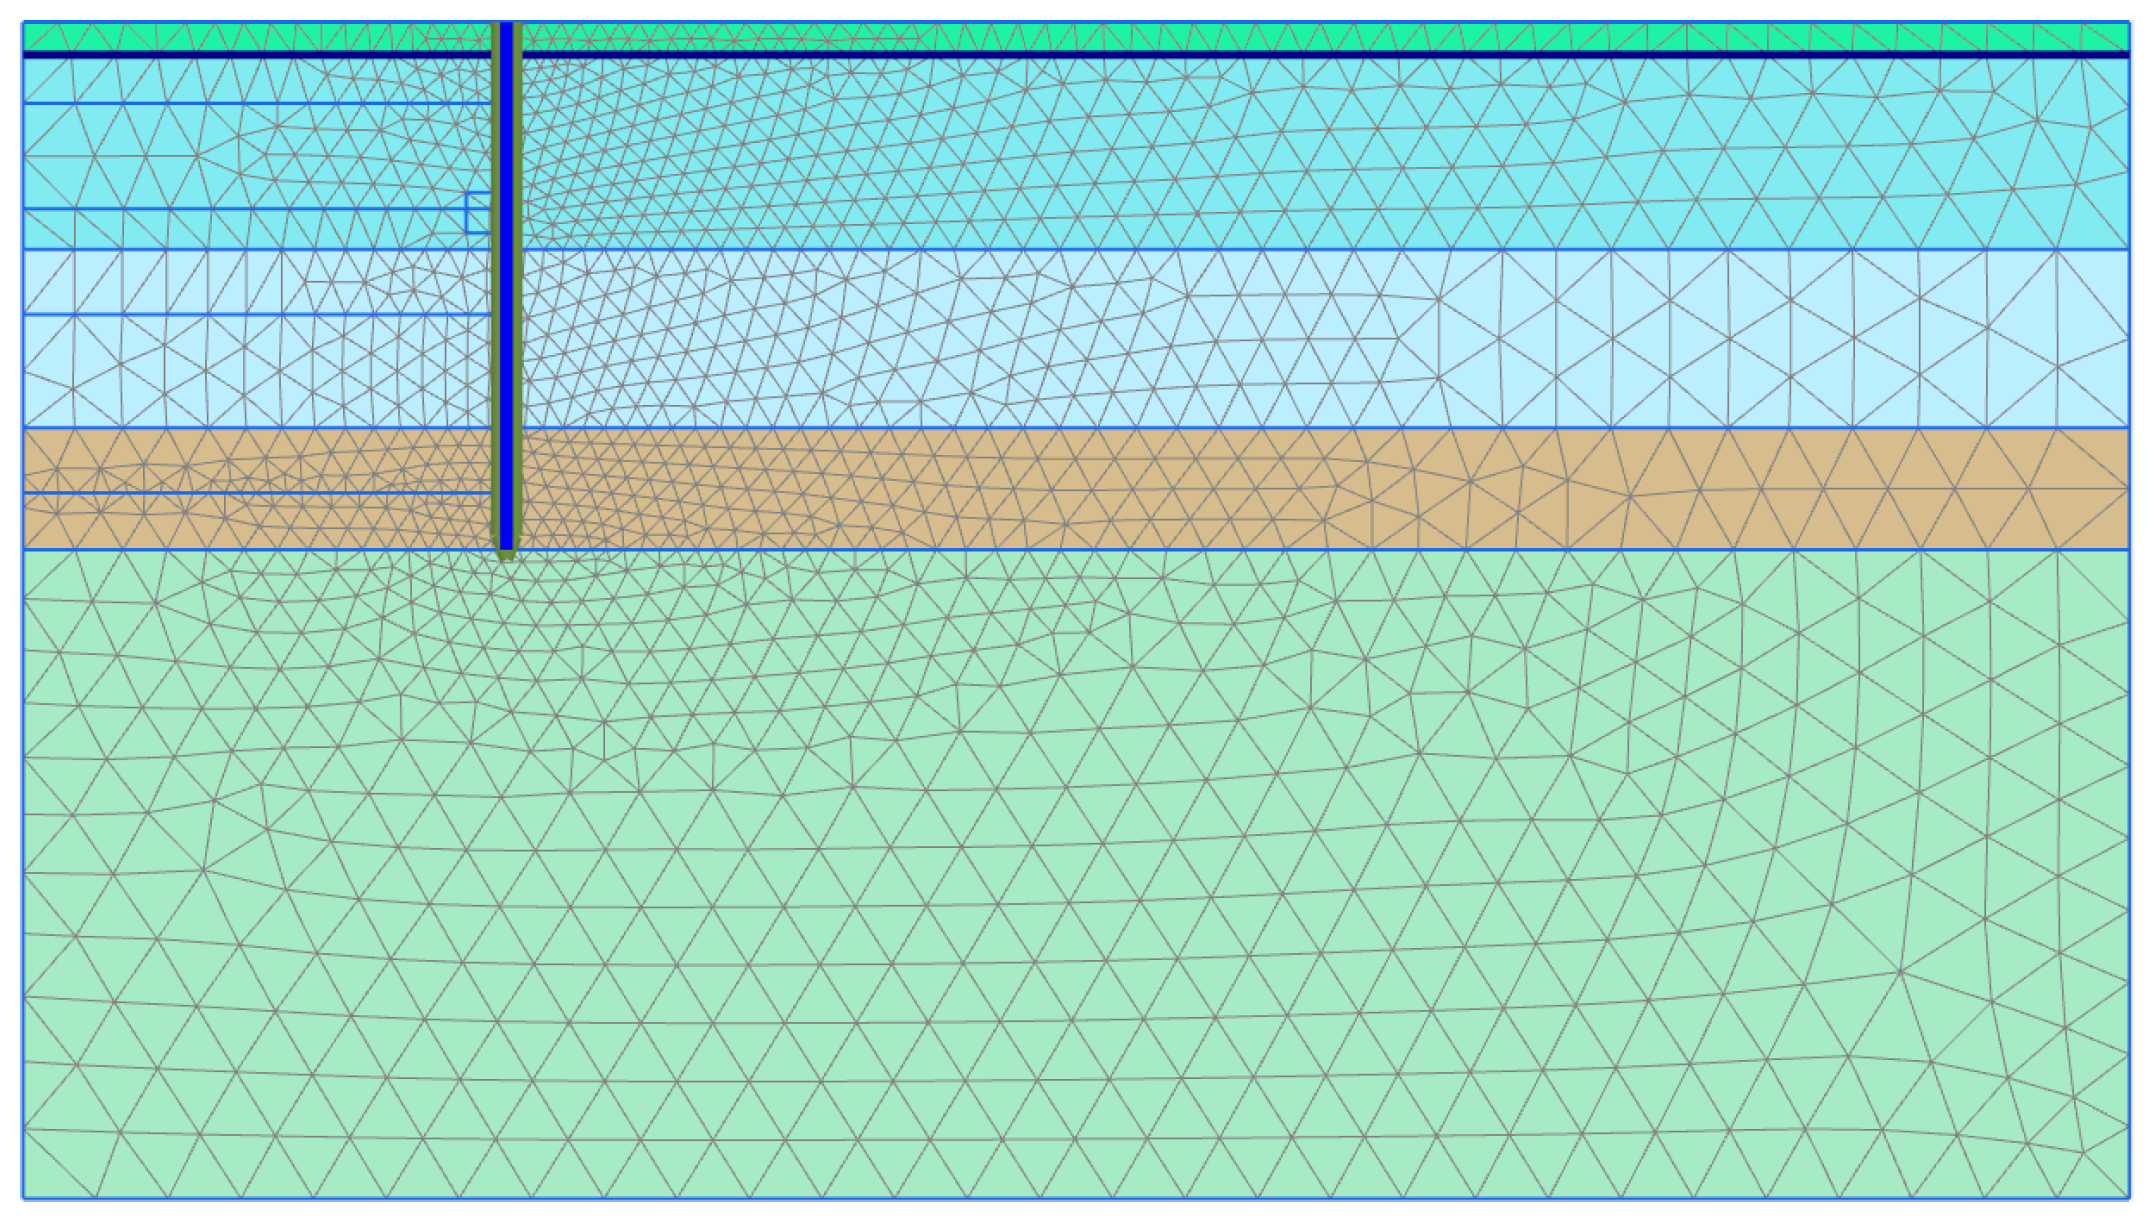
3.1. Details of the Analysis

To provide insights into the sustainability of the construction method employed in the excavation of the WA2 shaft, a numerical model was created using PLAXIS 2D v22.02 [38]. To incorporate all aspects of the problem in the simulation, a coupled consolidation analysis was performed while taking advantage of the axisymmetric nature of the problem. 15-noded triangular elements with 12 Gaussian integration points were employed for determining the displacements and stress states, respectively, in the solid elements, while for the diaphragm wall, 5-noded plate elements were employed. As can be seen in Figure 2, the mesh employed in the SBE analysis had a higher concentration of elements surrounding the diaphragm wall, where higher stress and strain variations are expected. Interface elements were used to simulate the soil–structure interaction and to prevent water flow through the diaphragm wall.
According to the information provided by the DPT administration [39], the WA2 shaft took approximately 5 months to excavate. To replicate the excavation process adequately, a linear advance rate was assumed in the numerical model, resulting in a value of 5 days per meter of excavation. An additional 15 days were assumed for the construction of the ring beam, which resulted in a total duration of 160 days. The simulation of the shaft excavation involved the following stages:
  • Generation of the initial stress state (assumed as geostatic with K0-conditions);
  • Construction of the diaphragm wall (“wished in place”);
  • Excavation to 14 m depth at a rate of 5 days/m;
  • Installation of the concrete ring beam (15 days);
  • Excavation to 29 m depth (base of the shaft) at a rate of 5 days/m.
The initial ground conditions were generated using, as a reference, the parameters proposed by Cabarkapa et al. [34]. A hydrostatic pore water pressure profile with the ground water table located at a depth of 2 m (bottom of UBrBC) was considered, together with the values of bulk unit weight (γ) and at-rest coefficient of earth pressure (K0), as presented in Table 1. As suggested by Cabarkapa et al. [34] and Kovacevic et al. [40], the isotropic permeability (k) was considered for all layers, with values of 10−8 m/s for the Dublin Brown Boulder Clay and 10−9 m/s for all the other materials.
In agreement with Cabarkapa et al. [34], the behavior of the limestone was assumed to be linear elastic-perfectly plastic, with its stiffness being described by E = 3 GPa and ν = 0.3, and its strength given by the Mohr–Coulomb failure criterion, with φ′ = 45° and c′ = 50 kPa, with non-associated plasticity characterized by ψ = 0°.
Similar to the model suggested by Kovacevic et al. [40] and Kovacevic et al. [41], and in contrast with the linear elastic-perfectly plastic model employed by Cabarkapa et al. [34], the mechanical response of DBC units was described herein using an expanded generalized version of the Modified Cam-Clay (MCC) model [42]. In the present case, this model introduces the nonlinear Hvorslev surface of Tsiampousi et al. [43] on the dry side and is combined with the nonlinear small strain stiffness formulation of Taborda et al. [44]. As in the original MCC formulation, the virgin compression line has a linear shape in ln   p ν plane, being defined by:
ν = ν 1 λ · ln p
where p′ is the mean effective stress, ν = 1 + e is the specific volume, and ν 1 and λ are model parameters. The stress ratio in the critical state is defined by the angle of shear resistance (ϕ′), while the nonlinear Hvorslev surface is controlled by four additional parameters, where αHV and n control the shape of the surface and βHV and m that of the plastic potential.
In terms of elastic behavior, the formulation established by the original MCC model for the tangent bulk stiffness, K t a n , is adopted:
K t a n = ν · p κ
where κ is the slope of the isotropic swelling line in the ln p ν space. Conversely, for the tangent shear modulus, G t a n , a modified hyperbolic expression is adopted [44]:
G t a n = G m a x · R G = G r e f p p r e f m G ( 1 ) · R G , m i n + 1 R G , m i n 1 + E d a b ( 2 )
where G m a x is the shear stiffness at very small strains, R G is the stiffness reduction factor, p r e f is a reference pressure (taken as 100 kPa), G r e f is the small-strain shear modulus at p = p r e f , E d is the generalized deviatoric strain (i.e., the second invariant of the strain tensor), and m G , a , b and R G , m i n are model parameters. This model, denoted as IC MAGE M06, was implemented as a User-Defined Soil Model (UDSM) into PLAXIS2D, which is described in Tsiampousi et al. [45]. The model is integrated using a modified Euler sub-stepping algorithm with automatic error control, as proposed by Sloan [46] and Sloan et al. [47], with the specific implementation for PLAXIS UDSMs detailed in Taborda et al. [48]. The derivation of the model parameters for all DBC layers is explained in detail in the next section, while the numerical simulations of the laboratory tests that validate the use of this constitutive model are reproduced in Appendix A.
In terms of excavation support, the diaphragm wall and the capping and ring beams were modelled as linear elastic with their stiffness described by E = 25.0 GPa, ν = 0.15 and with the dimensions presented in Figure 1. Lastly, the interaction between the support and the adjacent ground was modelled using interface elements with a strength reduced to two-thirds of that of the adjacent soil. The stiffness of these elements was set to kN = kT = 106 kN/m3, where the subscripts N and T denote the normal and tangential directions, respectively.

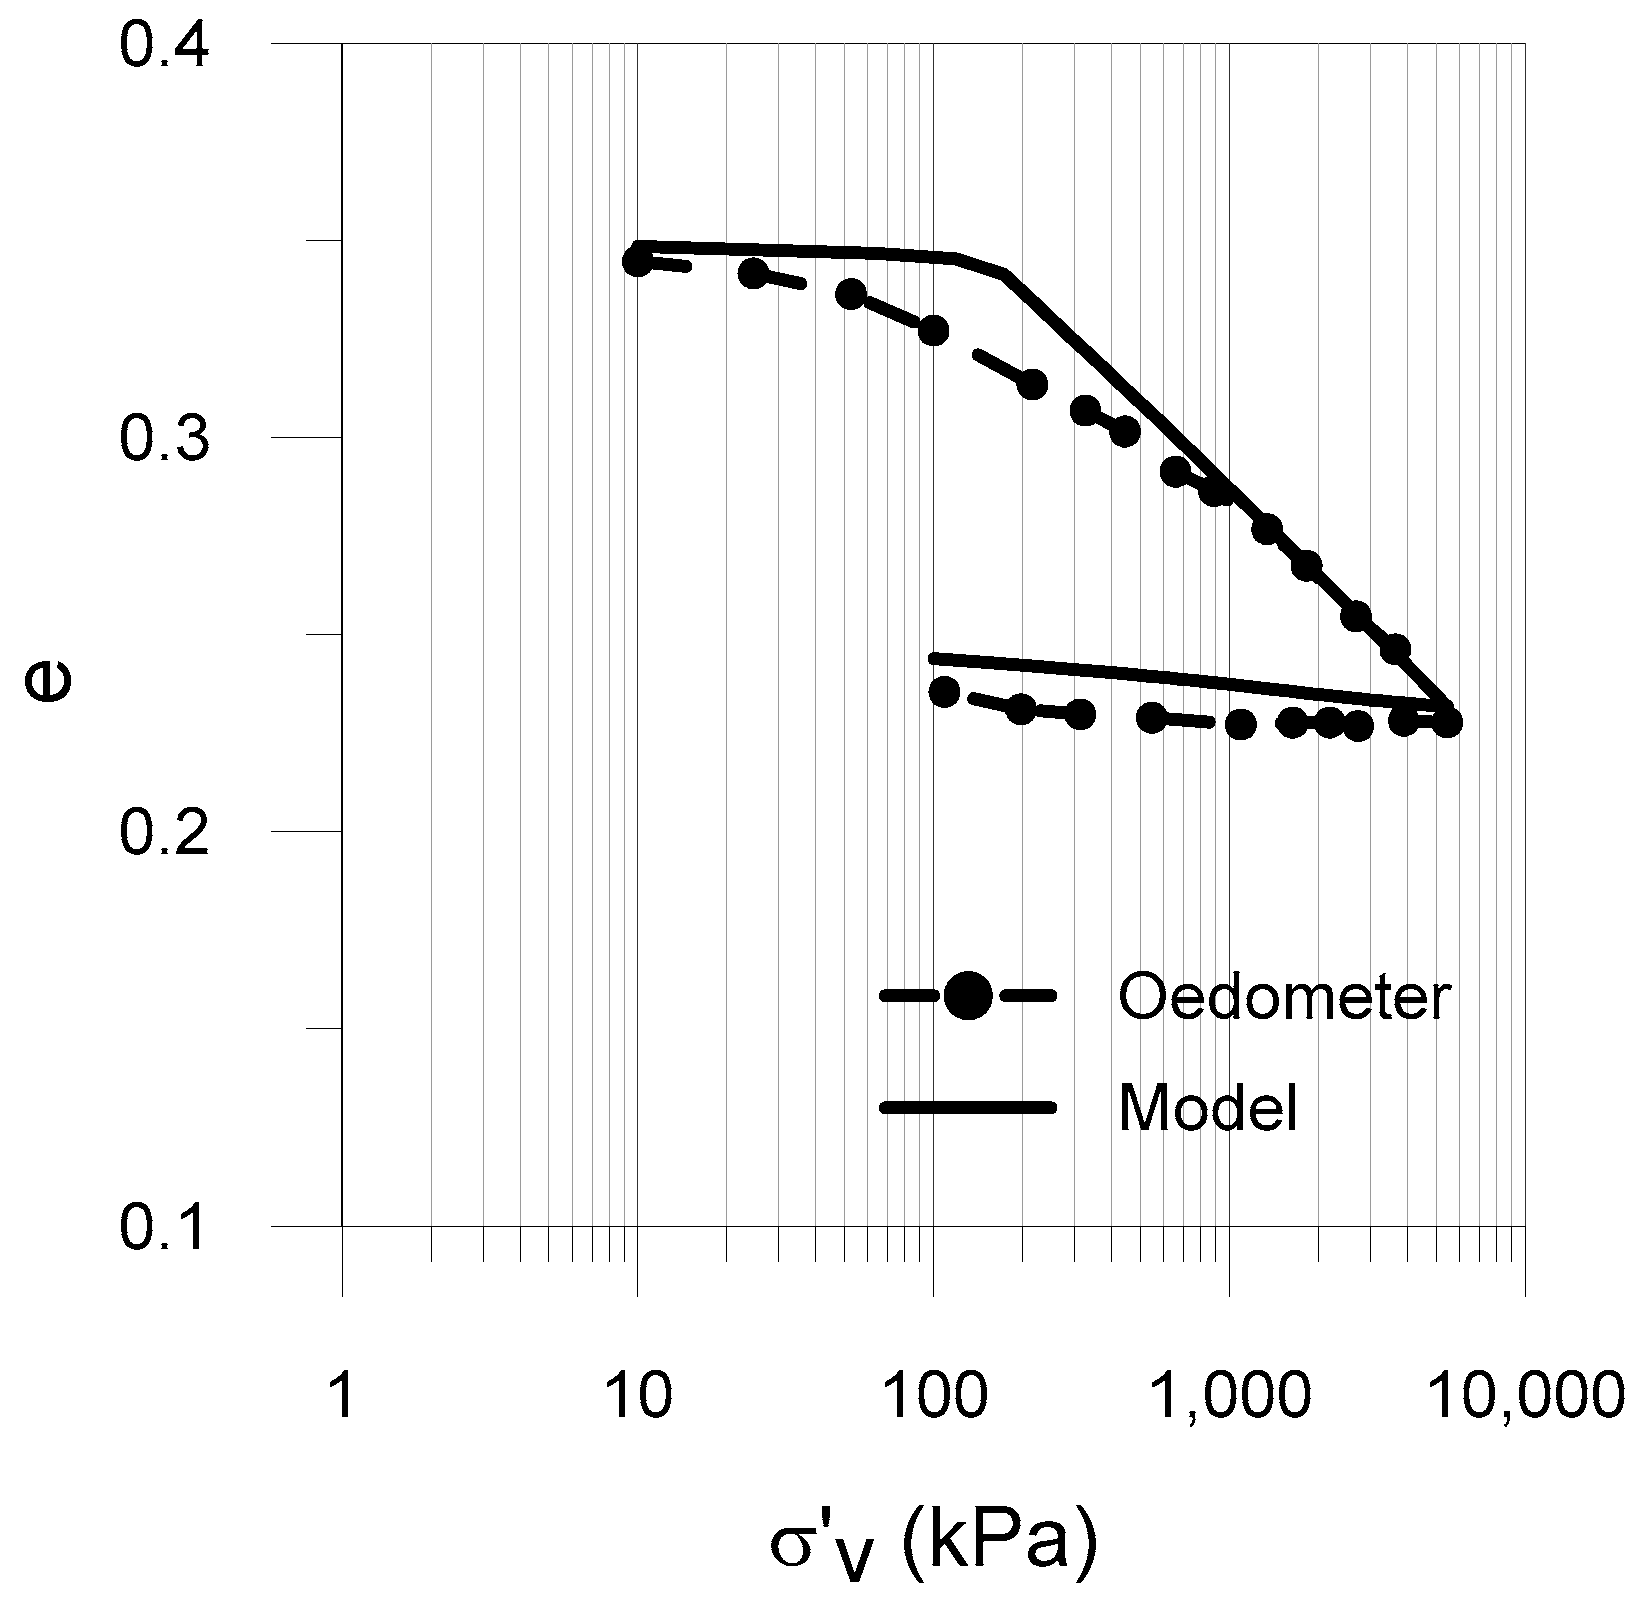
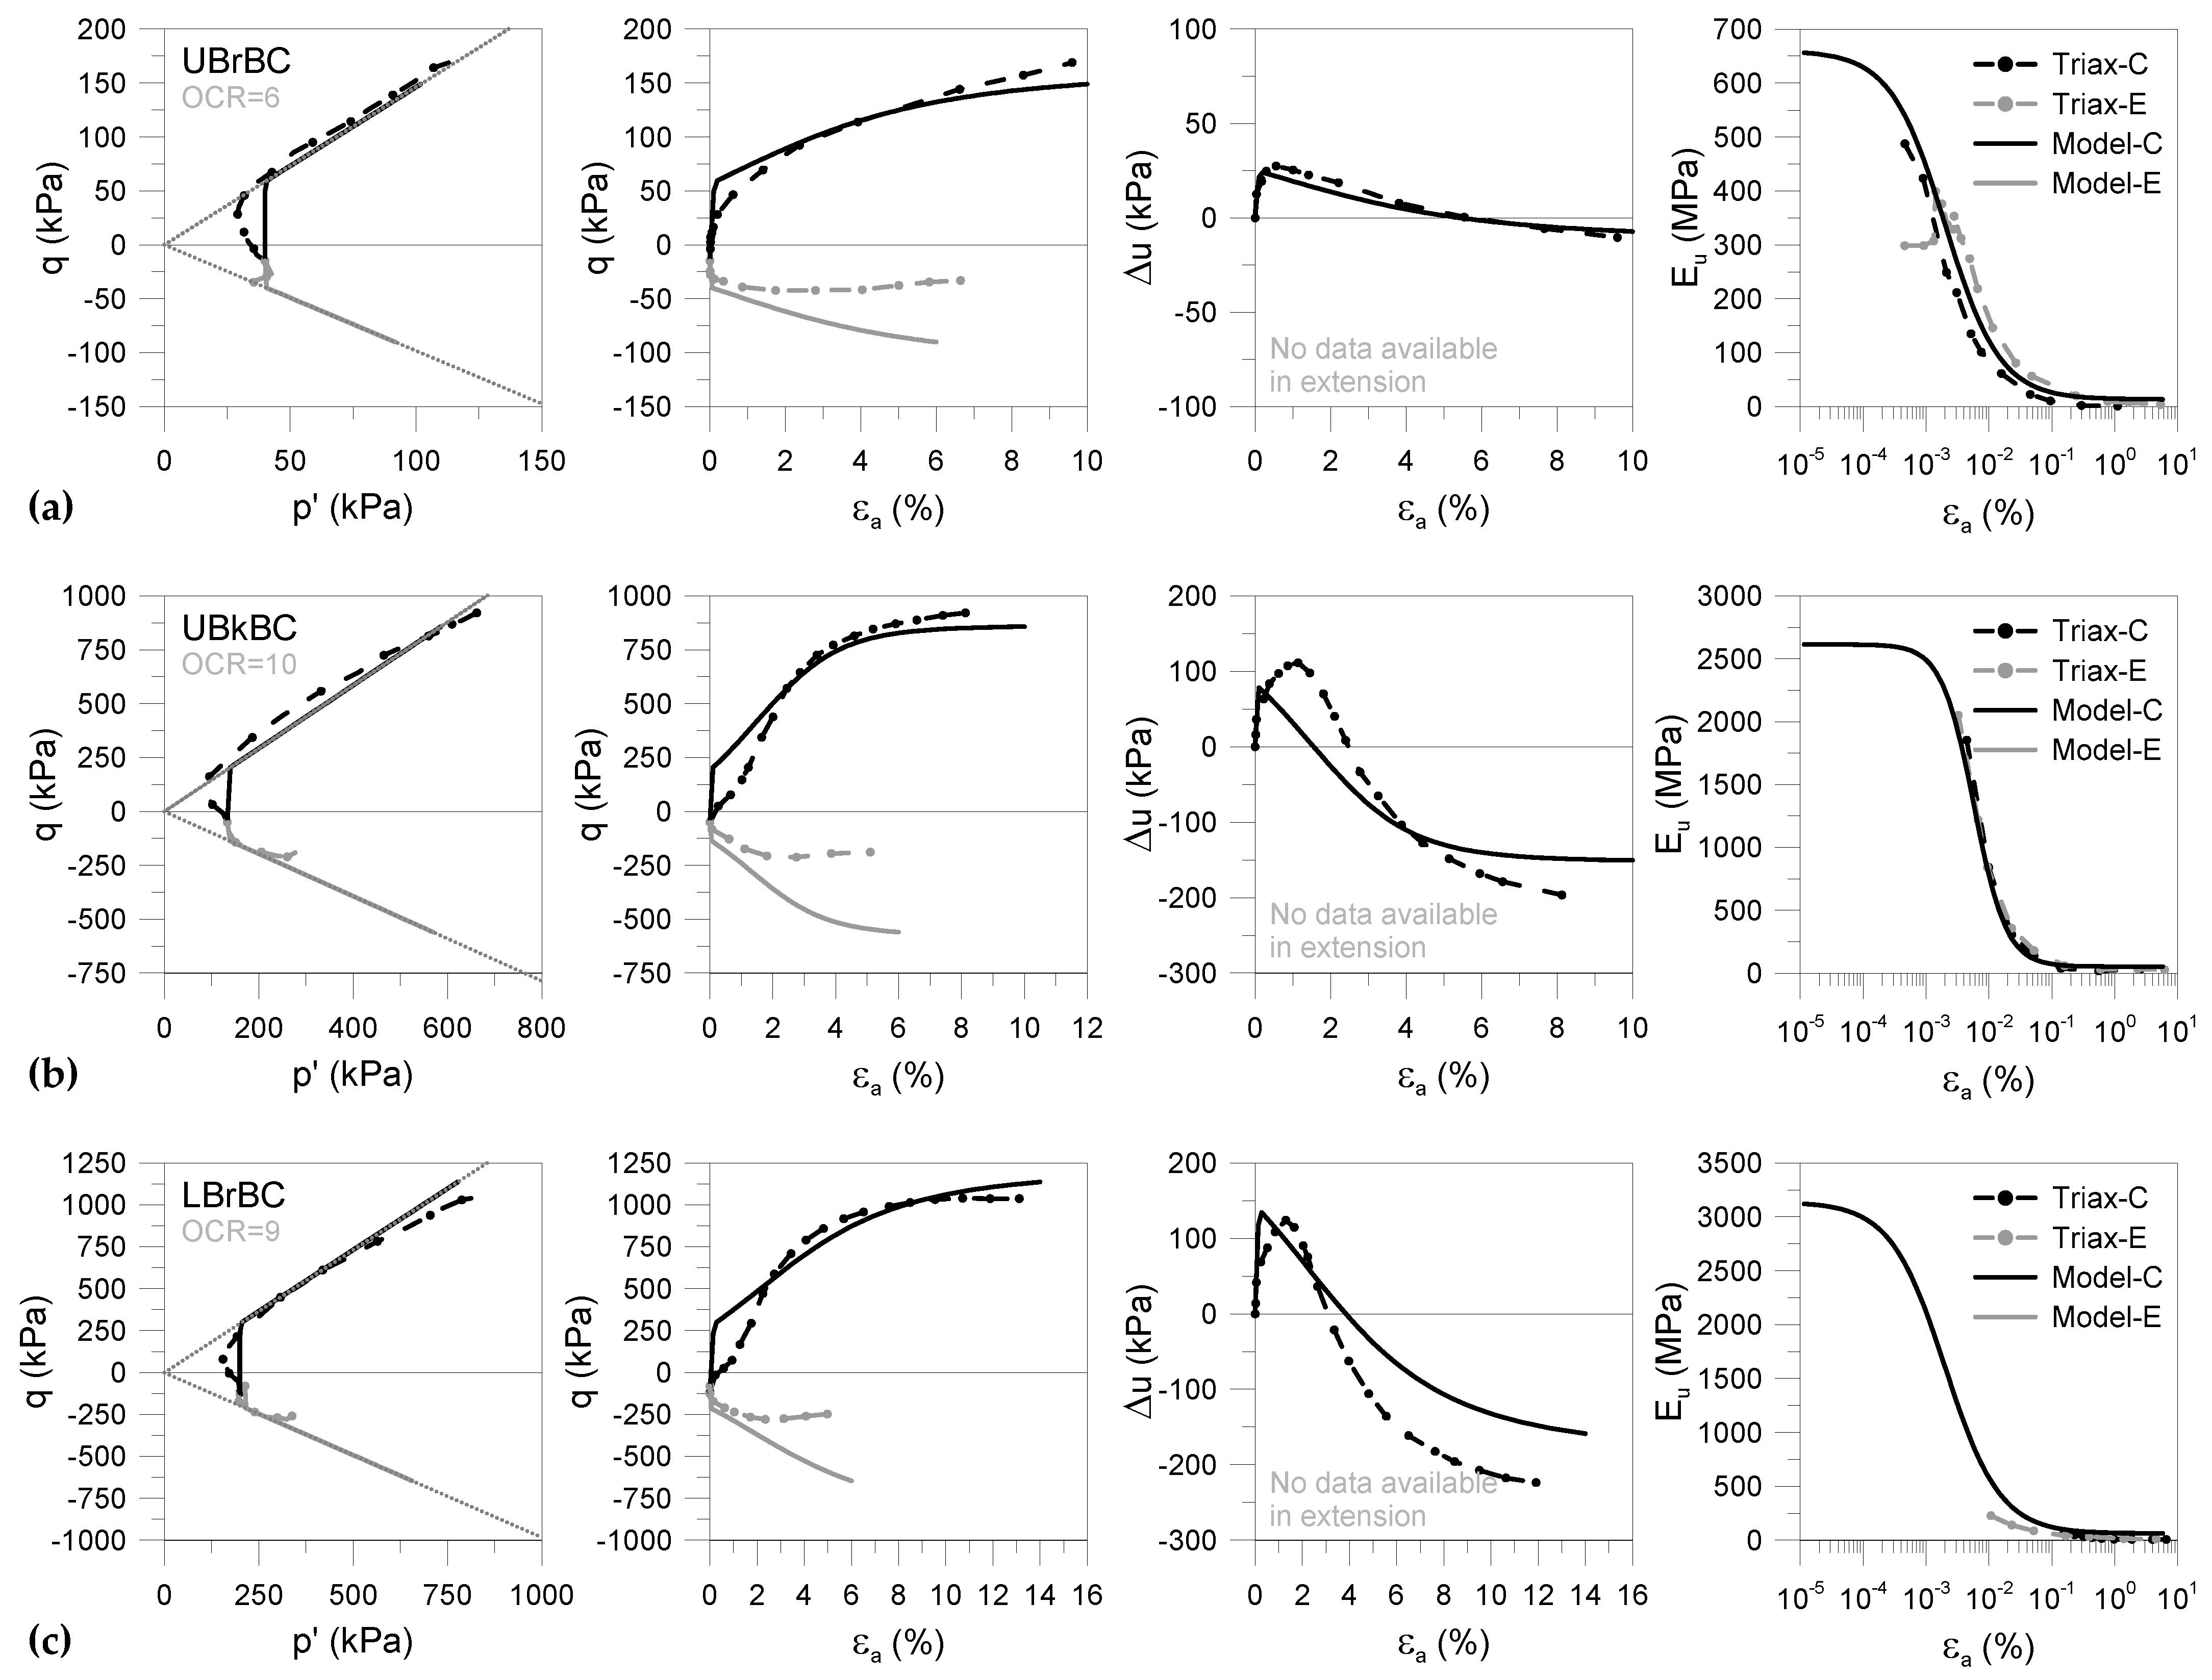
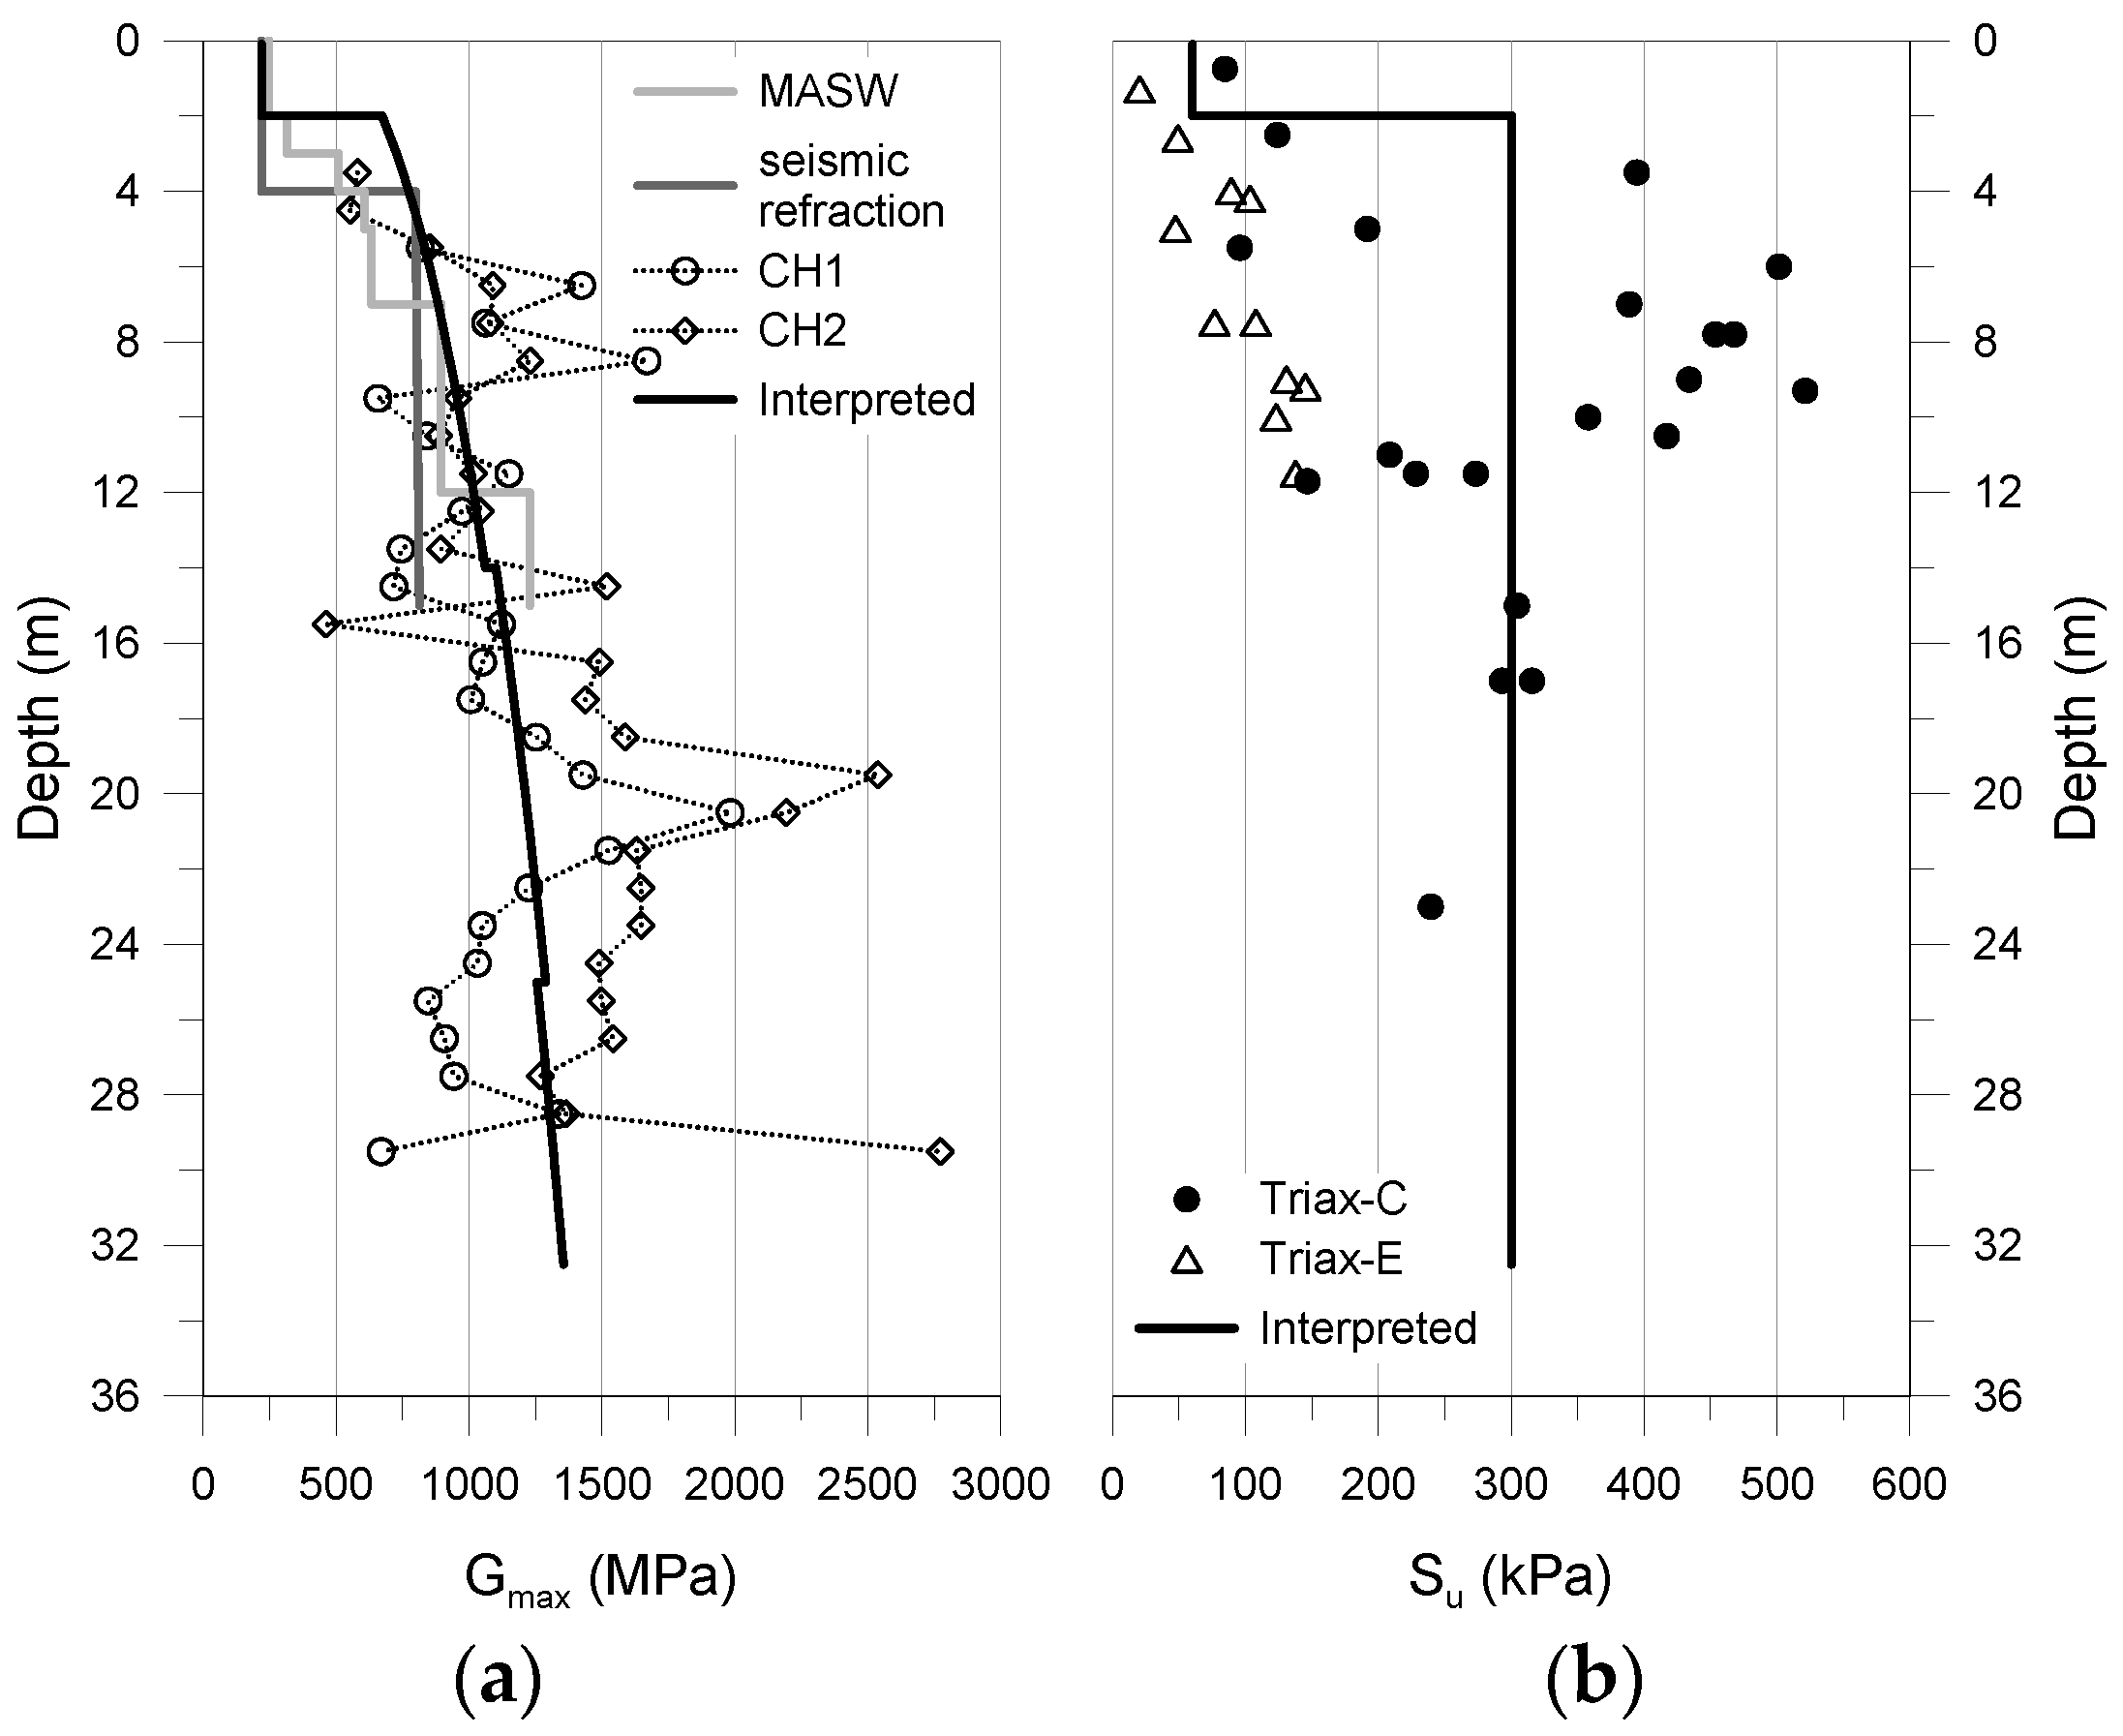
3.2. Calibration of the Dublin Boulder Clay Units

The calibration of IC MAGE M06 [45,48] followed a hierarchical approach, where each parameter was estimated sequentially and the order was set by its physical relevance and by its independency from other values [49,50,51]. The first aspect of the model to calibrate is determining the shear stiffness at very small strains (term (1) in Equation (3)). Using as a reference the results plotted in Figure 3a of different field tests (MASW, seismic refraction and cross-holes), performed at the WA2 shaft site and in other locations in Dublin with a similar profile [37,52], the evolution with the depth of the shear stiffness at very small strains ( G m a x ) was interpreted, allowing for the definition of parameters G r e f and m G for all DBC units. Given the variability observed in the field tests, it was decided to adjust the parameters so that the average stiffness was reproduced. It should be noted that given the weathered nature of the UBrBC, and in agreement with the field tests results, a constant G r e f of 220 MPa was adopted for this unit (i.e., m G = 0 ).
Based on the results of conventional triaxial compression and extension tests, and as suggested by Long and Menkiti [37], a value φ’ = 36° was adopted for the strength at the critical state of all units. The parameters of the compression and swelling lines were adopted following the revisited analysis performed by Kovacevic et al. [41], where the authors defined a set of different values for Brown and Black Boulder Clay units, regardless of their position (Upper or Lower) in the ground profile. Finally, the Hvorslev surface (shape and potential) and the shear stiffness degradation (term (2) in Equation (3)) were calibrated against the triaxial data presented by Long and Menkiti [37]. It is worth mentioning that since no test results were available to calibrate the LBkDC unit, it was assumed that its parameters were identical to those of the UBkBC unit, with the exception of G r e f , which had a higher value, reflecting the deeper position of that layer.
Table A1 in Appendix A summarizes all parameters of the IC MAGE M06 model adopted for all the DBC units considered in the analysis. Moreover, numerical reproductions of the oedometer and triaxial (compression and extension) tests that were used to calibrate the constitutive model are also shown in Appendix A. The results demonstrate a very good agreement between the numerical and measured data for all units, validating the adopted calibration process.
A final aspect required for the numerical simulation is related to the definition of the OCR profile at the WA2 shaft site. Unfortunately, there are no records of this state parameter available in the literature, and its estimation had to be performed indirectly based on the undrained shear strength (Su) profile. Figure 3b presents the Su values measured in triaxial compression and extension tests performed on DBC samples [37]. Although scatter and some discrepancies between compression and extension can be observed, the Irish practice usually considers an isotropic undrained shear strength defined by the profile presented by the solid black line [37]. A value of 60 kPa in the weathered UBrBC is generally assumed, and in the remaining units, a value of 300 kPa is commonly adopted. Based on this Su profile, an equivalent OCR profile was derived using the closed-form solution of IC MAGE M06 [45] and introduced into the model as an initial state condition.

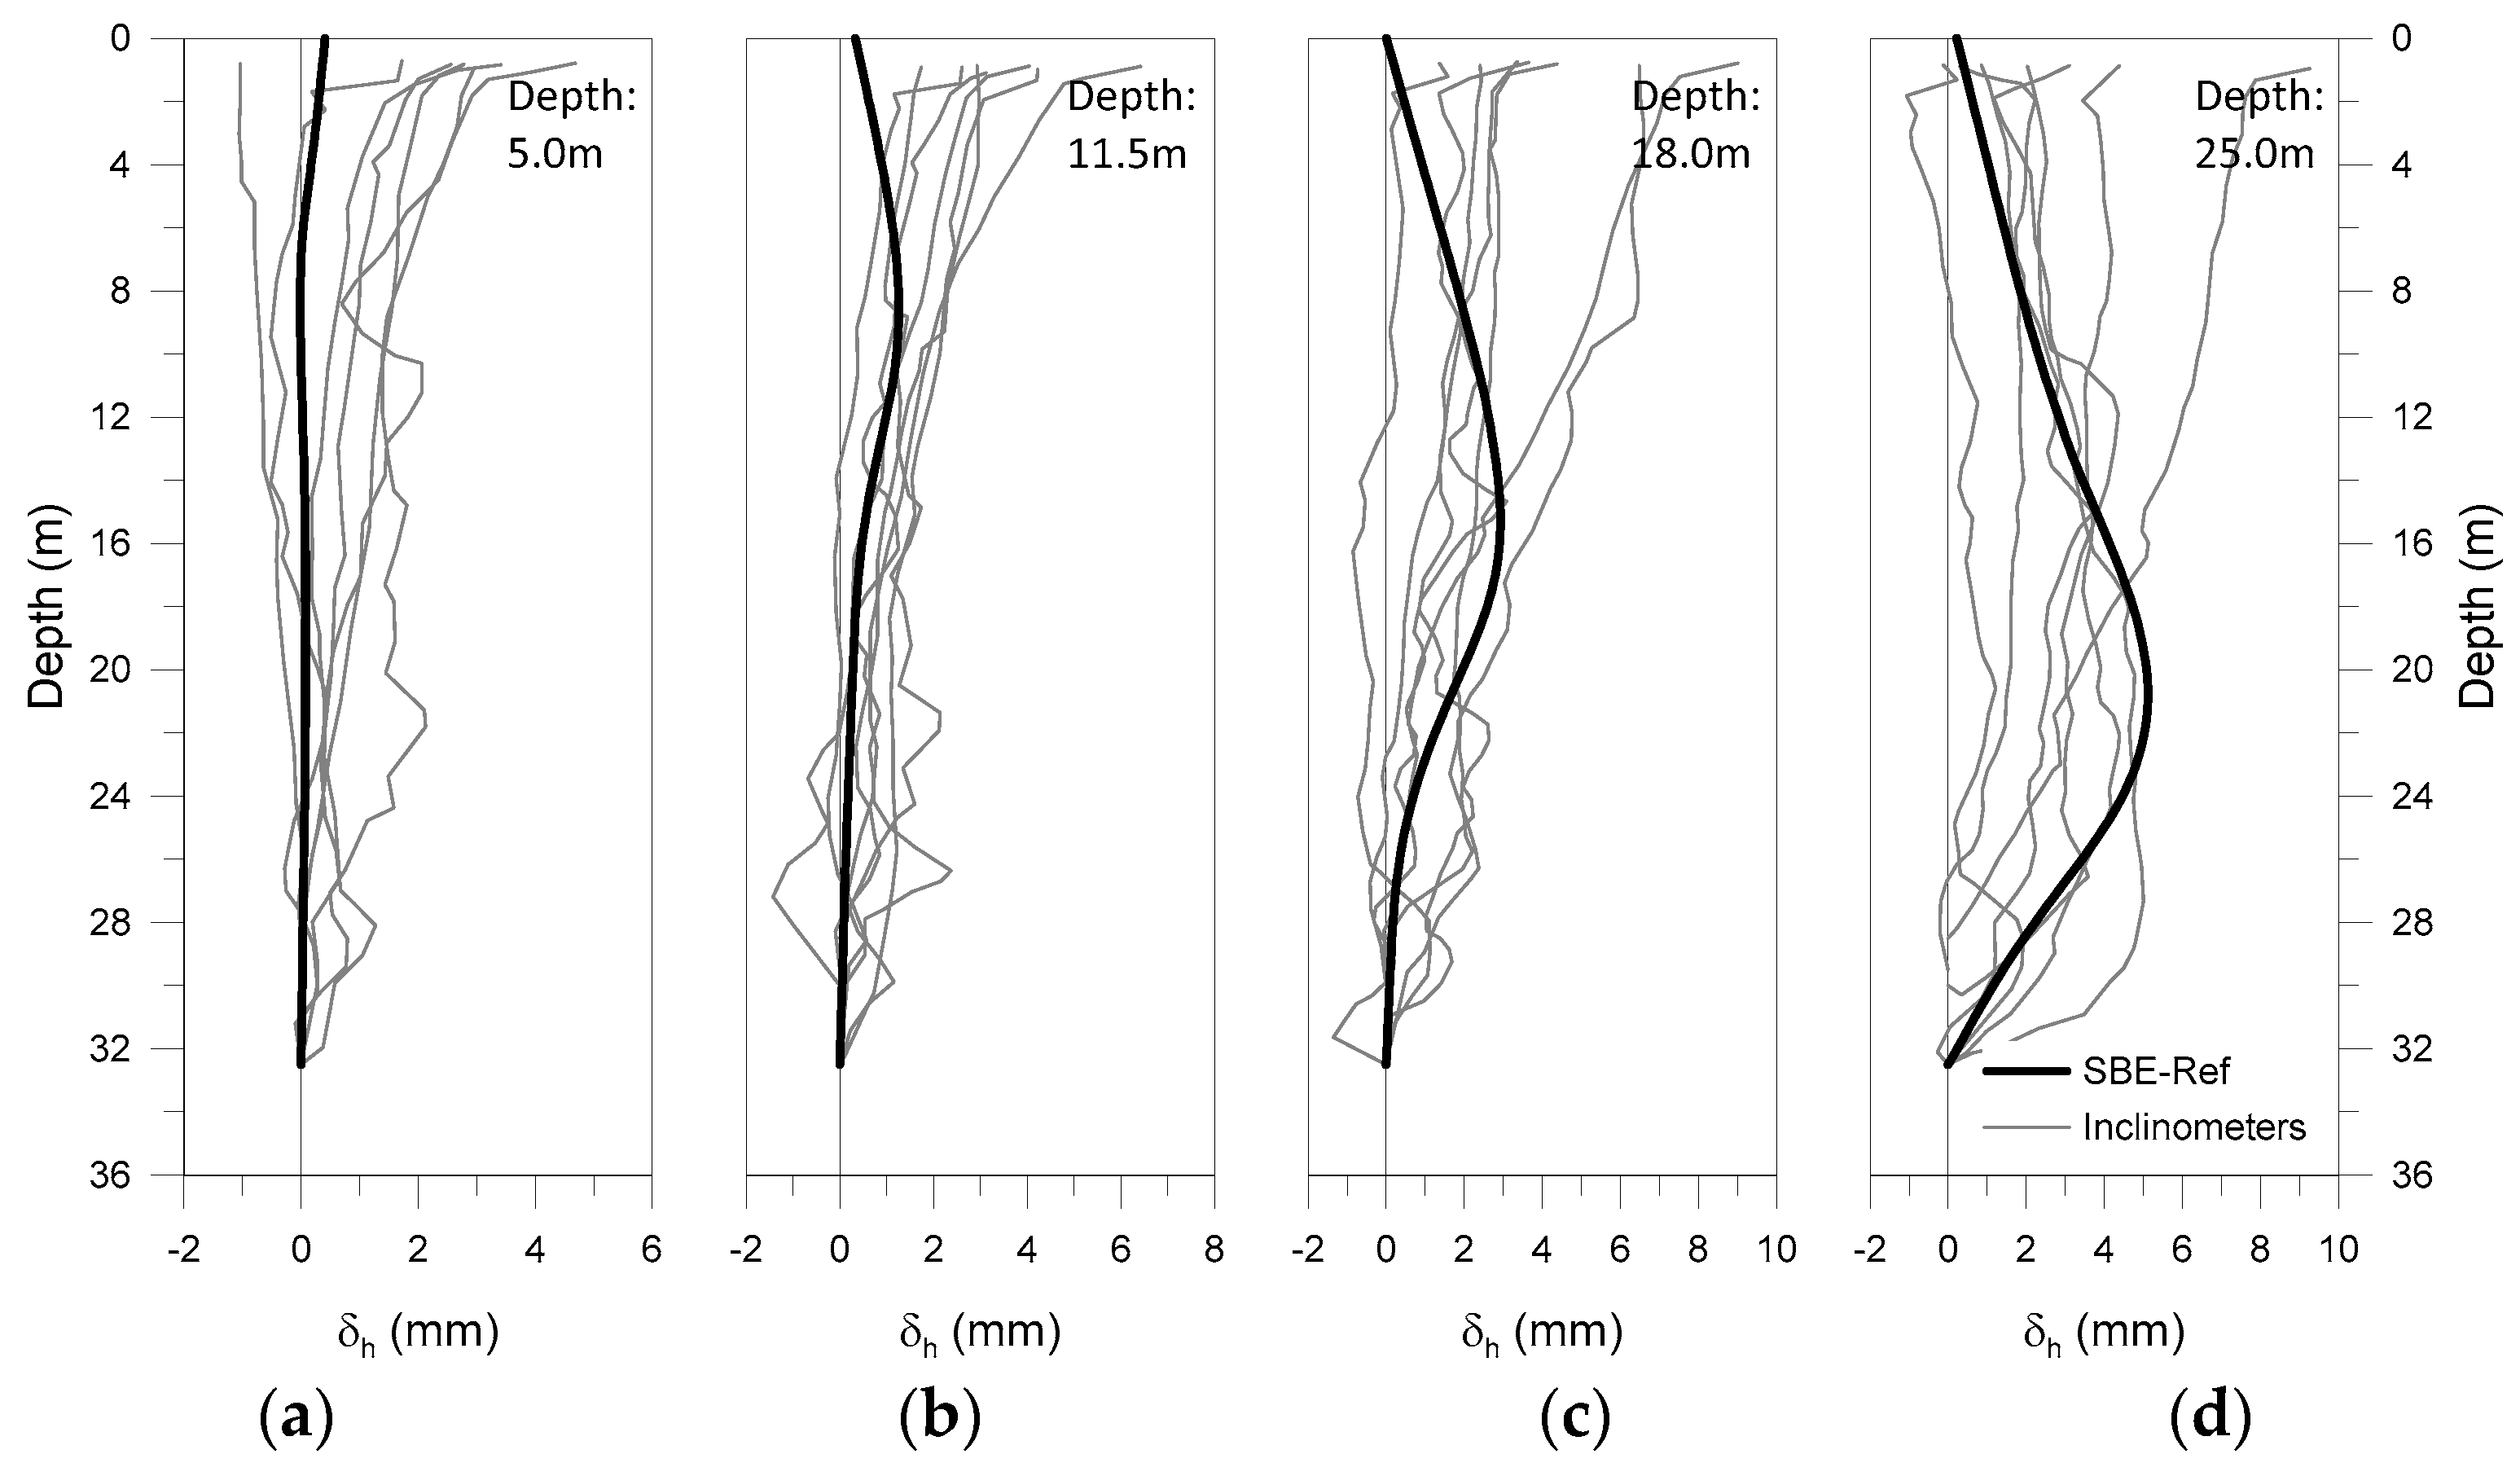
3.3. Validation of the Numerical Model against Intrumentation Data

The lateral deflections caused by the WA2 shaft excavation were measured by 10 inclinometers, 9 of which were installed in the diaphragm wall panels, while 1 was installed in the soil behind the shaft. Cabarkapa et al. [34] presented the records of the horizontal displacements at four depths of the excavation (5.0, 11.5, 18.0, and 25.0 m), as can be seen in Figure 4. Unfortunately, the data available are not directly associated with the location of the inclinometer and, consequently, only a general characterization of the shaft behavior can be performed. As expected, the movements caused by the shaft excavation increase with the depth of excavation. However, it should be noted that the registered displacements can be considered as very small, not surpassing 8 mm in any inclinometer. Prior to the construction of the ring beam (Figure 4a,b), the shaft deflected, almost like a cantilever, with its rotating point below the base of the excavation, suggesting that the panels might have deformed, at least to some extent, independently. After the construction of the ring beam (Figure 4c,d), it is possible to observe some bulging in the middle and lower portions of the diaphragm wall, while the displacements in the upper part remained approximately constant, which is typical of this type of structure [53].
Superimposed on the figure are the horizontal displacements predicted by the numerical model for the reference analysis (SBE-Ref). The results obtained for all excavation depths are in reasonable agreement with the average movement observed for the shaft. For a depth of excavation of 5.0 m, the model captures the cantilever movement, while for larger depths, bulging for the lower portion of the shaft, particularly below the ring beam, is also predicted adequately. Near the surface, the model predicts smaller displacements than those recorded, although still inside the envelope of horizontal displacements recorded. Based on the results, it can be concluded that the numerical model is able to reasonably predict the behavior of the shaft excavation.

4. Shaft Construction Methods

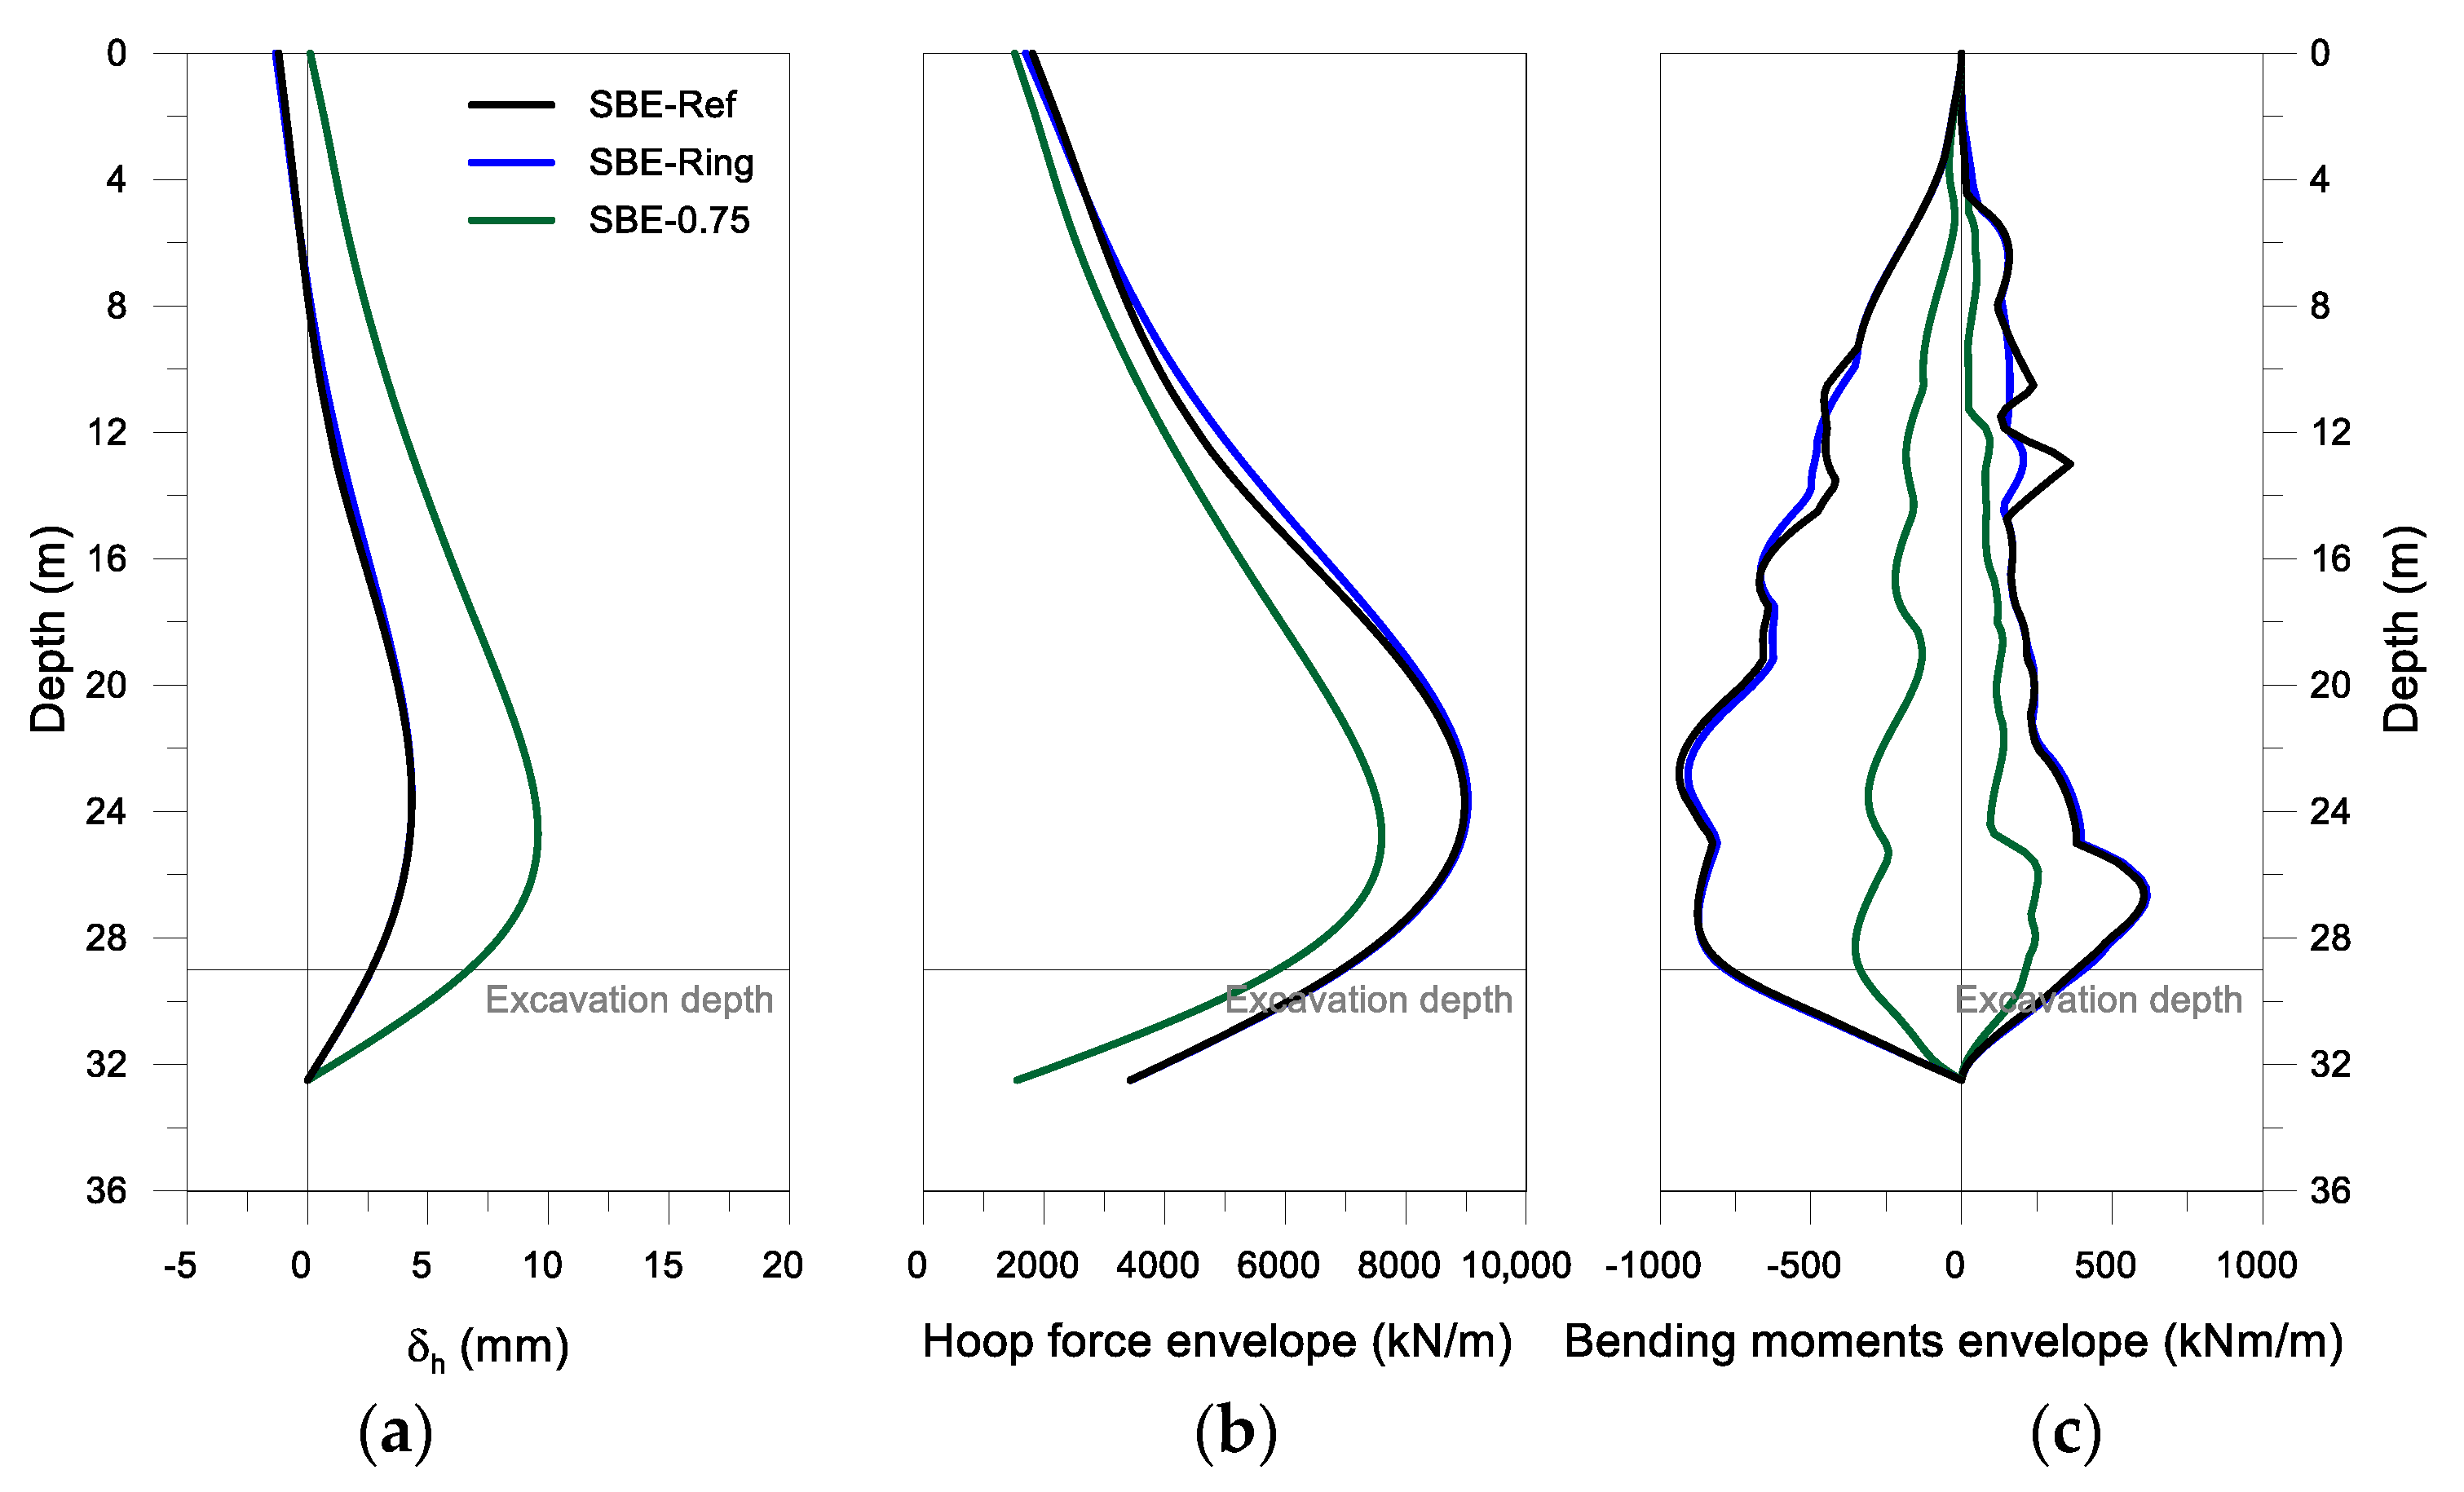
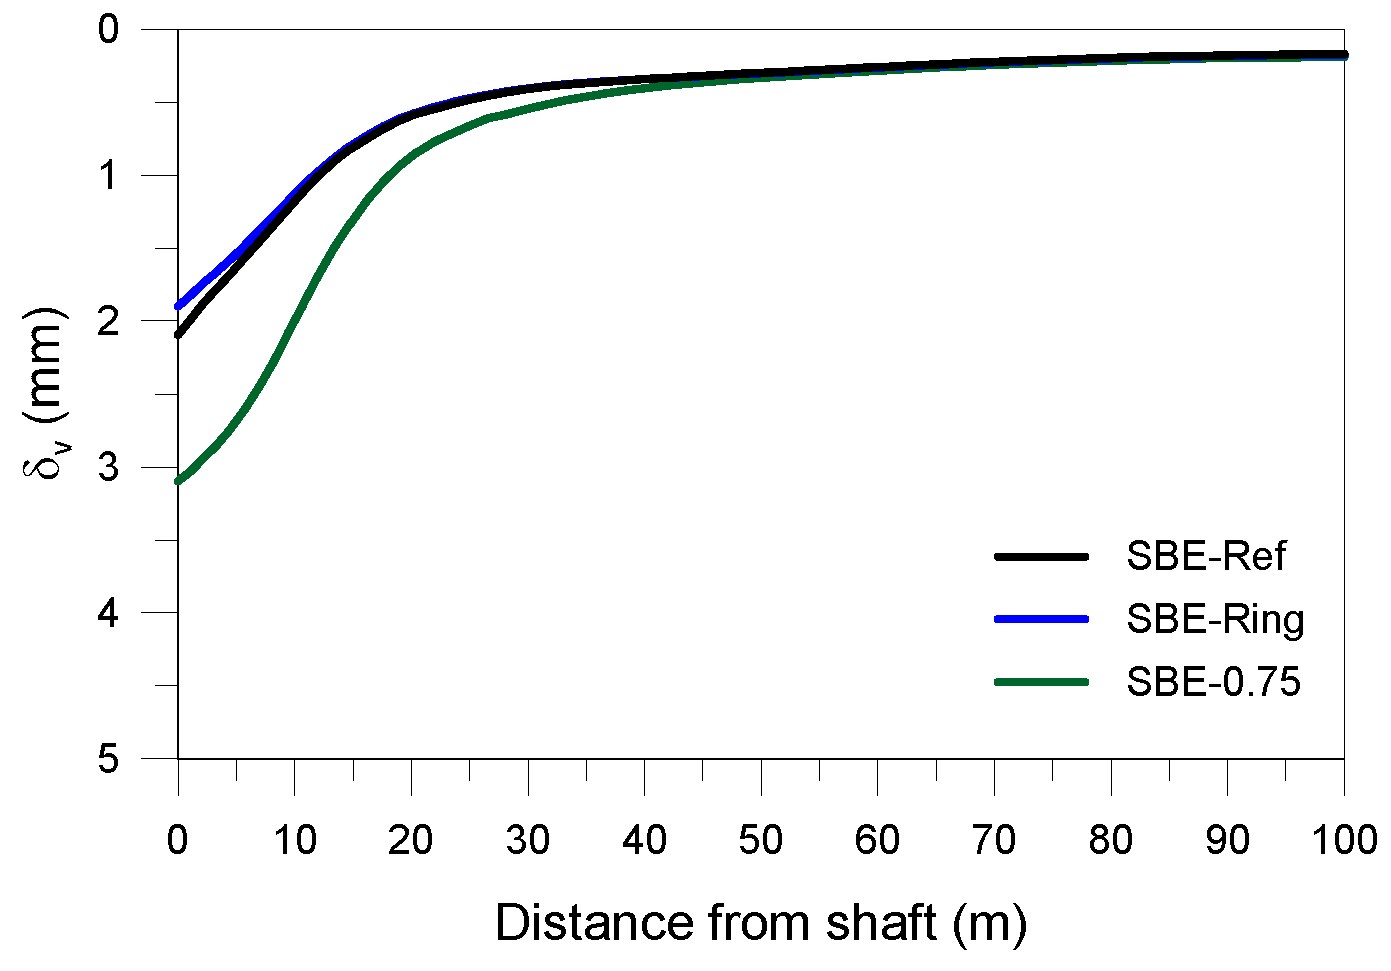
4.1. SBE Shaft Excavation

Despite the optimization of the design of the shaft support, which, accordingly with Cabarkapa et al. [34], significantly reduced the thickness of the diaphragm wall, the solution adopted for the shaft includes substantial structural elements, with its 1.5 m thick diaphragm wall complemented by the 2.5 × 2.5 m2 concrete ring beam. To evaluate to what extent the adopted support could be reduced, thus potentially leading to more sustainable designs, two additional analyses were performed. In the first one, the ring beam was not modelled (SBE-Ring), while in the second one, in addition to disregarding the ring beam, the thickness of the diaphragm wall was reduced by half to 0.75 m (SBE-0.75).
Figure 5 presents, for the last excavation stage (29 m depth), the horizontal movements and forces (in terms of hoop and bending moment envelopes) obtained in the diaphragm wall for the various SBE analyses. The results show that the ring beam has an almost negligible effect, contributing only to a slight reduction in the horizontal displacements at its location. Similarly, only local variation is predicted in terms of structural forces, with a slight increase in both hoop forces and bending moments. In contrast, the reduction in the wall thickness leads to a considerable decrease in the associated bending moments (by a factor of more than 60%) and hoop forces (factor of 15%). However, the reduction in terms of forces is associated with an increase in horizontal movements, which now reach a maximum of 9.5 mm, an increase of 120% compared with the reference analysis (4.3 mm). The influence of reducing the stiffness of the diaphragm wall by half is also noticeable in the estimated settlements at the surface (Figure 6), where an increase of about 45% is observed. Nevertheless, even after such increases, the magnitude of the ground movements induced by excavation of the shaft can still be considered small.

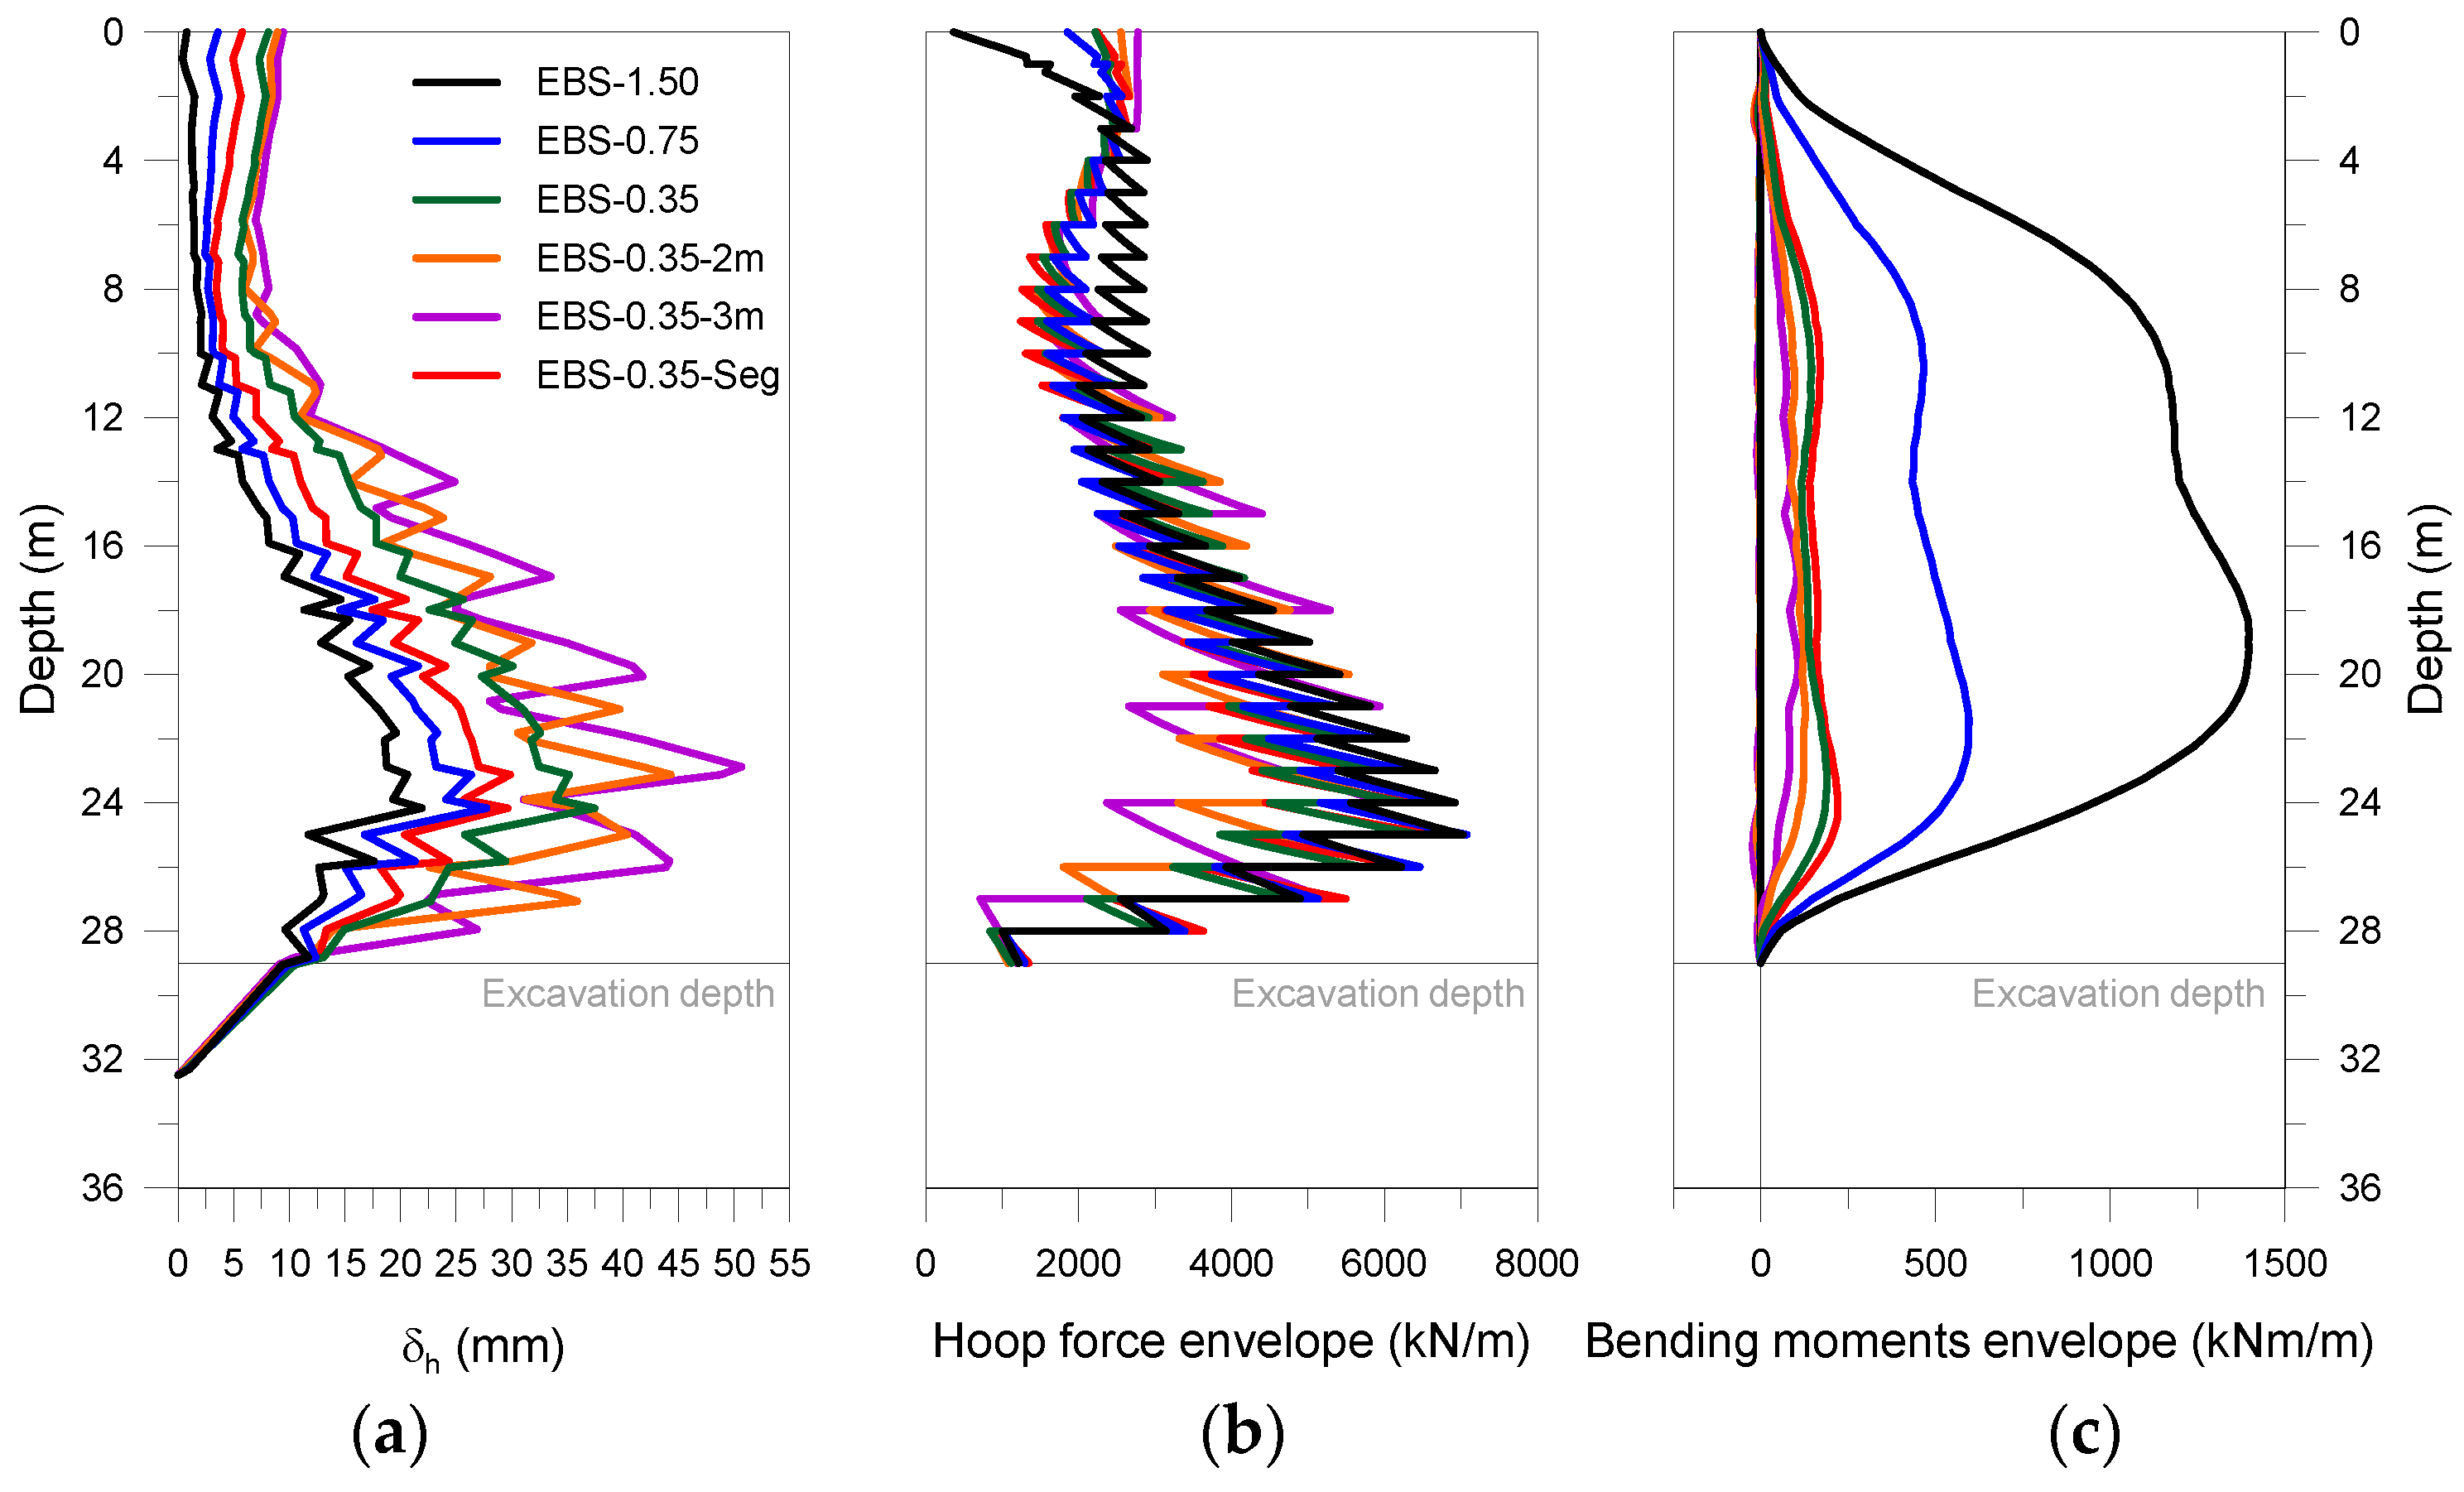
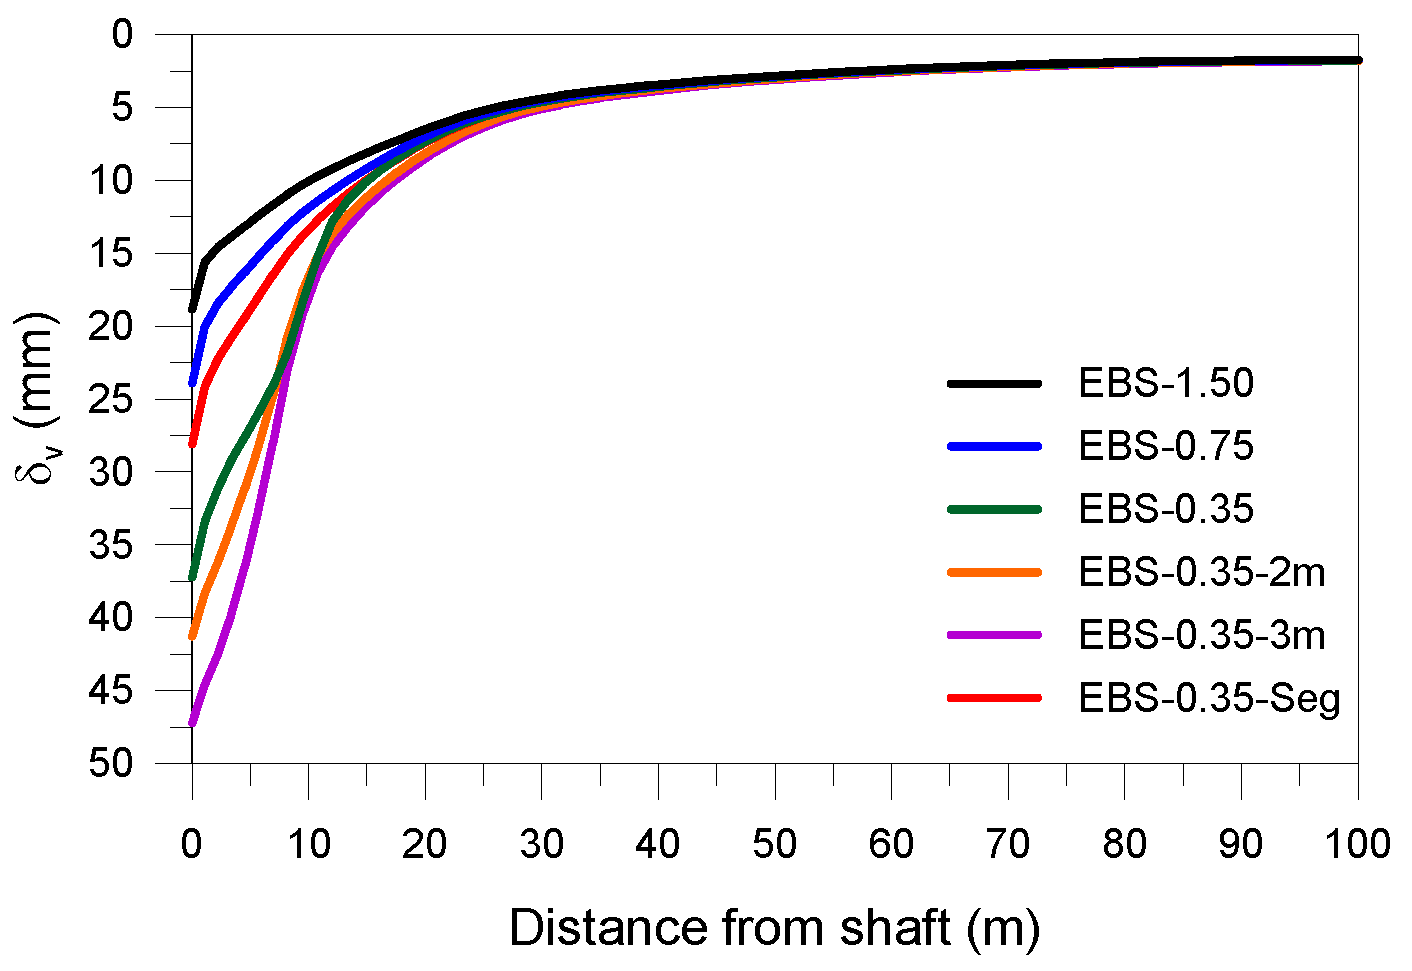
4.2. EBS Shaft Excavation

To further assess the influence of the shaft construction method, additional analyses following the principles of EBS, i.e., support only installed after excavation, were carried out. The support provided by the diaphragm wall was replaced by shotcrete or pre-cast segmental lining, which are, isolated or combined, the typical lining solutions installed in EBS methodology [35]. In the performed analyses, the thickness of the shotcrete was reduced from 1.50 m to 0.35 m, with the latter value being in agreement with the thicknesses usually employed in shafts excavated with a similar methodology and in comparable materials [35]. For the segmental lining, a standard thickness of 0.35 m was adopted [35]. For ease of comparison, the elastic properties of the shotcrete were considered equal to those of the diaphragm wall, while for the segmental lining, a Young’s modulus of 37 GPa was employed, reflecting the characteristics of prefabricated concrete. In the EBS methodology, a key factor is the size of the excavation step, since lager values of this quantity will cause larger soil decompression, leading to increased movements and instabilities (local or even global), while small steps introduce significant constraints in the excavation process, requiring higher construction time and costs, while diminishing the overall advantages of using EBS principles. To evaluate the effects of the type of support and of the excavation step, six analyses were performed, as outlined in Table 2.
To simulate the EBS analyses, the construction sequence adopted in the numerical model was modified. Hence, after the generation of the initial stress state, the first excavation step was performed. In the following stage, a new excavation step was performed while installing the lining supporting the previously excavated step. This sequence was carried out until the full excavation depth was reached. The duration of each stage was adapted so that the whole excavation process would take the same 160 days defined for the SBE analyses.
The horizontal displacements and lining forces obtained for the last excavation stage are plotted in Figure 7. As expected, the reduction in thickness of the shotcrete from 1.50 m to 0.35 m increased the horizontal displacements by a factor of 1.7, reaching a maximum of 37.5 mm in EBS-0.35 in comparison with 21.9 mm in EBS-1.50. For the analysis with a 0.75 m thick shotcrete support, the maximum displacement was 27.8 mm. In contrast, a significant reduction in the bending moments was observed, with an absolute maximum of 1395 kNm/m in the thicker case, in comparison to just 190 kNm/m in EBS-0.35. A reduction but of a smaller magnitude was also observed in the hoop forces (7025 kN/m against 6450 kN/m). The use of the stiffer segmental lining (EBS-035-Seg) leads to smaller horizontal displacements (29.9 mm) but slightly higher lining forces (6670 kN/m and 220 kNm/m) in comparison with the shotcrete analysis with the same thickness (EBS-0.35). The results also confirm that the excavation step is an important aspect. When its value is increased from 1 m to 3 m, an increase in horizontal displacements of about 35% is observed. In contrast, a reduction of approximately 7% in the hoop force and about 46% in bending moments is predicted. A similar behavior can be observed in terms of settlements (Figure 8), as a reduction in stiffness or an increase in the excavation step will increase the magnitude of the deformations, which can reach a maximum of 47 mm in the analysis where the support is less stiff and the excavation step larger (EBS-0.35-3 m).

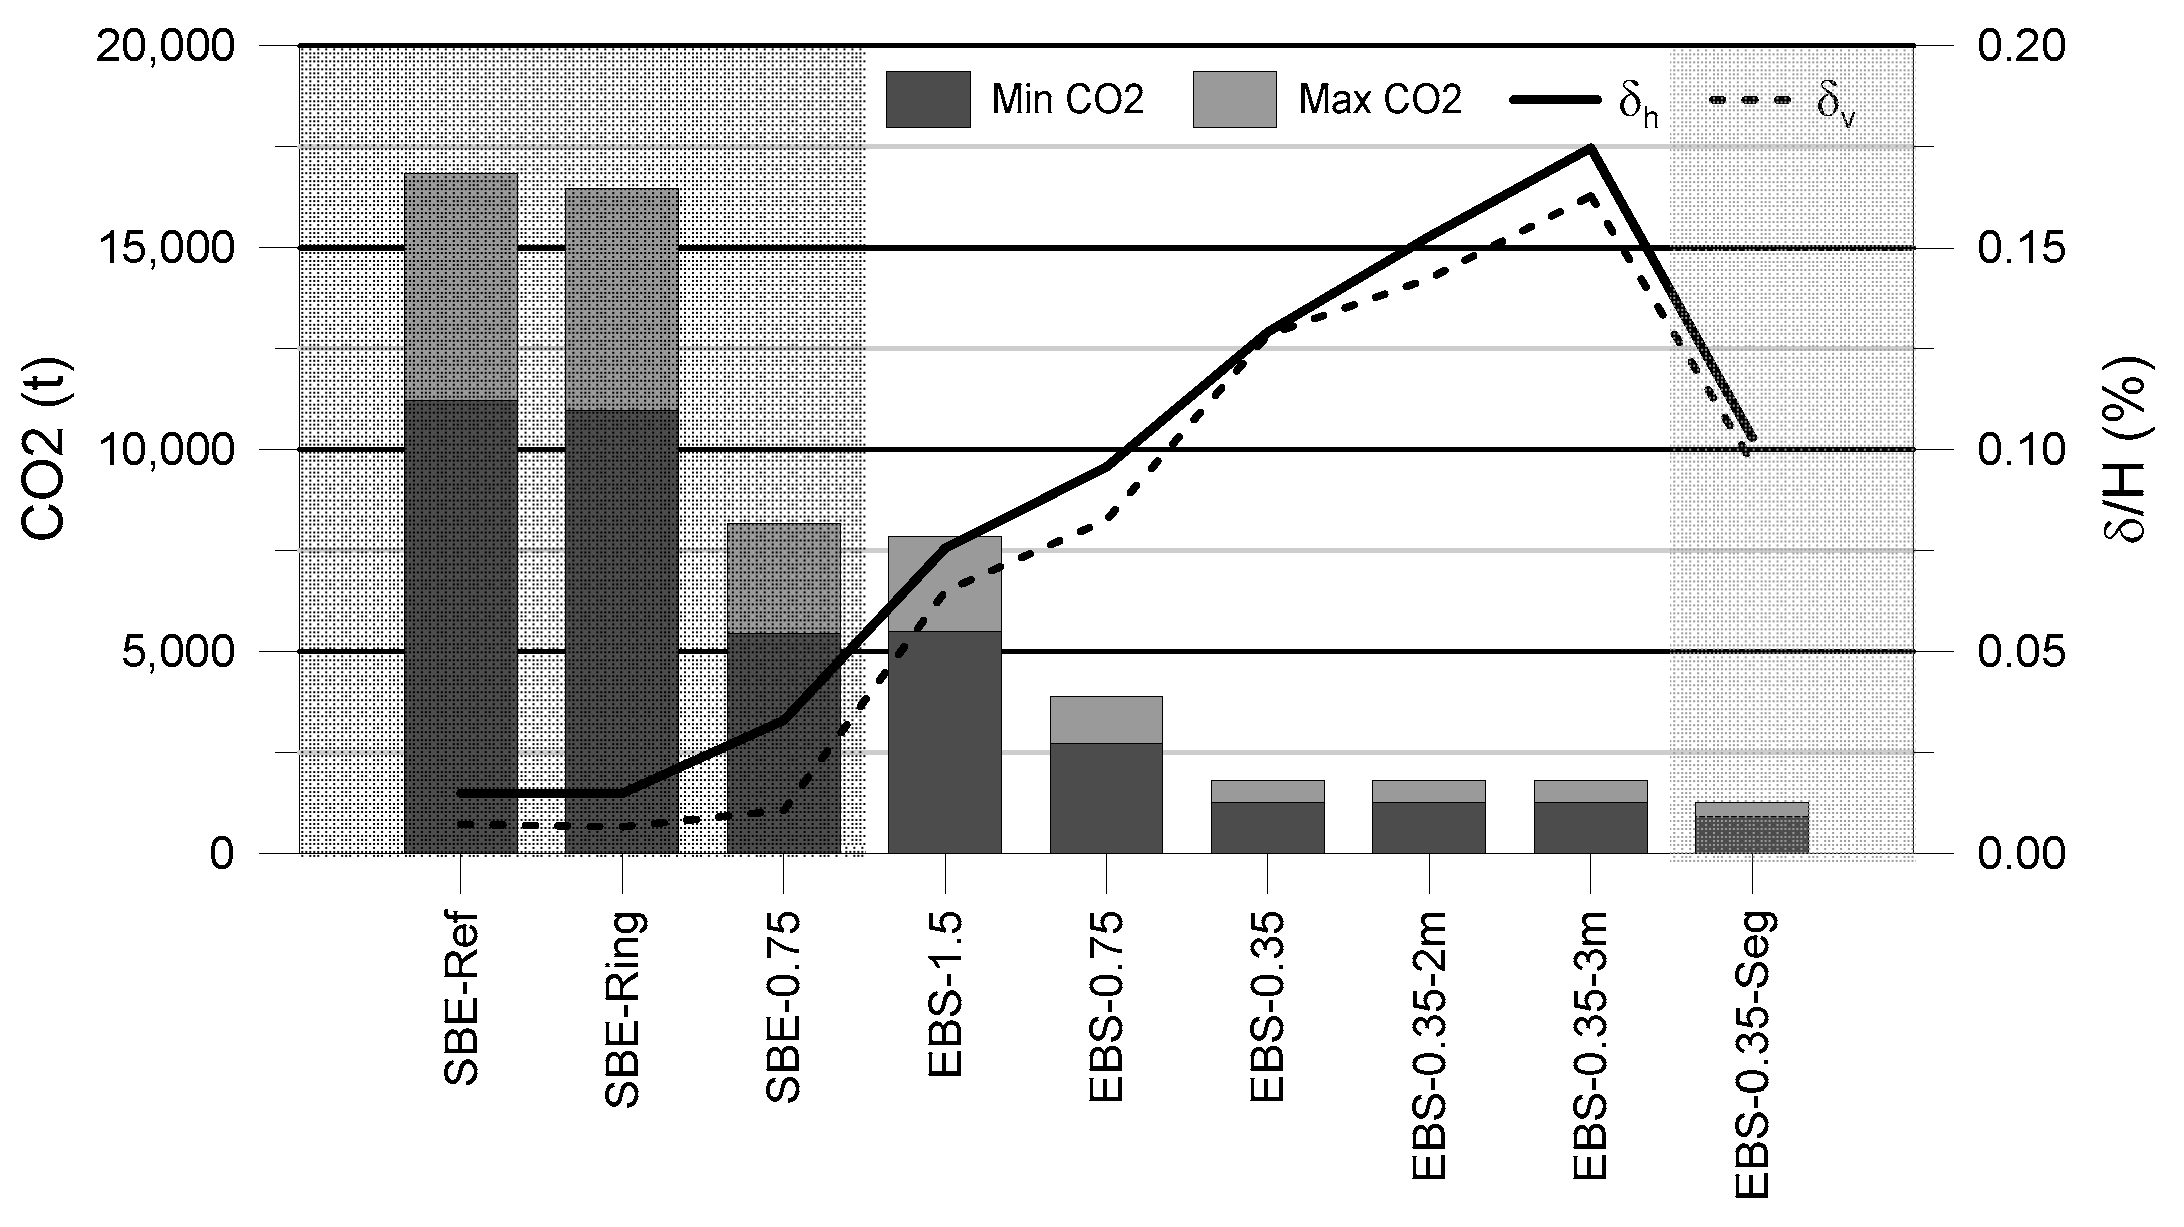
5. Discussion Regarding Sustainability

Until recently, the optimal design of a structure was defined as that which met the safety requirements at minimum cost. Due to the climate emergency, sustainability considerations have become increasingly important. Indeed, nowadays, it is indispensable to consider this perspective in the design stage, with the optimal solution being a compromise between cost and sustainability while meeting all safety requirements. However, this evaluation is difficult to perform since the quantification of costs, and particularly of CO2 emissions, at the design stage requires knowledge of several factors. These include those whose associated prices/emissions are very volatile, such as fuel and human labor, which can only be adequately defined closer to the start of construction [30]. Moreover, there is still scarce and scattered information regarding the evaluation of CO2 emissions related to specific activities, rendering their quantification even more difficult. Nevertheless, with the implementation, standardization [54,55,56], and generalization of LCA in different accessible platforms [19,20,31], this task, which is key when evaluating the sustainability of different construction processes, is becoming easier to perform. Using as a reference those platforms and previous studies [28,30], it was possible to define a reasonable range of unit CO2 emissions (i.e., in ton per m3) associated with the construction of diaphragm walls, application of shotcrete, and installation of PCL. Those values are presented in Table 3 and were used to calculate the CO2 emissions associated with each of the solutions studied in the previous section. As expected, the unit values regarding the diaphragm walls are substantially higher, being mostly affected by the steel reinforcement required. The difference between shotcrete and PCL is mostly related to the concrete composition and with the rebound of material associated with the shotcrete application, which produces higher emissions when compared to the PCL. The CO2 results presented in Table 3 reflect those differences, with the SBE analyses presenting much higher CO2 emissions, with a maximum of 16,835 t being estimated for the worst-case scenario, which corresponds to the reference analysis (SBE-Ref). In contrast, the PCL solution (EBS-Seg) is responsible for the minimum CO2 emissions (maximum of 1267 t), as can be more easily seen in Figure 9.
Also, in Table 3, the engineering requirements related to the displacements (vertical and horizontal) and the lining forces (hoop force and bending moments) are presented. According to a review performed by Long [57], all analyses met the displacement thresholds for both vertical and horizontal movements, with the highest values predicted being smaller than 0.25% and 0.20% of the shaft height (H) for vertical and horizontal displacements, respectively. However, analyses where an excavation step higher than 1 m (EBS-0.35-2 m and EBS-0.35-3 m) was applied exceeded the recommendations of Clough and O’Rourke [58], which defined a threshold of 0.15% for horizontal movements. In terms of lining forces, it is also clear that the analyses with a shotcrete thickness of 0.75 (EBS-0.75) and 1.5 m (EBS-1.50) are not acceptable since the magnitude of the predicted bending moments far exceeds the capacity of the shotcrete, which is usually just reinforced with fibers. The forces predicted for all other cases are within the capacity of the support solutions considered in this study.
Figure 9 summarizes the obtained data regarding CO2 emissions and displacements. As expected, the SBE analyses present the best performance in terms of displacements due to the initial installation of the diaphragm wall (i.e., prior to any excavation taking place) but have a very detrimental impact in terms of CO2 emissions. In contrast, the EBS methodology is much more environmentally friendly, particularly if PCL is employed, but it induces higher deformations, which increase with a reduction in the stiffness of the lining and/or with an increase in the excavation step. As a result, and given the small displacements precited in all cases, it would have been more acceptable to use EBS methods to construct the shaft or, at least, to reduce the thickness of the diaphragm wall to 0.75 m, which would itself lead to a reduction of 50% in the associated CO2 emissions. Although the economical aspect was not analyzed in this study, it should be mentioned that, typically, the costs and the duration of works associated with EBS methods are smaller than those associated with SBE, which would make the decision to adopt EBS even more suitable for the present case.

6. Conclusions

Despite its complexity, the evaluation of sustainability at the design stage for all geotechnical works is becoming imperative. However, its inclusion at an early stage of the design process can be difficult, and often the best solution to achieve sustainability is to optimize the design by comparing different construction solutions using, as a reference, previous case studies. By performing back-analysis studies with adequately calibrated and validated numerical models, it is possible to assess the advantages and shortcomings of different design and construction methods. The outcome of such studies addresses UN-SDGs 9 (Industry, Innovation and Infrastructure) and 13 (Climate Change) and can be used as a reference in the development of future infrastructure. An example of this methodology is shown in this paper, where the excavation of the WA2 shaft was analyzed in detail. After adequate calibration based on field and laboratory testing and validation against monitoring data, the numerical model enabled the assessment of the potential impact of the selected excavation method (SBE or EBS). The results show that, while the excavation method employed (SBE) had the best performance in terms of minimizing the displacements in the ground, it had the greatest environmental impact in terms of CO2 emissions. In contrast, the EBS analyses, particularly when PCL was installed, had the smallest CO2 emissions, and, although the displacements were higher than in the SBE analyses, this could represent an acceptable engineering solution, meeting commonly accepted safety thresholds. As a result, it is clear that the characteristics of the lining of the shaft could have been optimized, resulting in a reduction in CO2 emissions by at least 50% without compromising the safety of the construction.

Author Contributions

Conceptualization, A.M.G.P. and L.R.; methodology, A.M.G.P.; software, A.M.G.P.; validation, L.R. and J.A.e.S.; writing—original draft preparation, A.M.G.P.; writing—review and editing, L.R. and J.A.e.S. All authors have read and agreed to the published version of the manuscript.

Funding

This work was partly financed by FCT/MCTES through national funds (PIDDAC) under the R&D Unit Institute for Sustainability and Innovation in Structural Engineering (ISISE), under reference UIDB/04029/2020, and under the Associate Laboratory Advanced Production and Intelligent Systems ARISE under reference LA/P/0112/2020.

Institutional Review Board Statement

Not applicable.

Informed Consent Statement

Not applicable.

Data Availability Statement

The raw data supporting the conclusions of this article will be made available by the authors on request.

Conflicts of Interest

Author Lucas Repsold was employed by the company COBA Group. The remaining authors declare that the research was conducted in the absence of any commercial or financial relationships that could be construed as a potential conflict of interest.

Appendix A

The model parameters adopted for all DBC units employed in the numerical analyses are presented in Table A1. Figure A1 compares the measured and simulated e σ v curves obtained for an oedometer test performed on a UBkBC sample [59]. The model, apart from the initial part of the curve, which is usually affected by soil disturbance, predicts with reasonable accuracy the reduction in volume with an increase in vertical stress and is also capable of accurately reproducing the unloading performed at the end of the test. Figure A2 compares the measured and simulated effective stress paths, stress–strain curves, excessive pore water pressure–strain curves, and undrained Young’s modulus degradation obtained for conventional undrained compression and extension triaxial tests performed in three of the four units of DBC (no results were available for the Lower Black Boulder Clay) [37]. The model predicts, with good accuracy, the stress path and the mobilization of deviatoric stresses for all units, as well as the evolution of excess pore pressures from initially positive to negative at high strains, as would be expected for an over-consolidated clay. The shear stiffness degradation is also accurately captured by the model in all cases reproduced.
Table A1. Parameters adopted for reproducing the stress–strain behavior of the Dublin Boulder Clays units.
ComponentParameterUBrBCUBkBCLBrBCLBkBC
Strengthϕ’ (°)36.036.036.036.0
Compression lineν11.5651.4801.5651.480
λ0.040.030.040.03
Swelling lineκ0.0020.0020.0020.002
Hvorslev surfaceαHV1.01.01.01.0
n0.80.80.80.8
βHV0.050.10.050.1
m1.51.21.51.2
Shear stiffnessG0 (MPa)220800850850
mG0.00.30.30.3
a3.5 × 10−50.1 × 10−53.5 × 10−50.1 × 10⁻⁵
b1.01.71.01.7
RG,min0.020.020.020.02
Figure A1. Experimental and modelled oedometer test of UBkBC.
Applsci 14 04476 g0a1
Figure A2. Experimental and modelled triaxial tests—effective stress paths; stress-strain curves; excessive pore water pressure-strain curves; undrained modulus degradation: (a) UBrBC; (b) UBkDC; (c) LBrDC.
Applsci 14 04476 g0a2

References

  1. Project Everyone. The Global Goals. Available online: https://www.globalgoals.org/ (accessed on 10 April 2024).
  2. UNFCCC. The Paris Agreement. Available online: https://unfccc.int/process-and-meetings/the-paris-agreement (accessed on 10 April 2024).
  3. Lehne, J.; Preston, F. Making concrete change. In Innovation in Low-Carbon Cement and Concrete; Chatham House: London, UK, 2018. [Google Scholar]
  4. Monteiro, P.J.M.; Miller, S.A.; Horvath, A. Towards sustainable concrete. Nat. Mater. 2017, 16, 698–699. [Google Scholar] [CrossRef] [PubMed]
  5. Worrell, E.; Price, L.; Martin, N.; Hendriks, C.; Ozawa-Meida, L. Carbon Dioxide Emission from the Global Cement Industry. Annu. Rev. Energy Env. 2001, 26, 303–329. [Google Scholar] [CrossRef]
  6. Flower, D.J.M.; Sanjayan, J.G. Green house gas emissions due to concrete manufacture. Int. J. Life Cycle Assess. 2007, 12, 282–288. [Google Scholar] [CrossRef]
  7. Hasanbeigi, A.; Price, L.; Lin, E. Emerging energy-efficiency and CO2 emission-reduction technologies for cement and concrete production: A technical review. Renew. Sustain. Energy Rev. 2012, 16, 6220–6238. [Google Scholar] [CrossRef]
  8. Adesina, A. Recent advances in the concrete industry to reduce its carbon dioxide emissions. Environ. Chall. 2020, 1, 100004. [Google Scholar] [CrossRef]
  9. Purnell, P. The carbon footprint of reinforced concrete. Adv. Cem. Res. 2013, 25, 362–368. [Google Scholar] [CrossRef]
  10. IEA. Technology Roadmap—Low-Carbon Transition in the Cement Industry; IEA: Paris, France, 2014. [Google Scholar]
  11. Wu, P.; Song, Y.; Zhu, J.; Chang, R. Analyzing the influence factors of the carbon emissions from China’s building and construction industry from 2000 to 2015. J. Clean. Prod. 2019, 221, 552–566. [Google Scholar] [CrossRef]
  12. Chen, S.; Teng, Y.; Zhang, Y.; Leung, C.K.Y.; Pan, W. Reducing embodied carbon in concrete materials: A state-of-the-art review. Resour. Conserv. Recycl. 2023, 188, 106653. [Google Scholar] [CrossRef]
  13. Damtoft, J.S.; Lukasik, J.; Herfort, D.; Sorrentino, D.; Gartner, E.M. Sustainable development and climate change initiatives. Cem. Concr. Res. 2008, 38, 115–127. [Google Scholar] [CrossRef]
  14. Tait, M.W.; Cheung, W.M. A comparative cradle-to-gate life cycle assessment of three concrete mix designs. Int. J. Life Cycle Assess. 2016, 21, 847–860. [Google Scholar] [CrossRef]
  15. Grist, E.R.; Paine, K.A.; Heath, A.; Norman, J.; Pinder, H. The environmental credentials of hydraulic lime-pozzolan concretes. J. Clean. Prod. 2015, 93, 26–37. [Google Scholar] [CrossRef]
  16. Jannik, G.; John, B.; Peter, T. Scenario analysis of embodied greenhouse gas emissions in UK construction. Proc. Inst. Civ. Eng. Eng. Sustain. 2018, 171, 178–190. [Google Scholar] [CrossRef]
  17. Guggemos, A.A.; Horvath, A. Decision-support tool for assessing the environmental effects of constructing commercial buildings. J. Archit. Eng. 2006, 12, 187–195. [Google Scholar] [CrossRef]
  18. Basu, D.; Misra, A.; Puppala, A.J. Sustainability and geotechnical engineering: Perspectives and review. Can. Geotech. J. 2015, 52, 96–113. [Google Scholar] [CrossRef]
  19. Song, X.; Carlsson, C.; Kiilsgaard, R.; Bendz, D.; Kennedy, H. Life Cycle Assessment of Geotechnical Works in Building Construction: A Review and Recommendations. Sustainability 2020, 12, 8442. [Google Scholar] [CrossRef]
  20. Kendall, A.; Raymond, A.J.; Tipton, J.; DeJong, J.T. Review of life-cycle-based environmental assessments of geotechnical systems. Proc. Inst. Civ. Eng. Eng. Sustain. 2018, 171, 57–67. [Google Scholar] [CrossRef]
  21. Luo, W.; Sandanayake, M.; Zhang, G. Direct and indirect carbon emissions in foundation construction—Two case studies of driven precast and cast-in-situ piles. J. Clean. Prod. 2019, 211, 1517–1526. [Google Scholar] [CrossRef]
  22. Sandanayake, M.; Zhang, G.; Setunge, S. Environmental emissions at foundation construction stage of buildings—Two case studies. Build. Environ. 2016, 95, 189–198. [Google Scholar] [CrossRef]
  23. Berndt, M.L. Influence of concrete mix design on CO2 emissions for large wind turbine foundations. Renew. Energy 2015, 83, 608–614. [Google Scholar] [CrossRef]
  24. Inui, T.; Chau, C.; Soga, K.; Nicolson, D.; O’Riordan, N. Embodied Energy and Gas Emissions of Retaining Wall Structures. J. Geotech. Geoenviron. Eng. 2011, 137, 958–967. [Google Scholar] [CrossRef]
  25. Damians, I.P.; Bathurst, R.J.; Adroguer, E.G.; Josa, A.; Lloret, A. Environmental assessment of earth retaining wall structures. Environ. Geotech. 2017, 4, 415–431. [Google Scholar] [CrossRef]
  26. Pons, J.J.; Penadés-Plà, V.; Yepes, V.; Martí, J.V. Life cycle assessment of earth-retaining walls: An environmental comparison. J. Clean. Prod. 2018, 192, 411–420. [Google Scholar] [CrossRef]
  27. Chau, C.; Soga, K.; O’Riordan, N.; Nicholson, D. Embodied energy evaluation for sections of the UK Channel Tunnel rail link. Proc. Inst. Civ. Eng. Geotech. Eng. 2012, 165, 65–81. [Google Scholar] [CrossRef]
  28. Sauer, J. Ecological Considerations on the Sustainability of Tunnel Structures in the Transport Infrastructure. Ph.D. Thesis, Technical University of Munich, Munich, Germany, 2016. [Google Scholar]
  29. Aldrian, W.; Bantle, A.; Juhart, J. CO2 reduction in tunnel construction from a material technology point of view. Geomech. Tunn. 2022, 15, 799–810. [Google Scholar] [CrossRef]
  30. Hu, H.; Li, C.; Xu, Z.; Gui, Y.; Zong, L.; Shi, J. Calculation example of full cycle carbon emission of super deep foundation pit and carbon reduction measures. Low-Carbon Mater. Green Constr. 2023, 1, 11. [Google Scholar] [CrossRef]
  31. Von der Tann, L.; Størdal, I.F.; Ritter, S.; Feizi, S. First steps in the development of standardised processes for life cycle assessments of geotechnical works. IOP Conf. Ser. Earth Environ. Sci. 2022, 1122, 012046. [Google Scholar] [CrossRef]
  32. Dublin Tunnel. About the Dublin Tunnel. Available online: https://dublintunnel.ie/about-dublin-tunnel/ (accessed on 10 April 2024).
  33. Faustin, N.; Elshafie, M.; Mair, R. Modelling the excavation of elliptical shafts in the geotechnical centrifuge. In Physical Modelling in Geotechnics; CRC Press: Boca Raton, FL, USA, 2018; Volume 2, pp. 791–796. [Google Scholar]
  34. Cabarkapa, Z.; Milligan, G.W.E.; Menkiti, C.O.; Murphy, J.; Potts, D.M. Design and performance of a large diameter shaft in Dublin Boulder Clay. In Proceedings of the BGA International Conference on Foundations: Innovations, Observations, Design and Practice, Dundee, UK, 2–5 September 2003; pp. 175–185. [Google Scholar]
  35. Faustin, N.E.; Elshafie, M.Z.; Mair, R.J. Case studies of circular shaft construction in London. Proc. Inst. Civ. Eng. Ground Improv. 2018, 171, 391–404. [Google Scholar] [CrossRef]
  36. Skipper, J.; Follett, B.; Menkiti, C.; Long, M.; Clark-Hughes, J. The engineering geology and characterization of Dublin Boulder Clay. Q. J. Eng. Geol. Hydrogeol. 2005, 38, 171–187. [Google Scholar] [CrossRef]
  37. Long, M.; Menkiti, C.O. Geotechnical properties of Dublin boulder clay. Géotechnique 2007, 57, 595–611. [Google Scholar] [CrossRef]
  38. Bentley Systems. CONNECT Edition V22.02 PLAXIS 2D—Reference Manual; Bentley Systems: Exton, PA, USA, 2022. [Google Scholar]
  39. Dublin Tunnel. Press. Available online: https://dublintunnel.ie/wp-content/uploads/pdf/dublin-tunnel-press-pack.pdf (accessed on 10 April 2024).
  40. Kovacevic, N.; Miligan, G.W.E.; Menkiti, C.O.; Long, M.; Potts, D.M. Finite element analyses of steep man-made cuts in Dublin boulder clay. Can. Geotech. J. 2008, 45, 549–559. [Google Scholar] [CrossRef]
  41. Kovacevic, N.; Menkiti, C.O.; Long, M.; Potts, D.M. Finite element analyses of a cantilever wall in Dublin Boulder Clay. In Geotechnical Engineering for Infrastructure and Development; Emerald Publishing Ltd.: Bingley, UK, 2015; pp. 3983–3988. [Google Scholar]
  42. Roscoe, K.H.; Burland, J. On the generalized stress-strain behaviour of wet clay. In Engineering Plasticity; Cambridge University Press: Cambridge, UK, 1968; pp. 539–609. [Google Scholar]
  43. Tsiampousi, A.; Zdravković, L.; Potts, D.M. A new Hvorslev surface for critical state type unsaturated and saturated constitutive models. Comput. Geotech. 2013, 48, 156–166. [Google Scholar] [CrossRef]
  44. Taborda, D.M.G.; Potts, D.M.; Zdravković, L. On the assessment of energy dissipated through hysteresis in finite element analysis. Comput. Geotech. 2016, 71, 180–194. [Google Scholar] [CrossRef]
  45. Tsiampousi, A.; Kontoe, S.; Taborda, D.M.G. IC MAGE Model 06—Modified Cam-Clay Model with a Non-Linear Hvorslev Surface and Isotropic Small Strain Shear Stiffness, Version 1.6; Zenodo: Geneva, Switzerland, 2023. [Google Scholar] [CrossRef]
  46. Sloan. Substepping schemes for the numerical integration of elastoplastic stress–strain relations. Int. J. Numer. Methods Eng. 1987, 24, 893–911. [Google Scholar] [CrossRef]
  47. Sloan, S.W.; Abbo, A.J.; Sheng, D. Refined explicit integration of elastoplastic models with automatic error control. Eng. Comput. 2001, 18, 121–194. [Google Scholar] [CrossRef]
  48. Taborda, D.M.G.; Kontoe, S.; Tsiampousi, A. IC MAGE UMIP—Universal Model Interface for PLAXIS, Version 3.5; Zenodo: Geneva, Switzerland, 2023. [Google Scholar] [CrossRef]
  49. Loukidis, D.; Salgado, R. Modeling sand response using two-surface plasticity. Comput. Geotech. 2009, 36, 166–186. [Google Scholar] [CrossRef]
  50. Gallipoli, D.; D’Onza, F.; Wheeler, S.J. A sequential method for selecting parameter values in the Barcelona basic model. Can. Geotech. J. 2010, 47, 1175–1186. [Google Scholar] [CrossRef]
  51. Pedro, A.M.G.; Zdravković, L.; Potts, D.; Almeida e Sousa, J. Derivation of model parameters for numerical analysis of the Ivens shaft excavation. Eng. Geol. 2017, 217, 49–60. [Google Scholar] [CrossRef]
  52. Donohue, S.; Gavin, K.; Long, M.; O’Connor, P. Gmax from multichannel analysis of surface waves for Dublin boulder clay. In Proceedings of the 13th European Conference on Soil Mechanics and Geotechnical Engineering, Prague, Czech Republic, 3 September 2003; Volume 2, pp. 515–520. [Google Scholar]
  53. Pedro, A.; Zdravkovic, L.; Potts, D.; Sousa, J.A.E. Numerical modelling of the Ivens shaft construction in Lisbon, Portugal. In Geotechnical Engineering; Emerald Publishing Ltd.: Bingley, UK, 2019; Volume 172, pp. 263–282. [Google Scholar] [CrossRef]
  54. ISO 14044:2006; Environmental Management—Life Cycle Assessment—Requirement and Guidelines. International Organization for Standardization: Geneva, Switzerland, 2006.
  55. ISO 14040:2006; Environmental Management—Life Cycle Assessment—Principles and Framework. International Organization for Standardization:: Geneva, Switzerland, 2006.
  56. EN 15804:2012+A2:2019; Sustainability of Construction Works—Environmental Product Declarations—Core Rules for the Product Category of Construction Products. iTeh Standards: Etobicoke, ON, Canada, 2019.
  57. Long, M. Database for retaining wall and ground movements due to deep excavations. J. Geotech. Geoenviron. bEng. 2001, 127, 203–224. [Google Scholar] [CrossRef]
  58. Clough, G.W.; O’Rourke, T.D. Construction induced movements of insitu walls. In Proceedings of the Design and Performance of Earth Retaining Structures; American Society of Civil Engineers: Reston, VA, USA, 1990; pp. 439–470. [Google Scholar]
  59. Brangan, C. Behaviour of Deep Excavation in Dublin Glacial Till. Ph.D. Thesis, Department of Civil Engineering, University College Dublin, Dublin, Ireland, 2007. [Google Scholar]
Figure 1. Scheme of the stratigraphy and geometry of WA2 shaft.
Applsci 14 04476 g001
Figure 2. Mesh employed in the SBE analyses.
Applsci 14 04476 g002
Figure 3. Experimental and interpreted (a) Gmax and (b) Su profiles.
Applsci 14 04476 g003
Figure 4. Comparison of predicted and observed diaphragm wall deflections at different shaft excavation depths: (a) 5.0 m; (b) 11.5 m; (c) 18.0 m; (d) 25.0 m.
Applsci 14 04476 g004
Figure 5. Influence of the SBE shaft excavation method: (a) horizontal displacements; (b) hoop force; (c) bending moments.
Applsci 14 04476 g005
Figure 6. Influence of the SBE shaft excavation method on the settlements.
Applsci 14 04476 g006
Figure 7. Influence of the EBS shaft excavation method: (a) horizontal displacements; (b) hoop force; (c) bending moments.
Applsci 14 04476 g007
Figure 8. Influence of the EBS shaft excavation method on the settlements.
Applsci 14 04476 g008
Figure 9. Comparison of the results of all analysis.
Applsci 14 04476 g009
Table 1. General soil parameters adopted in the analysis.
Materialγ (kN/m3)K0k (m/s)
UBrBC21.01.501 × 10−8
UBkBC22.51.501 × 10−9
LBrBC22.01.351 × 10−8
LBkBC22.51.201 × 10−9
Limestone26.01.001 × 10−9
Table 2. Details of the EBS analyses.
DesignationThickness (m)Excavation Step (m)E (GPa)
EBS-1.501.51.025
EBS-0.750.751.025
EBS-0.350.351.025
EBS-0.35-2 m0.352.025
EBS-0.35-3 m0.353.025
EBS-0.35-Seq0.351.037
Table 3. Summary of the results.
AnalysisCO2 EmissionsDisplacementsLining Forces
Volume
(m3)
CO2
(t CO2/m3)
CO2
(t CO2)
δ
h/H(%)
δ
v/H(%)
Hoop
Force
Bending
Moments
SBE-Ref16,0330.70–1.0511,223–16,8350.0150.007AA
SBE-Ring15,6750.70–1.0510,972–16,4590.0150.007AA
SBE-0.7577860.70–1.055450–81750.0330.011AA
EBS-1.5015,6750.35–0.505486–78370.0760.065ANA
EBS-0.7577860.35–0.502725–38930.0960.083ANA
EBS-0.3536210.35–0.501267–18100.1290.128AA
EBS-0.35-2 m36210.35–0.501267–18100.1530.142AA
EBS-0.35-3 m36210.35–0.501267–18100.1750.163AA
EBS-0.35-Seq36210.25–0.35905–12670.1030.097AA
A—Acceptable; NA—Not Acceptable.
Disclaimer/Publisher’s Note: The statements, opinions and data contained in all publications are solely those of the individual author(s) and contributor(s) and not of MDPI and/or the editor(s). MDPI and/or the editor(s) disclaim responsibility for any injury to people or property resulting from any ideas, methods, instructions or products referred to in the content.

