Article

Risk of Tree Fall on High-Traffic Roads: A Case Study of the S6 in Poland

1
Department of Geodesy and Offshore Survey, Maritime University of Szczecin, Waly Chrobrego 1-2, 70-500 Szczecin, Poland
2
Department of Agrobiotechnology, Faculty of Mechanical Engineering, Koszalin University of Technology, Raclawicka 15-17, 75-620 Koszalin, Poland
3
Department of Forest Resources Management, Faculty of Forestry, University of Agriculture in Krakow, Al. 29 Listopada 46, 31-425 Krakow, Poland
4
Institute of Geospatial Engineering and Geodesy, Faculty of Civil Engineering and Geodesy, Military University of Technology, 00-908 Warsaw, Poland
*
Author to whom correspondence should be addressed.
Appl. Sci. 2024, 14(11), 4479; https://doi.org/10.3390/app14114479
Submission received: 30 April 2024 / Revised: 21 May 2024 / Accepted: 22 May 2024 / Published: 24 May 2024
(This article belongs to the Special Issue GIS-Based Environmental Monitoring and Analysis)

Abstract

:
Modern technologies, such as airborne laser scanning (ALS) and advanced data analysis algorithms, allow for the efficient and safe use of resources to protect infrastructure from potential threats. This publication presents a study to identify trees that may fall on highways. The study used free measurement data from airborne laser scanning and wind speed and direction data from the Institute of Meteorology and Water Management in Poland. Two methods were used to determine the crown tops of trees: PyCrown and OPALS. The effect of wind direction on potential hazards was then analyzed. The OPALS method showed the best performance in terms of detecting trees, with an accuracy of 74%. The analysis showed that the most common winds clustered between 260° and 290°. Potential threats, i.e., trees that could fall on the road, were selected. As a result of the analysis, OPALS detected between 140 and 577 trees, depending on the chosen strategy. The presented research shows that combining ALS technology with advanced algorithms and wind data can be an effective tool for identifying potential hazards associated with falling trees on highways.

1. Introduction

The introduction of modern technologies, such as airborne laser scanning (ALS) and advanced data analysis algorithms, to the areas of forestry and road infrastructure management is a significant step toward the efficient and safe use of resources to protect infrastructure from potential threats. The use of laser scanning, unlike classical photogrammetry, has a fundamental advantage. This method is not dependent on natural sunlight, which means that the analysis of these data is not disturbed by shadows or surrounding objects. Also, a key advantage is the fact that laser pulses can penetrate through small gaps in tree crowns, enabling the collection of information on the ground structure [1]. Today, advanced methods of terrain elevation data acquisition are used, including digital photogrammetry, satellite remote sensing techniques, LiDAR, and InSAR technology. Digital elevation data acquisition processes are characterized by varying efficiency, cost, time, and precision [2,3,4,5]. Elevation models provide the basis for an accurate understanding of landforms and land cover characteristics [6,7]. The Digital Terrain Model (DTM) and Digital Surface Model (DSM) are common numerical elevation models. The Canopy Height Model (CHM), which is synonymous with a normalized digital surface model (nDSM) for forest areas, is often discussed in the literature on forest areas [8,9,10,11]. CHM models are used to perform analyses to extract information about a stand of trees. They are often used in forestry to determine the quantities that characterize a stand, which is important for describing tree growth [12], planning silvicultural activities [13], and inventorying timber volume and stand biomass [12,14,15]. The precision of a canopy model is affected by many factors, including the density of the point cloud, the interpolation algorithm used, and the resolution of the DTM and DSM models from which the CHM model is created. The accuracy of tree canopy mapping mainly depends on the resolution [16], canopy cover [17], and tree height [18]. The larger the pixel size of the raster, the more general the information about the object. Assessing the heights of individual trees and determining their crown shapes based on field measurements is costly and labor-intensive, and is usually realized only in small study areas. With advances in airborne laser scanning technology, it is possible to accurately and systematically map the crowns of individual trees and determine their heights over large areas by studying the spatial structure of tree crowns [19,20].
It is possible to determine stand characteristics using laser scanners. These data make it possible to detect individual trees and determine their characteristics, such as height, position, or crown size [21,22]. The method involves detecting local maxima in a normalized digital surface model, which are then identified as tree tops. The entire process begins with the application of a low-pass filter on the nDSM to smooth the surface, reduce noise, and extract more general features. The application of the filter reduces the number of detected extremes [23]. After the filtering process, the algorithm identifies local maxima using a circular window. When detecting extremes, the window moves across the image to identify values higher than those in their neighborhood and consider them as the height of the tree [24]. The detected maximum is marked as the initial region around which the tree crown grows [23]. In the Polish road system, one of the key aspects of safety is the problem of trees falling on road infrastructure, which results in local hazards, leading to accidents or obstructions on the route. Trees growing near roads, without adequate safety zones, pose an exceptional risk to road users. The General Directorate of National Roads and Highways in Poland (GDDKiA) is responsible for assessing trees, placing particular emphasis on safety aspects and determining condition and aesthetics. If a tree shows symptoms of potential danger, such as withering, excessive leaning, or signs of disease, the GDDKiA submits a formal application to the municipality for permission to carry out the cutting. On highways and expressways, the General Directorate of National Roads and Highways ensures that there are no trees in their immediate vicinity that could pose a danger to road users [25].
For this publication, a survey was conducted in which 102 licensed drivers were asked, “Is there a possibility of a tree falling on the highway?” Only 16 people answered in the affirmative, which means that 84% of drivers do not consider such a risk when traveling on highways. Taking into account the results of the above survey and assurances from the General Directorate for National Roads and Highways in Poland that trees do not pose a threat on highways, the authors conducted a study to identify trees that could fall on highways. Airborne laser scanning data were used to achieve the goal, and wind measurements in 2022 and 2023 provided by the Institute of Meteorology and Water Management in Poland were taken into account.
The next section (Section 2) provides a description of the area, methods, and data used; the results are presented and discussed in Section 3. The paper ends with a brief concluding section.

2. Materials and Methods

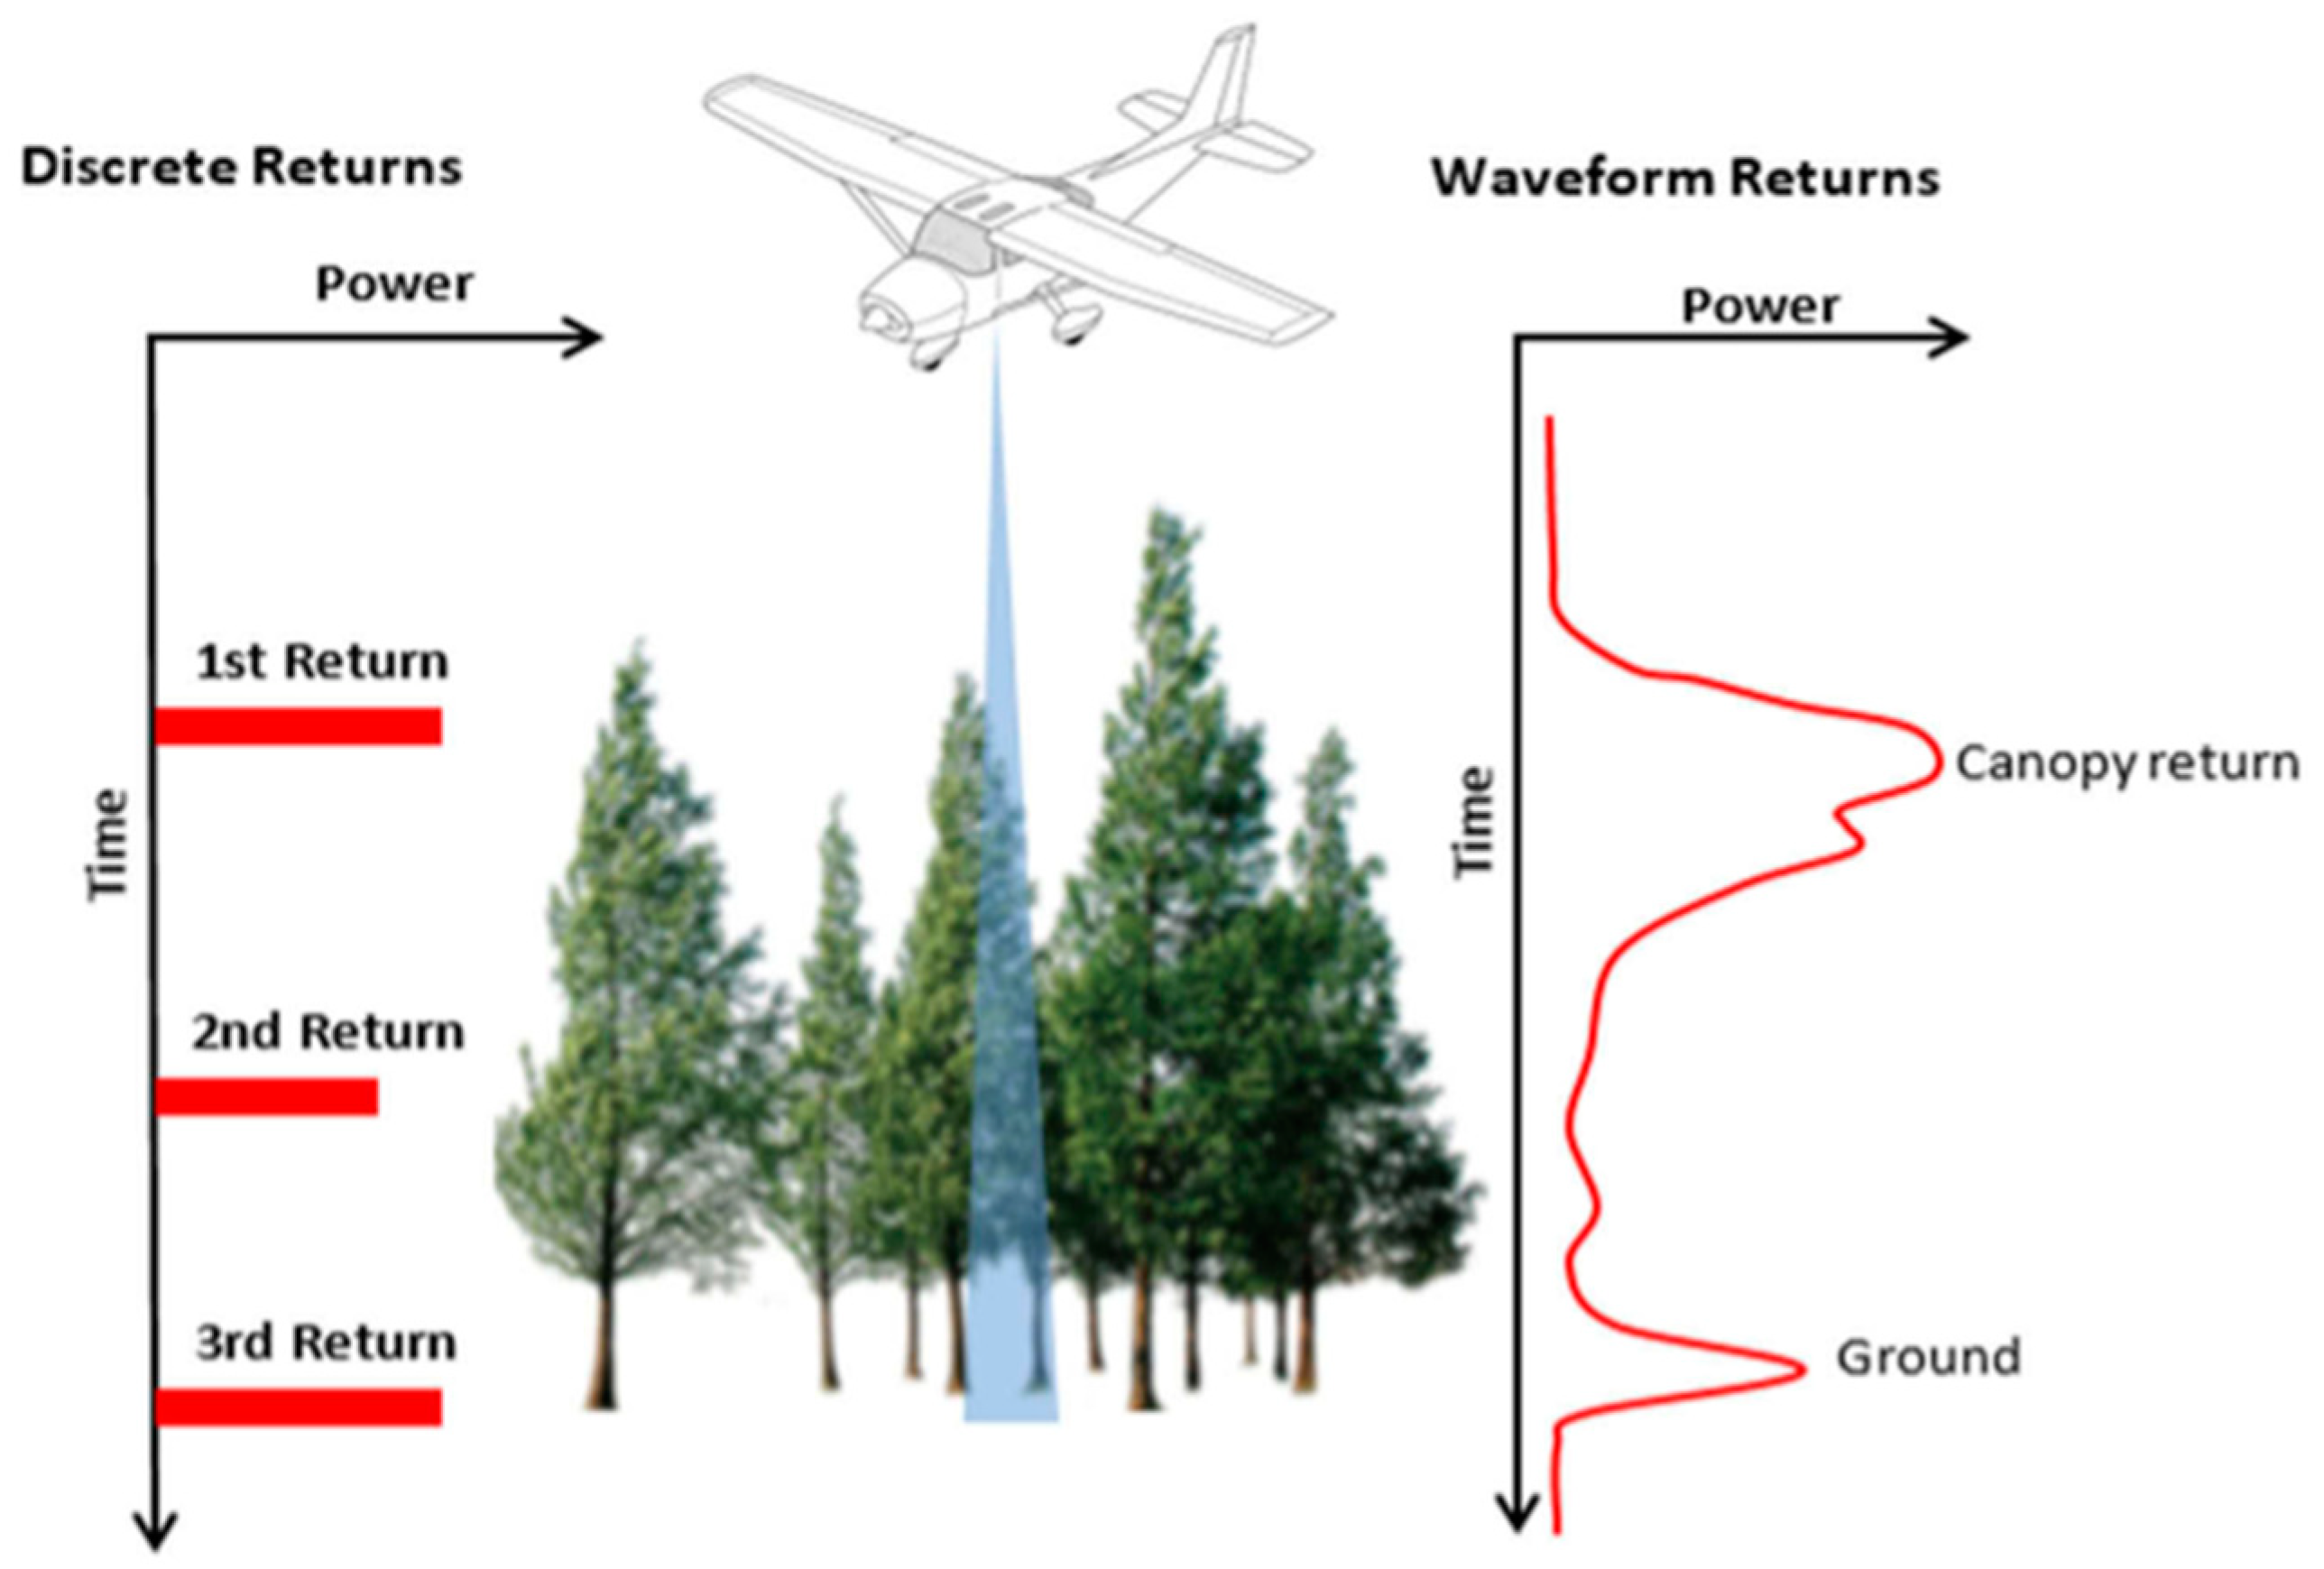
2.1. Airborne Laser Scanning

Airborne laser scanning (ALS) is a technique for collecting terrain data using laser scanners mounted on aircraft boards. Two segments can be distinguished, making up the ALS system: airborne and ground-based. The airborne system includes a laser range finder, a trajectory positioning system based on GPS (Global Positioning System), an inertial navigation system, a camera, a data logging block, and a flight planning and management system [26,27,28]. The ground part of the ALS includes a GPS reference station and a workstation for processing and generating the resulting products. The use of laser scanning, unlike classical photogrammetry, has a key advantage: this method is not dependent on natural sunlight. This means that the analysis of these data is not affected by shadows caused by clouds or surrounding objects. A key advantage is that the laser pulses can penetrate small gaps in tree crowns, making it possible to collect information about the ground structure. The laser works in pulses, scanning the area at a high frequency. Some of the energy that is reflected from the object’s surface is then picked up and recorded by the scanner’s optics. Acquiring a densely sampled three-dimensional surface with a single laser beam requires a scanning mechanism that moves the beam across the object’s surface. Several basic scanning patterns can be distinguished in this process, including [29,30]:
  • Oscillating mirror—Creates a characteristic zigzag pattern on the surface. The distances between laser points in the scan line are variable values, resulting from the mirror’s constant acceleration and deceleration. Larger distances between points occur in the middle part of the lane, while they are smaller at the end of the lane, where the direction of the mirror’s movement changes.
  • Spinning polygon—Points are created only when scanning in one direction, forming parallel scan lines with a uniform distribution of points over the measured area.
  • Palmer scanner—The laser beam deflecting device is designed so that the mirror surface and axis of rotation form an angle other than 90°. Systems based on Palmer scanning for aerial systems achieve an elliptical pattern on the ground.
  • Fiber-optic system—A laser beam is directed through a rotating mirror onto a bundle of optical fibers, outputting energy in the form of a line perpendicular to the flight.
During the measurement, when a single laser pulse is sent, it is possible to record several reflections. A pulse that hits a wooded area first partially reflects off the crown of the tree, and then the energy passes through the crown and is reflected off the ground surface. Intermediate reflections can occur between these two extreme reflection points. Different types of laser systems allow only the first reflection, the last reflection, or both reflections (known as echoes) to be recorded. In addition, some systems record intermediate reflections, recording up to 5 reflections [31,32,33]. Some systems record the full waveform, making it possible to extract multiple reflections at the data-processing stage (Figure 1). Using this information, tree heights can be determined or a normalized numerical land cover model can be obtained.

2.2. Characteristics of the Data and Test Object

The study used free measurement data from airborne laser scanning, obtained from geoportal.gov.pl [35], which acts as the central node of the Spatial Information Infrastructure, mediating access to spatial data and related services in Poland. It ensures the quality, timeliness, and reliability of the data. LiDAR data are recorded in LAS format and contain information about the class of a given point (Table 1) and the intensity of the signal reflection, and may have RGB values assigned. It is common to compress these data into LAZ versions because of the large file sizes. In Poland, ALS data are available, covering the entire country, where point densities vary from 4 pts/m2 to 40 pts/m2.
The study area concerns a section of the S6 highway between Kolobrzeg–Goleniow in the West Pomeranian Voivodeship (Figure 2). For data acquisition, the Web Feature Service (WFS) was used to retrieve LiDAR indexes (PL-EVRF2007-NH) in the study area, and a total of 115 LiDAR data sheets were downloaded.
The key element for carrying out the following study was to obtain a vector representation of the S6 road axis from the Topographic Object Database, which contained the geometry of the road route and its attributes. The length of the route was approximately 95 km.
For complete analysis, it was necessary to collect data on the winds occurring in the area. This information was obtained from the Institute of Meteorology and Water Management for 2021 and 2022. Four meteorological stations that were closest to the study area (Szczecin, Koszalin, Kolobrzeg, and Smólsko) were selected, and the information regarding the direction and speed of wind gusts was used.

2.3. Data Preparation

The quality of the data has a direct impact on the results of the analysis, so proper data preparation was crucial before proceeding with the study. The entire data preparation process was performed in ArcGIS PRO software (3.2.0) along with the use of LASTools, which was used to process LiDAR data files. Several stages of data preparation can be distinguished:
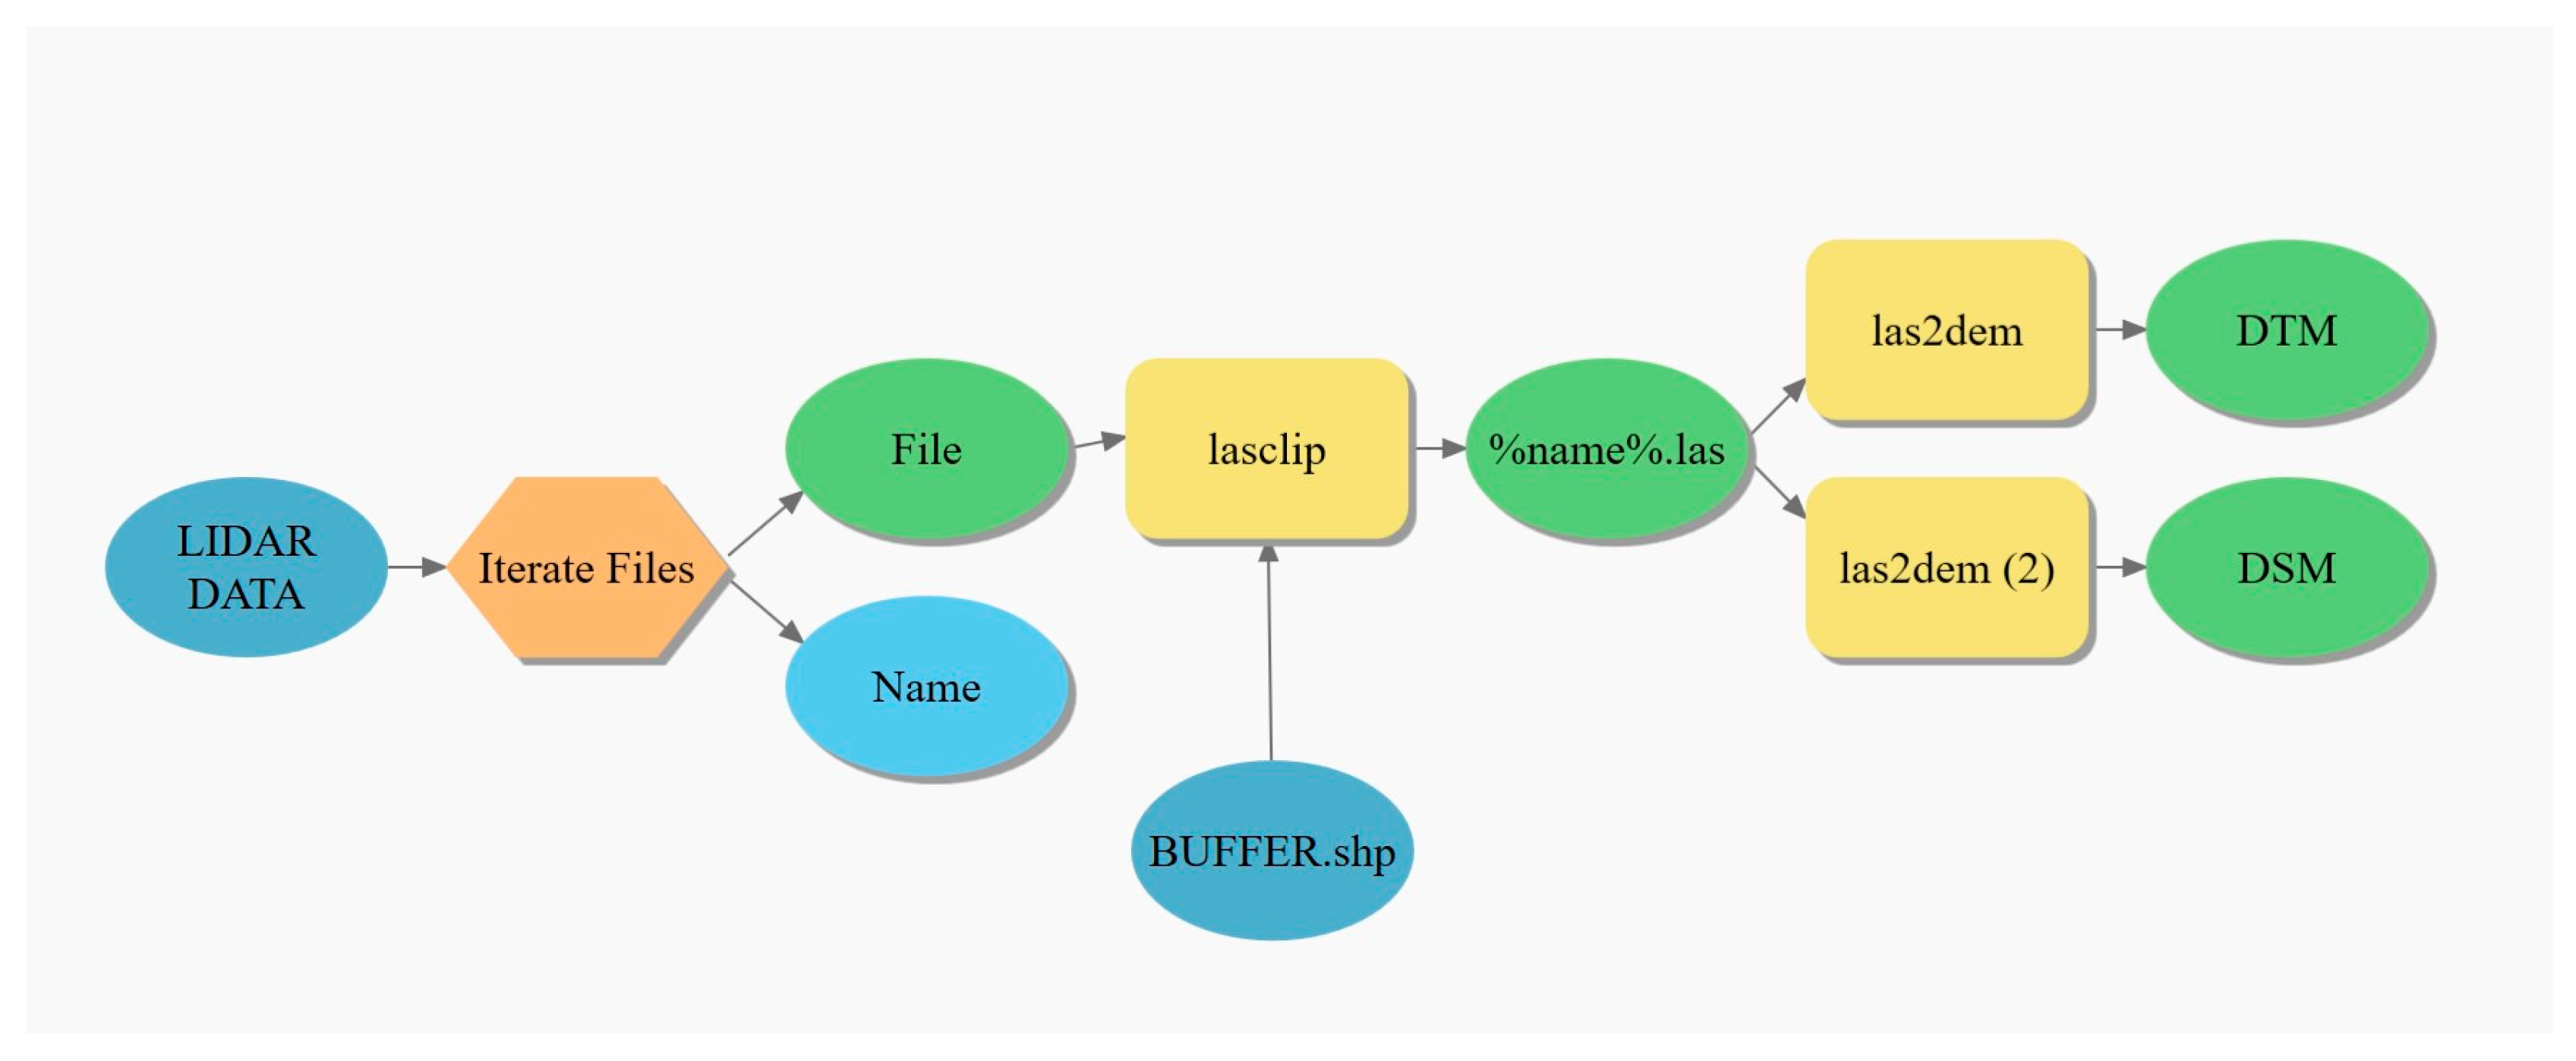
  • Creation of a buffer area around the vector representing the road axis, taking into account the actual width of the road, and use of this buffer to create an additional area with a radius of 40 m to define the scope of the analysis.
  • Reducing the LiDAR dataset using the LASTools package integrated with ArcGIS PRO software. The lasclip tool was used to reduce the amount of these data in the analysis area.
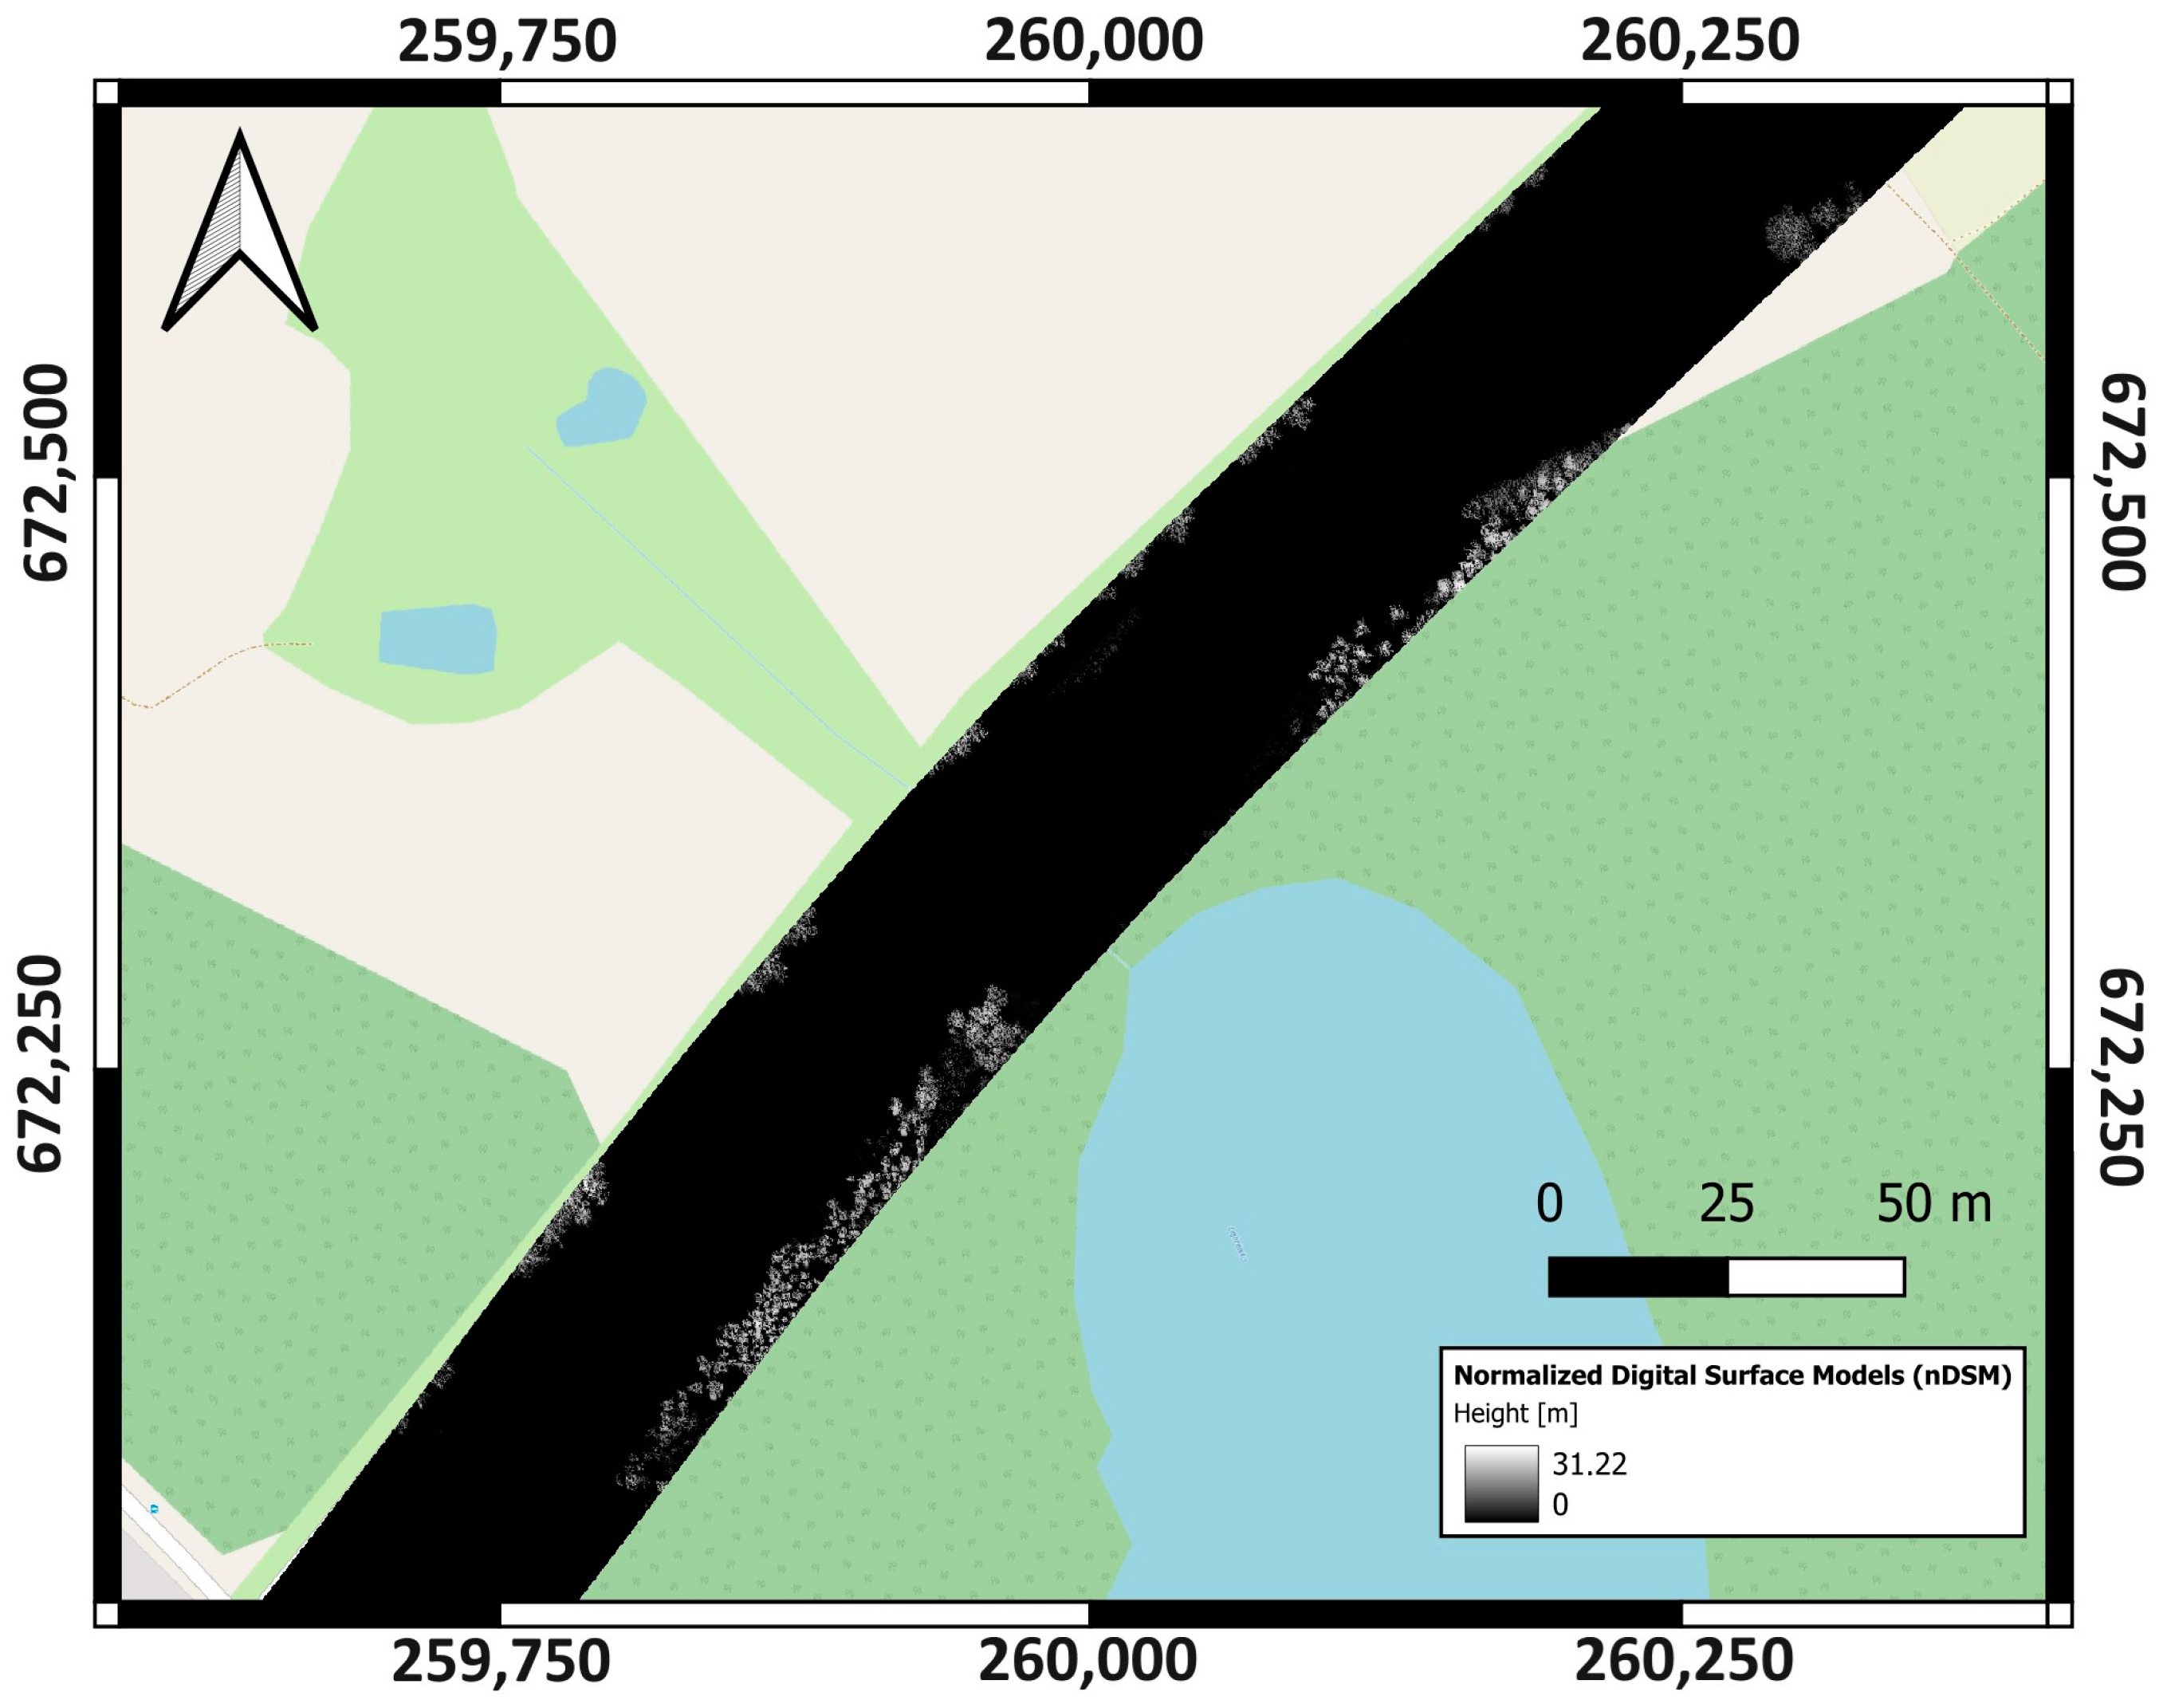
  • Using the las2dem tool to generate Numerical Terrain Models and Numerical Land Cover Models, with a resolution of 0.25 m and 1 m based on previously constrained LiDAR data. The models differ in the parameter concerning the selection of the point class on which the model is generated. The DTM was created only on the ground class, while the DSM considered only the first reflections from all analyzed classes.
To optimize the process, the Model Builder tool (Figure 3) was used to create geoprocessing operations and automate and document them. The model iteratively operated on LiDAR data, individually constrained each sheet to a specific buffer range equal to 45 m, and automatically created DTMs and DSMs.
An integral part of the study was the creation of normalized digital surface models, which provide a representation of the heights of objects concerning the surrounding ground level. nDSM can be used to extract a variety of tree characteristics, such as estimating timber resources or measuring stand height [37]. The normalized digital surface model was calculated based on Equation (1), and the result of an example calculation is shown in Figure 4.
nDSM = DSM − DTM
where:
  • nDSM—normalized digital surface model;
  • DSM—digital surface model;
  • DTM—digital terrain model.
Figure 4. Example of normalized digital surface model (nDSM).
Applsci 14 04479 g004
The Python 3.11 language and GDAL library were used to automate the process.

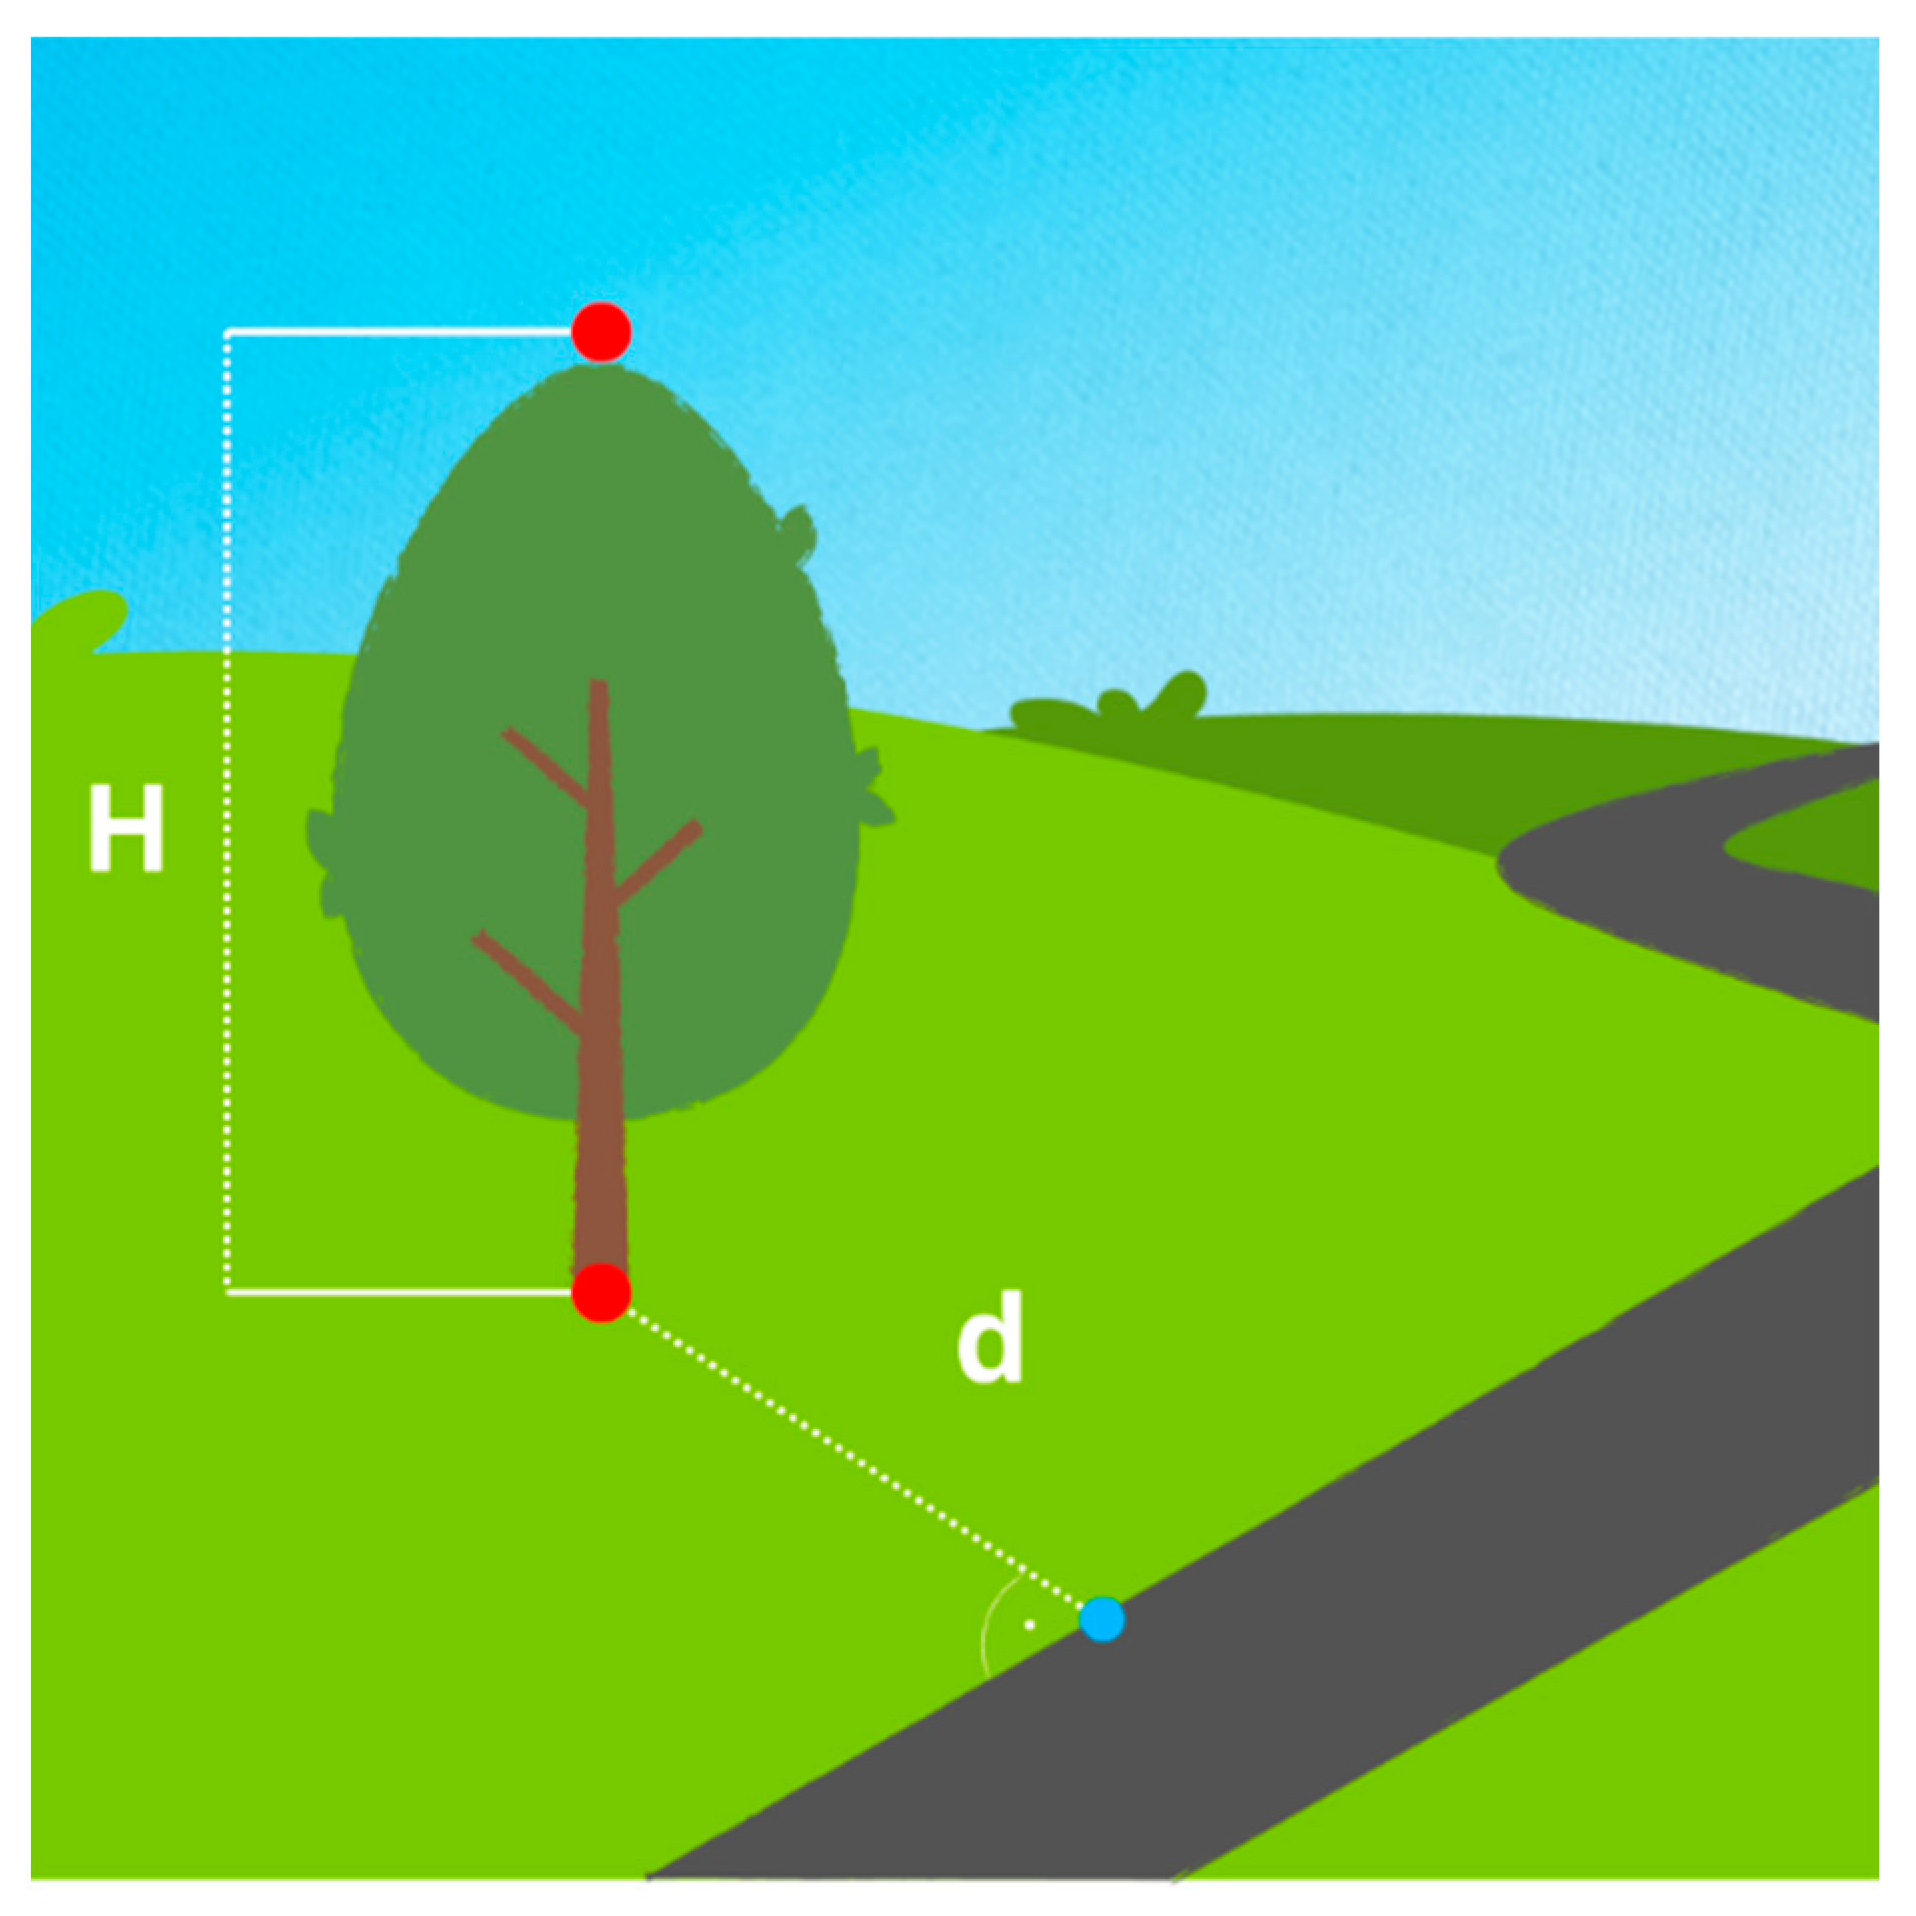
2.4. Determination of the Points of Fall of a Potential Windthrow on the Road

A very important element of this publication was the determination of the crown tops of trees located along the highway. The study was carried out by using two different tools. An analysis based on the PyCrown package (v. 0.2) [19] and OPALS software (v. 2.5.0) [38] was conducted. Both methods identify tree top positions using a normalized digital surface model. Figure 5 presents a diagram of tree identification with the selected algorithms.
For the study, DTM and DSM rasters were generated at two different resolutions: 0.25 m and 1 m. Using a Python script, nDSM was also calculated for both of these resolutions. The data prepared in this way could be effectively used in algorithms for tree detection. As a first step, the PyCrown package was used. A series of tests was conducted using the generated DTM, DSM, and nDSM with a resolution of 0.25 m, where two different filter sizes were used: 3 × 3 and 5 × 5. In the case of the OPALS software, data of only 0.25 m resolution were used. The most relevant parameters were those that affected the search for local maxima, namely, those related to minimum crown size (mc) and minimum tree height (mh). The following pairs of parameters were adopted (mc [m], mh [m]): [(3,10),(4,20),(5,40)].
Finally, the detected trees were subjected to selection according to the relationship:
H > NEAR_DIST
where:
  • H—tree height;
  • NEAR_DIST—the closest distance between the road and the position of the tree.
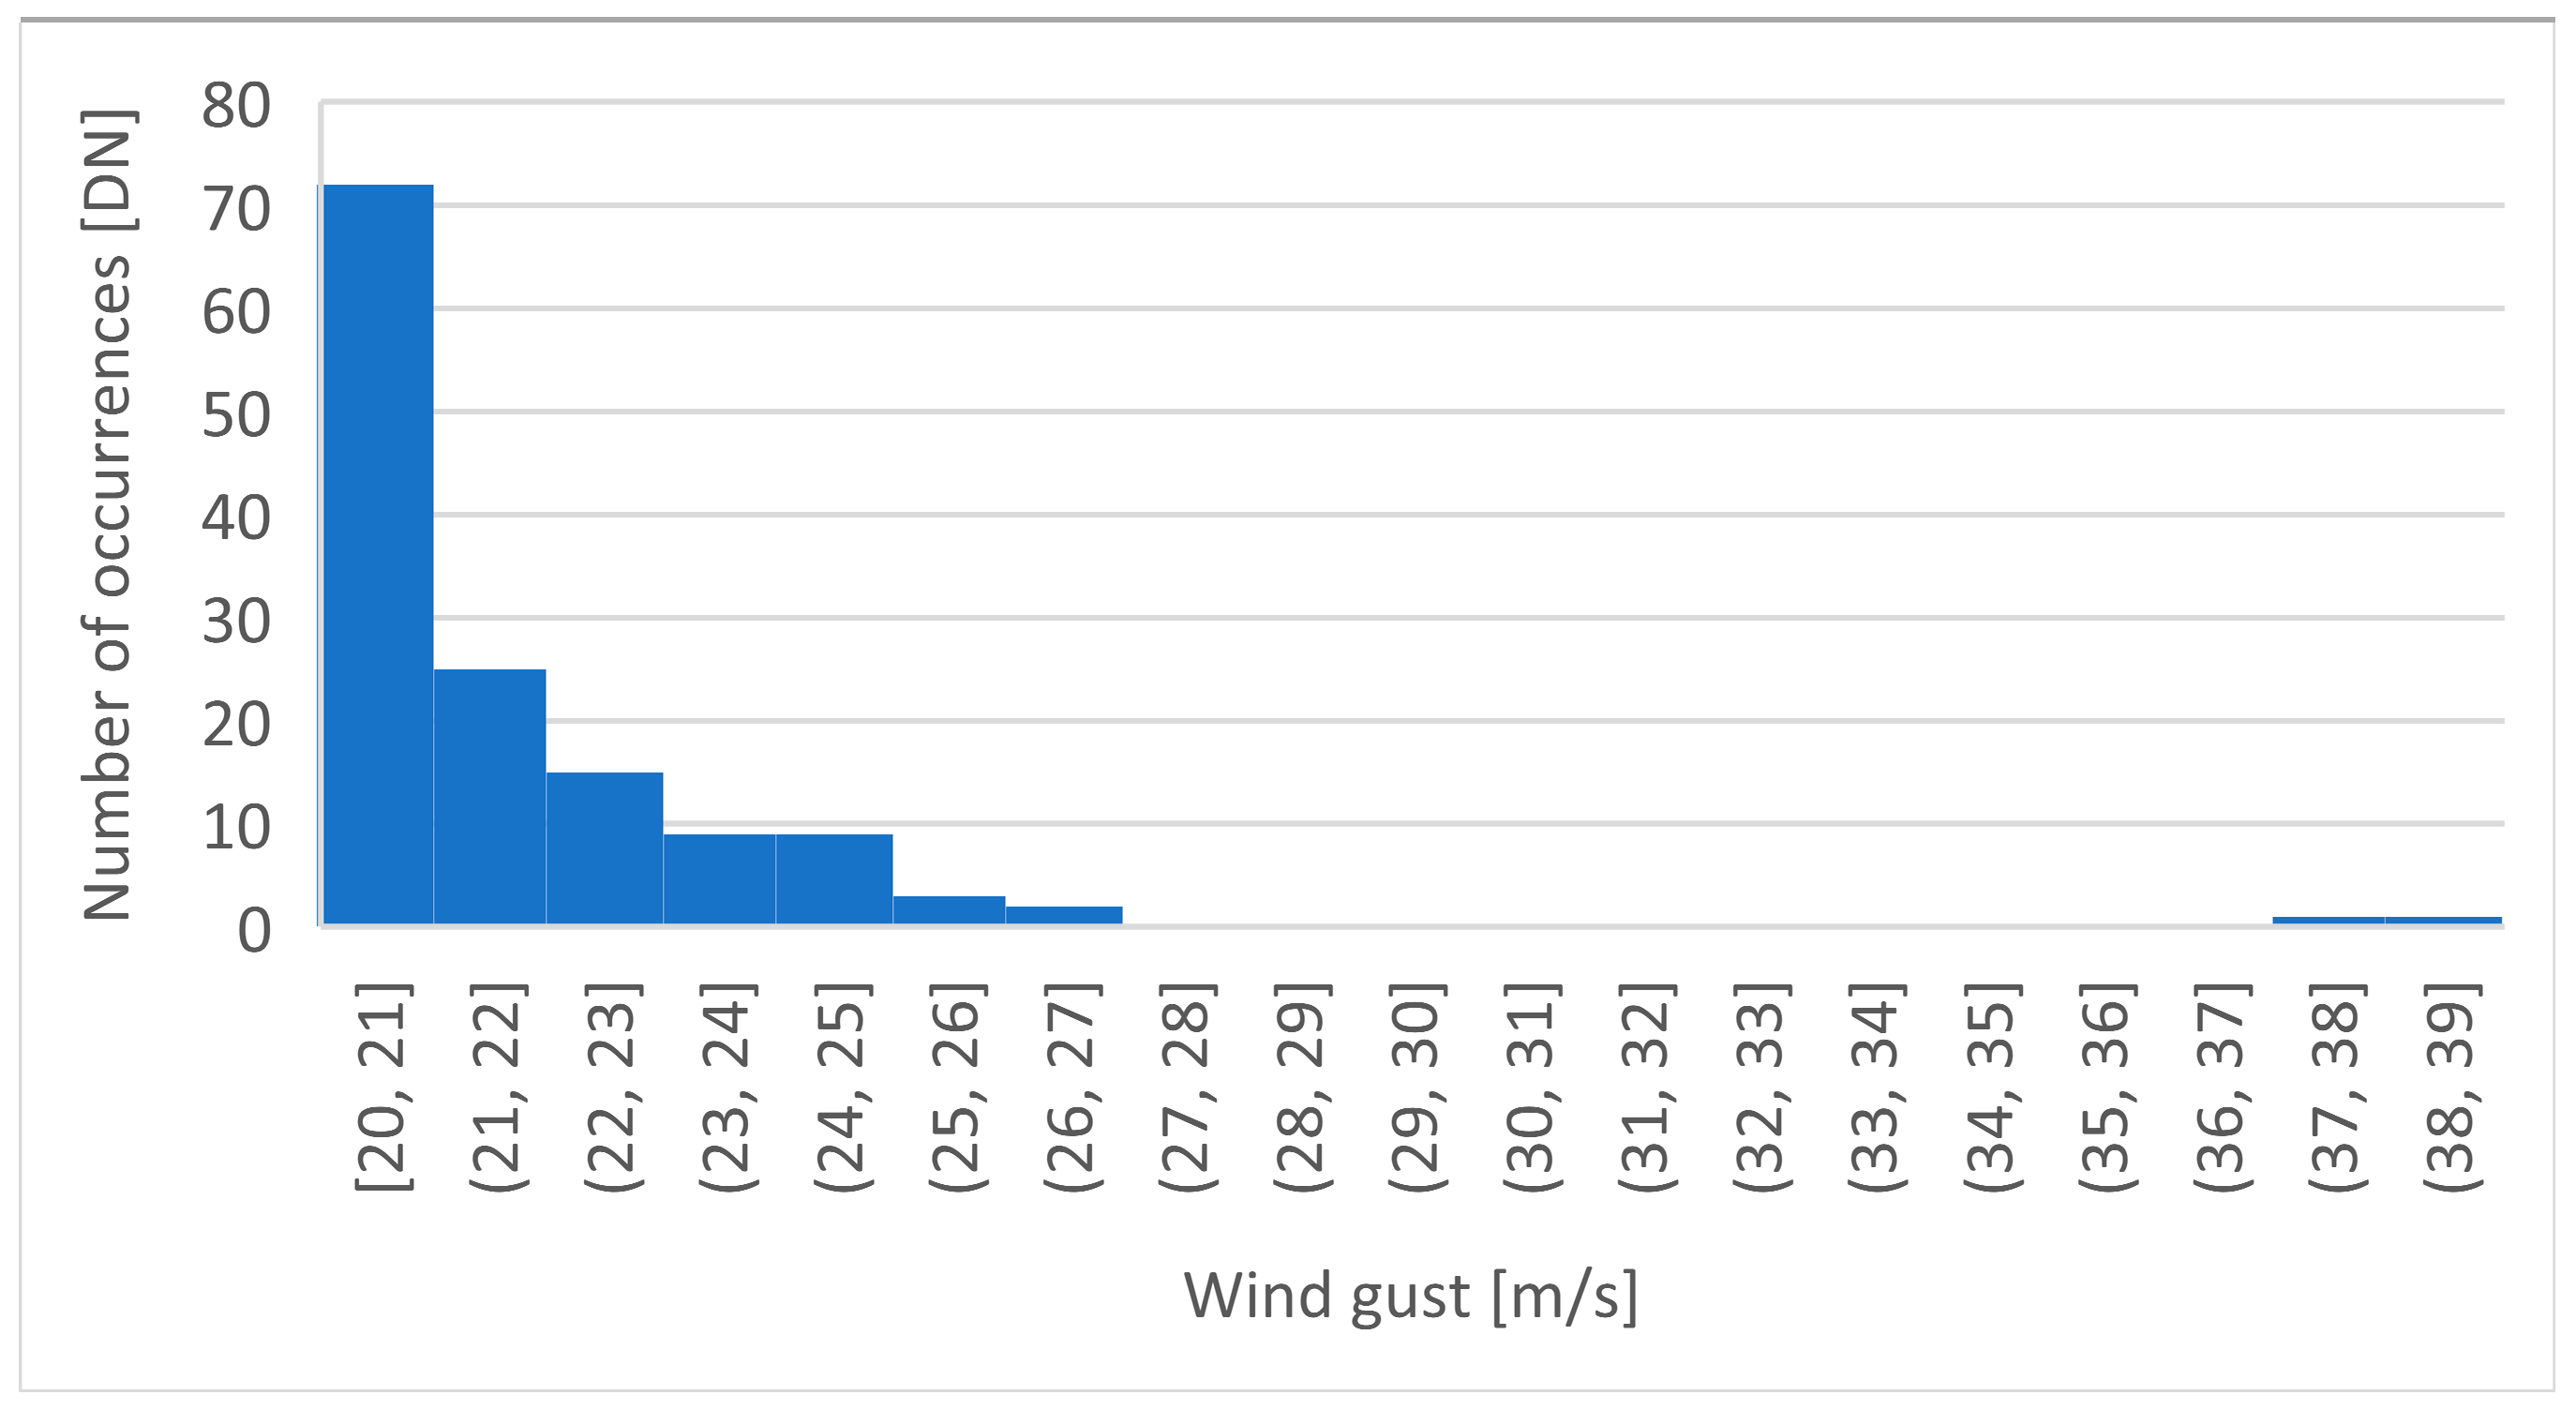
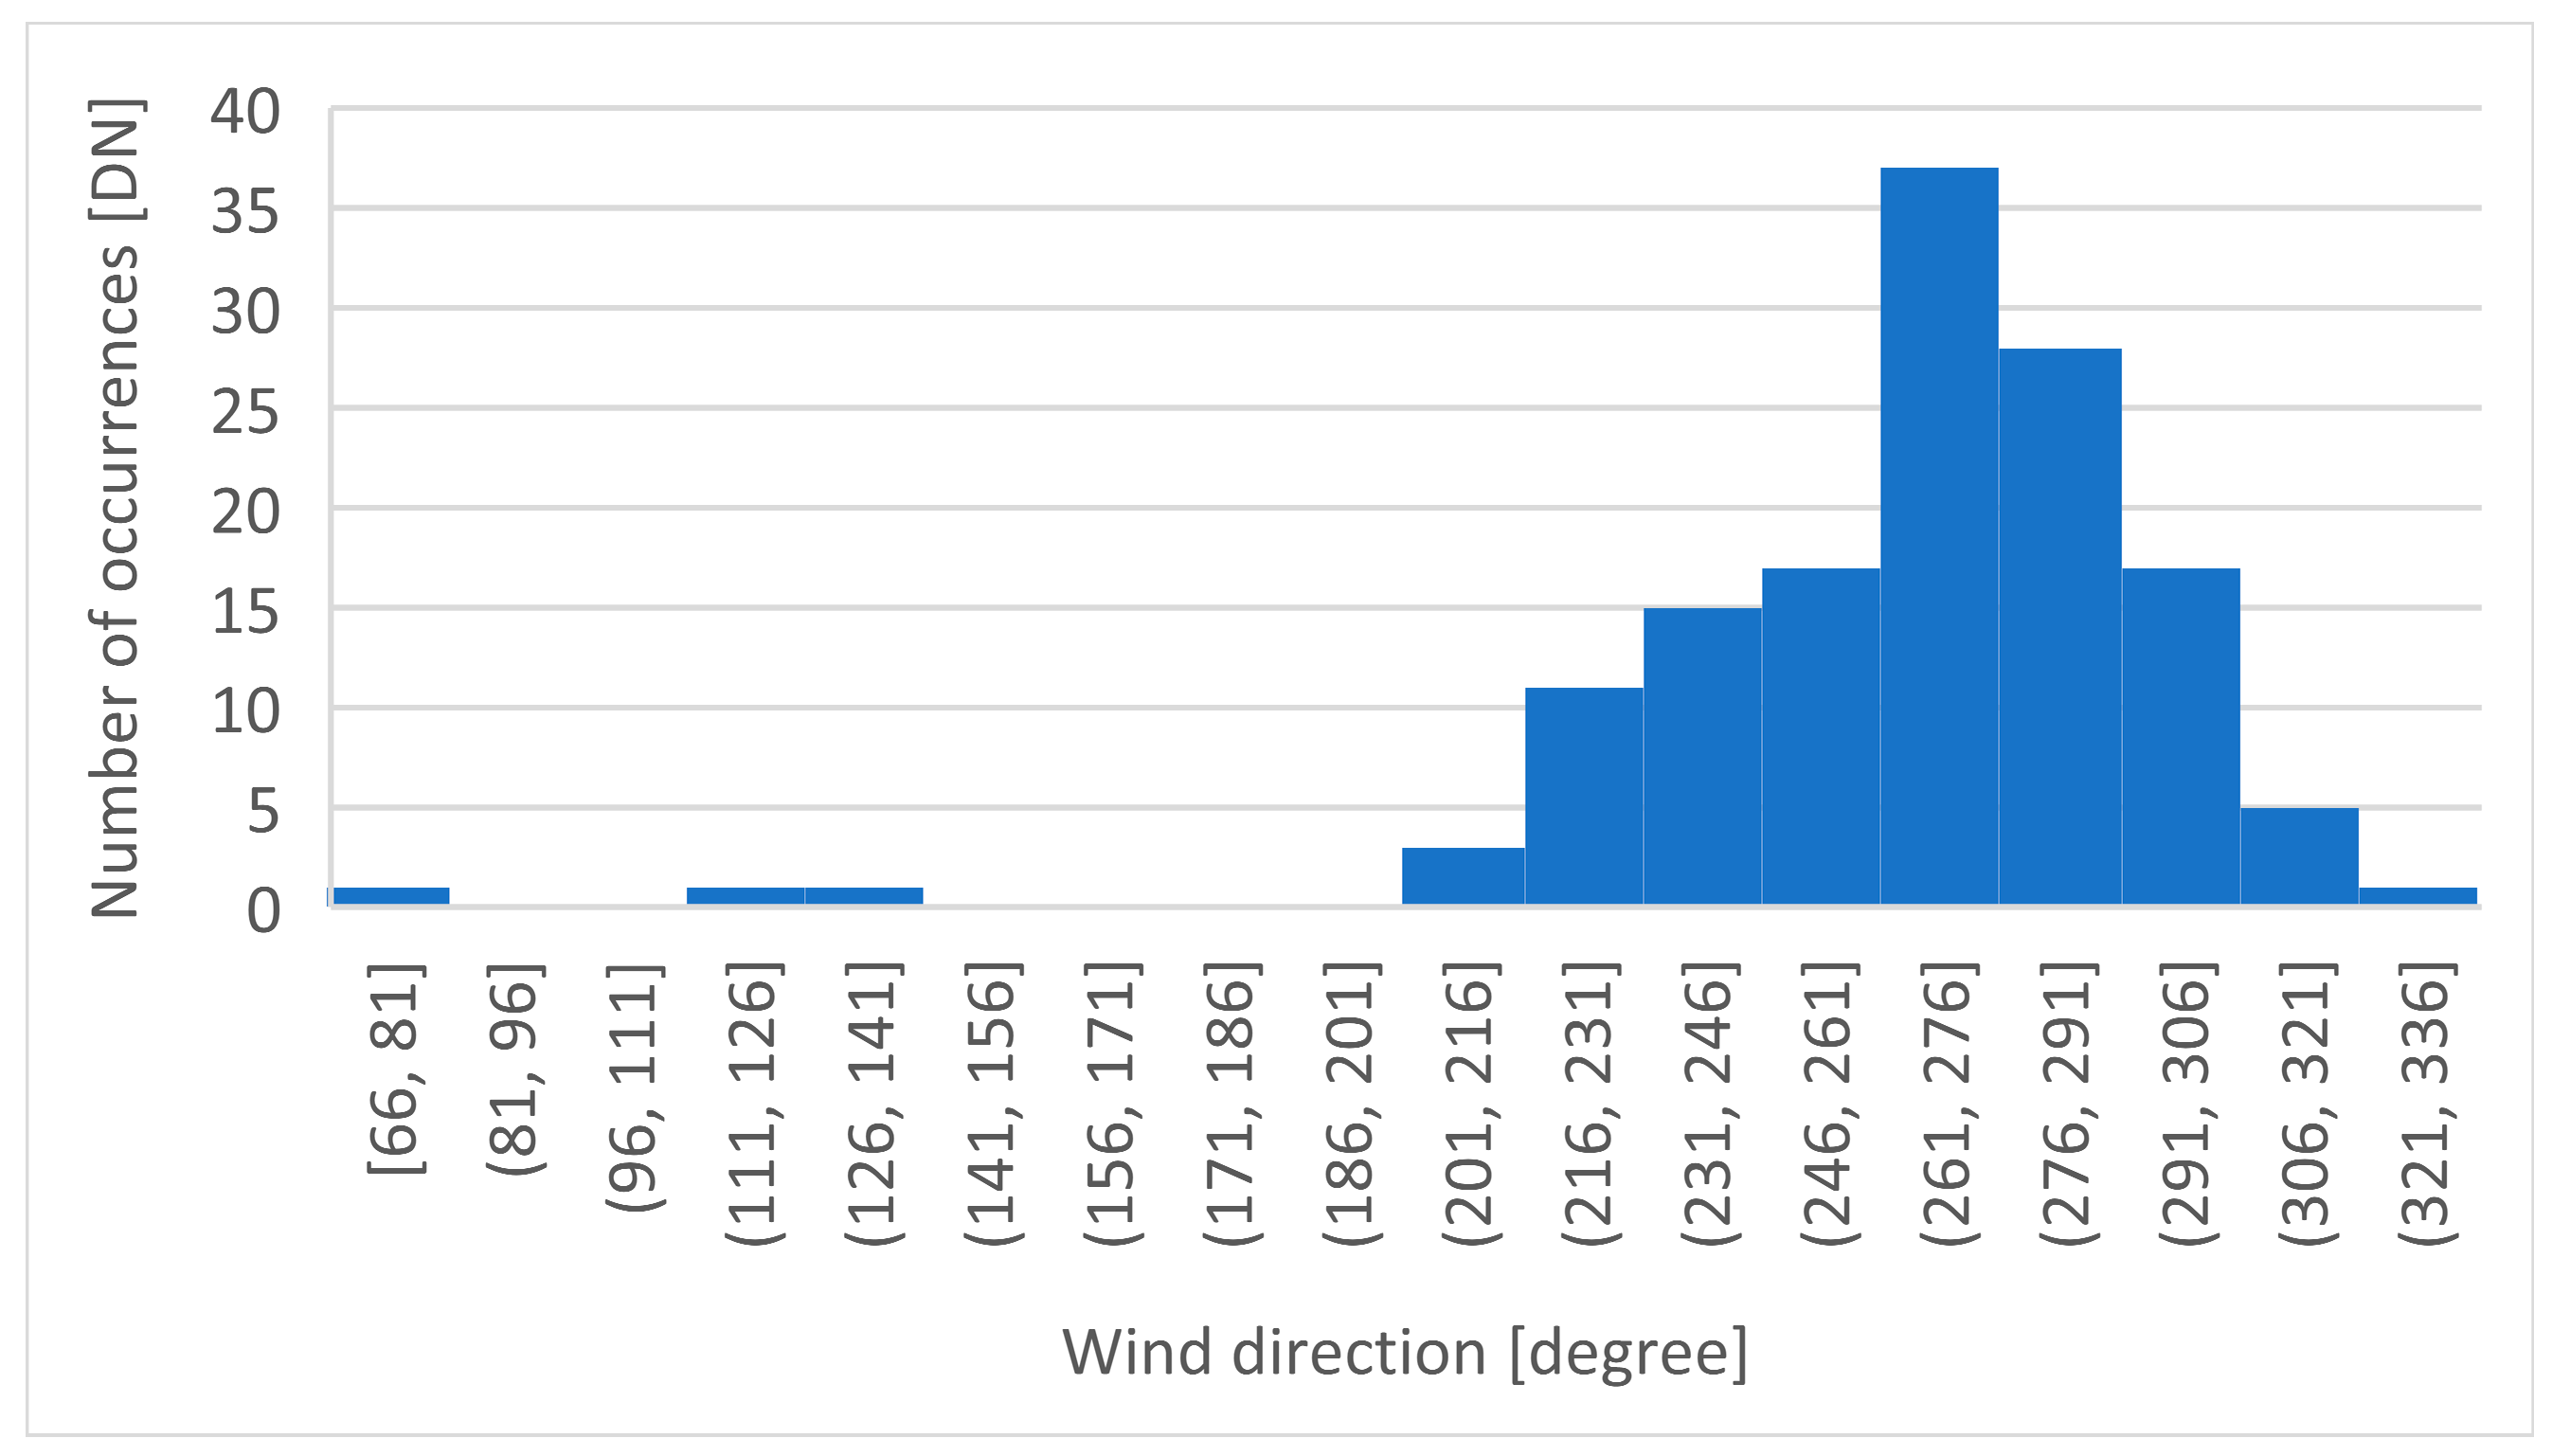
The sites that resulted from this selection were identified as potential hazards. The analysis was based on the relationship between the height of the tree and the closest point to the road (Figure 6). If the height of the tree is greater than the distance to the nearest point to the road, it means that it poses a threat.

2.5. Winds Model

To increase the effectiveness of the prediction of potential hazards, a detailed analysis was carried out using data from the Institute of Meteorology and Water Management for four different stations (Szczecin, Koszalin, Kolobrzeg, and Smólsko) on wind direction and gusts in the study area. From the acquired data, moments were selected when wind gust speeds exceeded 20 m/s. These values of wind gust speeds were extracted because winds reaching values above 20 m/s are classified as a meteorological hazard (Table 2).
The first parameter analyzed was wind gusts, which represent sudden increases in wind speed that exceed the average wind speed by at least 5 m/s. These instantaneous increases in speed are characterized by a short duration, not exceeding 2 min. The second important parameter of the analysis was the direction of the wind gust, defining the origin of the direction from which the wind blows. These are given descriptively according to the eight-directional wind rose as follows [39,40]:
  • Northern (N, 360°): od 338° do 22°;
  • Northeastern (NE, 45°): od 23° do 67°;
  • Eastern (E, 90°): od 68° do 112°;
  • Southeastern (SE, 135°): od 113° do 157°;
  • Southern (S, 180°): od 158° do 202°;
  • Southwestern (SW, 225°): od 203° do 247°;
  • Western (W, 270°): od 248° do 292°;
  • Northwestern (NW, 315°): od 293° do 337°.

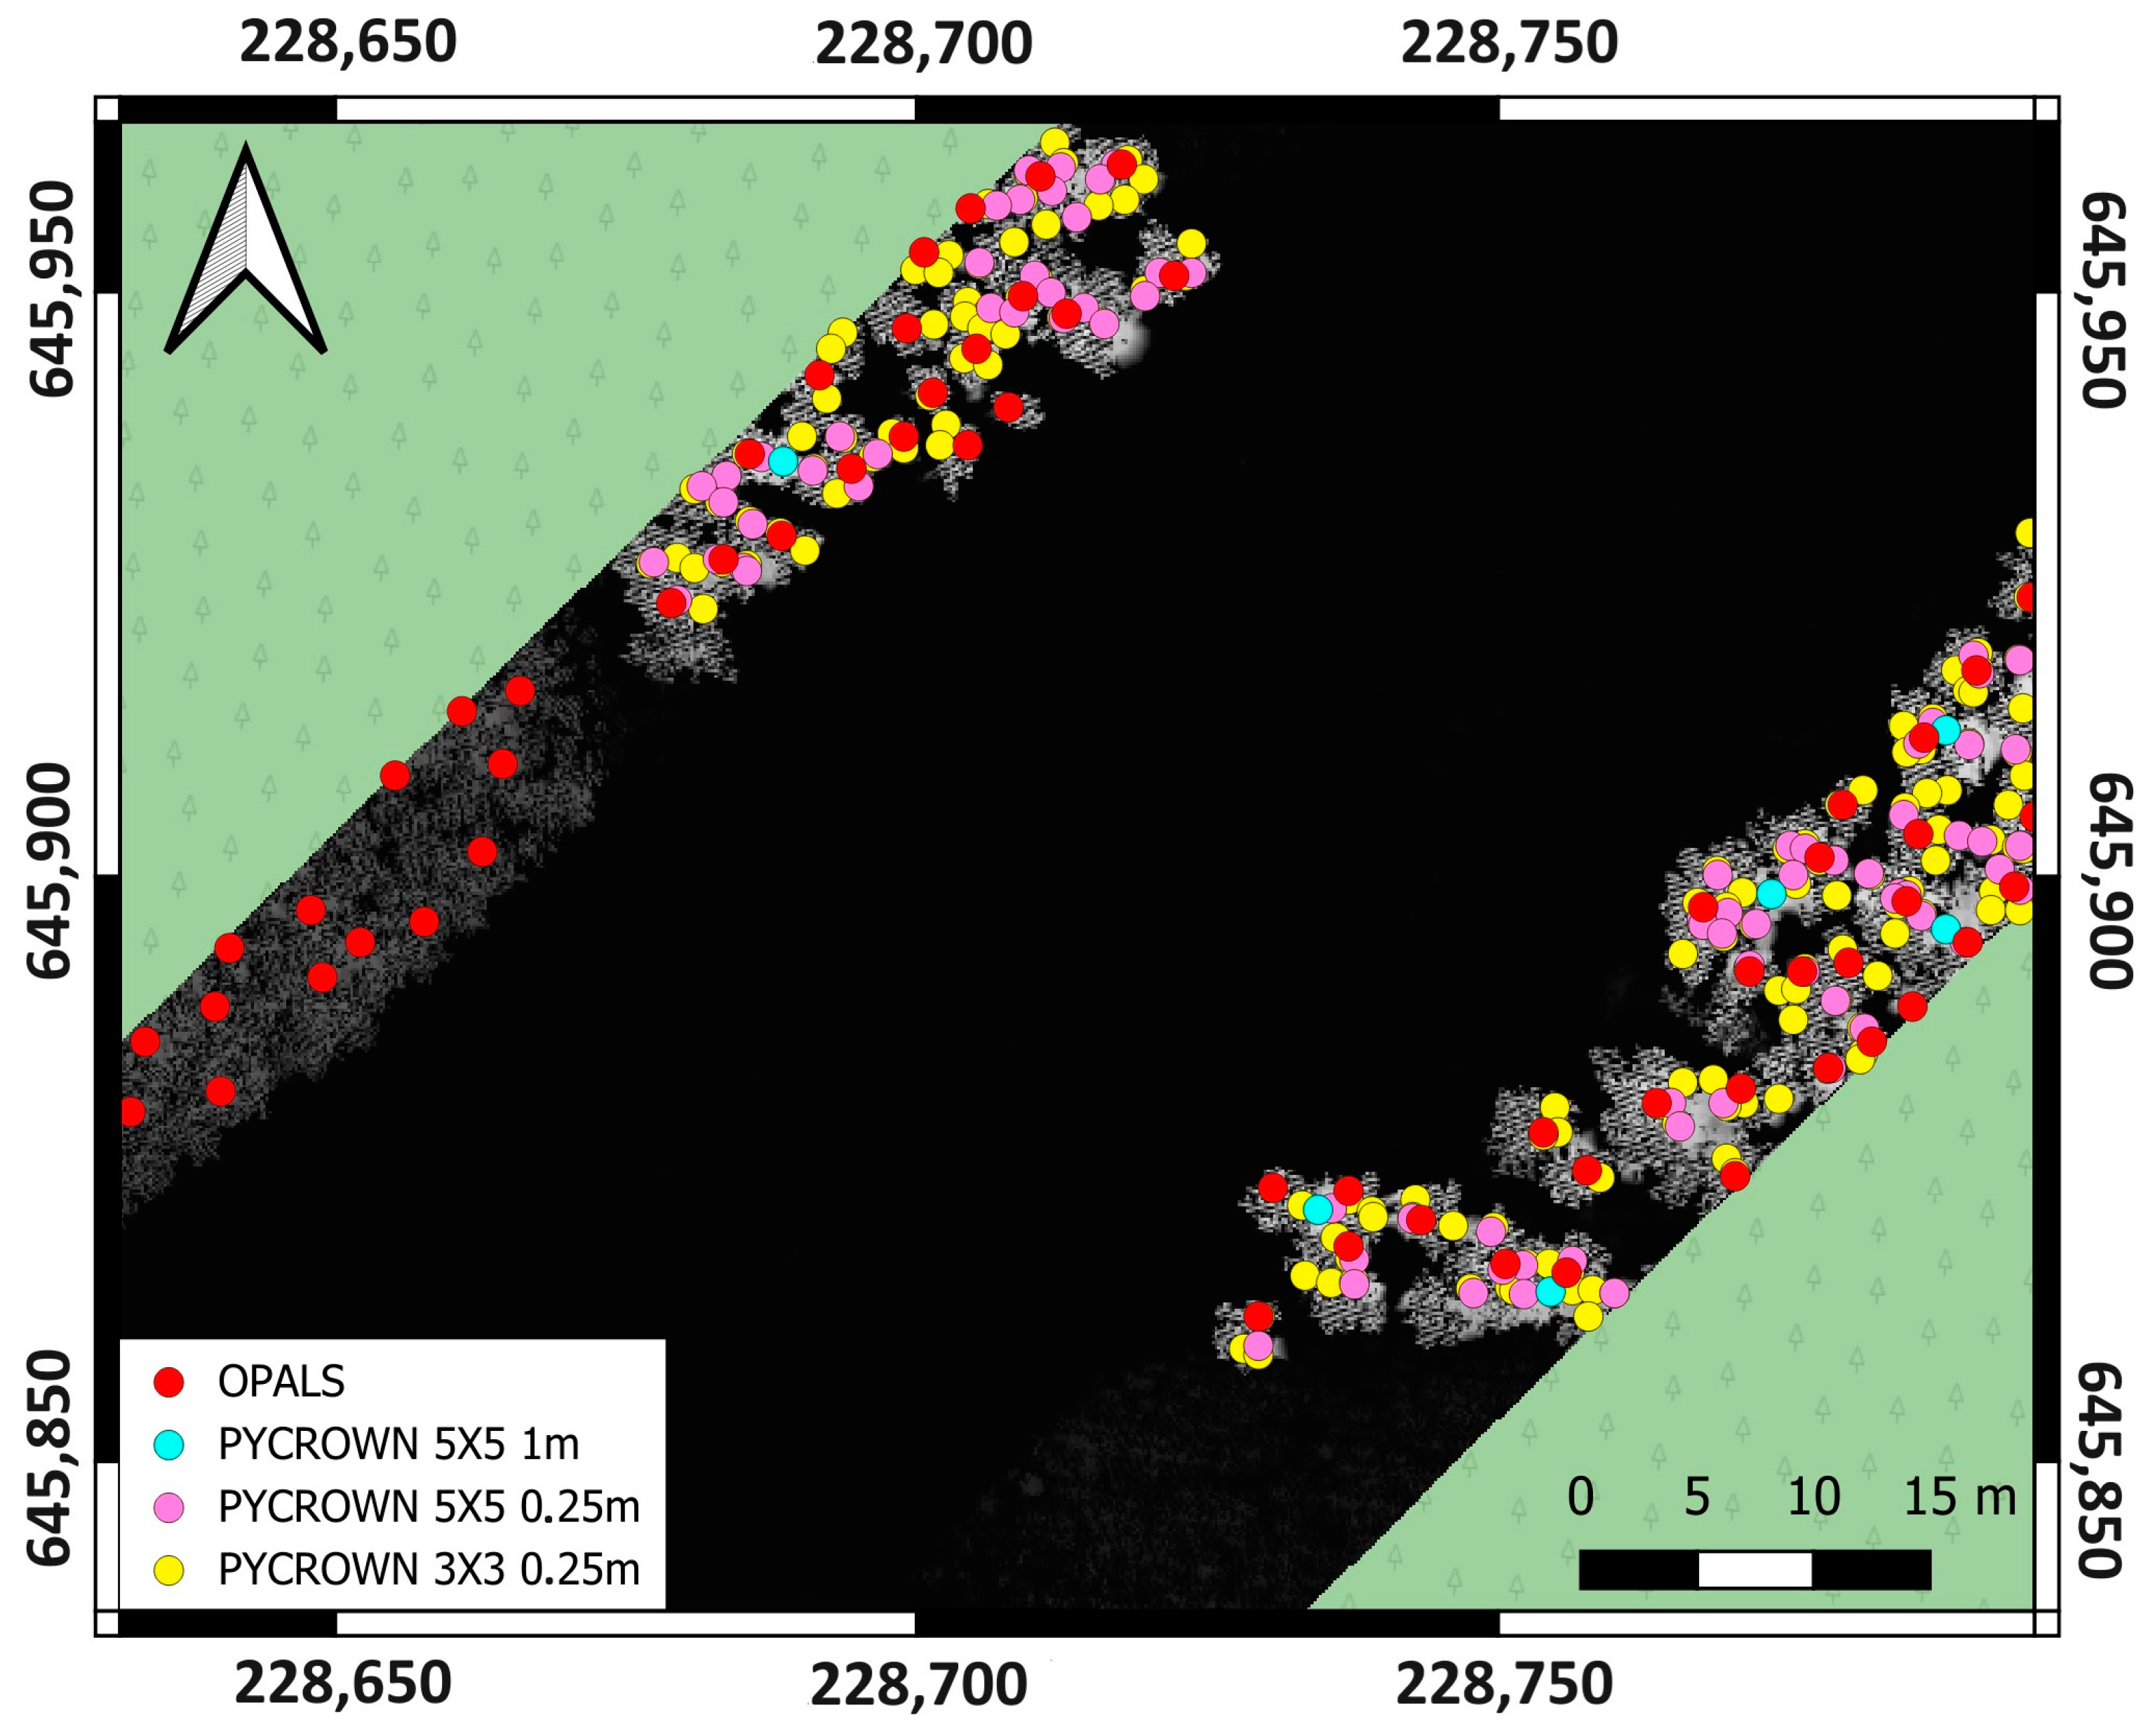
3. Results and Discussion

The study used four tree detection strategies (Table 3):
  • OPALS with resolution of 0.25 m;
  • PyCrown with a resolution of 0.25 m and 3 × 3 median filter;
  • PyCrown with a resolution of 0.25 m and 5 × 5 median filter;
  • PyCrown with a resolution of 1 m and 5 × 5 median filter.
For the PyCrown library, the number of detected trees is higher when using a small window size. At the same resolution, using a 3 × 3 window size resulted in the detection of 11,667 potential tree tops. In contrast, using a 5 × 5 filter almost halved the number of detected trees, as 6244 trees were detected. This reduction was due to the merging of trees and branches due to over-smoothing of the nDSM, as well as lower sensitivity to fine features [19]. The use of the forTreeDetection module from OPALS allowed for the identification of 9305 trees.
To check the correctness of the detected trees, the detection was manually verified. A random selection of 500 trees was made and the correctness of their detection by the algorithms was determined. Based on this, the OPALS software (Figure 7) was found to perform best in this analysis, with an accuracy of 74% (Table 3).
When the PyCrown algorithm was used, many trees were missed, or when larger trees were present, clusters of points were formed in a single crown. The accuracy of PyCrown detection methods for a raster resolution of 0.25 m and a used filter of 5 × 5 m was 61%; for a filter of 3 × 3 m, it was 53%; and the worst detection, with only 4% accuracy, was achieved by the PyCrown method, with a raster resolution of 1 m and a 5 × 5 filter.
Lisiewicz et al. [22] tested individual tree detection (ITD) methods developed based on ALS data. They used Random Forest (RF), Support Vector Machine, and k-Nearest Neighbor to develop a method to correct the results of ITD algorithms to identify individual trees more reliably. The RF algorithm gave the best results. It was possible to identify under-segmentation and over-segmentation: Overall accuracy = 87% and Kappa coefficient = 0.79.
During the verification of the entire area, it was noted that points were detected that were erroneously located on bridges or fences (Figure 8), at a distance of about 12 m from the road.
To correct and remove misidentified data, a buffer of 12 m from the vector representation of the road was generated and all points within the buffer area were removed. After the correction, the number of points changed (Table 4).
The analysis was further carried out based on parameters such as tree height and distance to the nearest point of the road. The results are shown in the table (Table 5). As the PyCrown 1 m method showed the lowest efficiency, it was not included in further analysis in this paper.
In the following step, a detailed analysis was carried out taking into account wind direction. Through statistical calculations, basic information on the prevailing wind directions was determined. In the first step, a histogram analysis was performed, which indicated that wind gusts of 20 m/s were the most common. In addition, the occurrence of extreme values of gusts of 38 and 39 m/s with directions of 115° and 136° was noted (Figure 9). The histogram (Figure 10) illustrates the frequency of winds in different directions. Based on the figure, it was estimated that the most frequent winds are concentrated in the range of 260° to 290°. To precisely determine the dominant direction, the median was counted, which was 270°.
Three different analyses were conducted for each of the three tree detection methods, taking into account different wind directions:
  • Direction determined based on median;
  • Direction selected for maximum gust;
  • Direction determined by the entire range selected from the histogram.
An example of the results of the analysis examining the relationship between the trees’ locations and the road route is shown in Figure 11.
Wherever a point was located on a road route, it was considered a potential hazard site where a tree could fall. Potential hazards were selected, and the results are shown in Table 6. After the algorithms identified the trees, manual validation of the correctness of the detection of these trees was carried out, and their effectiveness was again determined. OPALS correctly identified threats in all three strategies with an efficiency of more than 80%. PyCrown showed an effectiveness of about 60% with a 3 × 3 filter mask and about 80% with a 5 × 5 filter mask. Unfortunately, PyCrown, with a 5 × 5 filter mask, detected far fewer trees for the filter size used, resulting in low usability.
The topic of the threat of falling dead trees, not close to roads, but on trails and paths, was explored by Zięba-Kulawik et al. [41]. In the research, remote sensing scenes from PlanetScope and LiDAR data (airborne laser scanning, density 4 points/sqm) were used to detect dead-standing trees, which are a threat on hiking trails. Providing security should include removing diseased and dead trees that could threaten the safety of individuals. The PlanetScope (Planet) satellite images were characterized by high spatial (GSD 3.125 m), spectral (4 spectral bands: R, G, B, and NIR), and radiometric (16-bit) resolution. Imageries, as well as LiDAR data (nDSM), were analyzed using Geographic Object-Based Image Analysis (GEOBIA) in eCognition Developer (TRIMBLE) software. The project aimed to develop a map of changes in the structure and health of forest areas adjacent to hiking trails using an innovative, semi-automatic GEOBIA method of image analysis. Special emphasis was laid on dead-standing trees, which do not represent value for the natural landscape. Analysis of the accuracy of the obtained results showed that the GEOBIA method gave good results (Kappa coefficient equal to 0.8) in the automated process of generating current maps of the occurrence of dying trees based on PlanetScope satellite images and LiDAR data. Additionally, a smartphone application (Android, iOS) was developed to allow for the inputting of data by hikers who would notice unmarked trees matching the criteria.

4. Conclusions

Data acquired using laser scanning technology constitute a reliable source of information. Based on them, a great deal of detailed spatial analysis can be carried out using a Geographic Information System (GIS). This combination makes it possible to perform advanced topographic analysis, terrain modeling, object identification, and monitoring of environmental changes. Using LiDAR data with GIS, it is possible to effectively conduct comprehensive research and effectively manage geographic space.
The study uses OPALS software and the Pycrown package for tree detection. Recognizing trees in high-density areas posed a significant challenge to the algorithms, often leading to misidentification of tree tops. The next steps involved analyzing the detected tops in the context of a wind model that identifies potential windthrow locations based on direction. The study showed that the most common wind was a western wind, with gusts exceeding 20 m/s. The southeast wind was the most dangerous, as it was the strongest, but it occurred singularly during the two years analyzed and represents an anomaly. The inclusion of this anomaly in the study significantly increased the number of potential windthrows. The conducted research shows that an important stage in analyzing the risk of tree fall is the selection of data processing methods and considering additional atmospheric factors in the analysis, such as wind direction and strength. The OPALS method outperformed others in terms of tree detection, achieving an accuracy level of 74%.
The presented results clearly show that for the selected section of the S6 highway in Poland, there is a real danger of a tree falling on the road lane. Taking the results from OPLAS as the best depending on the selected variant, it is concluded that between 140 and 577 trees pose a real danger of falling on the S6 road in high winds. This is contrary to what the Directorate of National Roads and Highways claims, and these results also show the wrong attitude to the presented danger for about 84% of drivers. This study is valuable information for the GDDKiA in terms of the dangers of windthrows of trees growing along the S6 road, but it is also useful for application reasons, as this procedure can be applied to any highway where there is uncertainty about the existing dangers.
In further research, the authors will focus on improving the effectiveness of tree detection using orthophotos and deep learning. The use of additional data and machine learning in particular should improve tree identification in forest areas with high tree density.

Author Contributions

Conceptualization, T.K.; methodology, T.K. and D.W.; software, T.K. and D.W.; validation, T.K., D.W. and G.S.; formal analysis, T.K., M.S.-K., M.S. and B.C.; investigation, T.K., D.W., G.S., M.S.-K., M.S. and B.C.; writing—original draft preparation, T.K., D.W. and M.S.-K.; writing—review and editing, T.K., D.W., G.S., M.S.-K., M.S. and B.C.; visualization, D.W.; supervision, T.K. All authors have read and agreed to the published version of the manuscript.

Funding

This research received no external funding.

Institutional Review Board Statement

Not applicable.

Informed Consent Statement

Not applicable.

Data Availability Statement

The original contributions presented in the study are included in the article, further inquiries can be directed to the corresponding author.

Conflicts of Interest

The authors declare no conflicts of interest.

References

  1. Wagner, W.; Ulrich, A.; Melzer, T.; Briese, C.; Kraus, K. From Single-Pulse to Full-Waveform Airborne Laser Scanners: Potential and Practical Challenges. Int. Arch. Photogramm. Remote Sens. Geoinf. Sci. 2004, 35, 414–419. [Google Scholar]
  2. Zhou, Q. Digital Elevation Model and Digital Surface Model. In International Encyclopedia of Geography; Richardson, D., Castree, N., Goodchild, M.F., Kobayashi, A., Liu, W., Marston, R.A., Eds.; Wiley: Hoboken, NJ, USA, 2017; pp. 1–17. ISBN 978-0-470-65963-2. [Google Scholar]
  3. Zhou, Q.; Zhu, A.-X. The Recent Advancement in Digital Terrain Analysis and Modeling. Int. J. Geogr. Inf. Sci. 2013, 27, 1269–1271. [Google Scholar] [CrossRef]
  4. Hu, L.; He, Z.; Liu, J.; Zheng, C. Method for Measuring the Information Content of Terrain from Digital Elevation Models. Entropy 2015, 17, 7021–7051. [Google Scholar] [CrossRef]
  5. Ahmad, F.; Goparaju, L.; Qayum, D.A. Natural Resource Mapping Using Landsat and Lidar towards Identifying Digital Elevation, Digital Surface and Canopy Height Models. Int. J. Environ. Sci. Nat. Resour. 2017, 2, 8. [Google Scholar]
  6. Gdulová, K.; Marešová, J.; Barták, V.; Szostak, M.; Červenka, J.; Moudrý, V. Use of TanDEM-X and SRTM-C Data for Detection of Deforestation Caused by Bark Beetle in Central European Mountains. Remote Sens. 2021, 13, 3042. [Google Scholar] [CrossRef]
  7. Szostak, M. Automated Land Cover Change Detection and Forest Succession Monitoring Using LiDAR Point Clouds and GIS Analyses. Geosciences 2020, 10, 321. [Google Scholar] [CrossRef]
  8. Khosravipour, A.; Skidmore, A.K.; Wang, T.; Isenburg, M.; Khoshelham, K. Effect of Slope on Treetop Detection Using a LiDAR Canopy Height Model. ISPRS J. Photogramm. Remote Sens. 2015, 104, 44–52. [Google Scholar] [CrossRef]
  9. Lisein, J.; Pierrot-Deseilligny, M.; Bonnet, S.; Lejeune, P. A Photogrammetric Workflow for the Creation of a Forest Canopy Height Model from Small Unmanned Aerial System Imagery. Forests 2013, 4, 922–944. [Google Scholar] [CrossRef]
  10. Mohan, M.; Silva, C.A.; Klauberg, C.; Jat, P.; Catts, G.; Cardil, A.; Hudak, A.T.; Dia, M. Individual Tree Detection from Unmanned Aerial Vehicle (UAV) Derived Canopy Height Model in an Open Canopy Mixed Conifer Forest. Forests 2017, 8, 340. [Google Scholar] [CrossRef]
  11. Mielcarek, M.; Stereńczak, K.; Khosravipour, A. Testing and Evaluating Different LiDAR-Derived Canopy Height Model Generation Methods for Tree Height Estimation. Int. J. Appl. Earth Obs. Geoinf. 2018, 71, 132–143. [Google Scholar] [CrossRef]
  12. Socha, J.; Hawryło, P.; Pierzchalski, M.; Stereńczak, K.; Krok, G.; Wężyk, P.; Tymińska-Czabańska, L. An Allometric Area-Based Approach—A Cost-Effective Method for Stand Volume Estimation Based on ALS and NFI Data. For. Int. J. For. Res. 2020, 93, 344–358. [Google Scholar] [CrossRef]
  13. Cosenza, D.; Vogel, J.; Broadbent, E.; Silva, C. Silvicultural Experiment Assessment Using Lidar Data Collected from an Unmanned Aerial Vehicle. For. Ecol. Manag. 2022, 522, 120489. [Google Scholar] [CrossRef]
  14. Hawryło, P.; Francini, S.; Chirici, G.; Giannetti, F.; Parkitna, K.; Krok, G.; Mitelsztedt, K.; Lisańczuk, M.; Stereńczak, K.; Ciesielski, M.; et al. The Use of Remotely Sensed Data and Polish NFI Plots for Prediction of Growing Stock Volume Using Different Predictive Methods. Remote Sens. 2020, 12, 3331. [Google Scholar] [CrossRef]
  15. Georgopoulos, N.; Gitas, I.Z.; Korhonen, L.; Antoniadis, K.; Stefanidou, A. Estimating Crown Biomass in a Multilayered Fir Forest Using Airborne LiDAR Data. Remote Sens. 2023, 15, 2919. [Google Scholar] [CrossRef]
  16. Chen, S.; Chen, M.; Zhao, B.; Mao, T.; Wu, J.; Bao, W. Urban Tree Canopy Mapping Based on Double-Branch Convolutional Neural Network and Multi-Temporal High Spatial Resolution Satellite Imagery. Remote Sens. 2023, 15, 765. [Google Scholar] [CrossRef]
  17. Falkowski, M.; Smith, A.; Gessler, P.; Hudak, A.; Vierling, L.; Evans, J. The Influence of Conifer Forest Canopy Cover on the Accuracy of Two Individual Tree Measurement Algorithms Using Lidar Data. Can. J. Remote Sens. 2008, 34, S338–S350. [Google Scholar] [CrossRef]
  18. Sparks, A.M.; Smith, A.M.S. Accuracy of a LiDAR-Based Individual Tree Detection and Attribute Measurement Algorithm Developed to Inform Forest Products Supply Chain and Resource Management. Forests 2022, 13, 3. [Google Scholar] [CrossRef]
  19. Zörner, J.; Dymond, J.; Shepherd, J.; Jolly, B. PyCrown—Fast Raster-Based Individual Tree Segmentation for LiDAR Data; Landcare Research Ltd.: Lincoln, New Zealand, 2018. [Google Scholar]
  20. Hawryło, P.; Socha, J.; Wężyk, P.; Ochał, W.; Krawczyk, W.; Miszczyszyn, J.; Tymińska-Czabańska, L. How to Adequately Determine the Top Height of Forest Stands Based on Airborne Laser Scanning Point Clouds? For. Ecol. Manag. 2024, 551, 121528. [Google Scholar] [CrossRef]
  21. Hyyppa, J.; Kelle, O.; Lehikoinen, M.; Inkinen, M. A Segmentation-Based Method to Retrieve Stem Volume Estimates from 3-D Tree Height Models Produced by Laser Scanners. IEEE Trans. Geosci. Remote Sens. 2001, 39, 969–975. [Google Scholar] [CrossRef]
  22. Lisiewicz, M.; Kamińska, A.; Stereńczak, K. Recognition of Specified Errors of Individual Tree Detection Methods Based on Canopy Height Model. Remote Sens. Appl. Soc. Environ. 2022, 25, 100690. [Google Scholar] [CrossRef]
  23. Dalponte, M.; Coomes, D.A. Tree-Centric Mapping of Forest Carbon Density from Airborne Laser Scanning and Hyperspectral Data. Methods Ecol. Evol. 2016, 7, 1236–1245. [Google Scholar] [CrossRef]
  24. Wulder, M.; Niemann, K.O.; Goodenough, D.G. Local Maximum Filtering for the Extraction of Tree Locations and Basal Area from High Spatial Resolution Imagery. Remote Sens. Environ. 2000, 73, 103–114. [Google Scholar] [CrossRef]
  25. Kto Ocenia Stan Drzew Przy Drogach Krajowych?—Generalna Dyrekcja Dróg Krajowych i Autostrad-Oddział Łódź—Portal Gov.pl. Available online: https://www.gov.pl/web/gddkia-lodz/kto-ocenia-stan-drzew-przy-drogach-krajowych (accessed on 24 April 2024).
  26. Kankare, V. The Prediction of Single-Tree Biomass, Logging Recoveries and Quality Attributes with Laser Scanning Techniques. Diss. For. 2015, 2015, 49. [Google Scholar] [CrossRef]
  27. Tomczak, A.; Stępień, G.; Abramowski, T.; Bejger, A. Subsea Wellhead Spud-in Marking and as-Built Position Estimation Method Based on Ultra-Short Baseline Acoustic Positioning. Measurement 2022, 195, 111155. [Google Scholar] [CrossRef]
  28. van der Schriek, M.; Beex, W. The Application of LiDAR-Based DEMs on WWII Conflict Sites in the Netherlands. J. Confl. Archaeol. 2018, 12, 94–114. [Google Scholar] [CrossRef]
  29. Kukko, A.; Hyyppä, J. Laser Scanner Simulator for System Analysis and Algorithm Development: A Case with Forest Measurements. Int. Soc. Photogramm. Remote Sens. ISPRS 2012, 36, 234–240. [Google Scholar]
  30. Riczu, P.; Tamás, J.; Nagy, A.; Fórián, T.; Nagy, G.; Jancsó, T.; Nyéki, J. 3D Laser Scanning and Modeling of Single Trees in Karcag Research Center. Analele Univ. Oradea Fasc. Protecția Mediu. 2011, 17, 277–284. [Google Scholar]
  31. Bakuła, K. Multispectral Airborne Laser Scanning—A New Trend in the Development of LiDAR Technology. Arch. Fotogram. Kartogr. I Teledetekcji 2015, 27, 25–44. [Google Scholar]
  32. Pyrchla, K.; Tomczak, A.; Zaniewicz, G.; Pyrchla, J.; Kowalska, P. Analysis of the Dynamic Height Distribution at the Estuary of the Odra River Based on Gravimetric Measurements Acquired with the Use of a Light Survey Boat—A Case Study. Sensors 2020, 20, 6044. [Google Scholar] [CrossRef]
  33. Kogut, T.; Bakuła, K. Improvement of Full Waveform Airborne Laser Bathymetry Data Processing Based on Waves of Neighborhood Points. Remote Sens. 2019, 11, 1255. [Google Scholar] [CrossRef]
  34. Salas, E.A.L. Waveform LiDAR Concepts and Applications for Potential Vegetation Phenology Monitoring and Modeling: A Comprehensive Review. Geo-Spat. Inf. Sci. 2021, 24, 179–200. [Google Scholar] [CrossRef]
  35. Geoportal.gov.pl—Geoportal Infrastruktury Informacji Przestrzennej. Available online: https://www.geoportal.gov.pl/ (accessed on 24 April 2024).
  36. LASer (LAS) File Format Exchange Activities—ASPRS. Available online: https://www.asprs.org/divisions-committees/lidar-division/laser-las-file-format-exchange-activities (accessed on 24 April 2024).
  37. Illarionova, S.; Shadrin, D.; Ignatiev, V.; Shayakhmetov, S.; Trekin, A.; Oseledets, I. Estimation of the Canopy Height Model from Multispectral Satellite Imagery with Convolutional Neural Networks. IEEE Access 2022, 10, 34116–34132. [Google Scholar] [CrossRef]
  38. Pfeifer, N.; Mandlburger, G.; Otepka, J.; Karel, W. OPALS—A Framework for Airborne Laser Scanning Data Analysis. Comput. Environ. Urban Syst. 2014, 45, 125–136. [Google Scholar] [CrossRef]
  39. Allen, A.; Cardoso, A.; Wiatr, A.; Machado, C.; Paterlini, W.; Baker, J. Influence of Intensive Agriculture on Dry Deposition of Aerosol Nutrients. Artic. J. Braz. Chem. Soc 2010, 21, 87–97. [Google Scholar] [CrossRef]
  40. Poddaeva, O.; Fedosova, A. Extreme Wind Speeds Analysis Using Extended Wind Rose Based on Statistic Methods. Energy Rep. 2022, 8, 1177–1184. [Google Scholar] [CrossRef]
  41. Zięba-Kulawik, K.; Wężyk, P. Safe Trail—GIS Analyzes of Risk on Tourist Trails Based on PlanetScope and LiDAR Satellite Imagery. 2018. 4th Scientific Conference—“Nature for Man. Man for Nature” 2018. Available online: https://karolinaannazieba.wixsite.com/phd-labgeo/single-post/2014/05/02/life-at-16000-feet (accessed on 30 April 2024).
Figure 1. Discrete and full waveform LiDAR system, Reprinted/adapted with permission from Ref. [34].
Applsci 14 04479 g001
Figure 2. The range of the study and downloaded LIDAR indexes (PL-EVRF2007-NH).
Applsci 14 04479 g002
Figure 3. The model of data preparation in ArcGIS PRO software.
Applsci 14 04479 g003
Figure 5. Tree identification scheme using PyCrown and Opals.
Applsci 14 04479 g005
Figure 6. Relationship between height of a tree and distance to nearest point on road.
Applsci 14 04479 g006
Figure 7. Sample summary of all tree detection methods.
Applsci 14 04479 g007
Figure 8. Example of incorrectly identified tree tops.
Applsci 14 04479 g008
Figure 9. Histogram of wind gusts.
Applsci 14 04479 g009
Figure 10. Histogram of wind directions.
Applsci 14 04479 g010
Figure 11. Example results. (A) Direction determined by median, (B) range of most common directions, (C) direction of maximum gusts.
Applsci 14 04479 g011
Table 1. Point classes [35,36].
ClassDescription
0points processed but not classified,
2points lying on the ground
3points representing low vegetation, i.e., in the range of 0–0.40 m
4points representing average vegetation, i.e., in the range of 0.40–2.00 m
5points representing high vegetation, i.e., in the range above 2.00 m
6points representing buildings, constructions, and engineering structures
7noise
8points representing water areas
12points from multiple coverage areas
Table 2. Thresholds of high wind threat, determined for forecast maps.
LevelDangerAverage 10 Min Wind SpeedWind Gust SpeedDescription of Levels
3VERY HIGH RISK>90 km/h (>25 m/s)>115 km/h
(>32 m/s)
Hurricane-force winds—cause destruction of entire buildings and flat-roofed structures, tear sections of industrial power lines and break their support structures, hinder vehicle travel, and uproot trees with their roots, causing windfall.
2HIGH RISK72 km/h–90 km/h
(20 m/s–25 m/s)
90 km/h–115 km/s (25 m/s–32 m/s)Strong gale—the wind can cause significant damage to buildings, break and uproot shallow-rooted trees, sway power line cables, and during settling or freezing rain, it can snap them due to overload.
1MODERATE RISK54 km/h–72 km/h (15 m/s–20 m/s)72 km/h–90 km/s (20 m/s–25 m/s)Gale—the wind overturns wooden fences, billboards, and road signs, can cause damage to buildings, tears off individual roof tiles, and breaks large tree branches. During snowfall, it causes snowdrifts and snowstorms.
0NORMAL STATENo forecast of strong winds.
Table 3. Detection of trees.
OPALSPyCrownPyCrownPyCrown
Raster resolution [m]0.250.250.251
Filter usedAdjusted automatically3 × 35 × 55 × 5
Number of trees detected9 30511,6676244366
Detection efficiency74%53%61%4%
Table 4. The trees detected after correction.
OPALSPyCrownPyCrownPyCrown
Raster resolution [m]0.250.250.251
Filter usedAdjusted automatically3 × 35 × 55 × 5
Number of trees detected9110
(−195)
11,582
(−85)
6209
(−35)
364
(−2)
Table 5. Results of the analysis using the nearest point to the road.
OPALSPyCrown 3 × 3PyCrown 5 × 5PyCrown 1M
Number of trees posing a threat14602126108349
Table 6. Number of selected trees at risk of falling on the highway using the wind model.
OPALSPyCrown 3 × 3PyCrown 5 × 5
Detected by AlgorithmManual Validation% of Correctly Detected TreesDetected by algorithmManual Validation% of Correctly Detected TreesDetected by AlgorithmManual Validation% of Correctly Detected Trees
Median14011481.41047269.2534890.6
Histogram31826182.134023067.615212582.2
Maximum gust57750186.8107055551.955242376.6
Disclaimer/Publisher’s Note: The statements, opinions and data contained in all publications are solely those of the individual author(s) and contributor(s) and not of MDPI and/or the editor(s). MDPI and/or the editor(s) disclaim responsibility for any injury to people or property resulting from any ideas, methods, instructions or products referred to in the content.

