
Healing of Undisturbed Slide Zone Soil: Experimental Study on the Huaipa Landslide in Sanmenxia City
Abstract
:1. Introduction
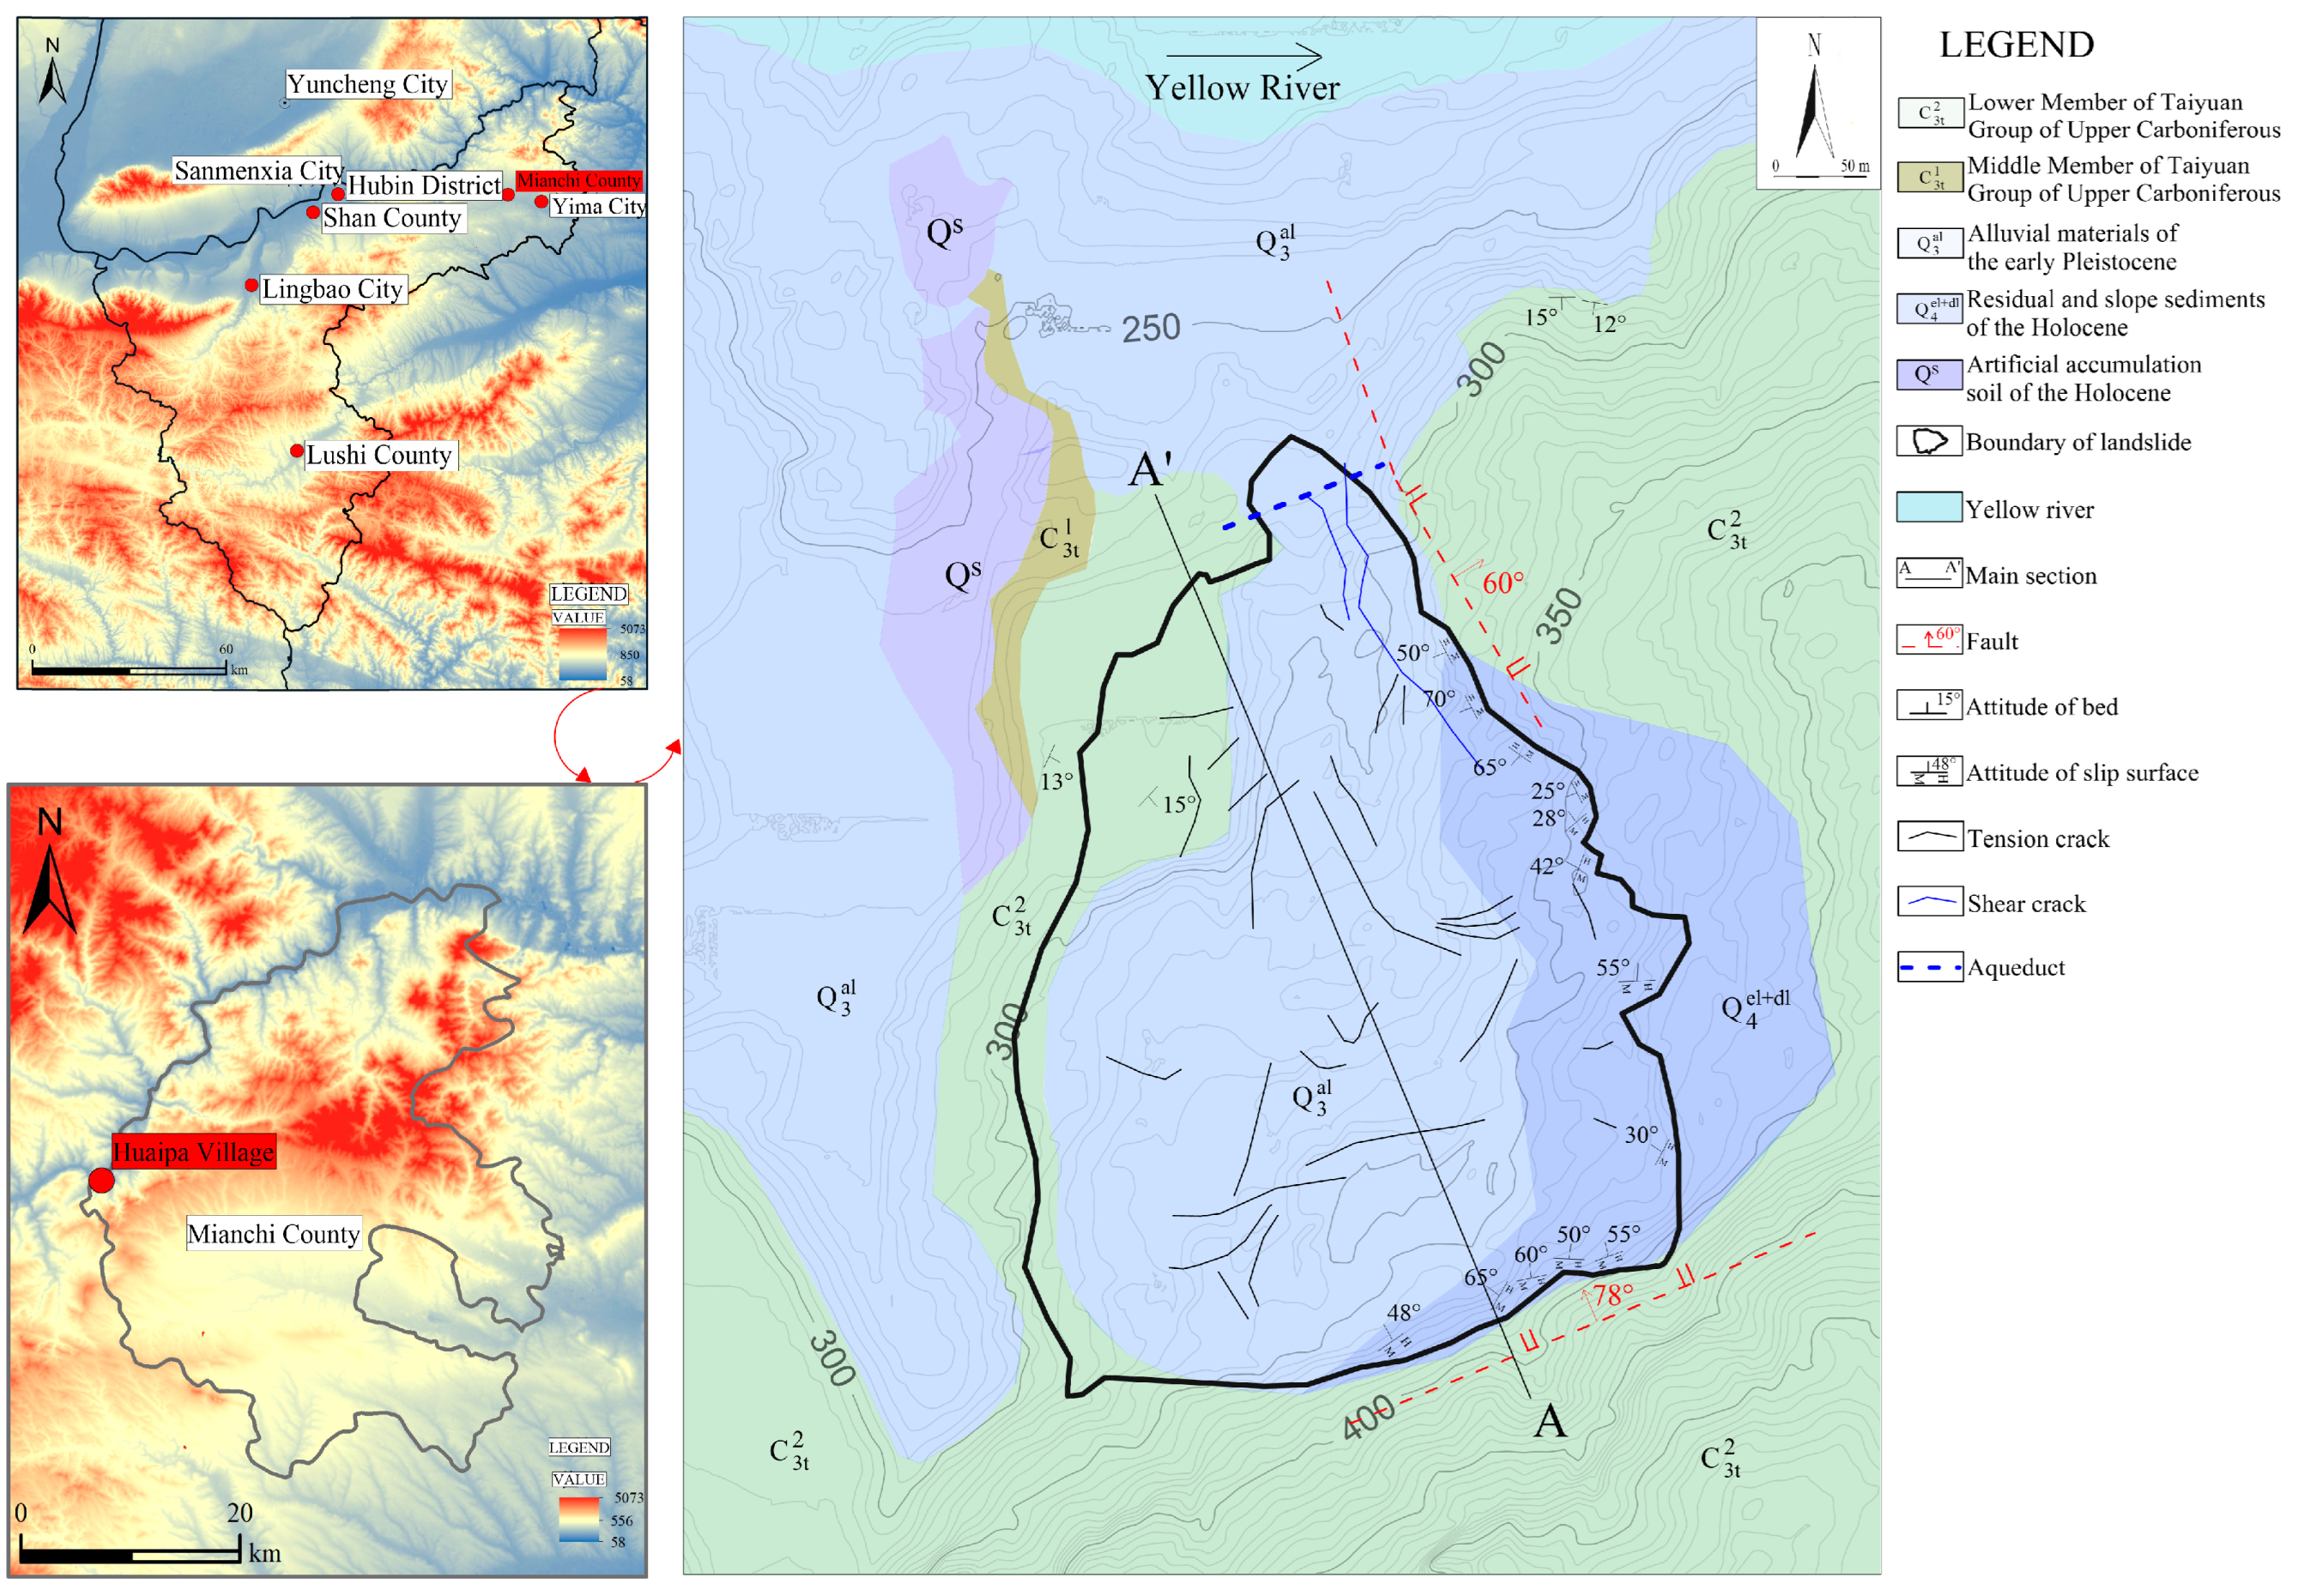
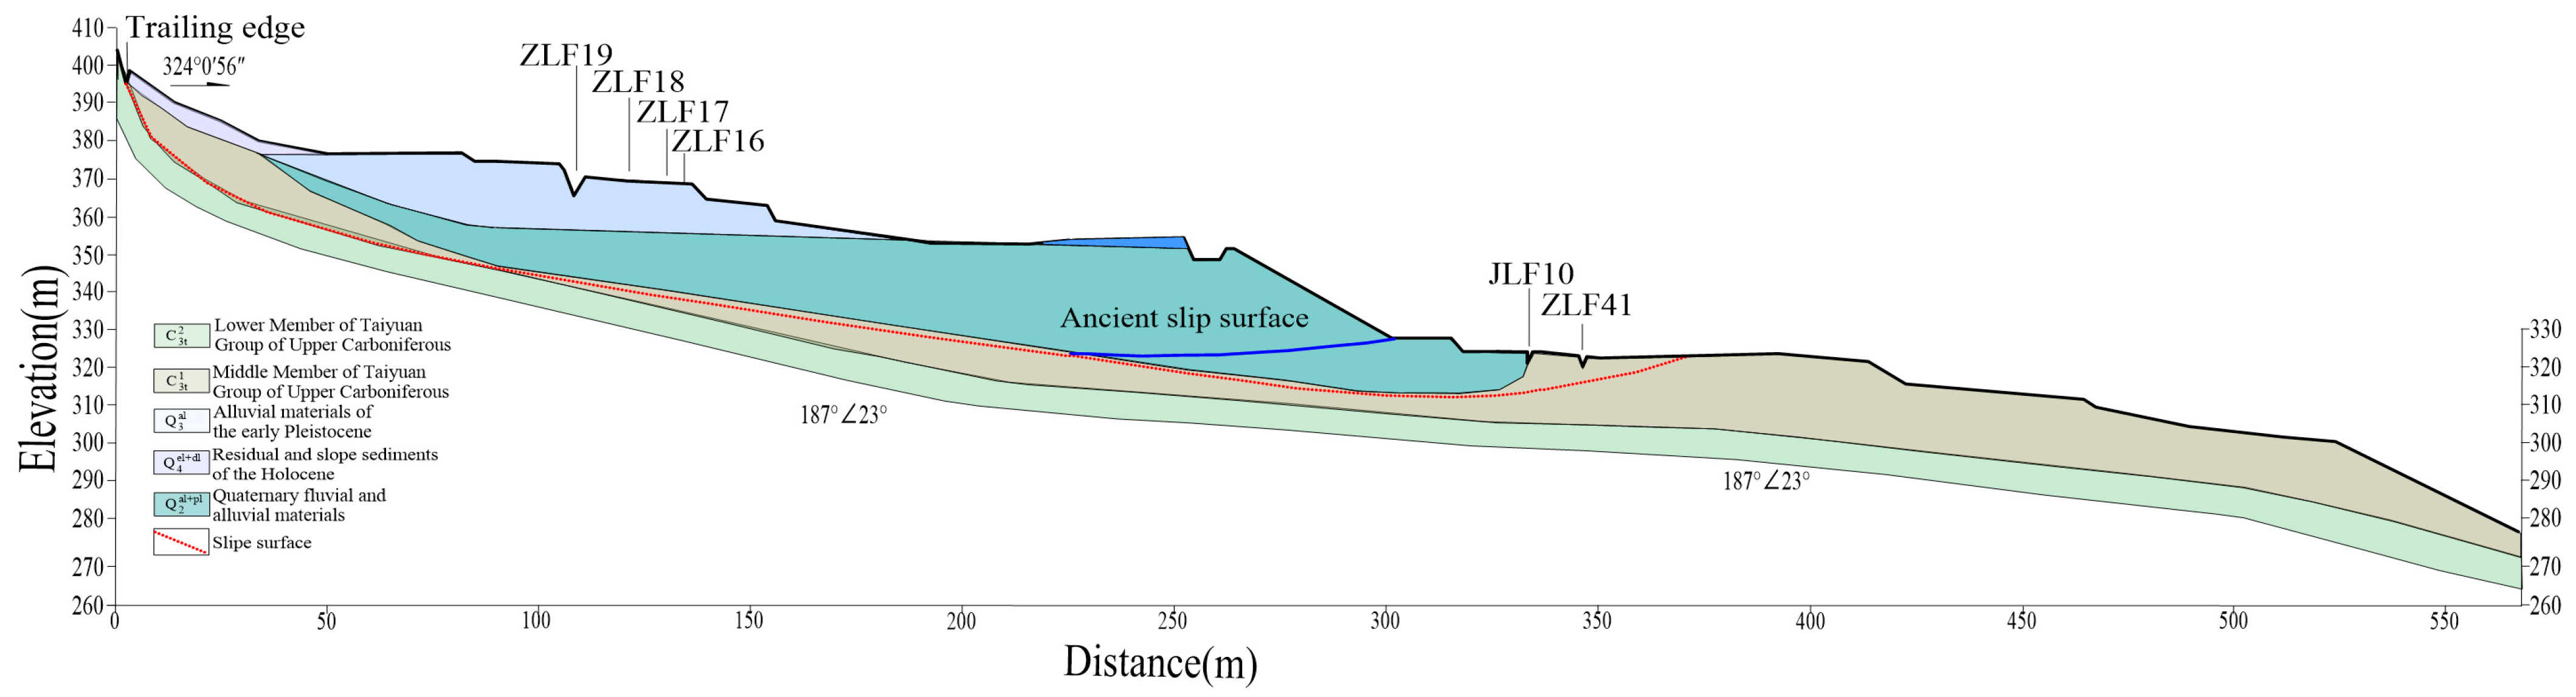
2. Project Profile
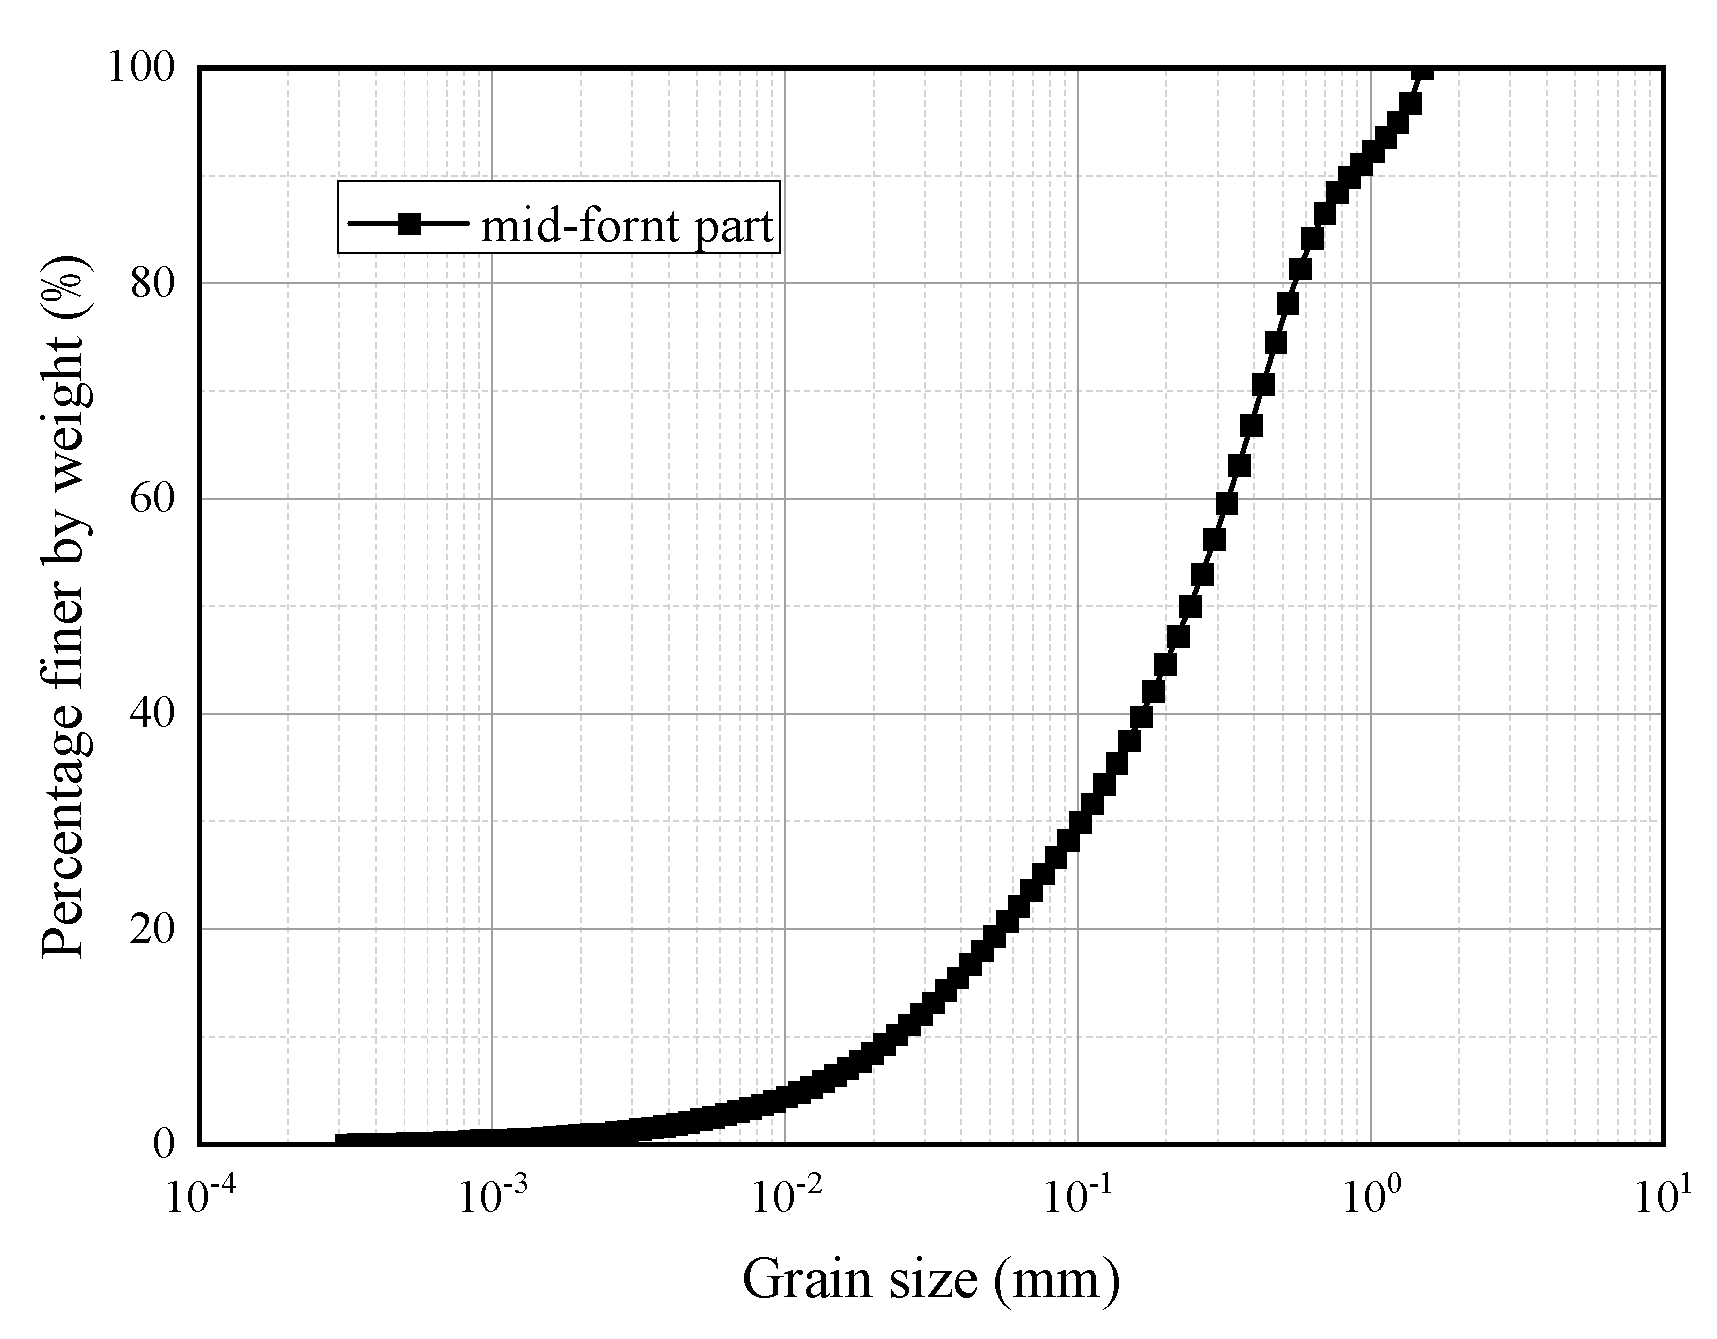
3. Basic Physical Properties of Slide Zone Soil
4. Test Scheme
- (1)
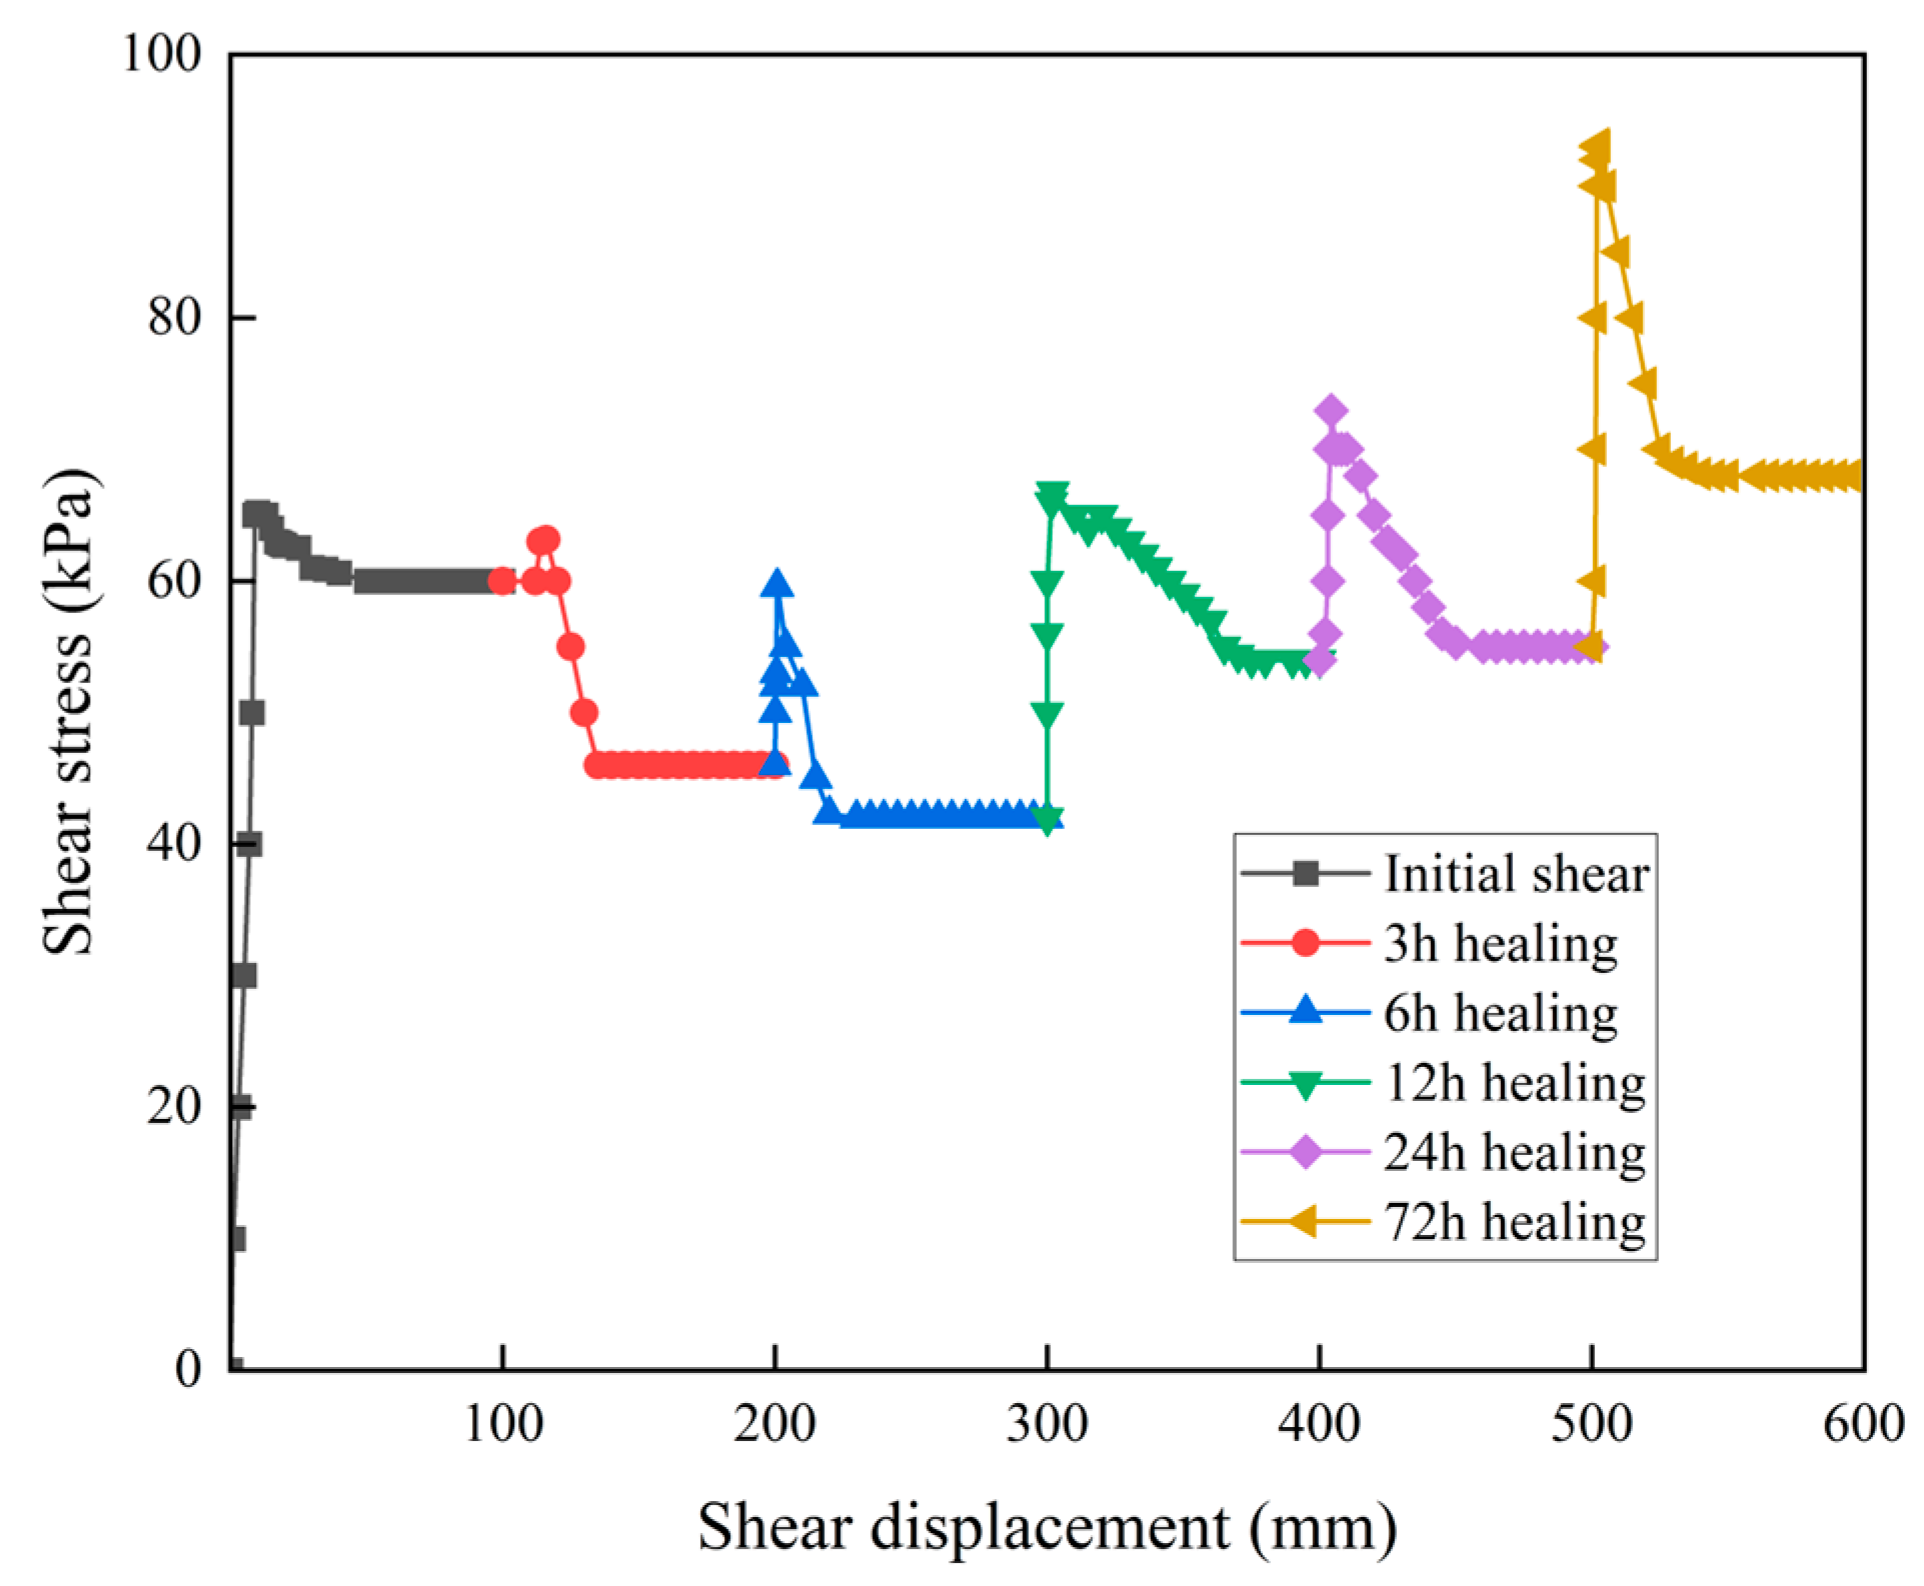
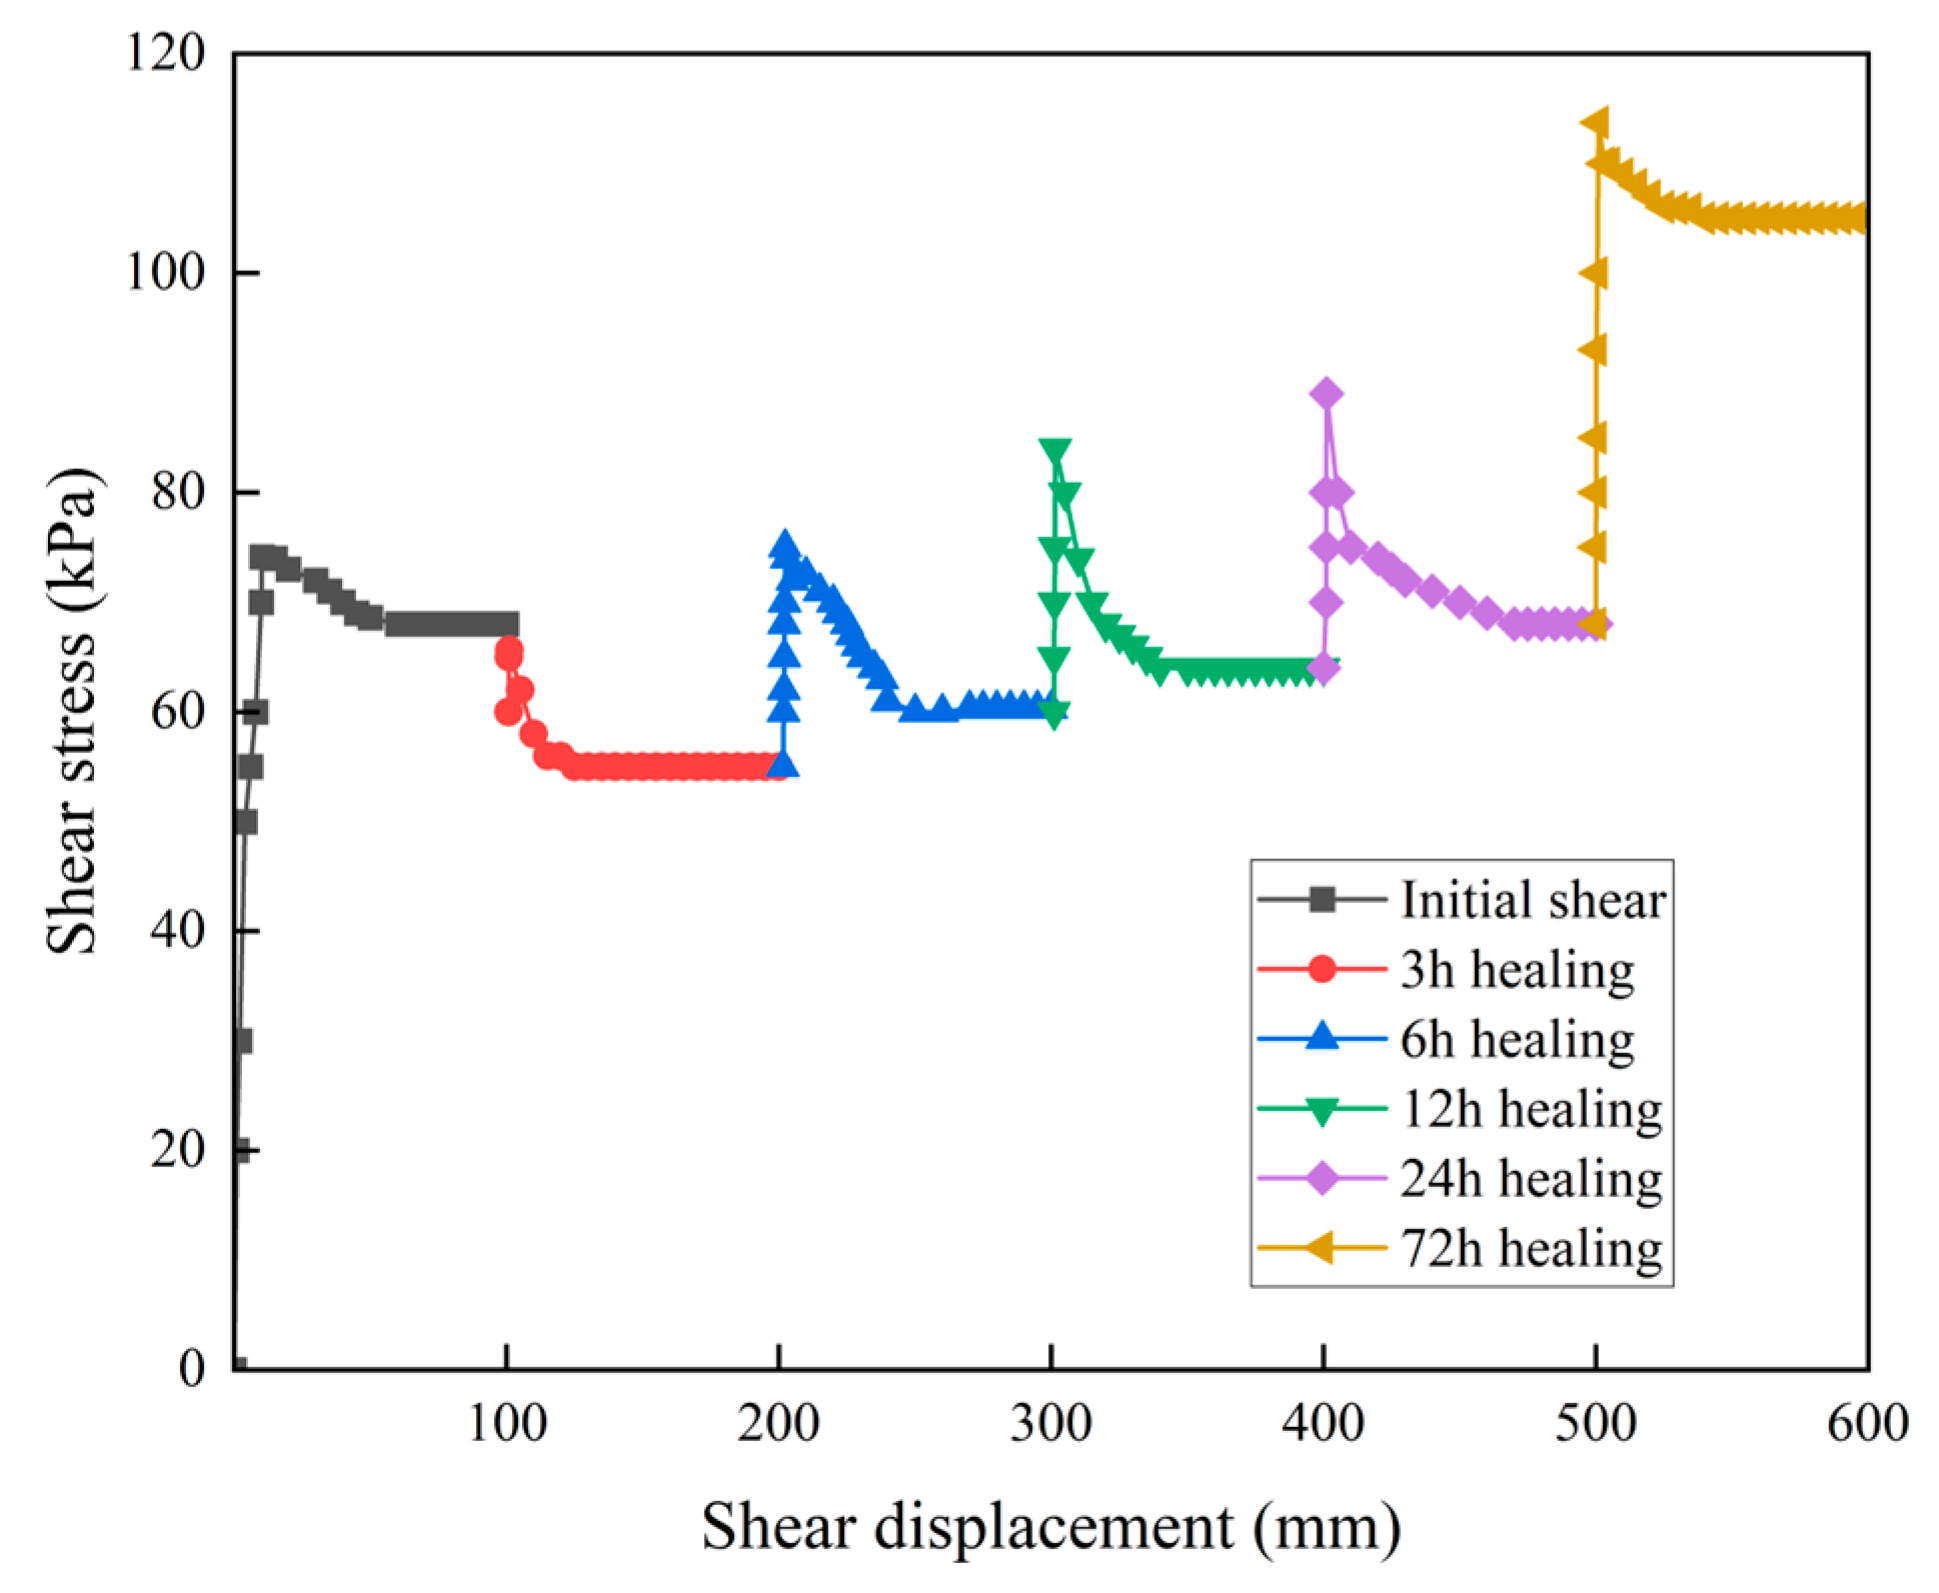
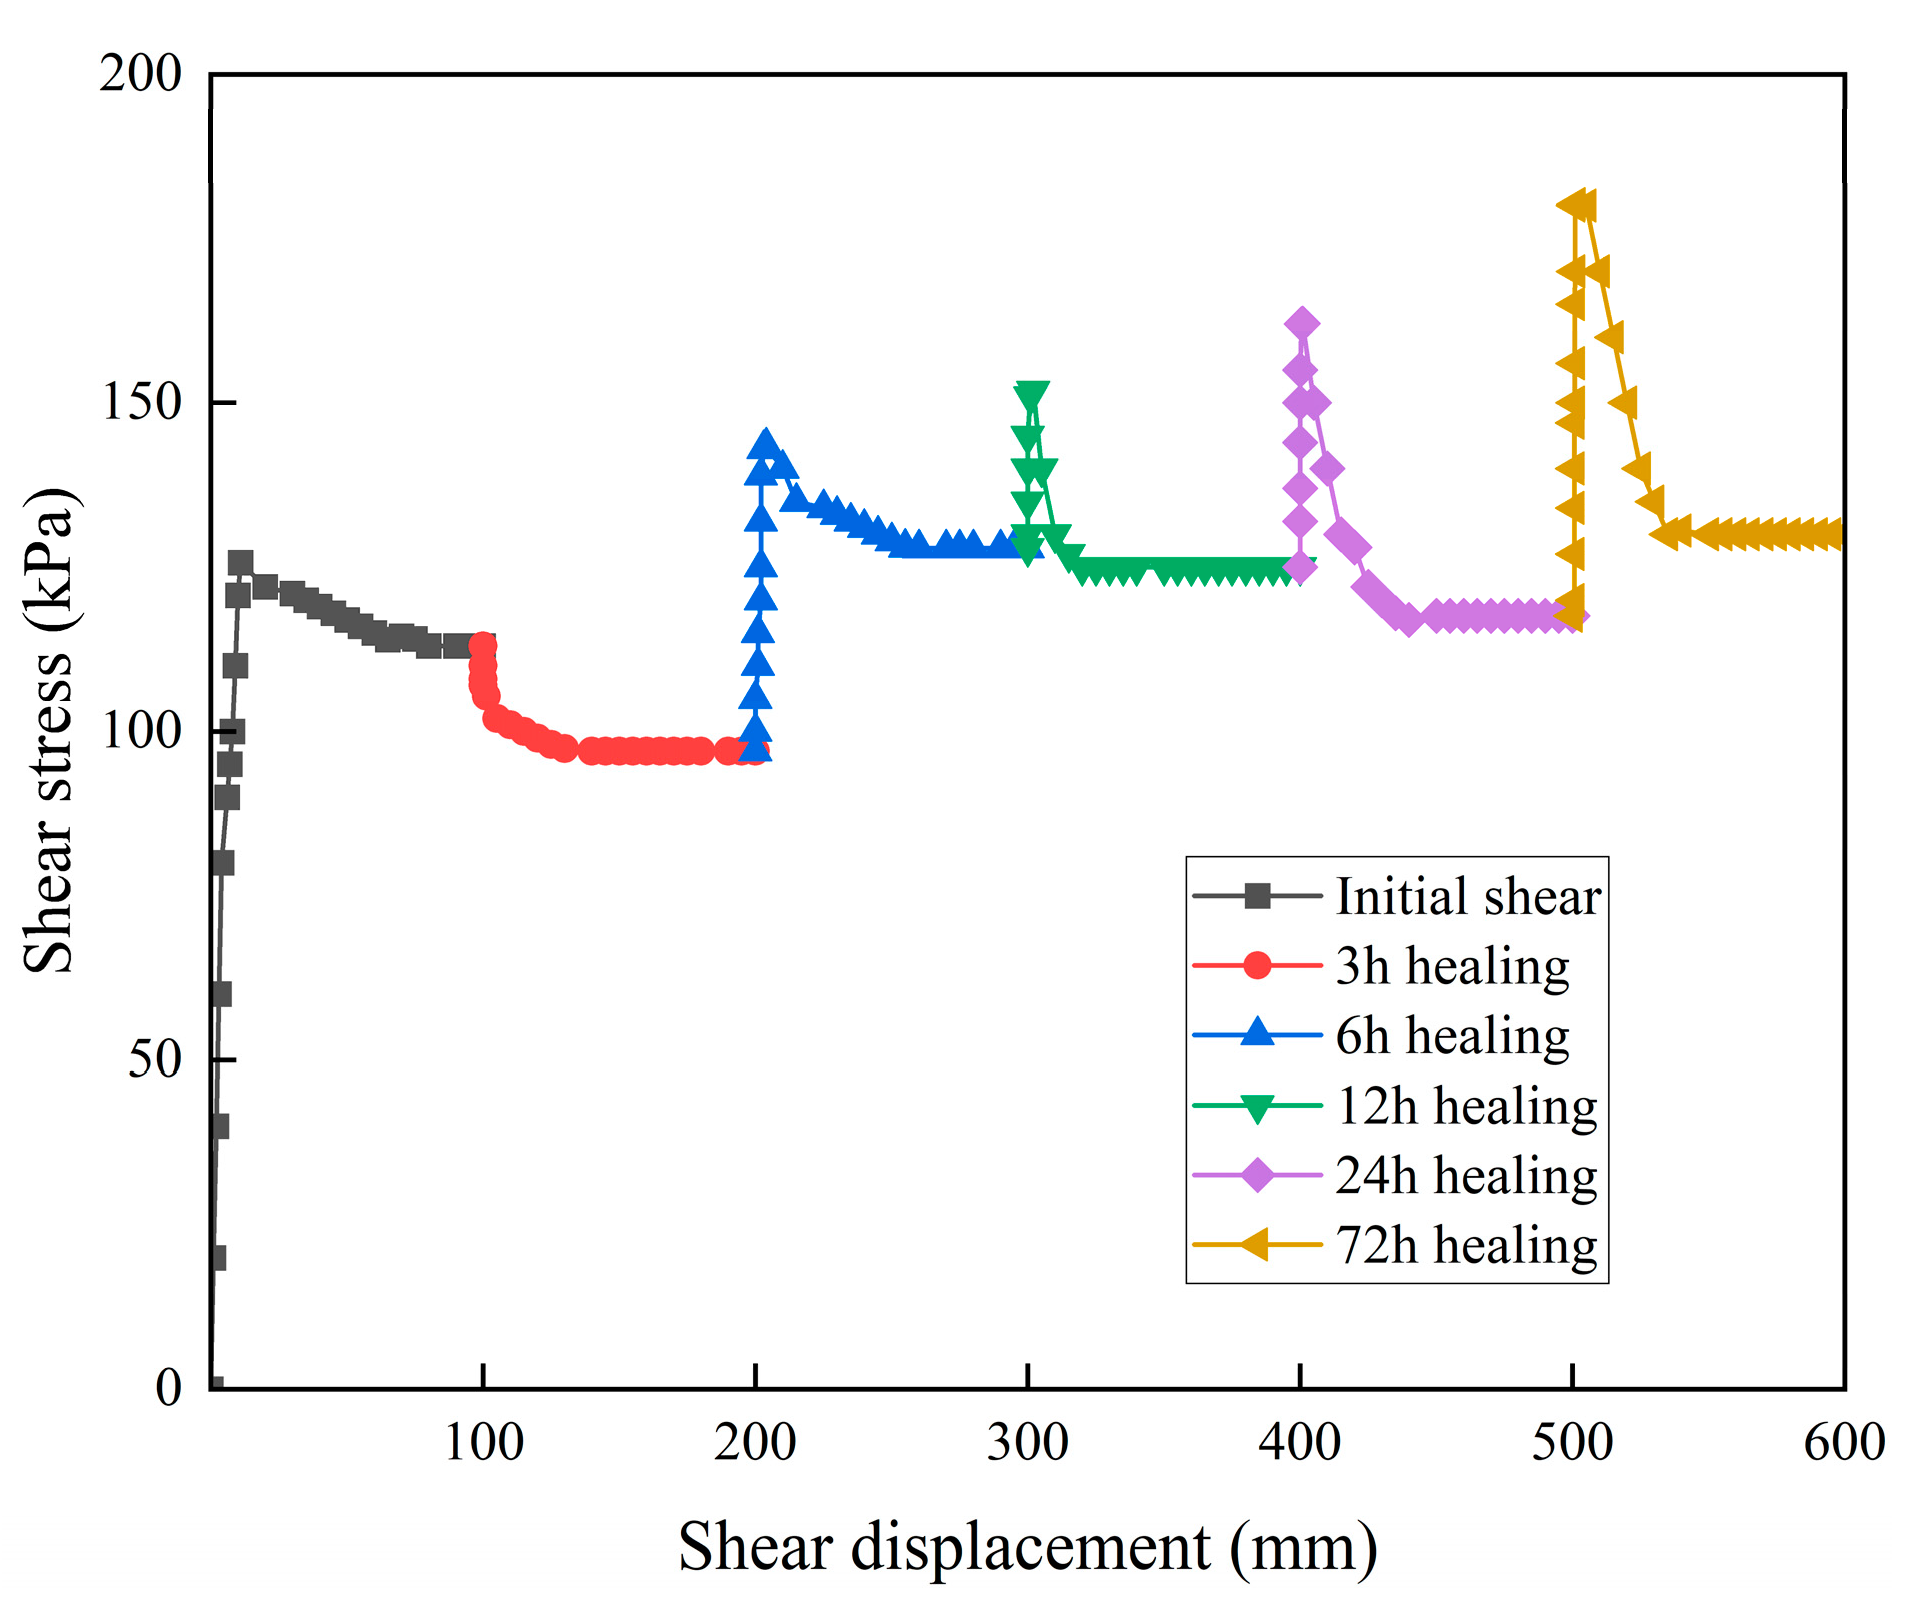
- After the consolidation of the slide zone soil was stable, shearing was applied at a rate of 0.2 mm/min. When the sample reached the residual strength for the first time, the vertical stress and shear stress were maintained, such that the undisturbed stress conditions during the reactivation of the Huaipa landslide could be reproduced. The sample was paused for 3 h and then was sheared to a new stable residual strength state. Then, the sample was paused for 6 h and sheared to the next residual state. Subsequently, it was paused for 12 h, sheared to the next residual state, paused for 24 h, sheared to the next residual state, paused for 72 h, and sheared to the final residual state.
- (2)
- The above shear cycle state was completed at three different vertical stresses: 50 kPa, 100 kPa, and 200 kPa.
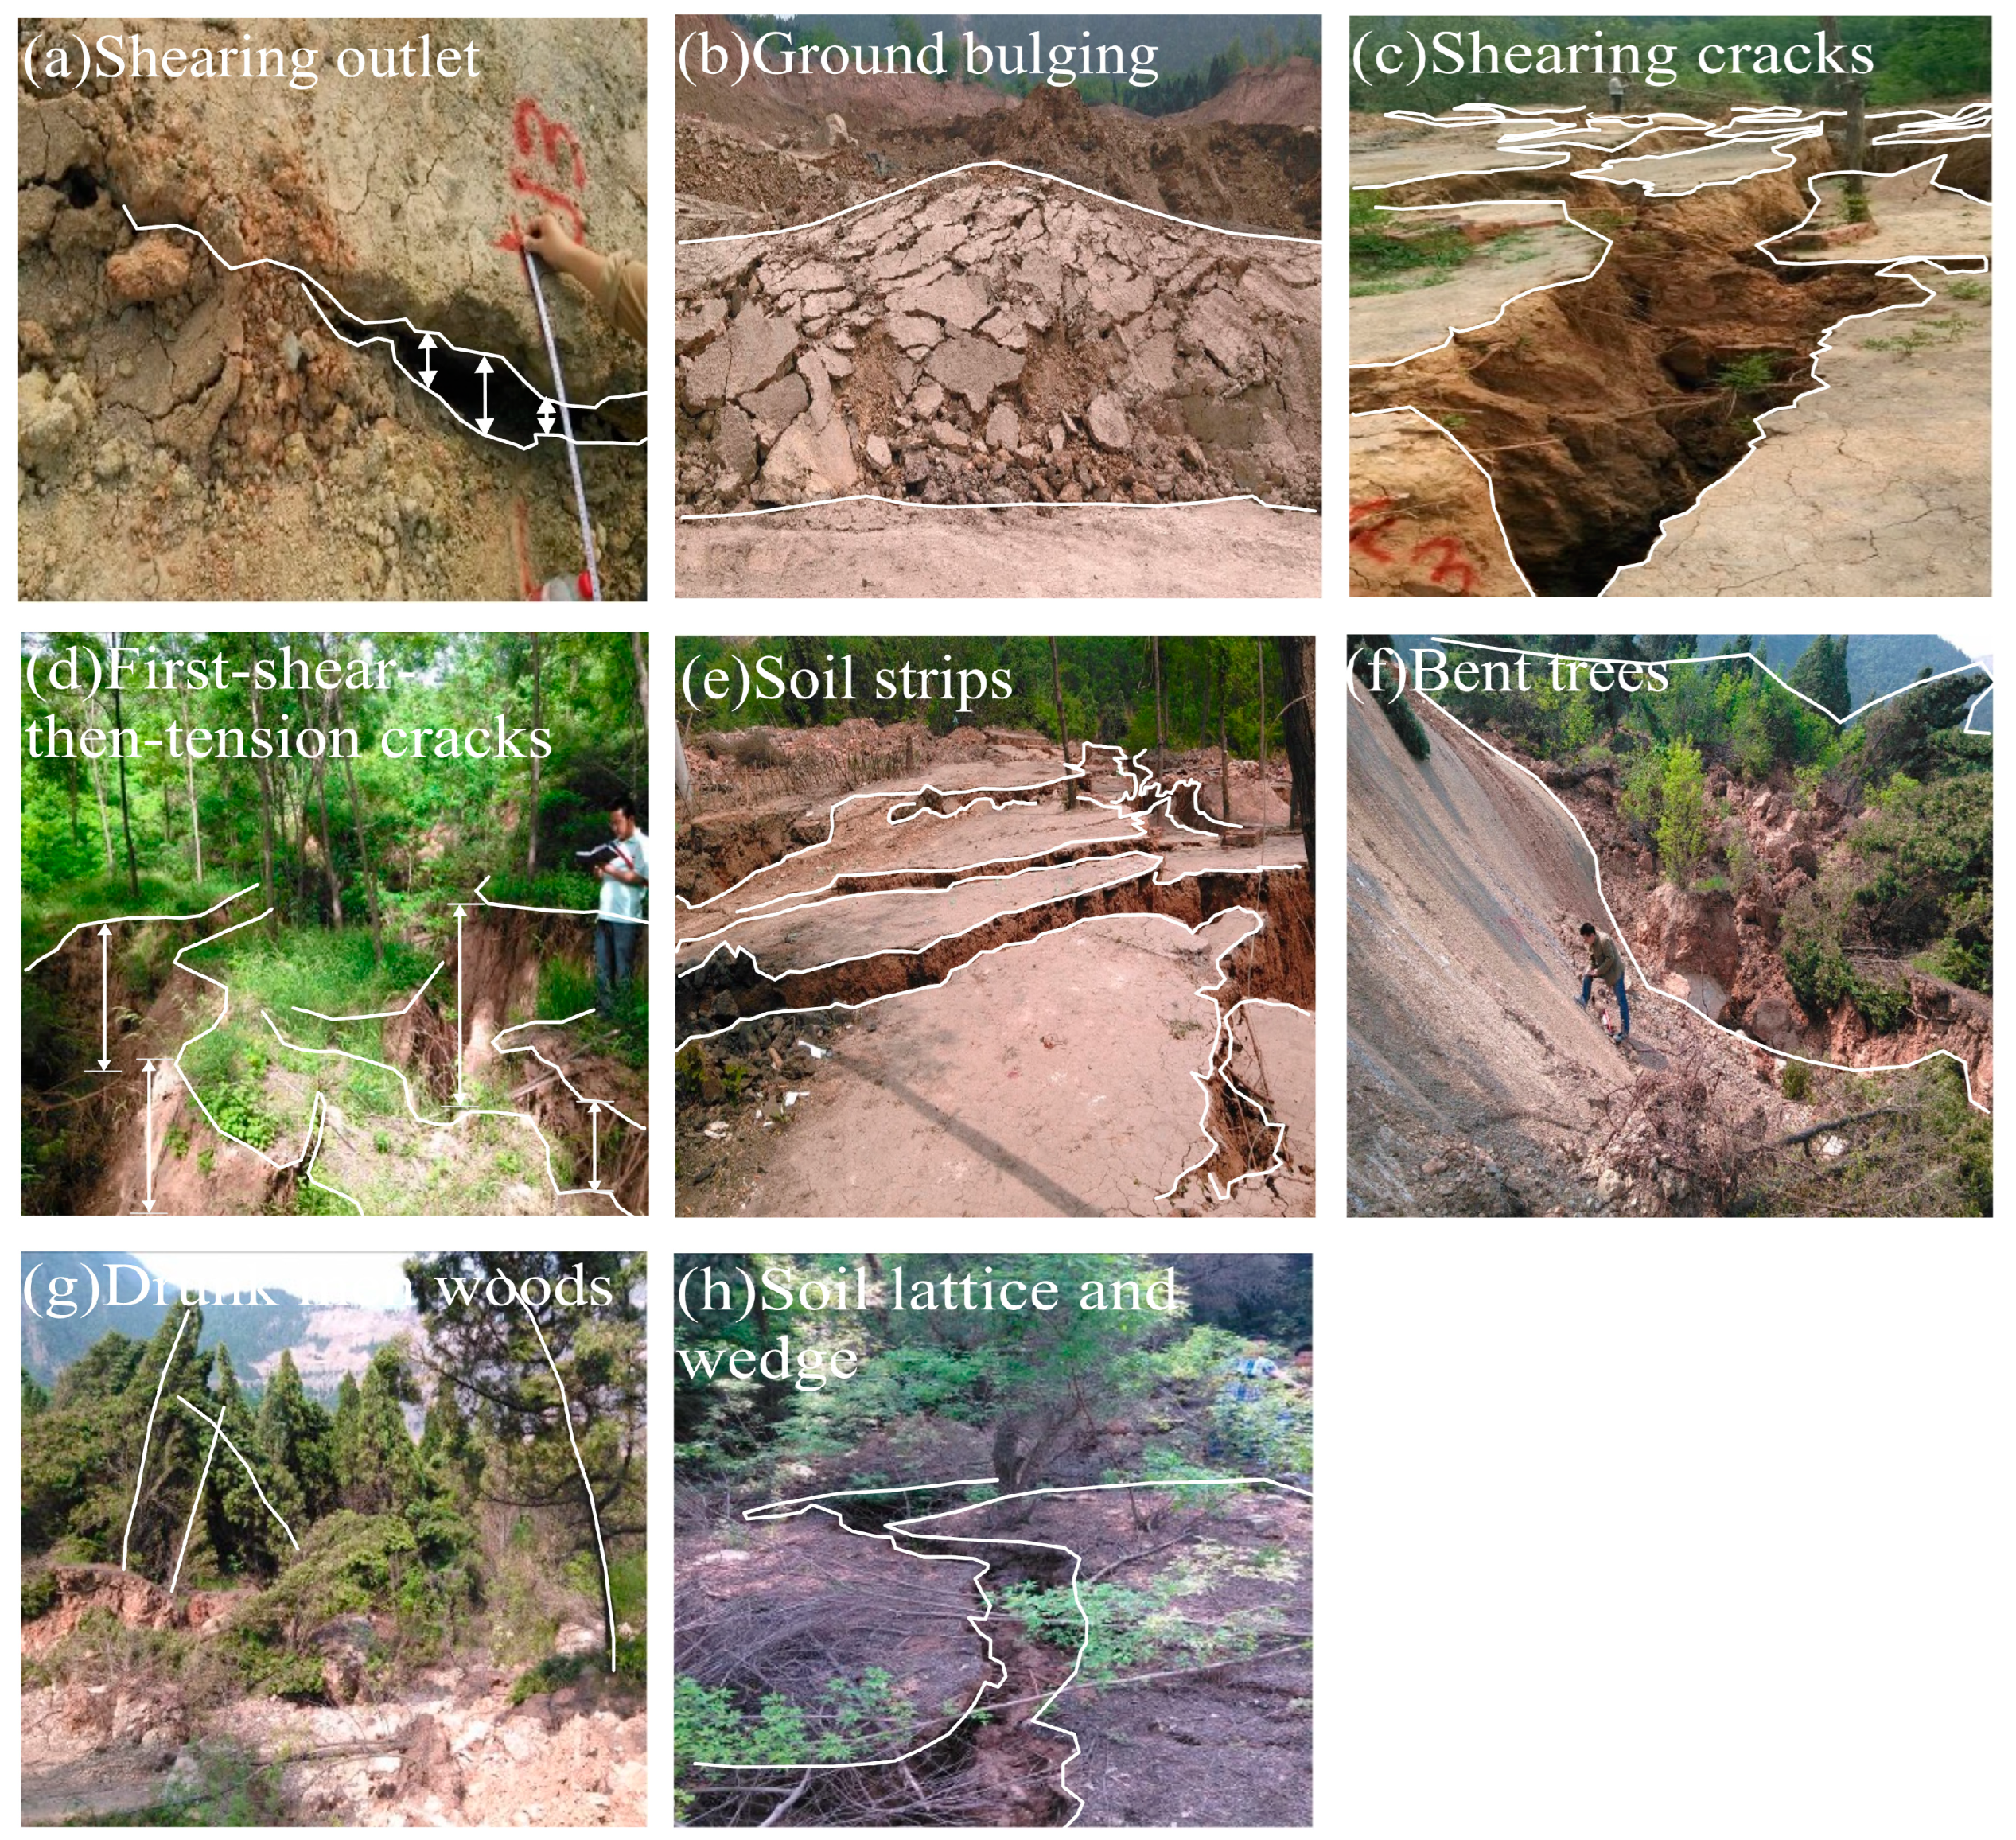
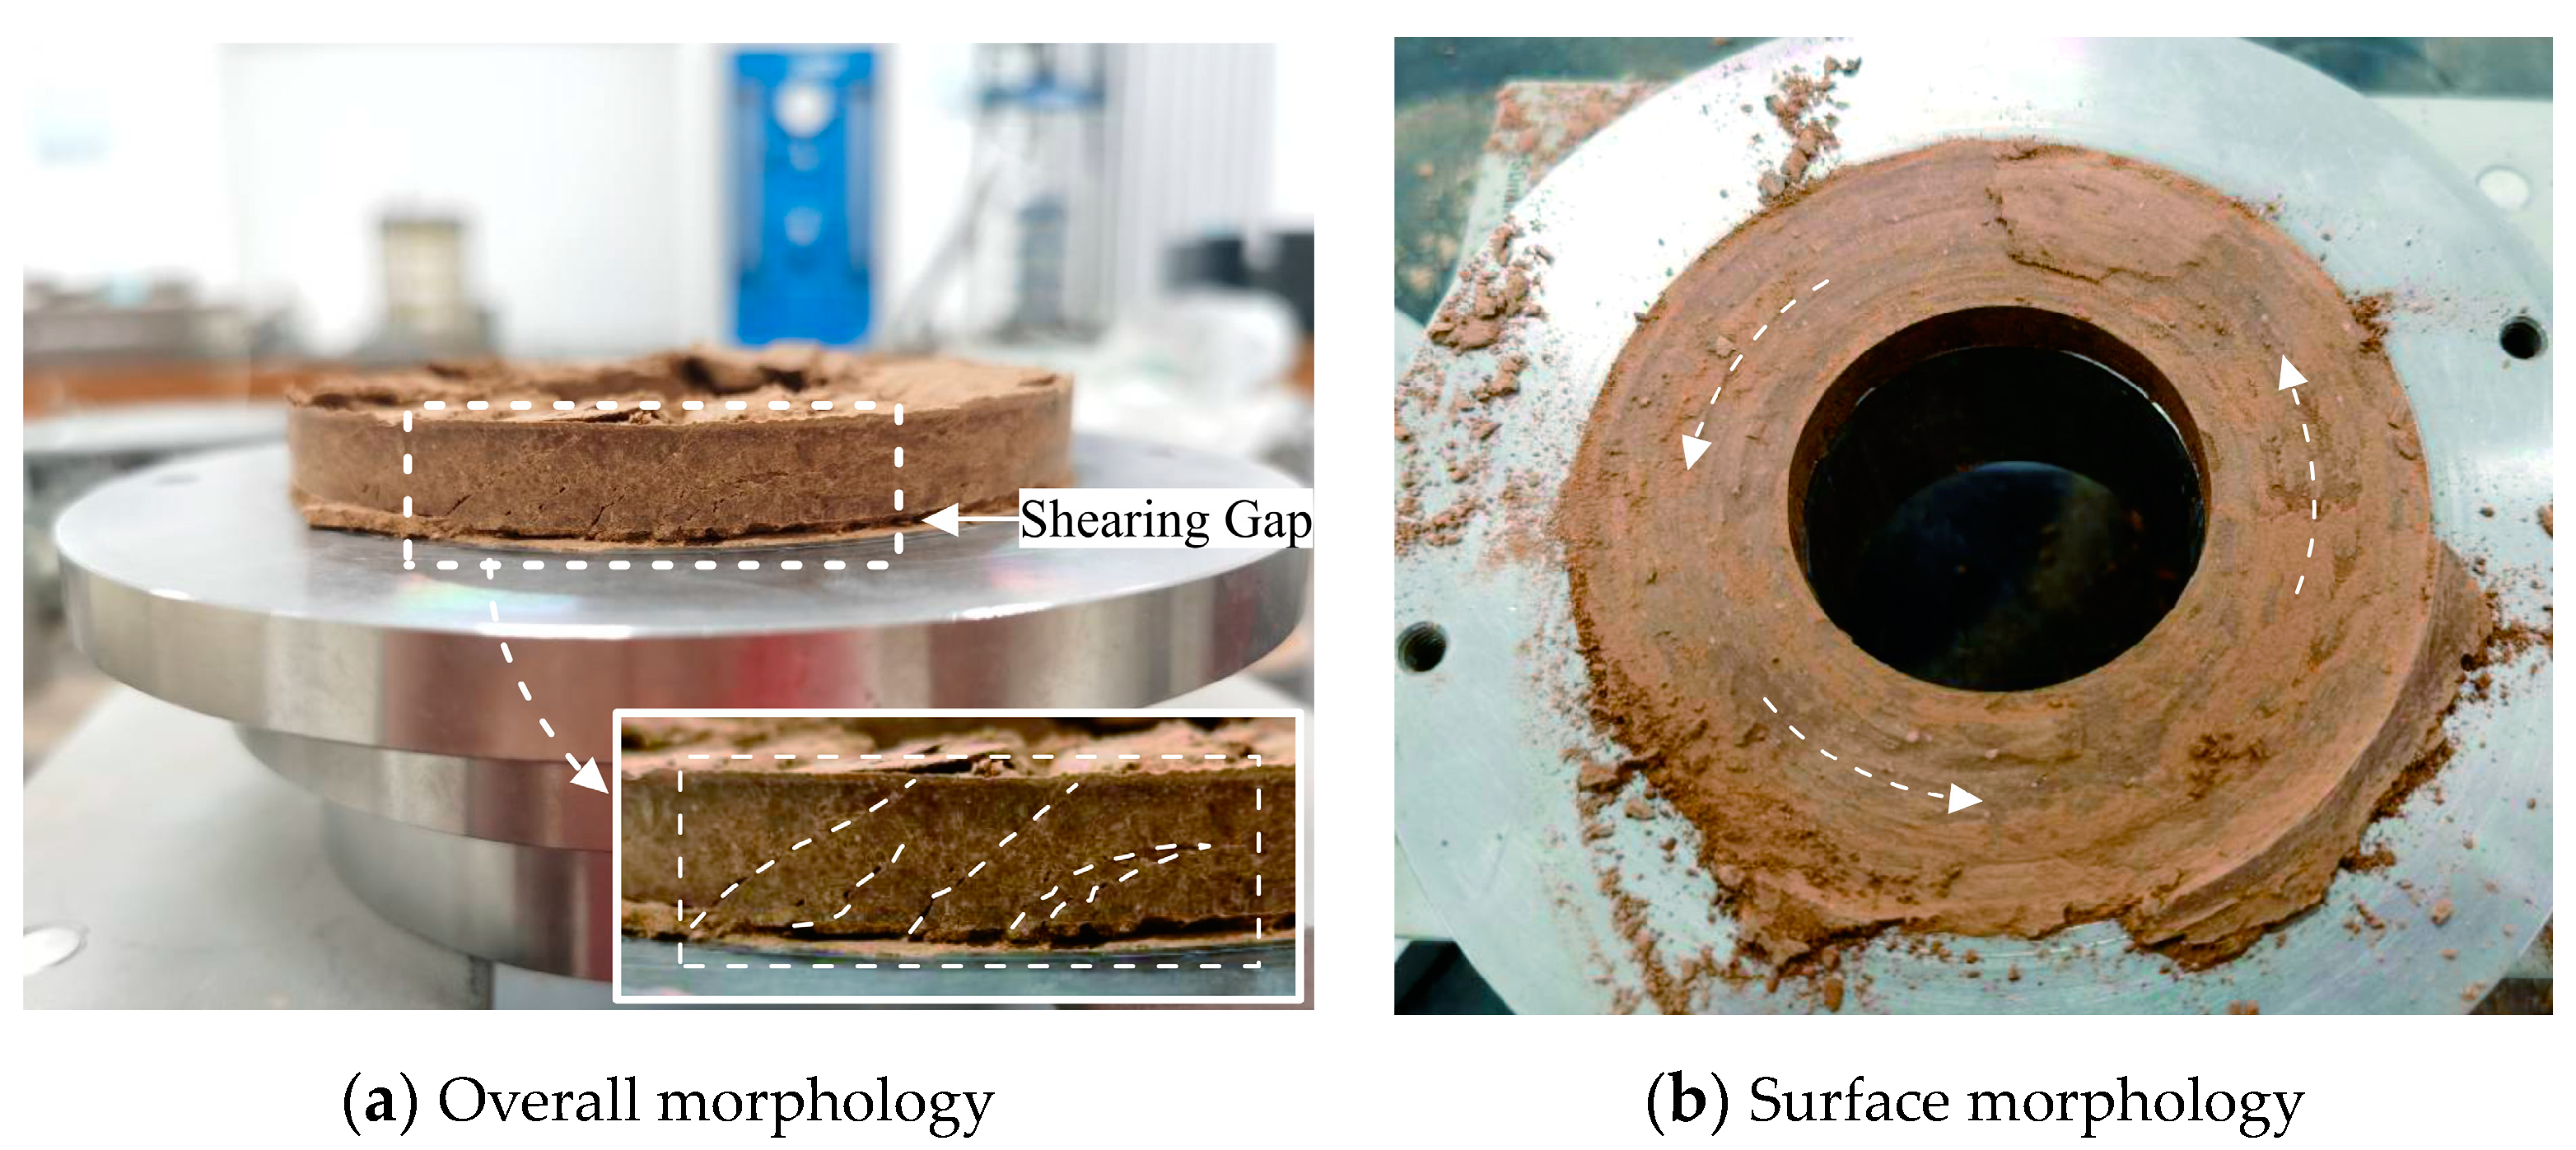
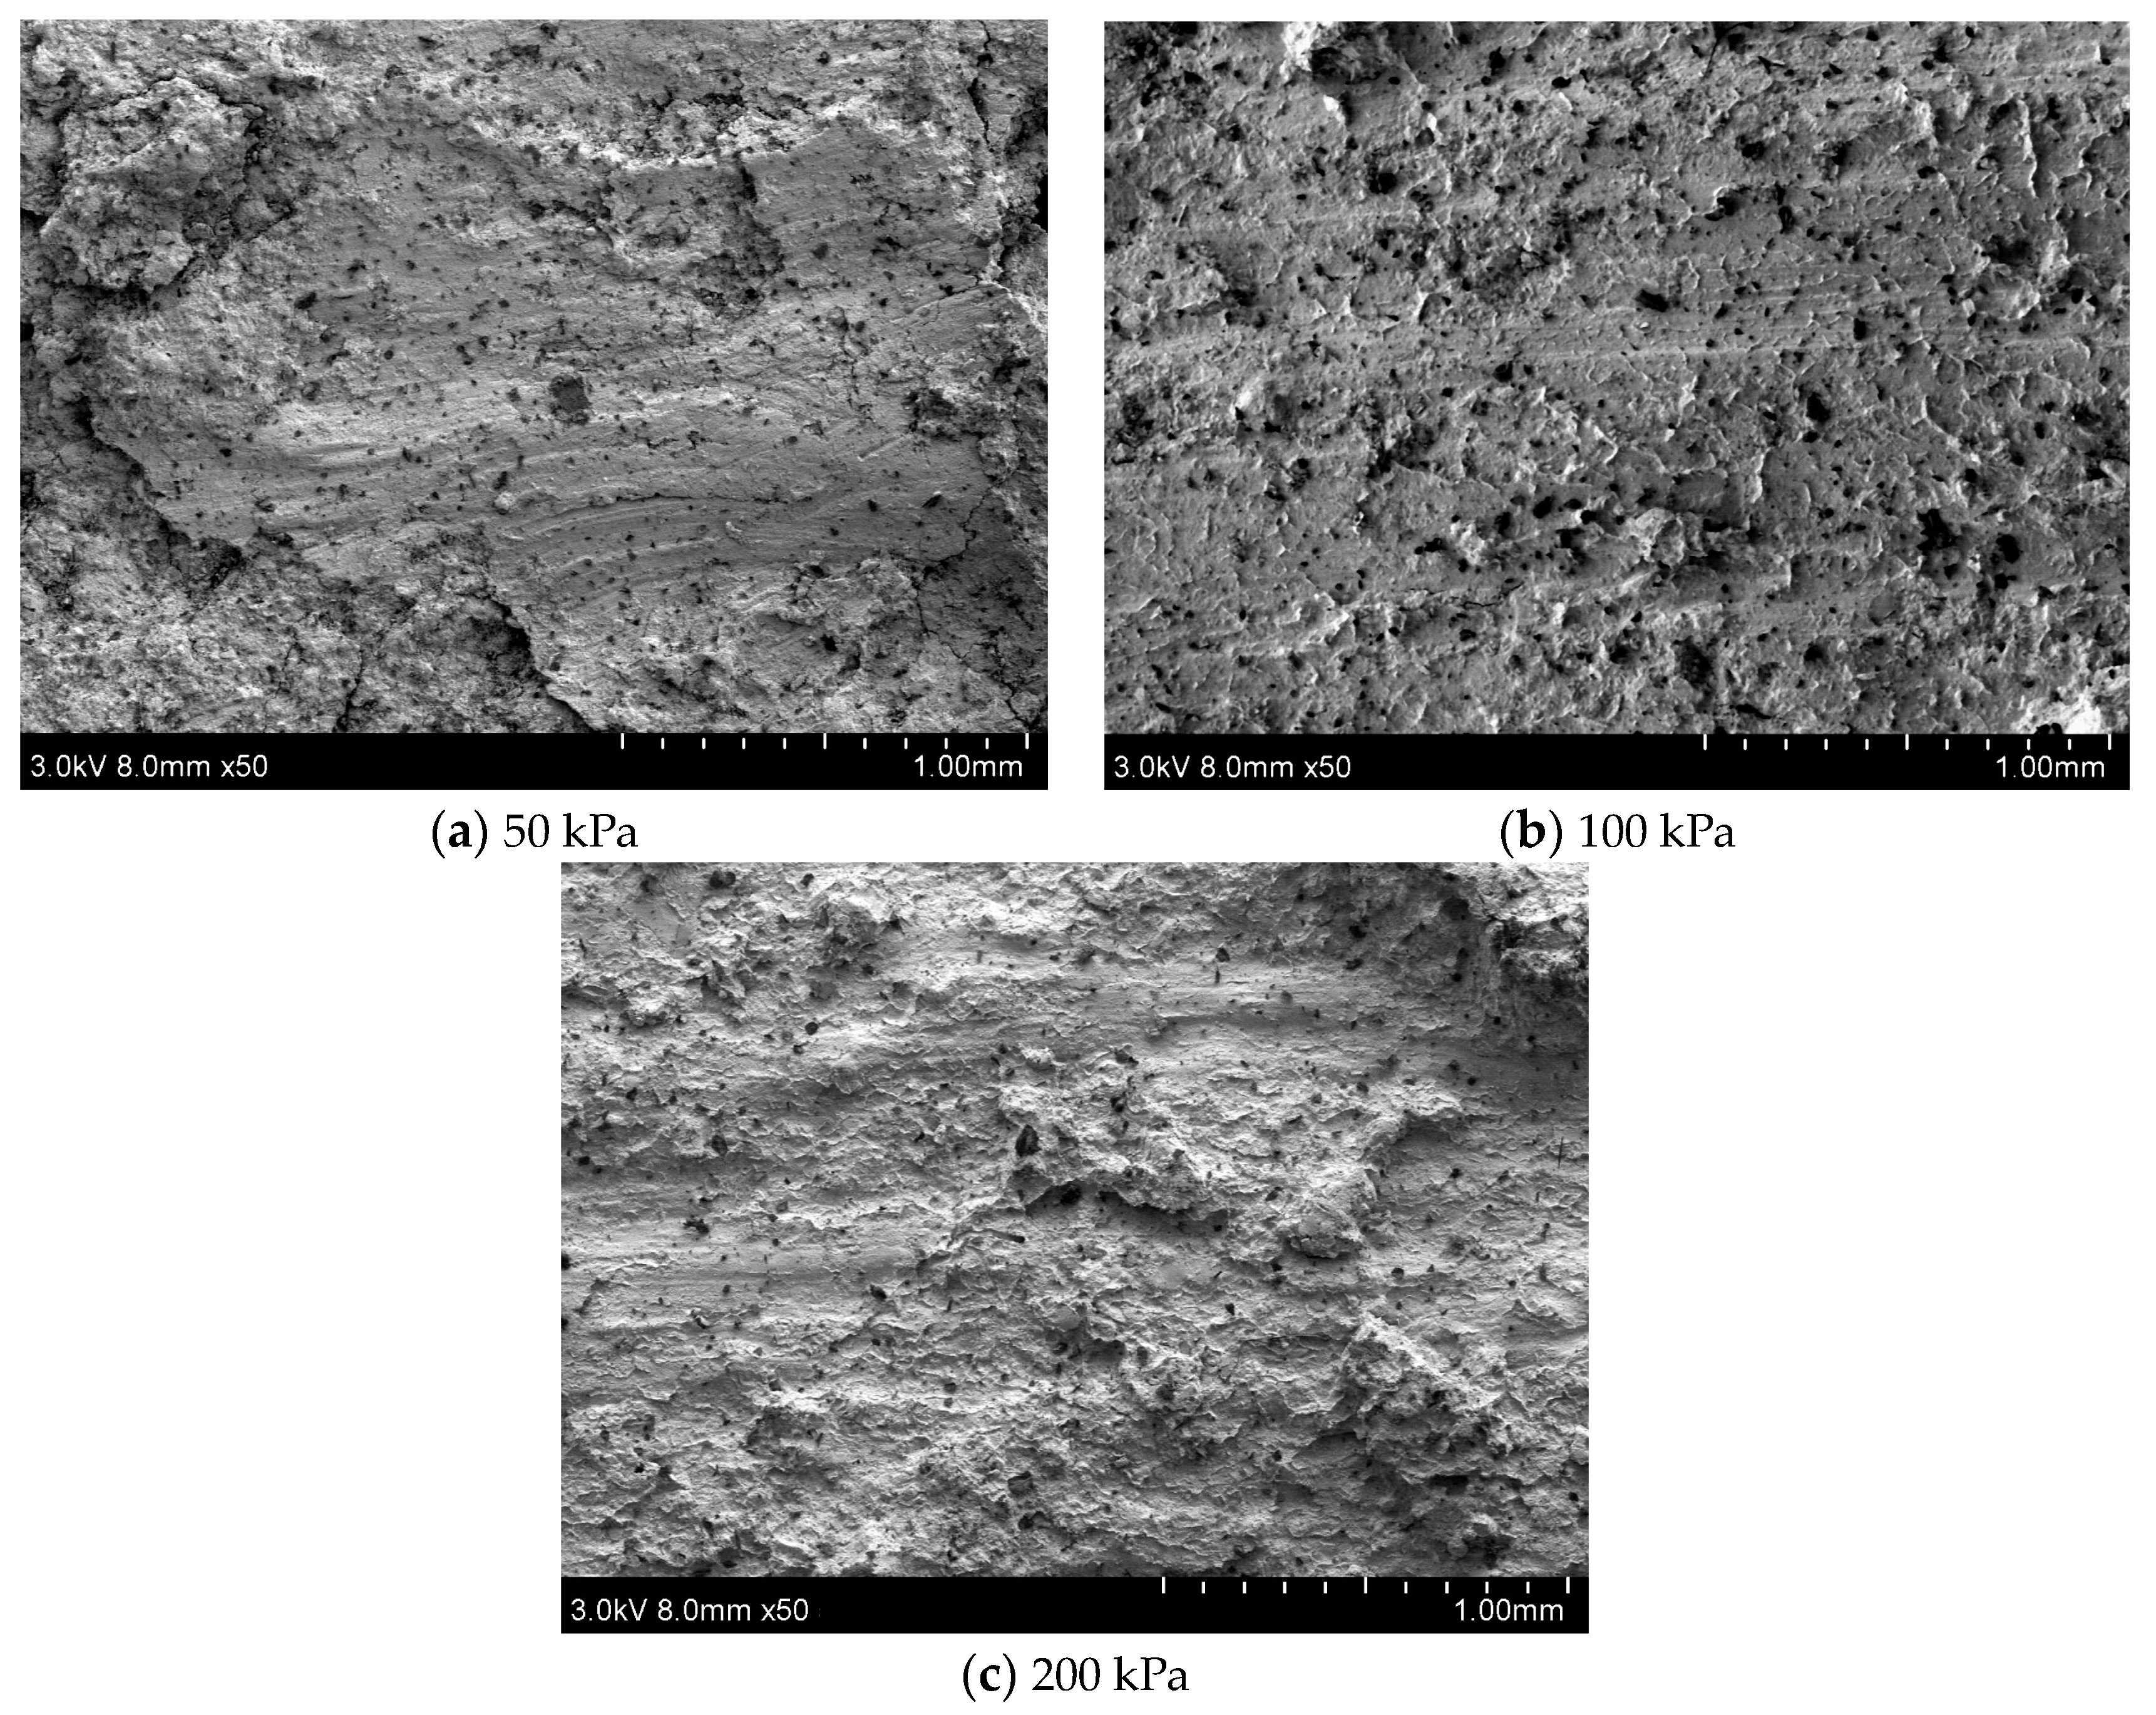
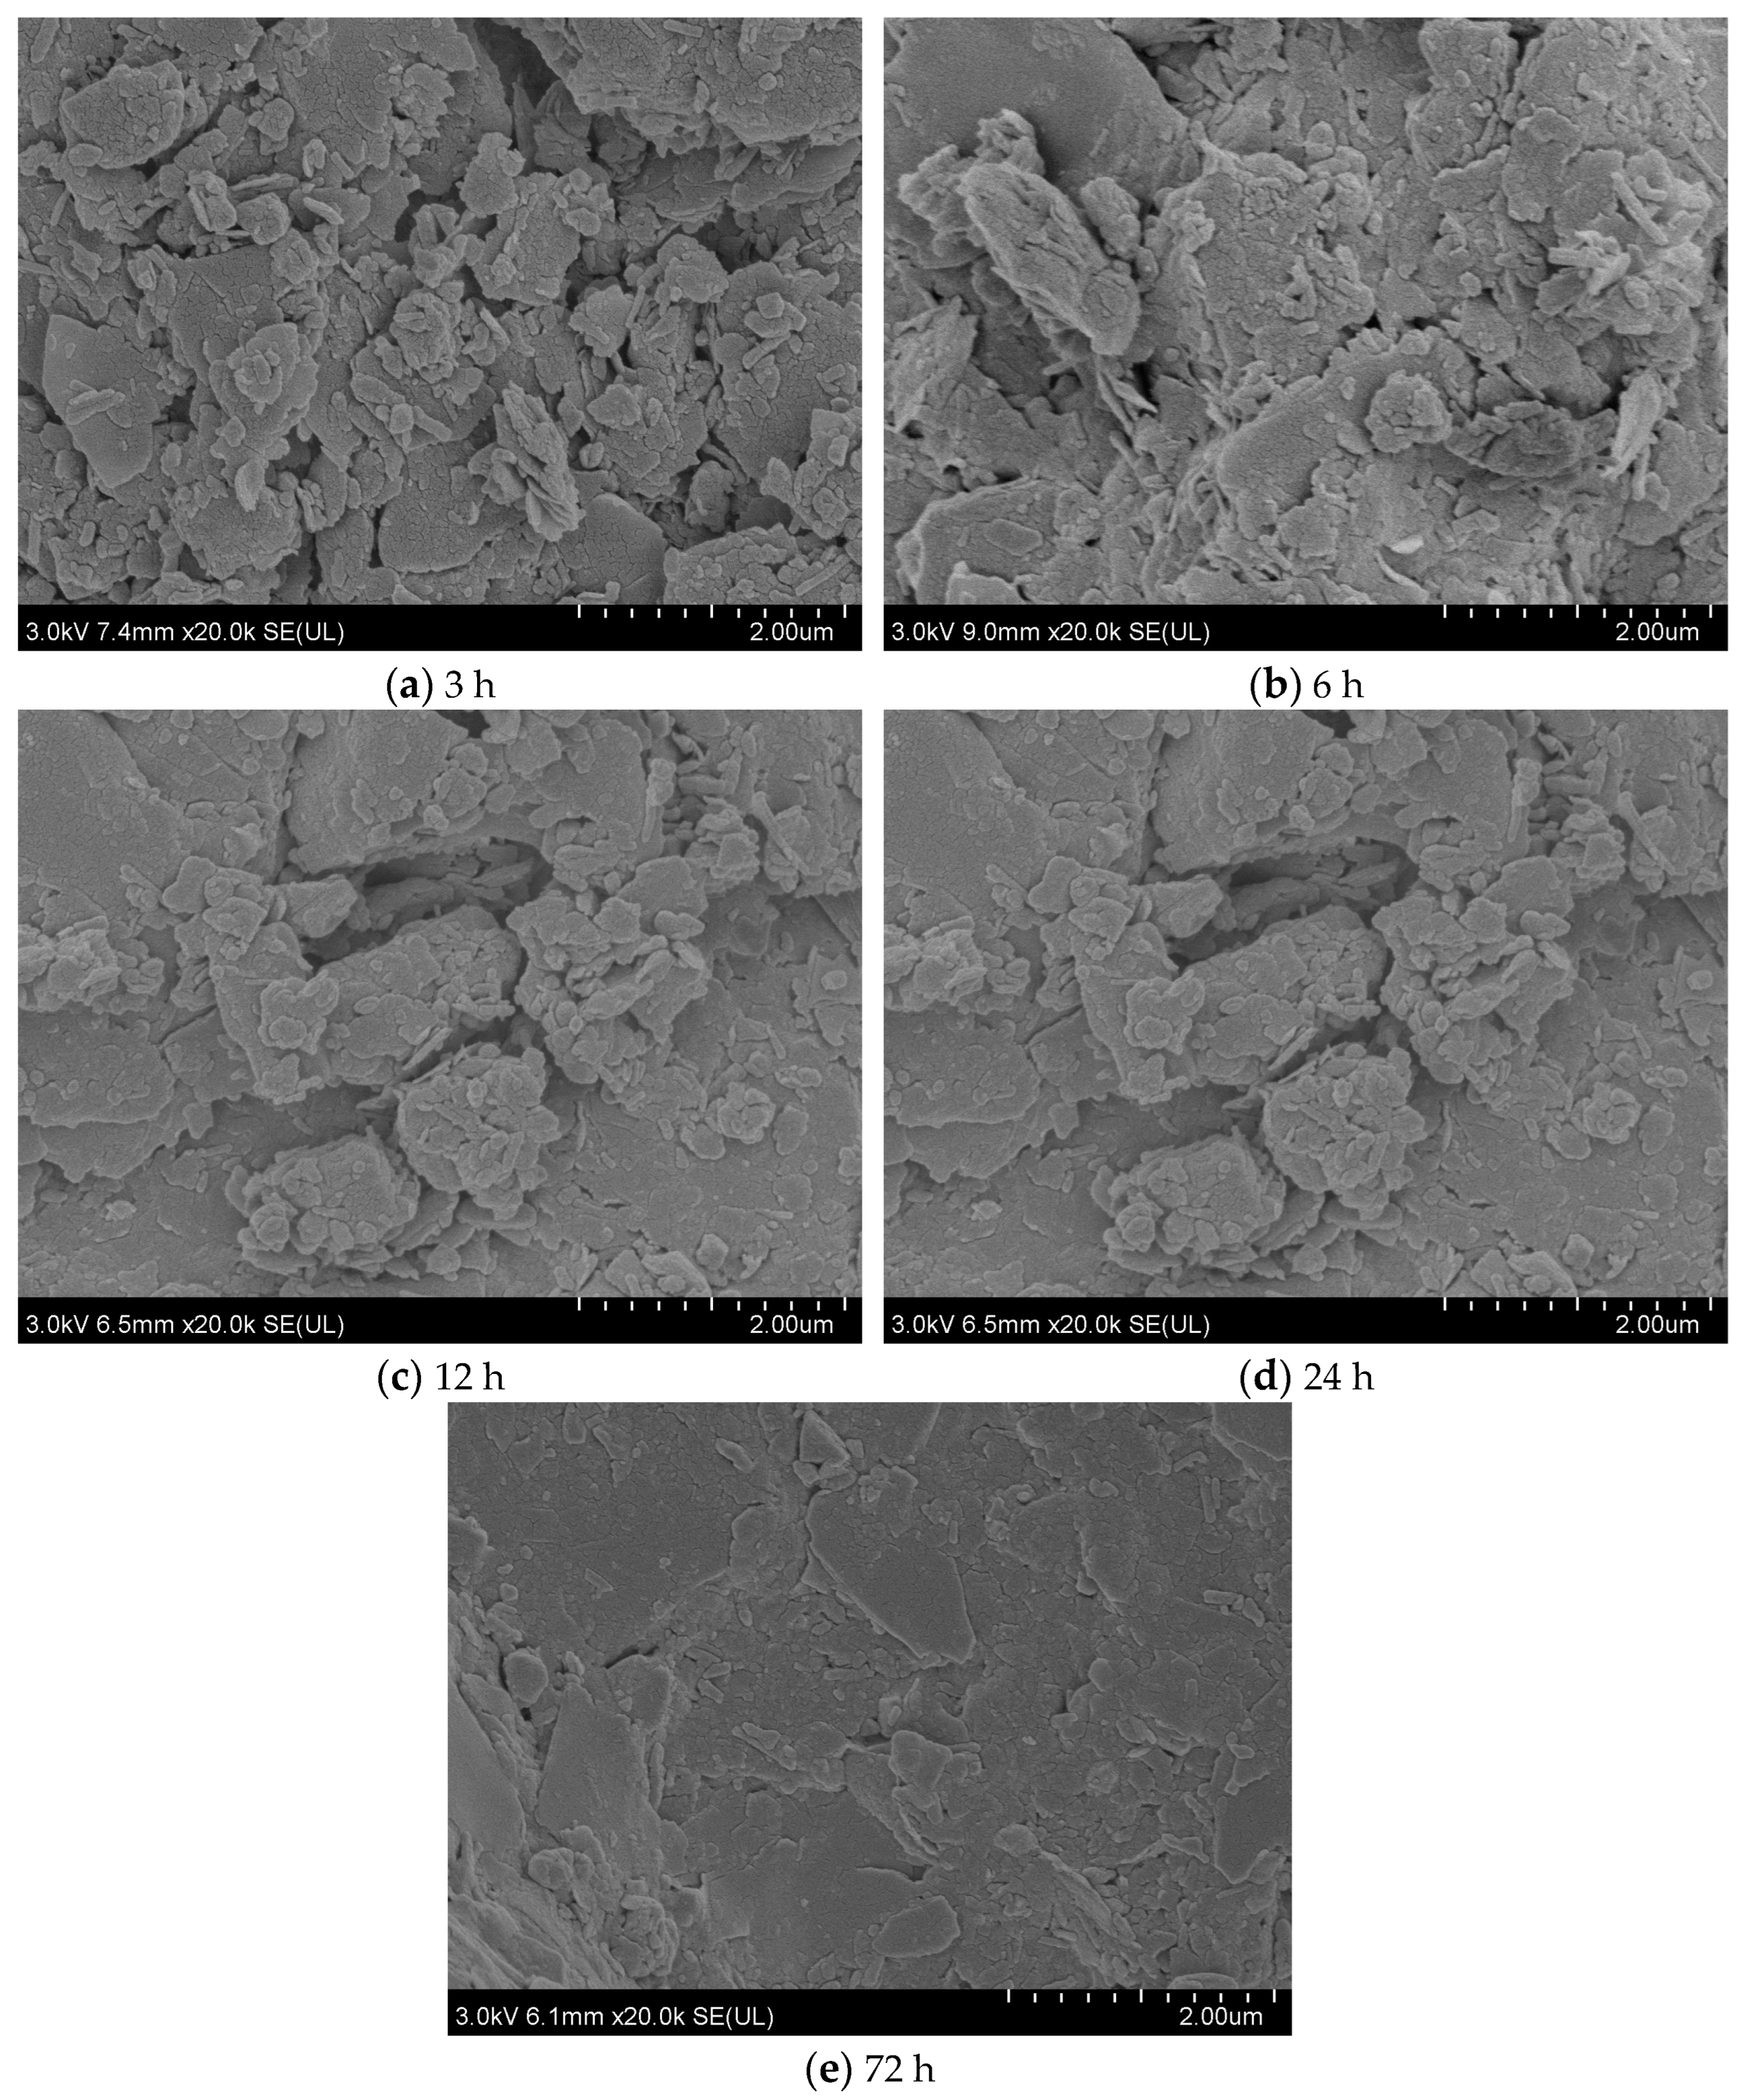
5. Characteristics of the Slide Zone
6. Influencing Factors of the Strength Recovery
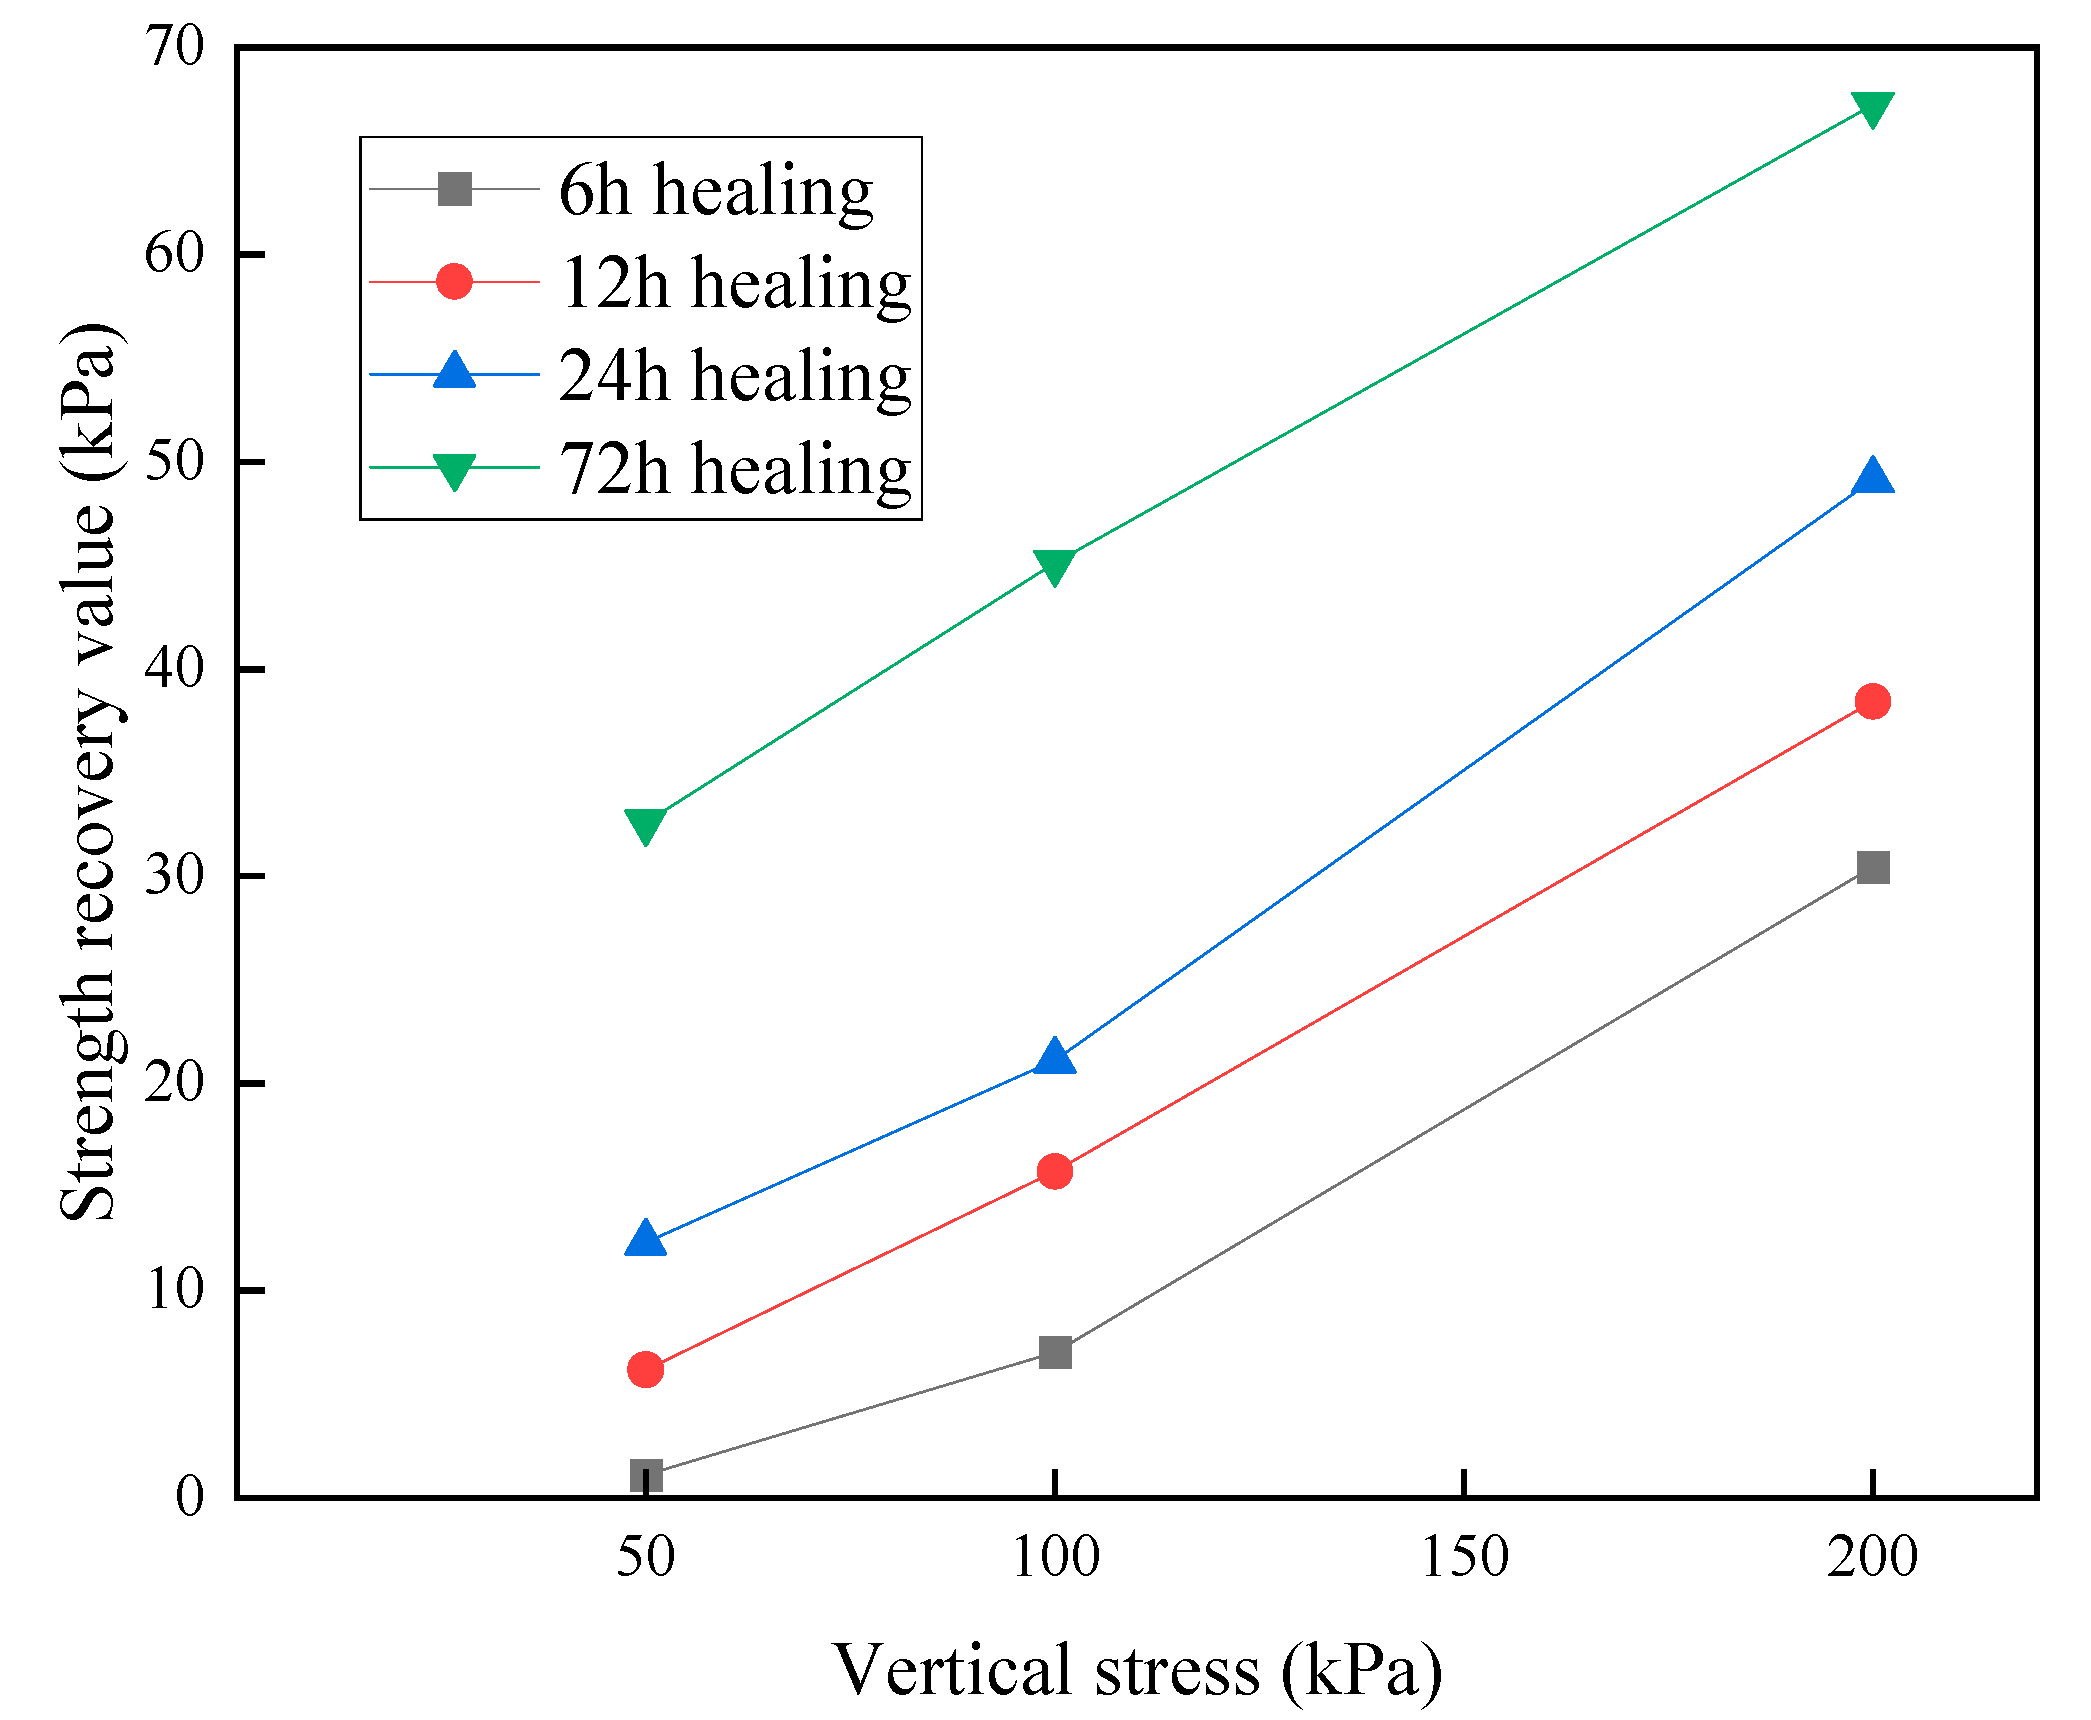
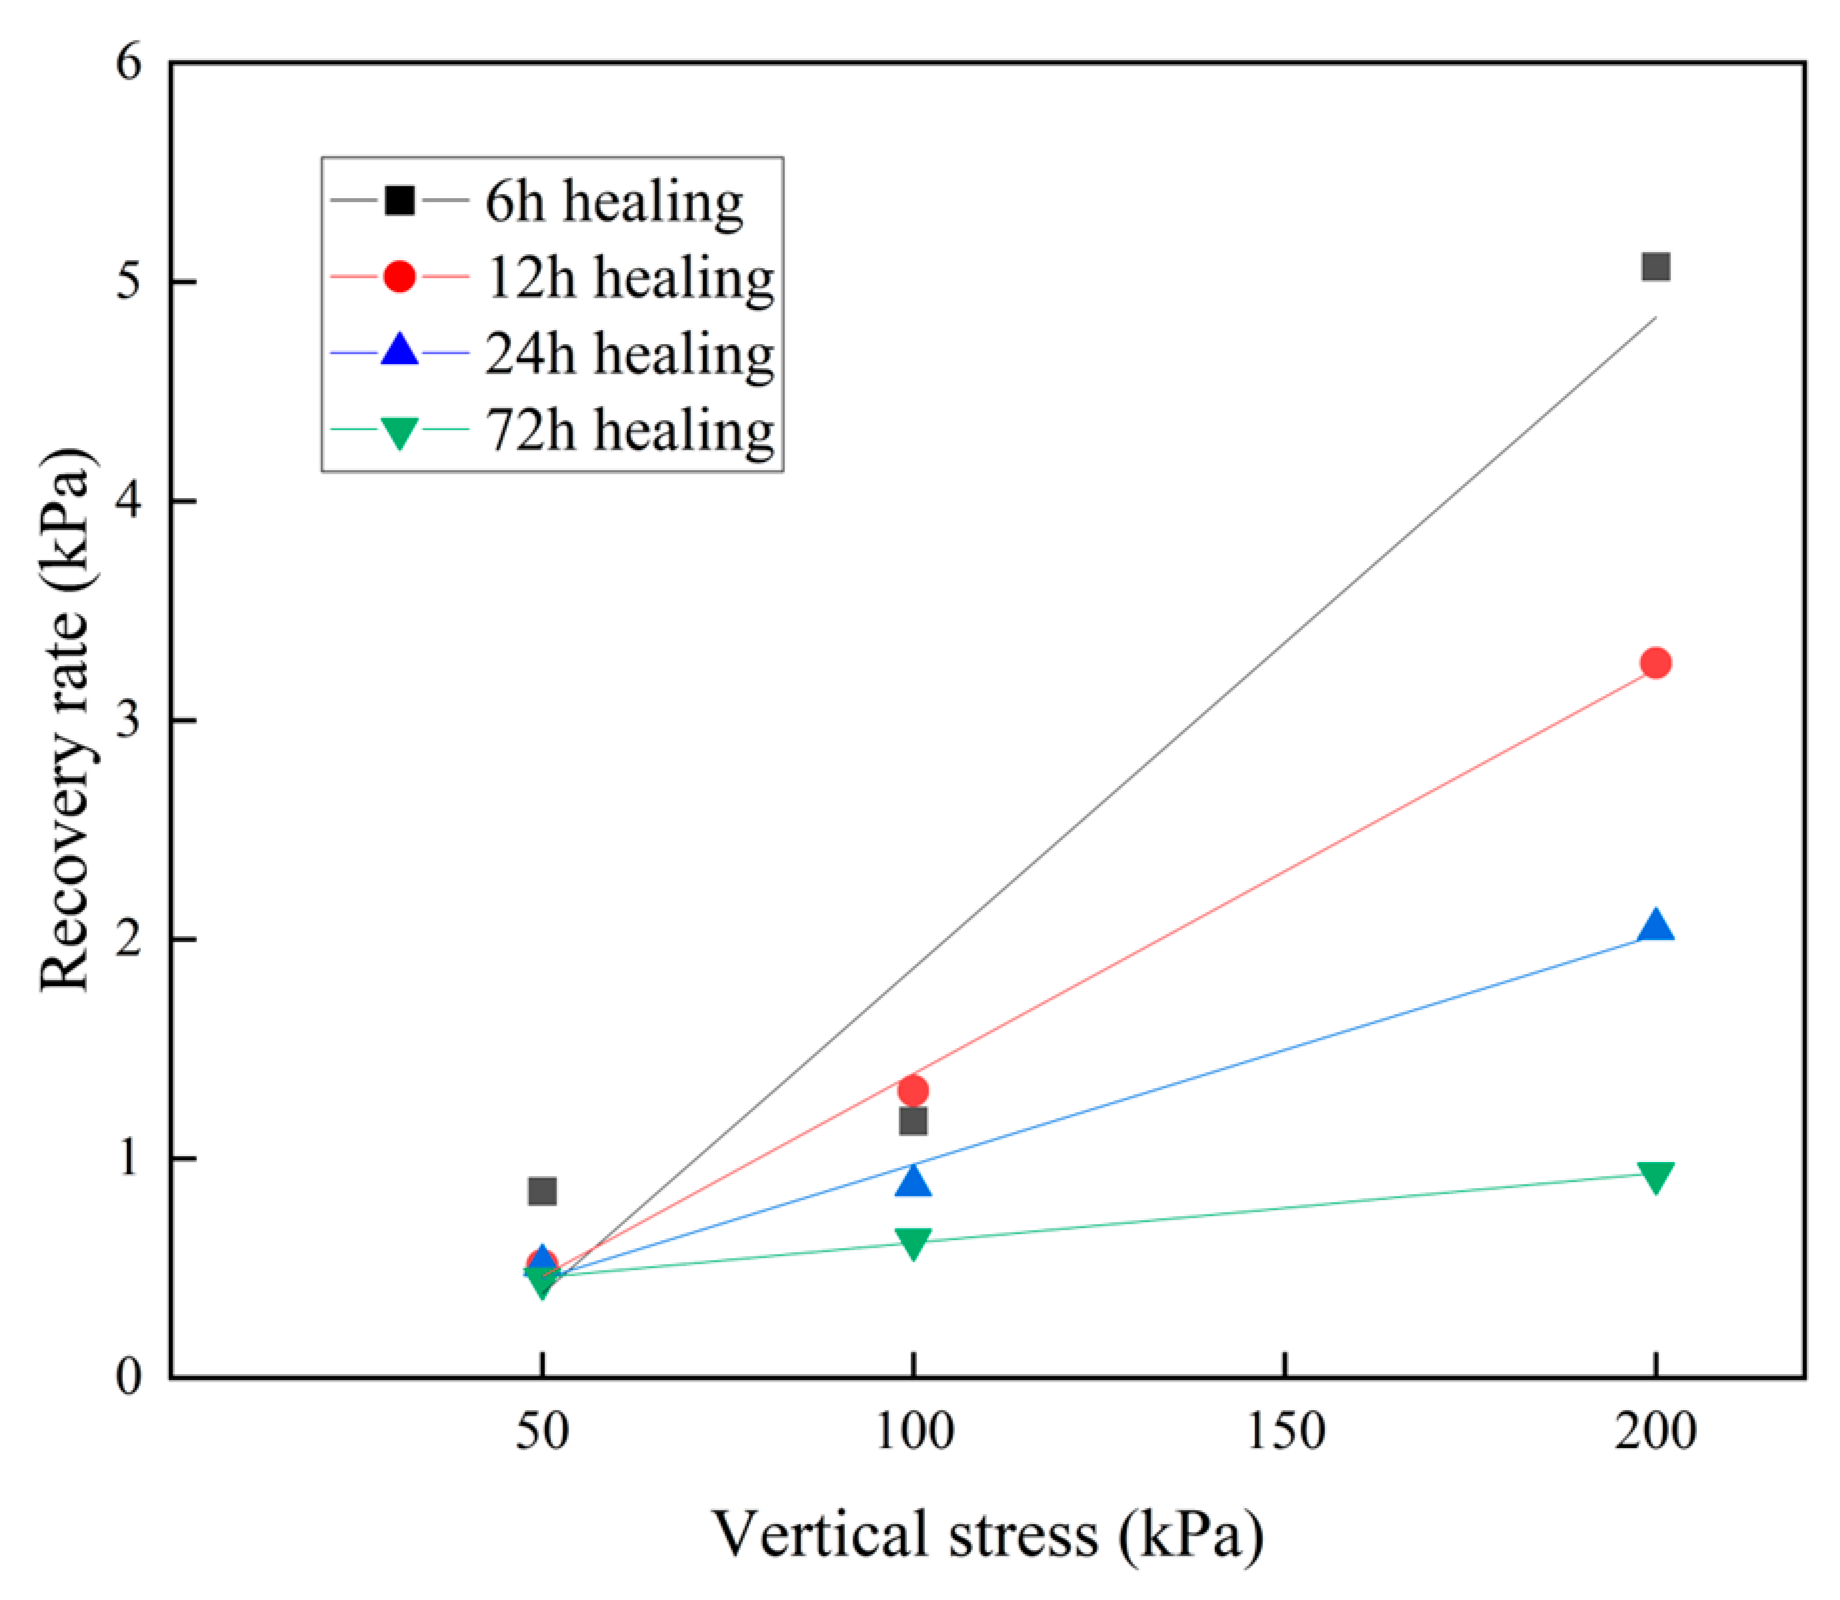
6.1. Relationship between the Vertical Stress and the Strength Recovery
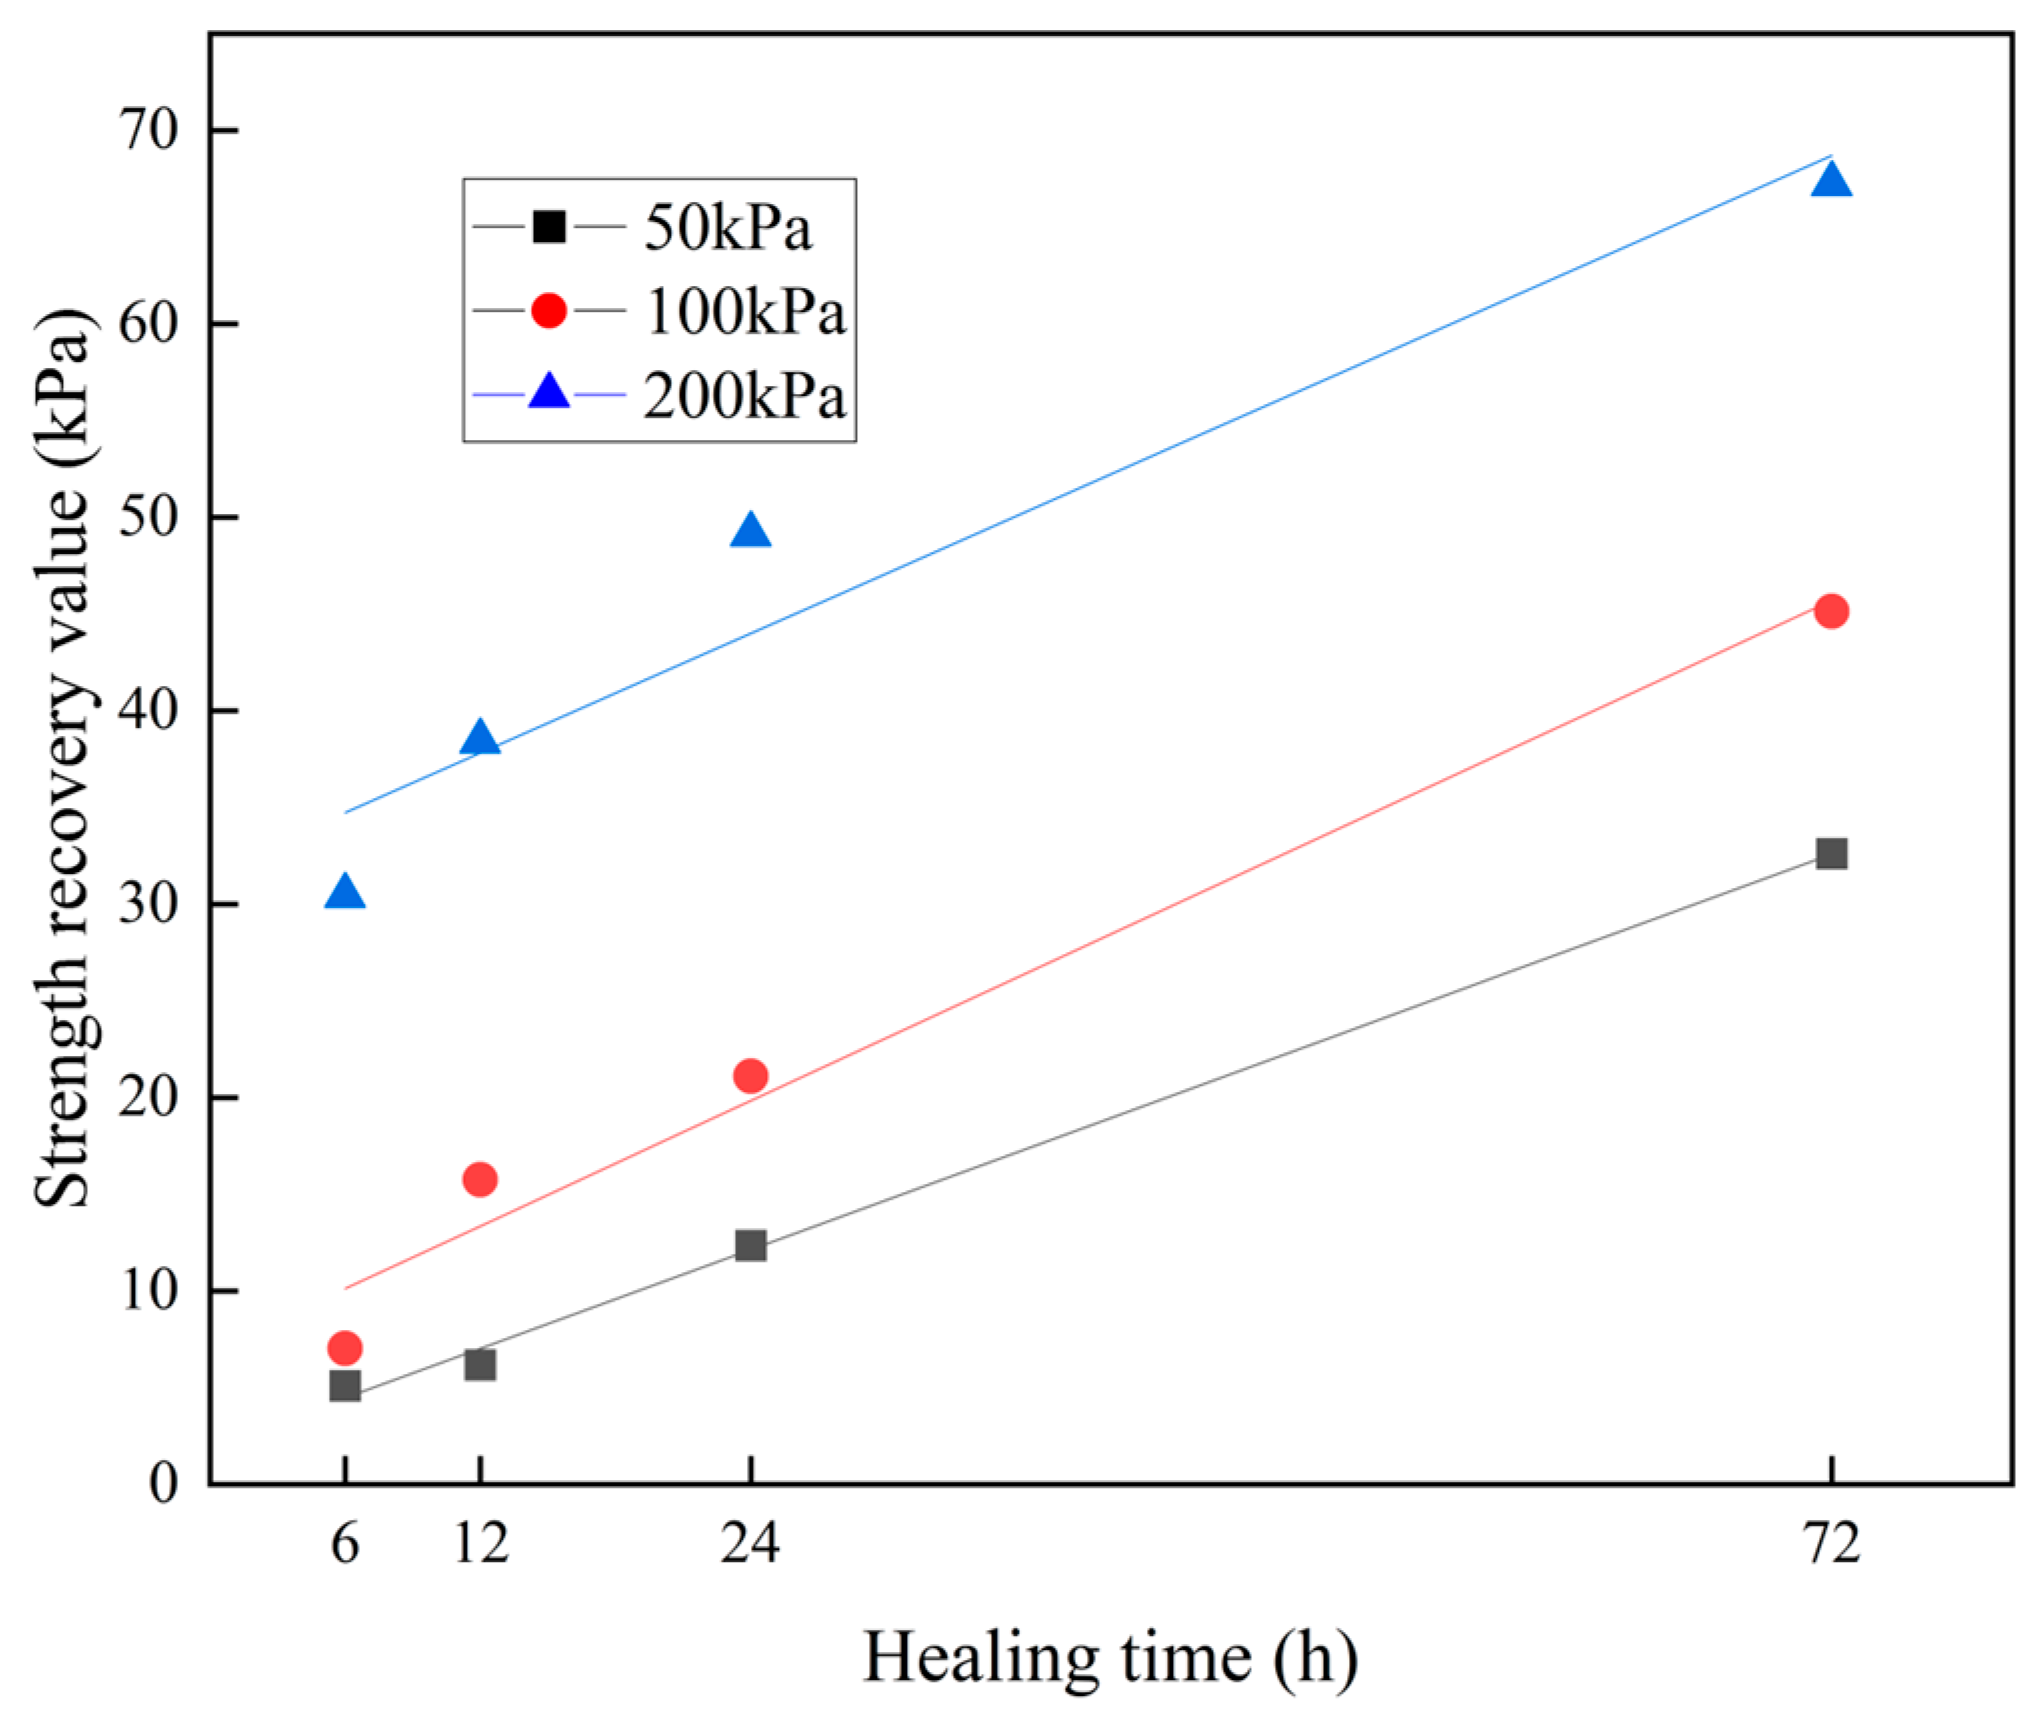
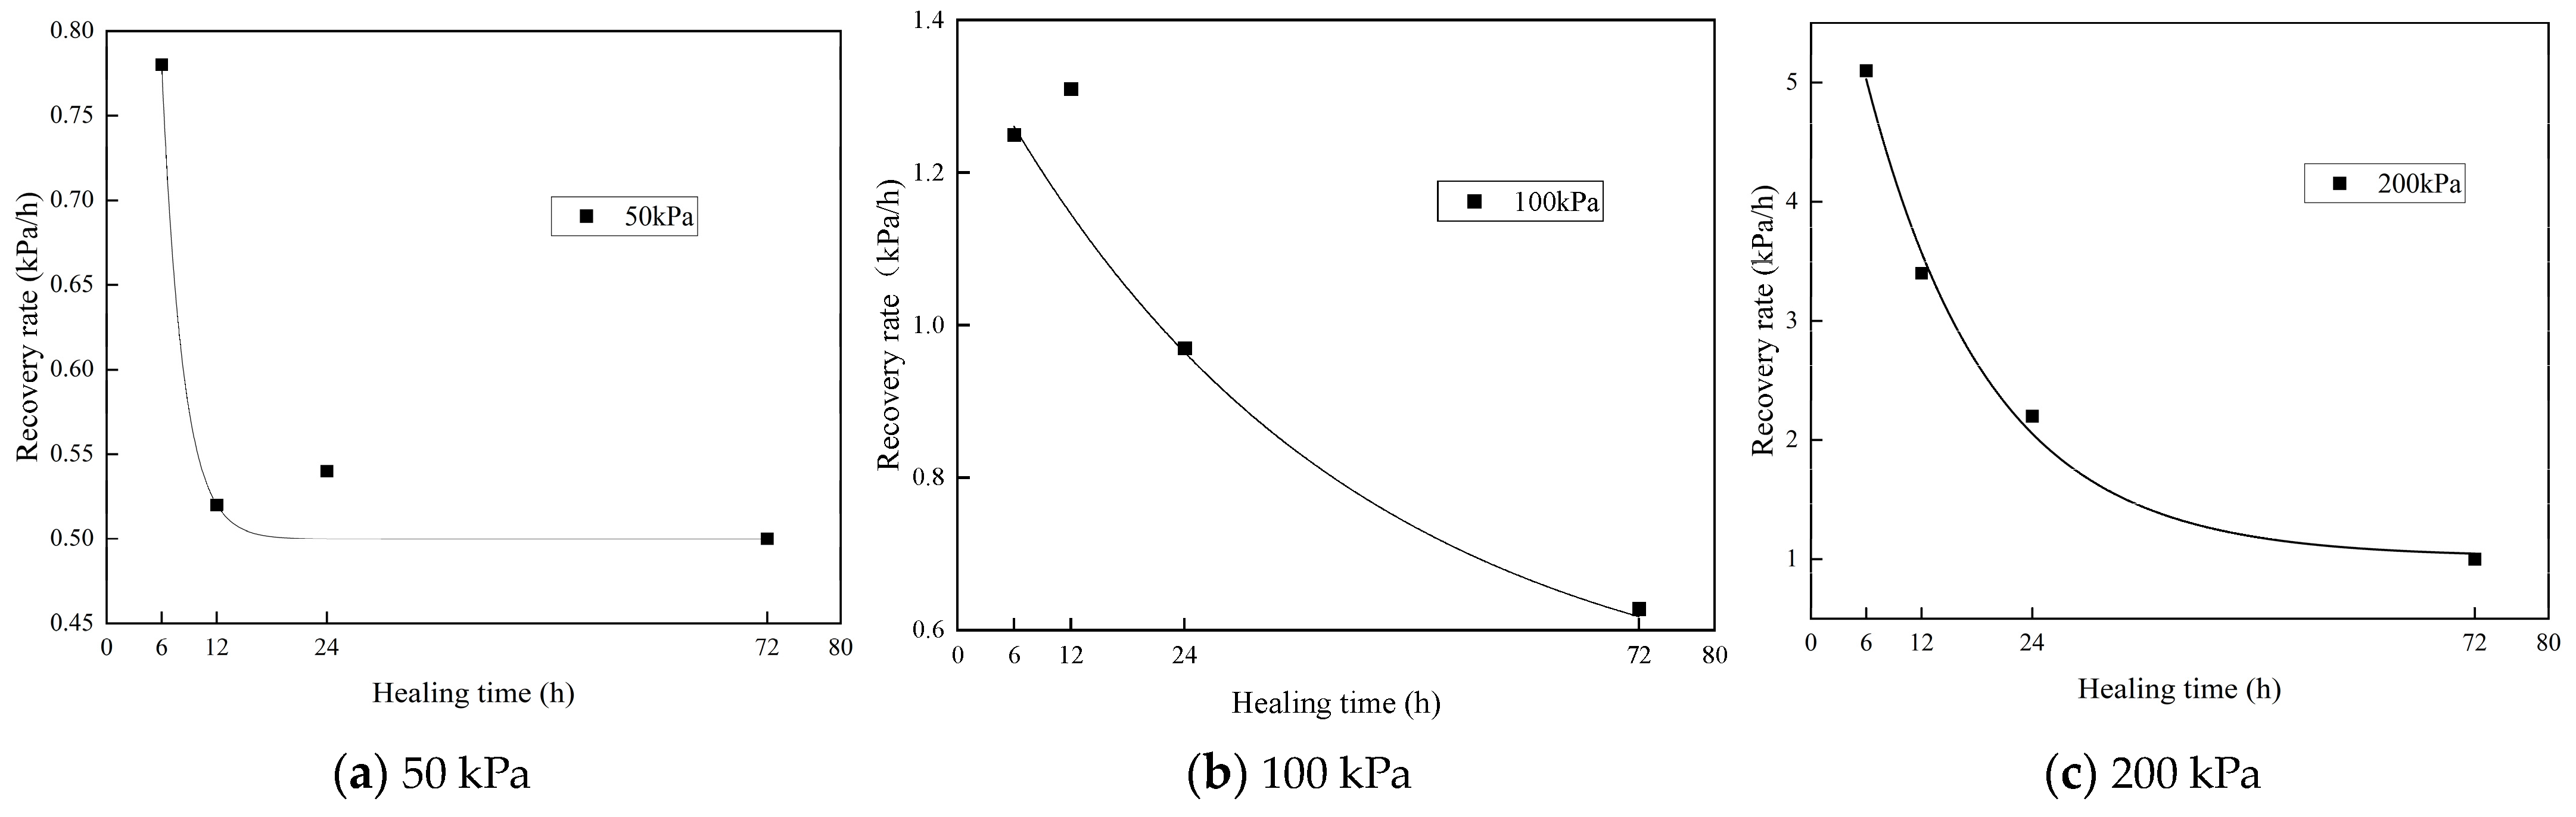
6.2. Relationship between the Healing Time and the Strength Recovery
7. Conclusions
- When the sample reaches the residual strength after the first shearing and is then sheared again with the shear stress and vertical stress kept constant, the shear strength exhibits an increase; however, this strength recovery feature decreases rapidly after experiencing a very small displacement.
- Given the same healing time, the strength recovery value increases with increasing vertical stress. Under low pressure, the strength recovery value is small, and under high pressure, the strength recovery value is obvious.
- Given the same vertical stress, the recovery strength increases with increasing healing time. As the healing time increases, the rate of recovery, although consistently increasing, increases in progressively smaller magnitudes and ultimately approaches zero.
Author Contributions
Funding
Institutional Review Board Statement
Informed Consent Statement
Data Availability Statement
Conflicts of Interest
References
- Tiwari, B.; Marui, H. A new method for the correlation of residual shear strength of the soil with mineralogical composition. J. Geotech. Geoenvironmental Eng. 2005, 131, 1139–1150. [Google Scholar] [CrossRef]
- Tika, T.E.; Hutchinson, J.N. Ring shear tests on soil from the Vaiont landslide surface. Geotechnique 1999, 49, 59–74. [Google Scholar] [CrossRef]
- D’Appolonia, E.; Alperstein, R.; D’Appolonia, D.J. Behavior of a colluvial slope. J. Soil Mech. Found. Div. 1967, 93, 447–473. [Google Scholar] [CrossRef]
- Chandler, R.J. Back analysis techniques for slope stabilization works: A case record. Geotechnique 1977, 27, 479–495. [Google Scholar] [CrossRef]
- Angeli, M.G.; Gasparetto, P.; Menotti, R.M.; Pasuto, A.; Silvano, S. A viscoplastic model for slope analysis applied to a mudslide in Cortina d’Ampezzo. Q. J. Eng. Geol. 1996, 29, 233–240. [Google Scholar] [CrossRef]
- Angeli, M.G.; Gasparetto, P.; Bromhead, N. Strength-regain mechanisms in intermittently moving slides. In Proceedings of the IXth International Symposium on Landslides, Rio de Janeiro, Brazil, 28 June–2 July 2004; Taylor and Francis: London, UK, 2004; pp. 689–696. [Google Scholar]
- Stark, T.D.; Hussain, M. Shear strength in preexisting landslides. J. Geotech. Geoenvironmental Eng. 2010, 136, 957–962. [Google Scholar] [CrossRef]
- Eigenbord, K.D. Self-healing in fractured fine-grained soils. Can. Geotech. J. 2003, 40, 435–449. [Google Scholar] [CrossRef]
- Miao, H. Deformation-Failure Mechanism and Prediction of the Landslides in Jurassic Red Beds in the Three Gorges Reservoir. Ph.D. Thesis, China University of Geosciences, Beijing, China, 2012. [Google Scholar]
- Miao, H.; Yin, K.; Wang, G. Dynamic mechanism of intermittent reactivation of deep-seated reservoir ancient landslide. Rock Soil Mech. 2016, 37, 2645–2653. [Google Scholar]
- Yan, Q. Experimental Study on the Self-Healing of Red-Bed Landslide Soil. Master Dissertation, Institute of Mountain Hazards and Environment, Chinese Academy of Sciences, Chengdu, China, 2021. [Google Scholar]
- Yan, Q.; Li, X.; He, S.; Luo, Y.; Tian, H.; Wu, Y. Experimental study of self-healing of slip zone soil in typical red bed landslide. Rock Soil Mech. 2020, 41, 3041–3048. [Google Scholar]
- Jiang, S.; Wang, Y.; Tang, C.; Wan, L.; Wang, K.; Wu, L.; Zhang, X.; Station, P. Movement mechanism of a reactivated slow-moving landslide based on ring shear test. Geol. Sci. Technol. Inf. 2019, 38, 256–261. [Google Scholar]
- Wang, H.; Gao, D.; Wu, B. Experimental study on strength regeneration of slip zone soils considering residual shear stress. Chin. J. Geol. Hazard Control 2020, 31, 5. [Google Scholar]
- Zheng, Y.; Coop, M.R.; Tang, H.; Fan, Z. Effects of overconsolidation on the reactivated residual strength of remoulded deep-seated sliding zone soil in the Three Gorges Reservoir Region, China. Eng. Geol. 2022, 310, 106882. [Google Scholar] [CrossRef]
- Tan, Y.; Yu, B.; Liu, Y.; Zuo, Q.; Hu, M.; Zheng, A. Strength recovered method and mechanism for remolded lime soil. Rock Soil Mech. 2015, 36, 7. [Google Scholar]
- Miao, H.; Wand, G. Effects of clay content on the shear behaviors of sliding zone soil originating from muddy interlayers in the Three Gorges Reservoir, China. Eng. Geol. 2021, 294, 106380. [Google Scholar] [CrossRef]
- Gibo, S.; Gashira, K.; Ohtsubo, M.; Nakamura, S. Strength recovery from residual state in reactivated landslides. Geotechnique 2002, 52, 683–686. [Google Scholar] [CrossRef]
- Chen, C.; Zhang, J.; Wen, S. Study of applicability of strength parameters of sliding zone soil based on effective vertical stress level. Chin. J. Rock Mech. Eng. 2011, 30, 7. [Google Scholar]
- Ramiah, B.K.; Purushothamaraj, P.; Tavane, N.G. Thixotropic effects on residual strength of remoulded clays. Indian Geotech. J. 1973, 3, 189–197. [Google Scholar]
- Stark, T.D.; Choi, H.; McCone, S. Drained shear strength parameters for analysis of landslides. J. Geotech. Geoenvironmental Eng. 2005, 131, 575–588. [Google Scholar] [CrossRef]
- Carrubba, P.; Del Fabbro, M. Laboratory Investigation on Reactivated Residual Strength. J. Geotech. Geoenvironmental Eng. 2008, 134, 302–315. [Google Scholar] [CrossRef]
- Bhat, D.R.; Bhandary, N.P.; Yatabe, R. Experimental Study of Strength Recovery from Residual Strength on Kaolin Clay. Int. J. Civ. Eng. 2013, 7, 67–73. [Google Scholar]
- Bhat, D.R.; Yatabe, R.; Bhandary, N.P. Study of preexisting shear surfaces of reactivated landslides from a strength recovery perspective. J. Asian Earth Sci. 2013, 77, 243–253. [Google Scholar] [CrossRef]
- Li, S.; Li, D.; Liu, H.; Wang, S.-W.; Geng, Z.; Peng, B. Formation and failure mechanism of the landslide: A case study for huaipa, western henan, China. Environ. Earth Sci. 2021, 80, 478. [Google Scholar] [CrossRef]
- Ikari, M.J.; Carpenter, B.M.; Vogt, C.; Kopf, A.J. Elevated time-dependent strengthening rates observed in San Andreas Fault drilling samples. Earth Planet. Sci. Lett. 2016, 450, 164–172. [Google Scholar] [CrossRef]
- Li, X.; Song, J.; Zhao, Z.; Li, Z.; Hu, W. Quantitative study on pore structure of saturated fine-grained soil. Chin. J. Geotech. Eng. 2019, 41, 153–156. [Google Scholar]
- Li, X.; Zhang, P.; Song, J. Study on microstructure during consolidation process of saturated fine-grained soil. Yangtze River 2019, 50, 7. [Google Scholar]
- Mitchell, J.K.; Soga, K. Fundamentals of Soil Behavior; John Wiley and Sons: New York, NY, USA, 2005. [Google Scholar]
- Terzaghi, K.; Peck, R.B.; Mesri, G. Soil Mechanics in Engineering Practice. Soil Sci. 1996, 68, 149–150. [Google Scholar]


| Characteristic | Reversal Direct Shear | Ring Shear |
|---|---|---|
| Shear method | 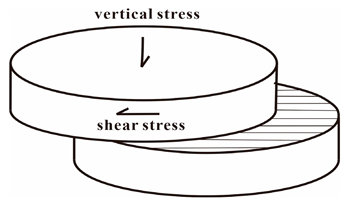 | 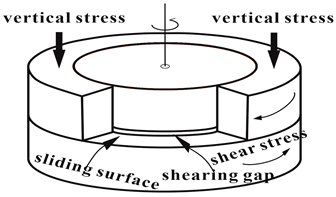 |
| Mass of sample | Less | More |
| Sample state | Undisturbed sample | Remolded sample |
| Shear displacement | Intermittent | Progression |
| Sliding surface | Continue to change | Remain constant |
| Soil extrusion during shearing | Less | More |
| Orientation of particles at the sliding surface | Straight | Rotary |
| Natural Water Content (%) | Natural Density (kg/m3) | Liquid Limit (%) | Plastic Limit (%) | Plasticity Index | Saturated Water Content (%) |
|---|---|---|---|---|---|
| 18.20 | 2.12 | 34.40 | 19.80 | 14.60 | 24.10 |
| Type and Content of Minerals/% | Clay Mineral/% | ||||
|---|---|---|---|---|---|
| Quartz | Potassium Feldspar | Plagioclase | Calcite | Dolomite | |
| 57.3 | 1.6 | 6.5 | 10.1 | 0.9 | 23.6 |
| Relative Clay Mineral Contents/% | Interstratified Ratio/% | ||||
|---|---|---|---|---|---|
| I/S | Illite | Kaolinite | Chlorite | SI/S | SC/S |
| 28 | 43 | 11 | 18 | 50 | / |
| Vertical Stress (kPa) | 50 | 100 | 200 |
|---|---|---|---|
| Healing Time (h) | |||
| 6 | 61.80 | 75.62 | 143.45 |
| 12 | 66.78 | 84.34 | 151.82 |
| 24 | 72.95 | 89.70 | 162.13 |
| 72 | 93.10 | 113.72 | 180.23 |
| Vertical Stress (kPa) | Indices | Healing Time (h) | ||||
|---|---|---|---|---|---|---|
| 3 | 6 | 12 | 24 | 72 | ||
| 50 | Strength recovery value | 3.55 | 1.20 | 6.18 0.52 | 12.35 0.51 | 32.60 0.45 |
| Recovery rate | 1.15 | 0.85 | 0.52 | 0.51 | 0.45 | |
| 100 | Strength recovery value | 0 | 7.03 | 15.75 | 21.11 | 45.13 |
| Recovery rate | 0 | 1.17 | 1.31 | 0.88 | 0.63 | |
| 200 | Strength recovery value | 18.20 | 30.45 | 38.42 | 49.13 | 67.23 |
| Recovery rate | 6.20 | 5.07 | 3.26 | 2.05 | 0.93 | |
Disclaimer/Publisher’s Note: The statements, opinions and data contained in all publications are solely those of the individual author(s) and contributor(s) and not of MDPI and/or the editor(s). MDPI and/or the editor(s) disclaim responsibility for any injury to people or property resulting from any ideas, methods, instructions or products referred to in the content. |
© 2024 by the authors. Licensee MDPI, Basel, Switzerland. This article is an open access article distributed under the terms and conditions of the Creative Commons Attribution (CC BY) license (https://creativecommons.org/licenses/by/4.0/).
Share and Cite
Dong, W.; Wan, F.; Xu, Q.; Dong, J. Healing of Undisturbed Slide Zone Soil: Experimental Study on the Huaipa Landslide in Sanmenxia City. Appl. Sci. 2024, 14, 4484. https://doi.org/10.3390/app14114484
Dong W, Wan F, Xu Q, Dong J. Healing of Undisturbed Slide Zone Soil: Experimental Study on the Huaipa Landslide in Sanmenxia City. Applied Sciences. 2024; 14(11):4484. https://doi.org/10.3390/app14114484
Chicago/Turabian StyleDong, Wenping, Fengyuan Wan, Qixiang Xu, and Jinyu Dong. 2024. "Healing of Undisturbed Slide Zone Soil: Experimental Study on the Huaipa Landslide in Sanmenxia City" Applied Sciences 14, no. 11: 4484. https://doi.org/10.3390/app14114484