
Dynamic Responses and Failure Characteristics of Deep Double U-Shaped Caverns under Disturbing Loads

Abstract
:1. Introduction
2. Numerical Model
3. Numerical Simulation Results and Analysis
3.1. Failure Characteristics of the Double U-Shaped Caverns under Horizontally Incident Wave
3.2. Failure Characteristics of the Double U-Shaped Caverns under Vertically Incident Stress Wave
3.3. Failure Characteristics of the Double U-Shaped Caverns with Different Height Ratios
4. Conclusions
- (1)
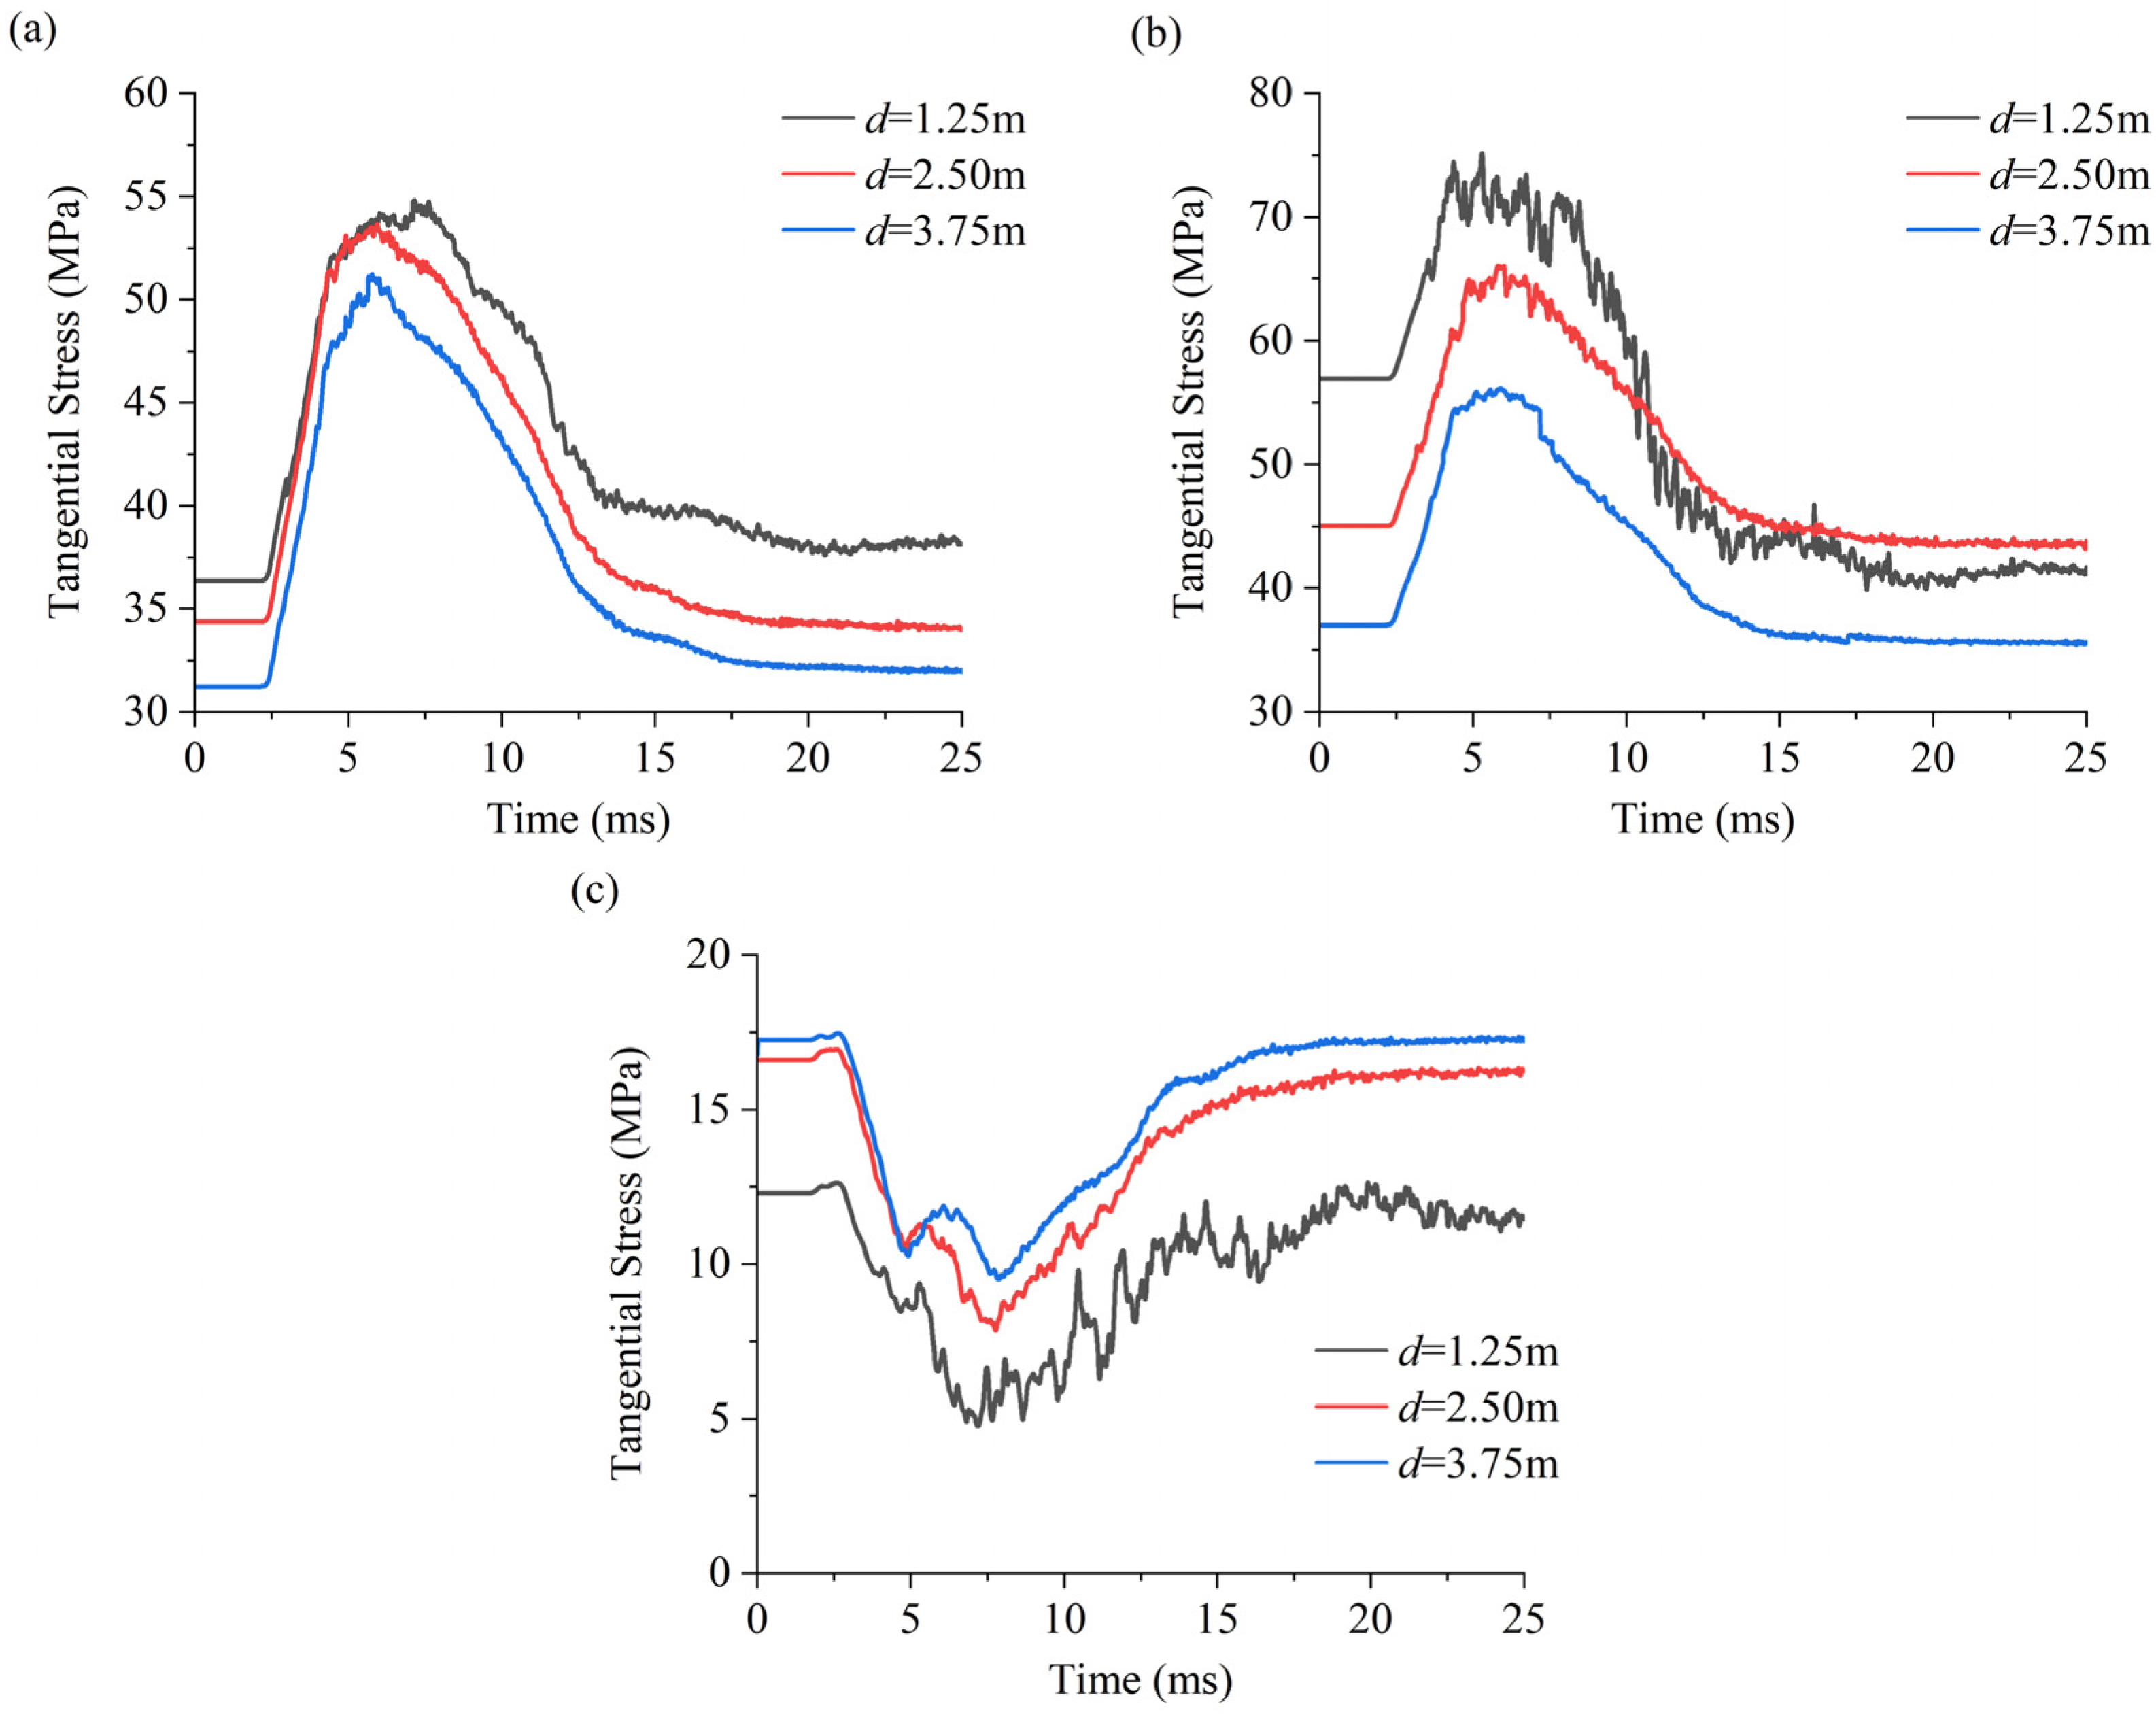
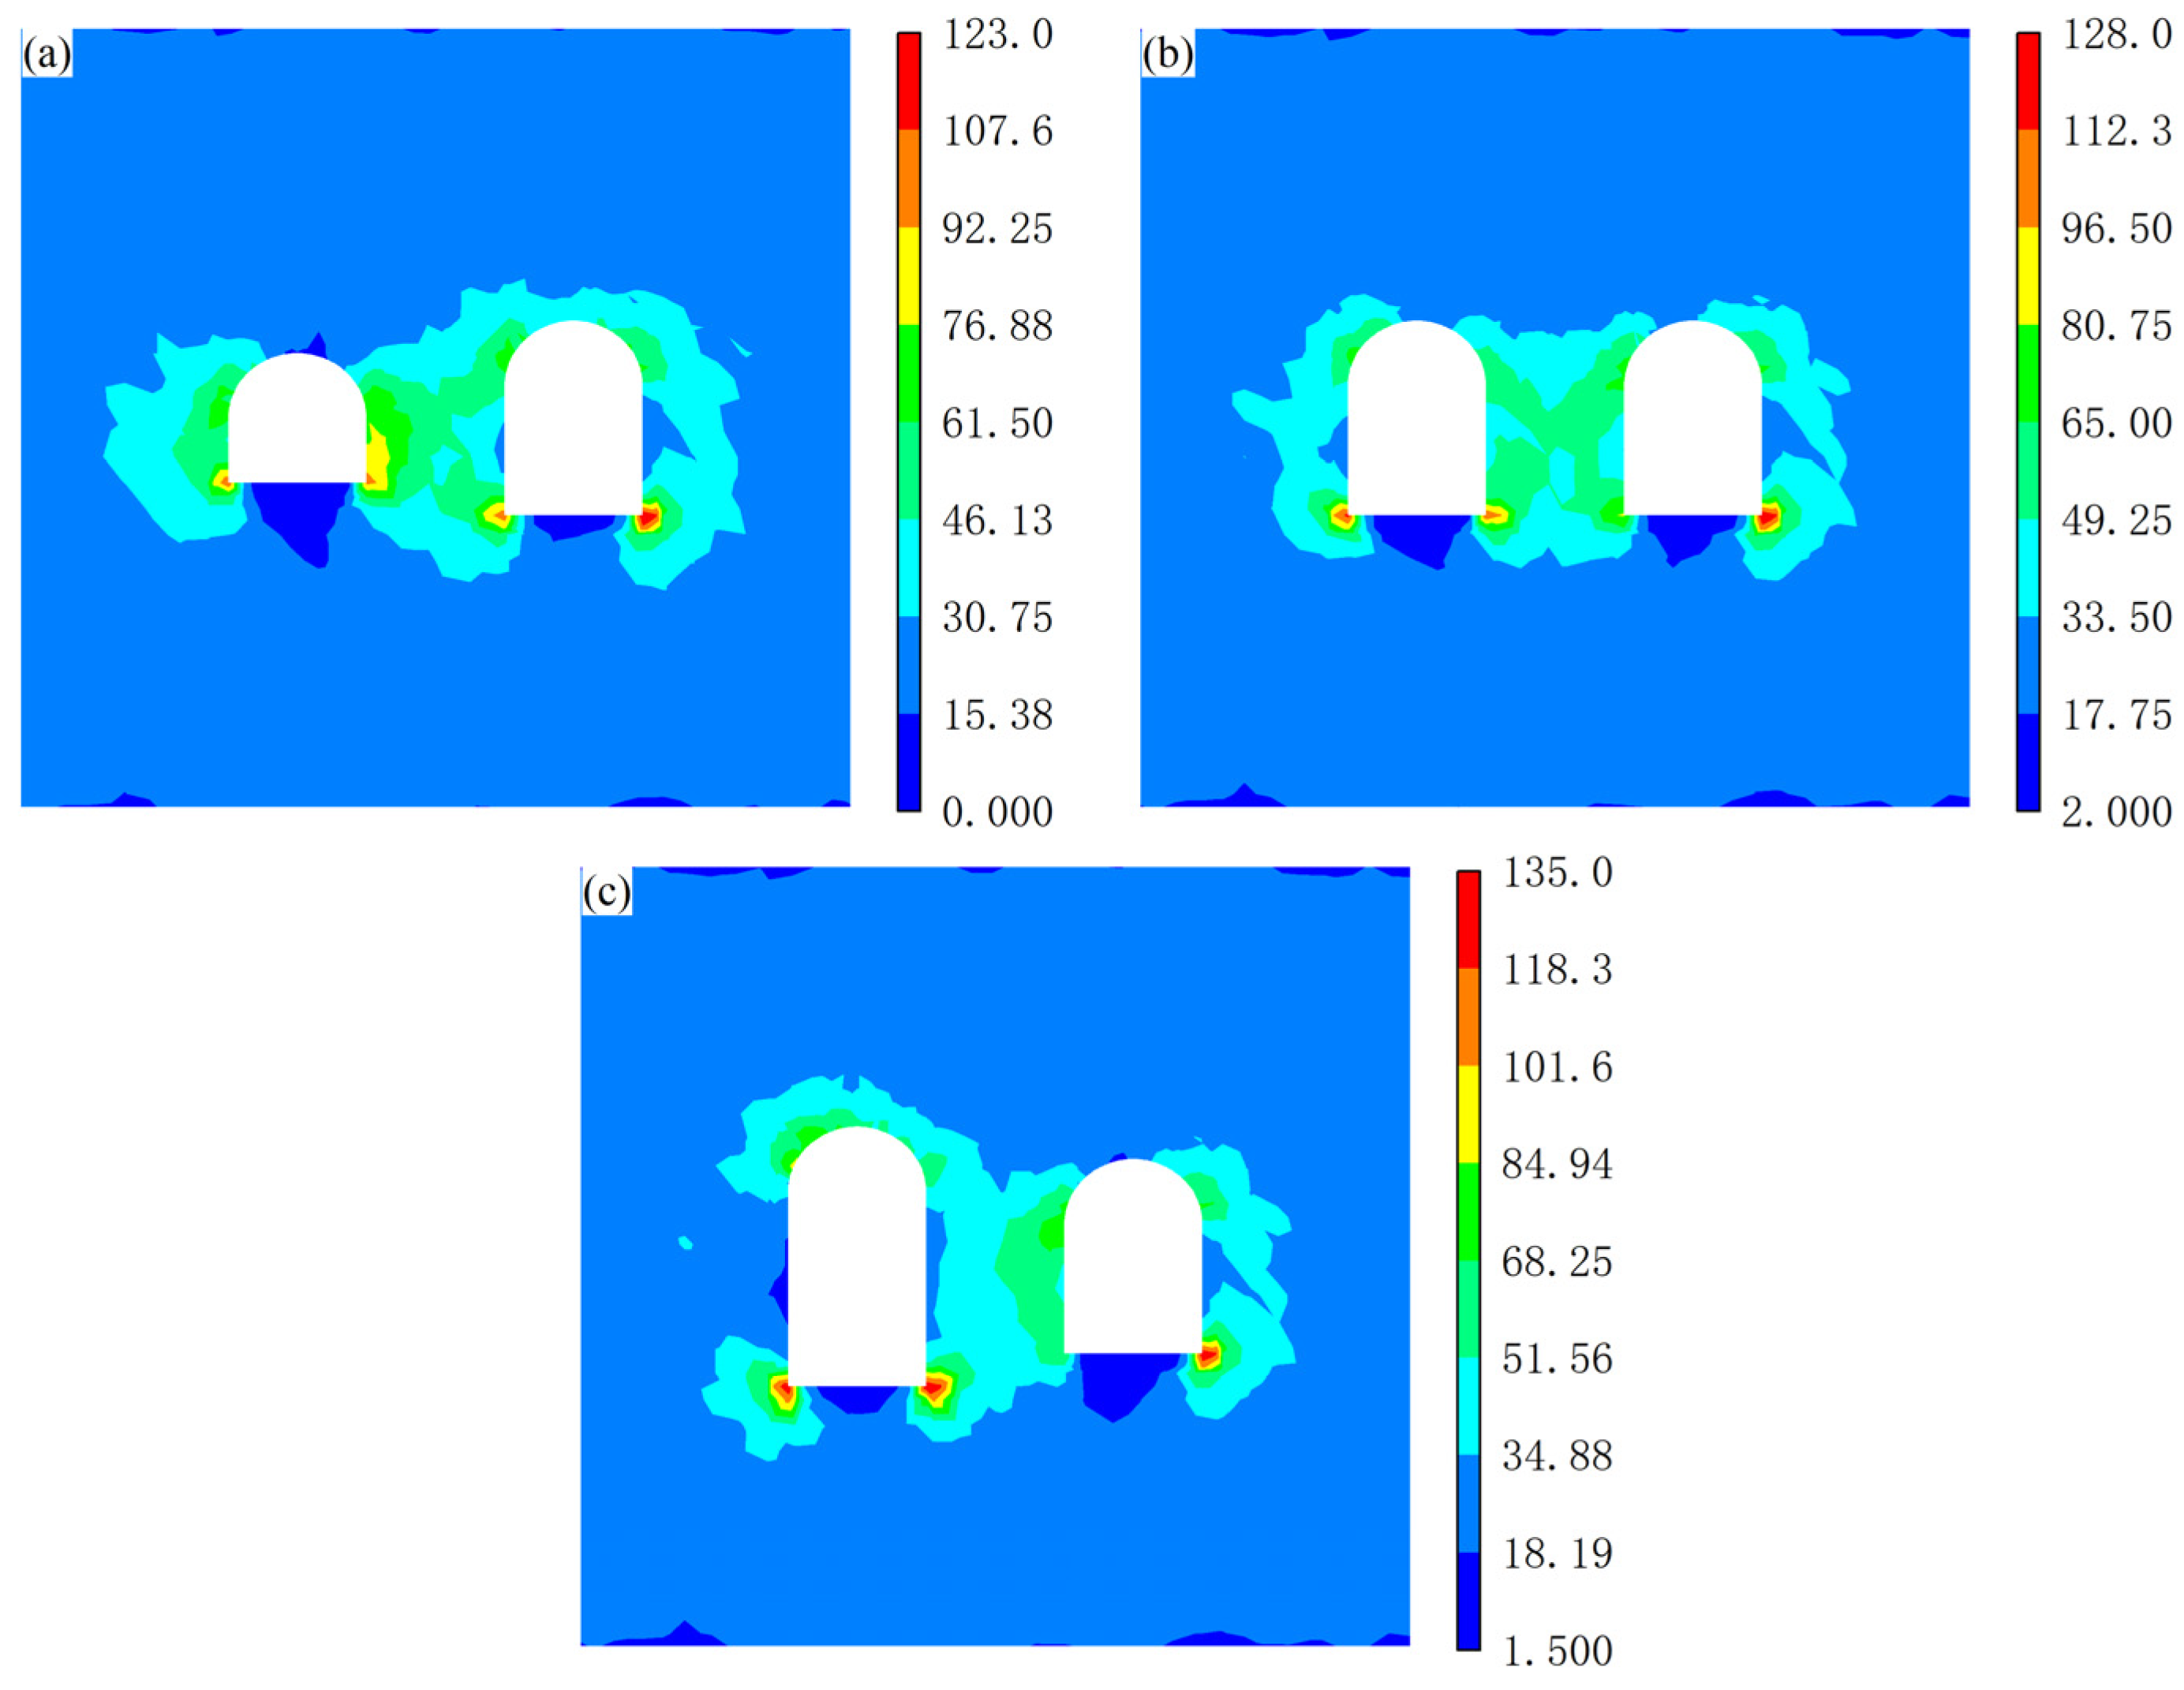
- The cavern clearance has a significant effect on the static stress field around the caverns. When the lateral pressure coefficient is less than 1.0, tangential stresses on roof and floor areas of the caverns decrease with reducing cavern clearance. In contrast, tangential stresses on sidewalls increase with decreasing clearance, and the compressive stress concentration at the adjacent sidewalls is higher than that at non-adjacent sidewalls.
- (2)
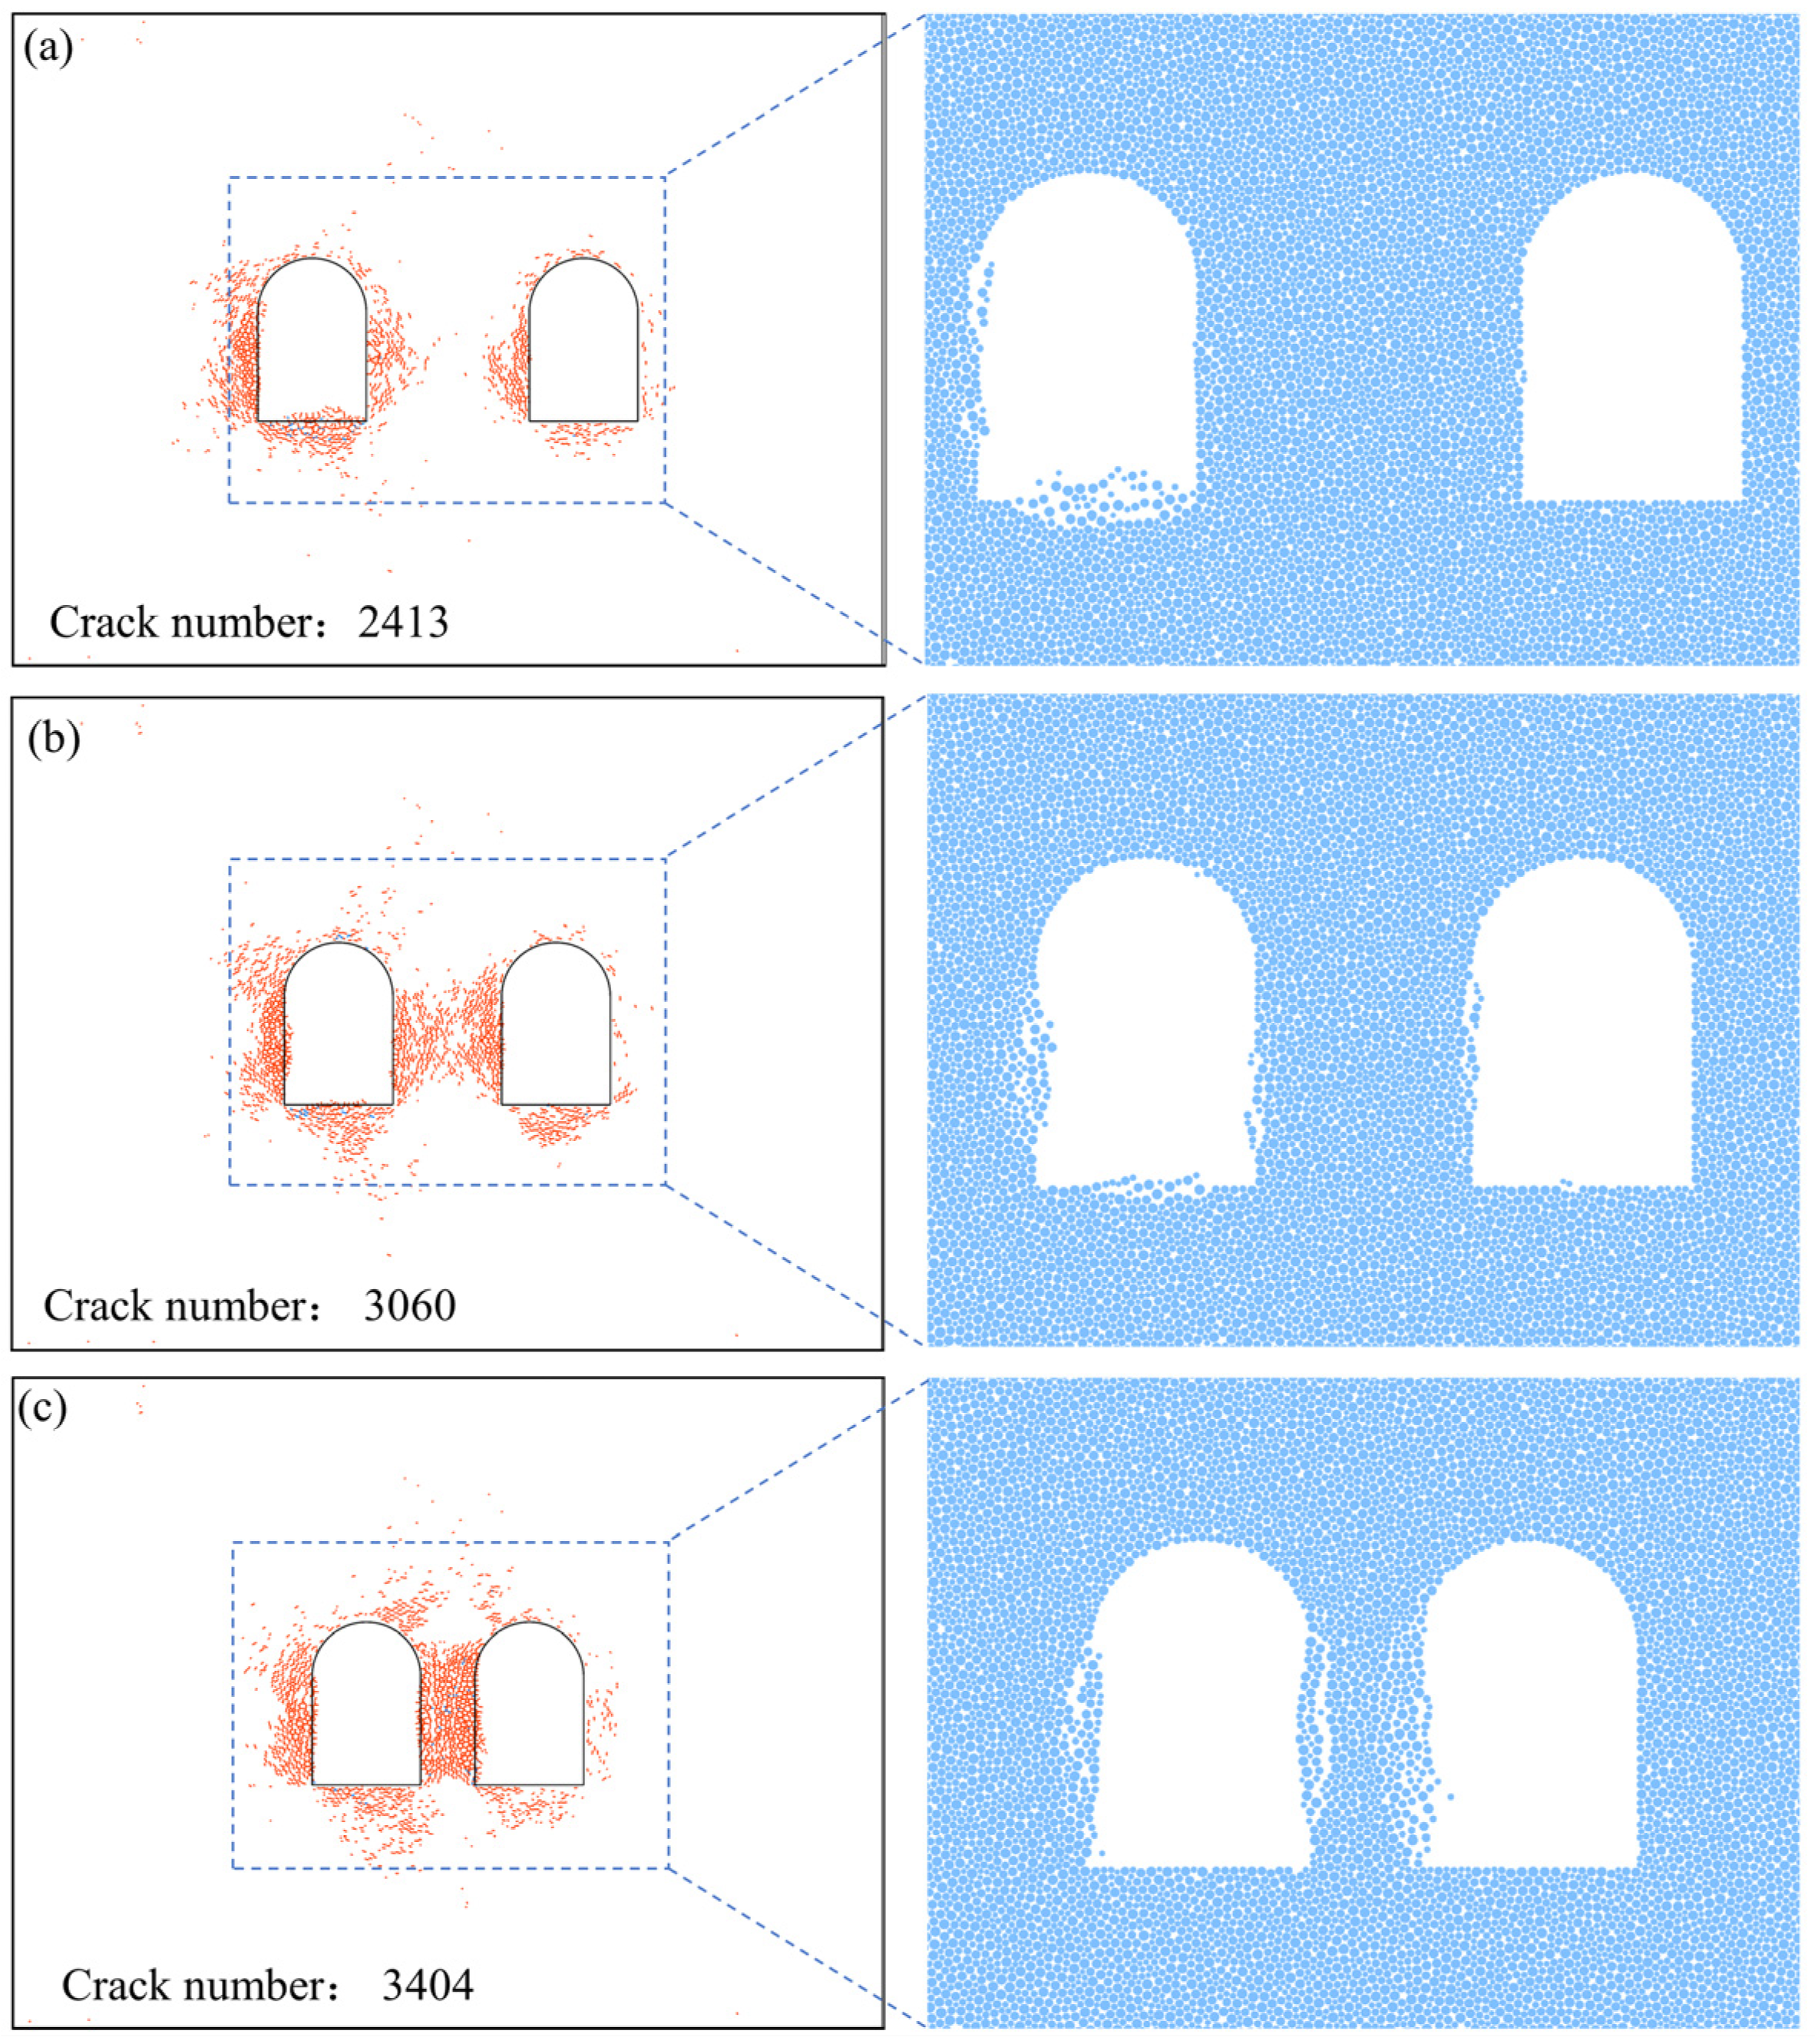
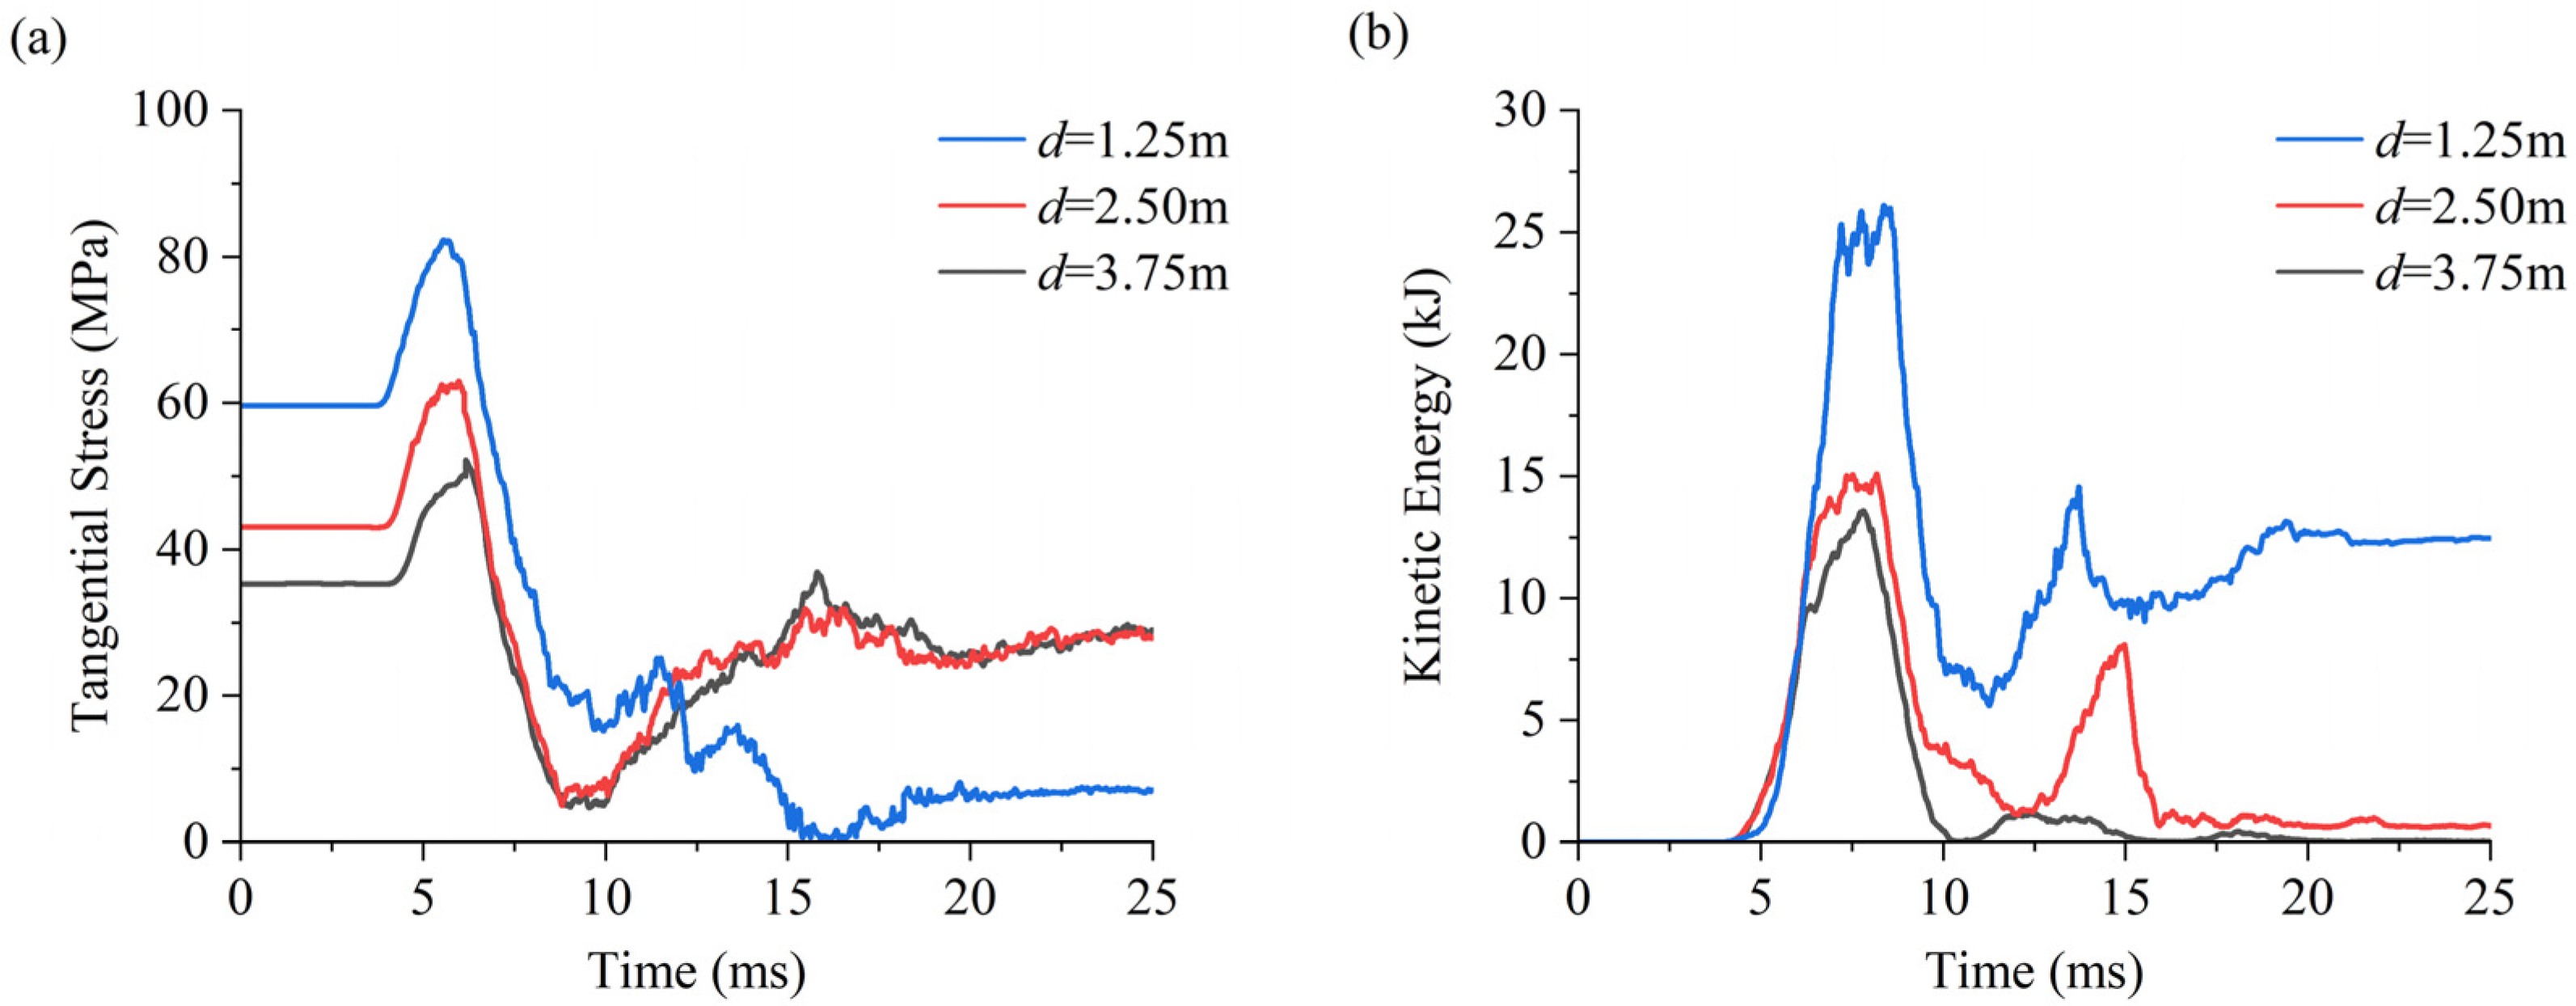
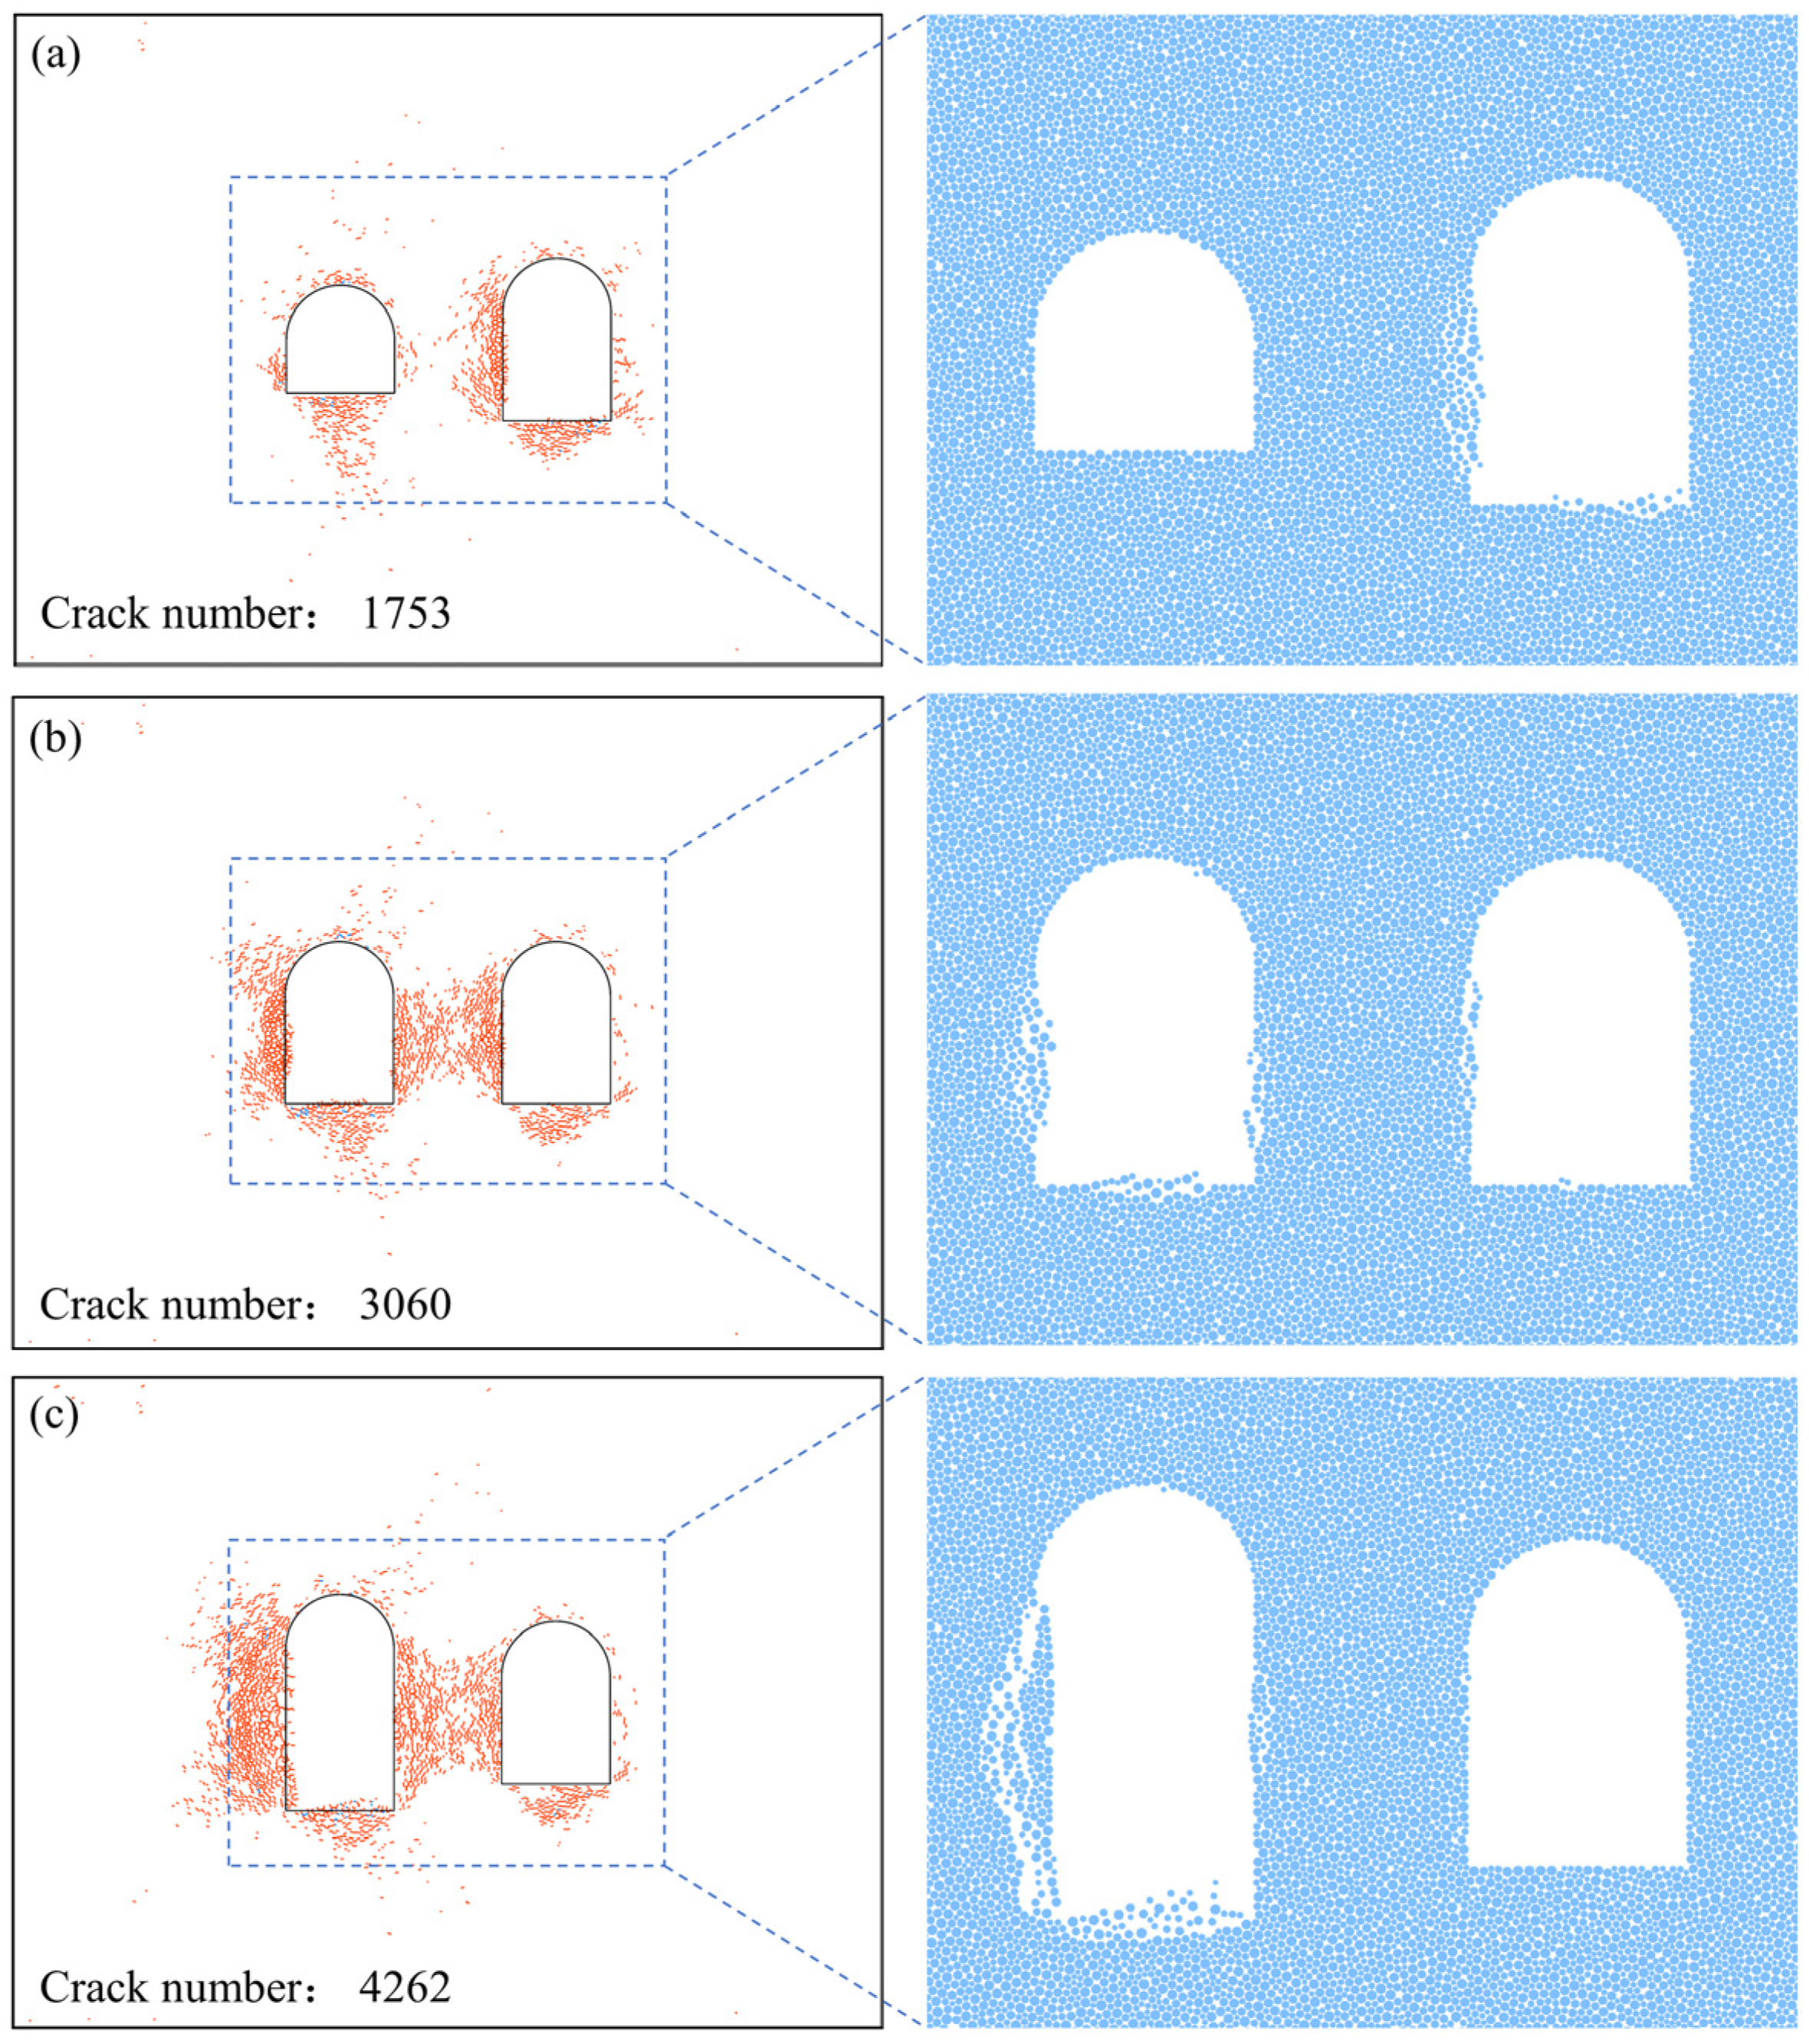
- When the stress wave is horizontally incident, the presence of the incident side cavern reduces peak tangential stress and kinetic energy on the non-incident side cavern, resulting in less damage on the non-incident side cavern. With decreasing cavern clearance, more significant stress concentration occurs in the intermediate rock pillar, and the damage extent in the facing-wave side of cavern 2 increases.
- (3)
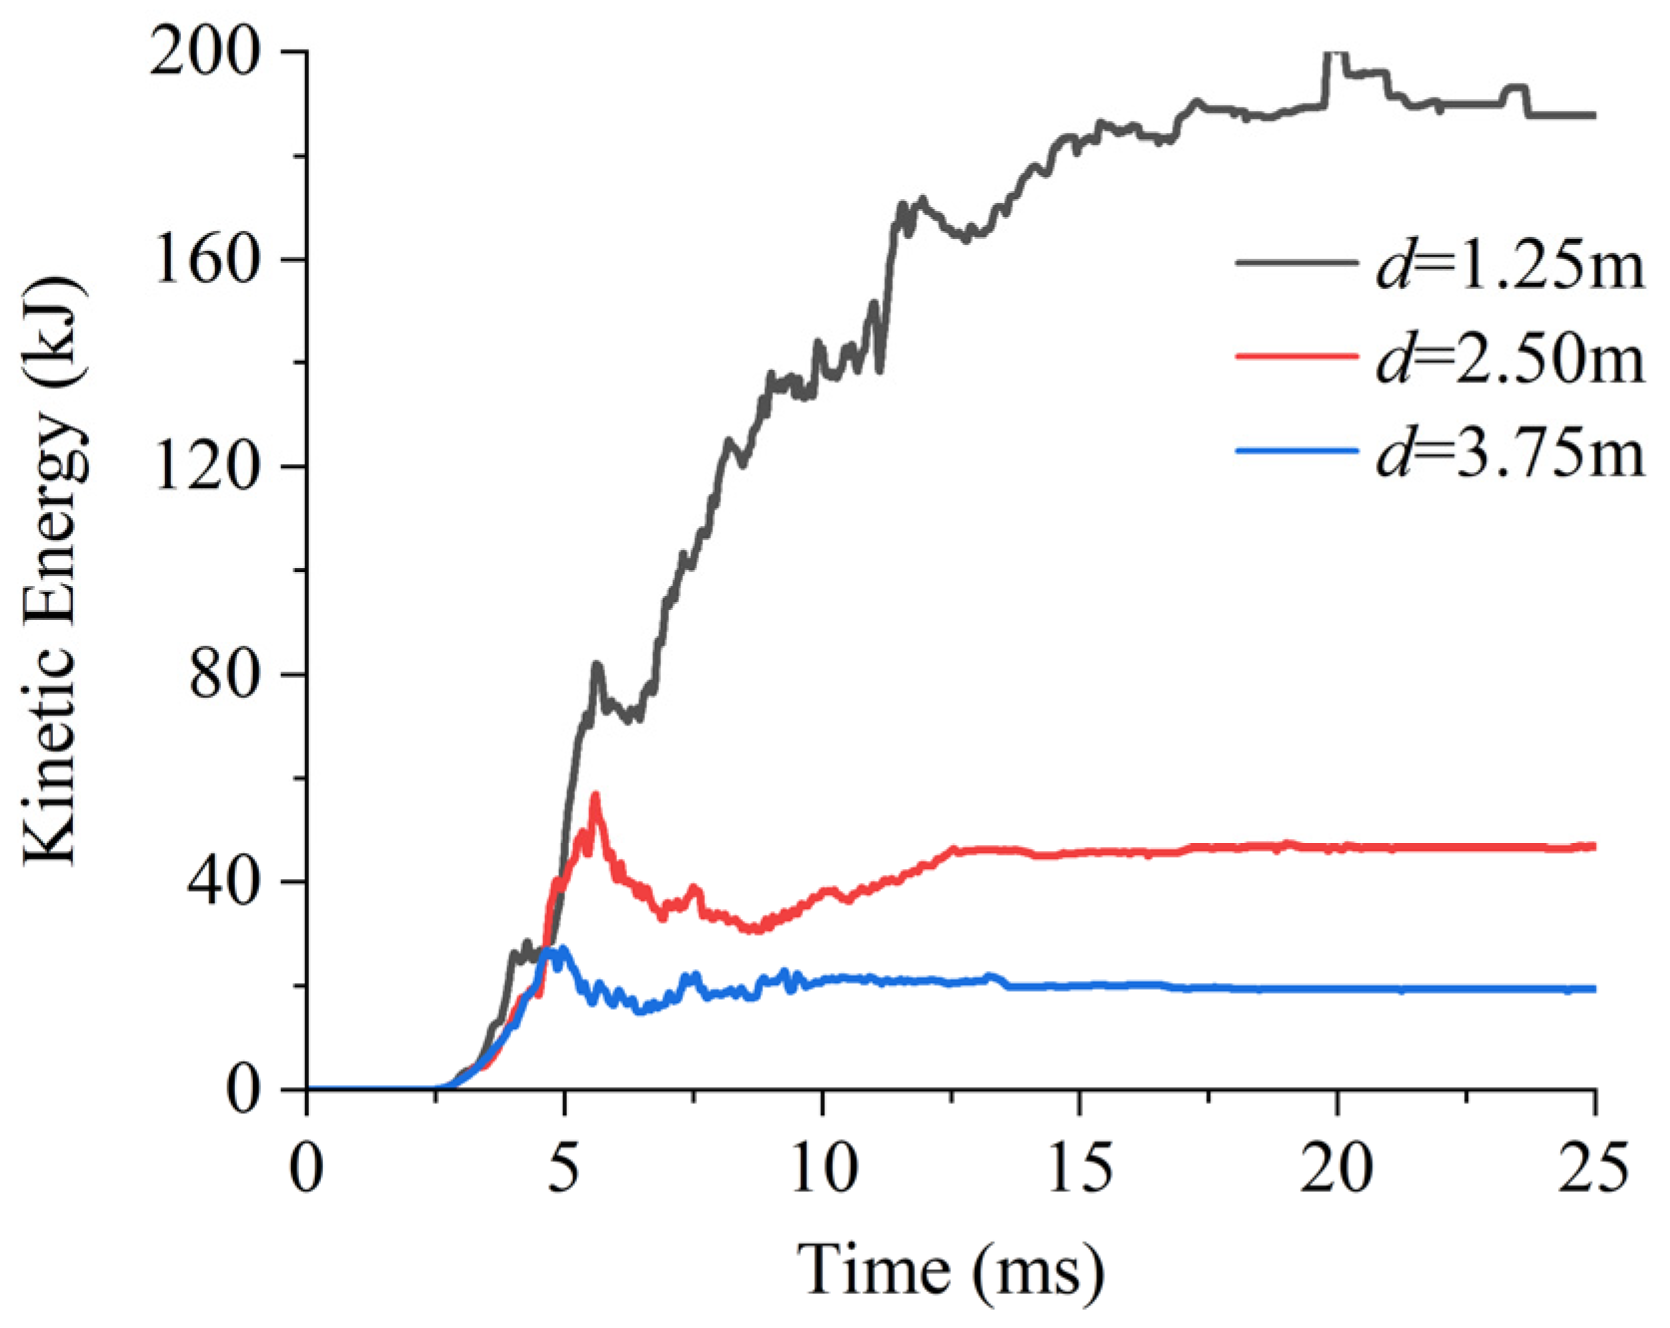
- A vertically incident stress wave causes more severe damage in the intermediate rock pillar compared to a horizontally incident stress wave. The smaller the cavern clearance, the more violent the rockburst in the intermediate rock pillar.
- (4)
- The failure characteristics of the caverns vary with the cavern height ratio. When the stress wave is horizontally incident, the higher the incident side cavern, the more stable the non-incident side cavern. When the stress wave is vertically incident, the cavern with lower height exhibits more severe failure at the adjacent sidewall compared to the cavern with higher height.
Author Contributions
Funding
Institutional Review Board Statement
Informed Consent Statement
Data Availability Statement
Conflicts of Interest
References
- Ortlepp, W.D. The behaviour of tunnels at great depth under large static and dynamic pressures. Tunn. Undergr. Space Technol. 2001, 16, 41–48. [Google Scholar] [CrossRef]
- Li, T.B.; Ma, C.C.; Zhu, M.L.; Meng, L.B.; Chen, G.Q. Geomechanical types and mechanical analyses of rockbursts. Eng. Geol. 2017, 222, 72–83. [Google Scholar] [CrossRef]
- Su, G.S.; Chen, Y.X.; Jiang, Q.; Li, C.J.; Cai, W. Spalling failure of deep hard rock caverns. J. Rock Mech. Geotech. Eng. 2023, 15, 2083–2104. [Google Scholar] [CrossRef]
- He, M.C.; Ren, F.Q.; Liu, D.Q. Rockburst mechanism research and its control. Int. J. Min. Sci. Technol. 2018, 28, 829–837. [Google Scholar] [CrossRef]
- Su, G.S.; Feng, X.T.; Wang, J.H.; Jiang, J.Q.; Hu, L.H. Experimental study of remotely triggered rockburst induced by a tunnel axial dynamic disturbance under true-triaxial conditions. Rock Mech. Rock Eng. 2017, 50, 2207–2226. [Google Scholar] [CrossRef]
- Wu, W.X.; Gong, F.Q.; Ren, L.; He, L. Strain rockburst failure characteristics and mechanism of high stress circular hard rock tunnel triggered by dynamic impact load. Int. J. Rock Mech. Min. Sci. 2023, 171, 105575. [Google Scholar] [CrossRef]
- He, C.L.; Chen, D.Y.; Xiao, J.G.; Lu, L.; Guo, Z.X. Experimental study of crack propagation and failure around a horseshoe tunnel during nearby blasting. Int. J. Rock Mech. Min. Sci. 2021, 139, 104628. [Google Scholar] [CrossRef]
- Guo, Y.; Huang, L.; Li, X. Experimental and numerical investigation on the fracture behavior of deep anisotropic shale reservoir under in-situ temperature. Energy 2023, 282, 128969. [Google Scholar] [CrossRef]
- Yue, F.; Liu, B.; Zhu, B.; Jiang, X.; Chen, L.; Liao, K. Shaking table test and numerical simulation on seismic performance of prefabricated corrugated steel utility tunnels on liquefiable ground. Soil Dyn. Earthq. Eng. 2021, 141, 106527. [Google Scholar] [CrossRef]
- He, M.; Ding, M.; Yuan, Z.; Zhao, J.; Luo, B.; Ma, X. Numerical simulation of rock bursts triggered by blasting disturbance for deep-buried tunnels in jointed rock masses. Comput. Geotech. 2023, 161, 105609. [Google Scholar] [CrossRef]
- Saiang, D. Stability analysis of the blast-induced damage zone by continuum and coupled continuum–discontinuum methods. Eng. Geol. 2010, 116, 1–11. [Google Scholar] [CrossRef]
- Qiu, J.D.; Li, D.Y.; Li, X.B.; Zhu, Q.Q. Numerical investigation on the stress evolution and failure behavior for deep roadway under blasting disturbance. Soil Dyn. Earthq. Eng. 2020, 137, 106278. [Google Scholar] [CrossRef]
- Wang, G.Y.; Cao, A.S.; Wang, X.Y.; Yu, R.; Huang, X.; Lin, J.J. Numerical simulation of the dynamic responses and damage of underground cavern under multiple explosion sources. Eng. Fail. Anal. 2021, 120, 105085. [Google Scholar] [CrossRef]
- Mitelman, A.; Elmo, D. Modelling of blast-induced damage in tunnels using a hybrid finite-discrete numerical approach. J. Rock Mech. Geotech. Eng. 2014, 6, 565–573. [Google Scholar] [CrossRef]
- Kuili, S.; Sastry, V.R. A numerical modelling approach to assess the behaviour of underground cavern subjected to blast loads. Int. J. Min. Sci. Technol. 2018, 28, 975–983. [Google Scholar] [CrossRef]
- Manouchehrian, A.; Cai, M. Analysis of rockburst in tunnels subjected to static and dynamic loads. J. Rock Mech. Geotech. Eng. 2017, 9, 1031–1040. [Google Scholar] [CrossRef]
- Mwakipunda, G.C.; Mgimba, M.M.; Ngata, M.R.; Yu, L. Recent advances on carbon dioxide sequestration potentiality in salt caverns: A review. Int. J. Greenh. Gas Control 2024, 133, 104109. [Google Scholar] [CrossRef]
- Liu, X.Y.; Xu, D.P.; Jiang, Q.; Ma, X.D. Excavation response and reinforcement practice of large underground caverns within high-stress hard rock masses: The case of Shuangjiangkou hydropower Station, China. Tunn. Undergr. Space Technol. 2024, 147, 105698. [Google Scholar] [CrossRef]
- Fu, J.Y.; Yang, J.S.; Yan, L.; Abbas, S.M. An analytical solution for deforming twin-parallel tunnels in an elastic half plane. Int. J. Numer. Anal. Methods Geomech. 2015, 39, 524–538. [Google Scholar] [CrossRef]
- Zeng, X.; Lu, A.; Zhang, N. Analytical stress solution for an infinite plate containing two oval holes. Eur. J. Mech. A Solids 2018, 67, 291–304. [Google Scholar] [CrossRef]
- Hasheminejad, S.M.; Avazmohammadi, R. Harmonic wave diffraction by two circular cavities in a poroelastic formation. Soil Dyn. Earthq. Eng. 2007, 27, 29–41. [Google Scholar] [CrossRef]
- Liu, Q.; Wang, R. Dynamic response of twin closely-spaced circular tunnels to harmonic plane waves in a full space. Tunn. Undergr. Space Technol. 2012, 32, 212–220. [Google Scholar] [CrossRef]
- Balendra, T.; Thambiratnam, D.P.; Koh, C.G.; Lee, S.-L. Dynamic response of twin circular tunnels due to incident SH-waves. Earthq. Eng. Struct. Dyn. 1984, 12, 181–201. [Google Scholar] [CrossRef]
- Lu, S.; Yao, Y.; Jia, Y.; Sun, J.; Ji, L.; Zhang, Z. Dynamic response of twin circular unlined tunnels subjected to blasting P waves. Front. Earth Sci. 2022, 10, 941070. [Google Scholar] [CrossRef]
- Potyondy, D.O.; Cundall, P.A. A bonded-particle model for rock. Int. J. Rock Mech. Min. Sci. 2004, 41, 1329–1364. [Google Scholar] [CrossRef]
- Potyondy, D.O. A flat-jointed bonded-particle material for hard rock. In Proceedings of the 46th U.S. Rock Mechanics/Geomechanics Symposium, Chicago, IL, USA, 24–27 June 2012. [Google Scholar]
- Bahaaddini, M.; Sheikhpourkhani, A.M.; Mansouri, H. Flat-joint model to reproduce the mechanical behaviour of intact rocks. Eur. J. Environ. Civ. Eng. 2021, 25, 1427–1448. [Google Scholar] [CrossRef]
- Wu, S.C.; Xu, X.L. A study of three intrinsic problems of the classic discrete element method using flat-joint model. Rock Mech. Rock Eng. 2016, 49, 1813–1830. [Google Scholar] [CrossRef]
- Liang, L.S.; Li, X.B.; Zhu, Q.Q.; Peng, S.Y.; Si, X.F. Stress distribution and failure characteristics around U-shaped caverns with different height-to-width ratios under biaxial compression. Eng. Fail. Anal. 2024, 156, 107800. [Google Scholar] [CrossRef]
- Sun, Y.; Tan, C.X. An analysis of present day regional tectonic stress field and crustal movement trend in China. J. Geomech. 1995, 1, 1–12. (In Chinese) [Google Scholar]
- Lysmer, J.; Kuhlemeyer, R.L. Finite dynamic model for infinite media. J. Eng. Mech. Div. 1969, 95, 859–877. [Google Scholar] [CrossRef]
- Lu, S.; Zhou, C.; Zhang, Z.; Jiang, N. Particle velocity response of surrounding rock of a circular tunnel subjected to cylindrical P-waves. Tunn. Undergr. Space Technol. 2019, 83, 393–400. [Google Scholar] [CrossRef]
- Yang, J.H.; Xia, Y.Y.; Chen, Z.Z.; Chen, D.; Pei, Y.Y.; Zhu, W.H. Dynamic behavior of road high cutting rock slope under the influence of blasting for excavation. Procedia Earth Planet. Sci. 2012, 5, 25–31. [Google Scholar] [CrossRef]
- Yang, C.; Zhou, K.; Zhang, Q.; He, M.; Gao, F.; Xiong, X.; Pan, Z.; Topa, A. Rockburst prevention by microwave destressing: A numerical investigation. Geomech. Geophys. Geo-Energy Geo-Resour. 2024, 10, 38. [Google Scholar] [CrossRef]
- Wang, H.N.; Gao, X.; Wu, L.; Jiang, M.J. Analytical study on interaction between existing and new tunnels parallel excavated in semi-infinite viscoelastic ground. Comput. Geotech. 2020, 120, 18. [Google Scholar] [CrossRef]
- Esterhuizen, G.S.; Dolinar, D.R.; Ellenberger, J.L. Pillar strength in underground stone mines in the United States. Int. J. Rock Mech. Min. Sci. 2011, 48, 42–50. [Google Scholar] [CrossRef]
- Zvarivadza, T.; Sengani, F. Performance of bolt-reinforced and fibre shotcreted in-stope pillars in rockburst prone areas. In Proceedings of the ARMA US Rock Mechanics/Geomechanics Symposium, Seattle, DC, USA, 17–20 June 2018. [Google Scholar]


| Mechanical Parameters | Density (kg/m3) | Elastic Modulus (GPa) | Poisson’s Ratio | Uniaxial Compressive Strength (MPa) | Brazilian Tensile Strength (MPa) |
|---|---|---|---|---|---|
| Experimental results | 2440 | 18.60 | 0.21 | 97.60 | 4.87 |
| Numerical results | 2440 | 18.74 | 0.21 | 97.38 | 4.91 |
| Microscopic Parameters | Values | Microscopic parameters | Values |
|---|---|---|---|
| Particle density, ρ (kg/m3) | 2711 | Effective modulus, Ec (Gpa) | 18.34 |
| Particle minimum radius, rmin (m) | 0.03 | Stiffness ratio, kn/ks | 2.0 |
| Particle radius ratio, rmax/rmin | 2.0 | Tensile strength, σc (MPa) | 8.25 ± 0.83 |
| Number of elements | 2 | Cohesion strength, c (MPa) | 45.60 ± 4.56 |
| Porosity | 0.1 | Friction angle, φ (°) | 46 |
| Local damping coefficient | 0.0 | Friction coefficient, μ | 0.50 |
| Cavern Clearance | Midpoint of Crown (A1) | Midpoint of Floor (D1) | Midpoint of Adjacent Sidewall (C1) | Midpoint of Non-Adjacent Sidewall (B1) |
|---|---|---|---|---|
| Single cavern | 38.2 MPa | 19.3 MPa | 29.7 MPa | 30.0 MPa |
| 3.75 m | 33.7 MPa | 17.2 MPa | 35.3 MPa | 30.2 MPa |
| 2.50 m | 32.9 MPa | 16.1 MPa | 43.1 MPa | 34.4 MPa |
| 1.25 m | 29.9 MPa | 15.2 MPa | 59.6 MPa | 36.5 MPa |
Disclaimer/Publisher’s Note: The statements, opinions and data contained in all publications are solely those of the individual author(s) and contributor(s) and not of MDPI and/or the editor(s). MDPI and/or the editor(s) disclaim responsibility for any injury to people or property resulting from any ideas, methods, instructions or products referred to in the content. |
© 2024 by the authors. Licensee MDPI, Basel, Switzerland. This article is an open access article distributed under the terms and conditions of the Creative Commons Attribution (CC BY) license (https://creativecommons.org/licenses/by/4.0/).
Share and Cite
Liang, L.; Li, X.; Liu, Z. Dynamic Responses and Failure Characteristics of Deep Double U-Shaped Caverns under Disturbing Loads. Appl. Sci. 2024, 14, 4543. https://doi.org/10.3390/app14114543
Liang L, Li X, Liu Z. Dynamic Responses and Failure Characteristics of Deep Double U-Shaped Caverns under Disturbing Loads. Applied Sciences. 2024; 14(11):4543. https://doi.org/10.3390/app14114543
Chicago/Turabian StyleLiang, Lisha, Xibing Li, and Zhixiang Liu. 2024. "Dynamic Responses and Failure Characteristics of Deep Double U-Shaped Caverns under Disturbing Loads" Applied Sciences 14, no. 11: 4543. https://doi.org/10.3390/app14114543