Article

Numerical Study on the Mechanical Behavior of Sand–Rubber Mixtures under True Triaxial Tests

School of Civil Engineering, Architecture and Environment, Hubei University of Technology, Wuhan 430068, China
*
Author to whom correspondence should be addressed.
Appl. Sci. 2024, 14(11), 4560; https://doi.org/10.3390/app14114560
Submission received: 25 April 2024 / Revised: 21 May 2024 / Accepted: 24 May 2024 / Published: 25 May 2024
(This article belongs to the Section Additive Manufacturing Technologies)

Abstract

:
A series of numerical true triaxial compression tests were carried out on rubber–sand mixtures (RSMs) by means of the 3D discrete element method to study the effect of the intermediate principal stress ratio b on the failure properties of RSMs with different rubber contents (RCs), and to explore the effect mechanism from a microscopic point of view. The numerical simulation results show that as the intermediate principal stress ratio b increases and the peak deviator stress q p e a k gradually increases, while the peak internal friction angle φ b first increases and then decreases. The numerical simulation results were compared with four common strength criteria, including the modified Lade–Duncan criterion, the SMP criterion, the FKZ criterion and the DP criterion. The comparative analysis showed that the existing common criteria cannot accurately predict the damage state of RSMs, suggesting the necessity for further research. At the micro level, the combined effects of the intermediate principal stress ratio b values and RC on the micro-parameters, such as the coordination number, average normal stress between particles, probability density and anisotropy, were investigated.

1. Introduction

With the strengthening of people’s awareness of environmental protection and the increase in car ownership year by year, waste tires, as a by-product of the automotive industry, have received increasing attention in terms of recycling and reuse. At present, the main methods of disposing of used tires are landfill, refurbishment and incineration. However, the treatment process is accompanied by the growth of bacteria, the release of toxic and harmful gases and the contamination of groundwater resources. In recent years, many scholars have made good progress in exploring the application of waste tires as geotechnical engineering construction materials [1,2,3,4,5]. Rubber materials, which have strong deformation, low permeability and good thermal insulation properties, are often mixed with sand as a lightweight geotechnical filler and used for backfilling roads and slopes. Many scholars have conducted a number of studies on the mechanical properties of RSMs, such as their strength, modulus, Poisson’s ratio and damping [6,7,8,9,10], through experiments and numerical simulations.
In terms of indoor research, the main focus is on the influence of material properties (rubber content, particle type, particle size ratio, etc.) on the dynamic and static mechanics and deformation characteristics of RSMs. Liu Fangcheng et al. [9] jointly analyzed the mechanical deformation characteristics of RSMs through indoor triaxial and simple shear experiments and found that with an increase in rubber content, the modulus of RSMs decreases, and the stress–strain curve develops from strain softening to hardening. Cheng Zhuang et al. [11] showed, based on indoor direct shear experiments, that as the rubber particles increase, the shear and compressive strength of the mixture will decrease, and the internal friction angle decreases linearly. At the same time, through indoor unconfined compression experiments and scanning electron microscopy experiments, it was found that the loaded medium under low rubber content is mainly sand–sand contact, and under high rubber content, the load depends on the large deformation of rubber particles. R. Fu et al. [12] studied the effect of particle types on the mechanical properties of RSMs through indoor triaxial experiments and dynamometer experiments, and found that the strength of the sand particles affects the yield rate during compression. Meanwhile, except for the highest RC, the critical-state stress ratio and stress–strain behavior of the RSM are controlled. Das et al. [10] analyzed the influence of RC on the dynamic strength characteristics and dynamic pore pressure development of a mixture through indoor dynamic triaxial experiments, and found that the higher the rubber content, the higher the liquefaction resistance of the RSM. Shariatmadari et al. [13] found the same law in their study of the dynamic characteristics of sand samples mixed with rubber powder under saturated undrained conditions, and further showed that rubber powder with a larger particle size can greatly improve the resistance of the sample in terms of liquefaction ability. Nakhaei, A and Ehsani, M et al. [14,15] studied the influence of RC on the dynamic shear modulus and damping ratio in a series of large-scale indoor cyclic simple shear experiments. B. R. Madhusudhan et al. [16] studied the static and dynamic characteristics of sand–tire-scrap mixtures under high-strain conditions. Perez et al. [17,18] established a numerical model of a binary RSM by means of the discrete element method and conducted a series of triaxial tests to study the effects of the rubber particle size and the rubber particle content on the mechanical state, the critical state and the unstable behavior of the RSM under static loading. At the same time, Perez et al. [19] and Anastasiadis et al. [20,21] conducted a micro-mechanical study of an RSM with a small strain state and obtained micro-scale information about all the experiments. Gong et al. [22] analyzed the mechanical behavior of an RSM with large rubber particles. Based on the research on rubber–sand mixtures by domestic and foreign scholars, laboratory tests and numerical simulations are mainly used to study various mechanical properties of rubber–sand, and most of them are concentrated on the effects of sand type, rubber content, particle size and consolidation pressure on the macro–micro strength deformation characteristics and influence mechanism of RSMs. However, there are few studies considering the mechanical properties of RSMs under complex stress paths, and there are insufficient studies on the practical applications of materials in engineering.
This paper uses the three-dimensional discrete element method to systematically analyze the effect of the intermediate principal stress ratio on the strength characteristics of RSMs with different RCs and discuss the corresponding mesoscopic mechanism. This study analyzes the influence of rubber content RC on the relationship between friction angle and b value, and compares it with several common strength criteria. In terms of mesoscopic analysis, the influence of b-value and RC on coordination number, average inter-grain stress, PDF and anisotropy parameters is analyzed, and the meso-mechanism of the influence of RC and b-value on strength is initially explained. The analysis is based on the effect of a stress path with a fixed value of b on the strength characteristics and anisotropy of an RSM containing large rubber particles, and the fabric tensor is used to conduct a preliminary macro–micro combination study.

2. Numerical Simulation Based on DEM

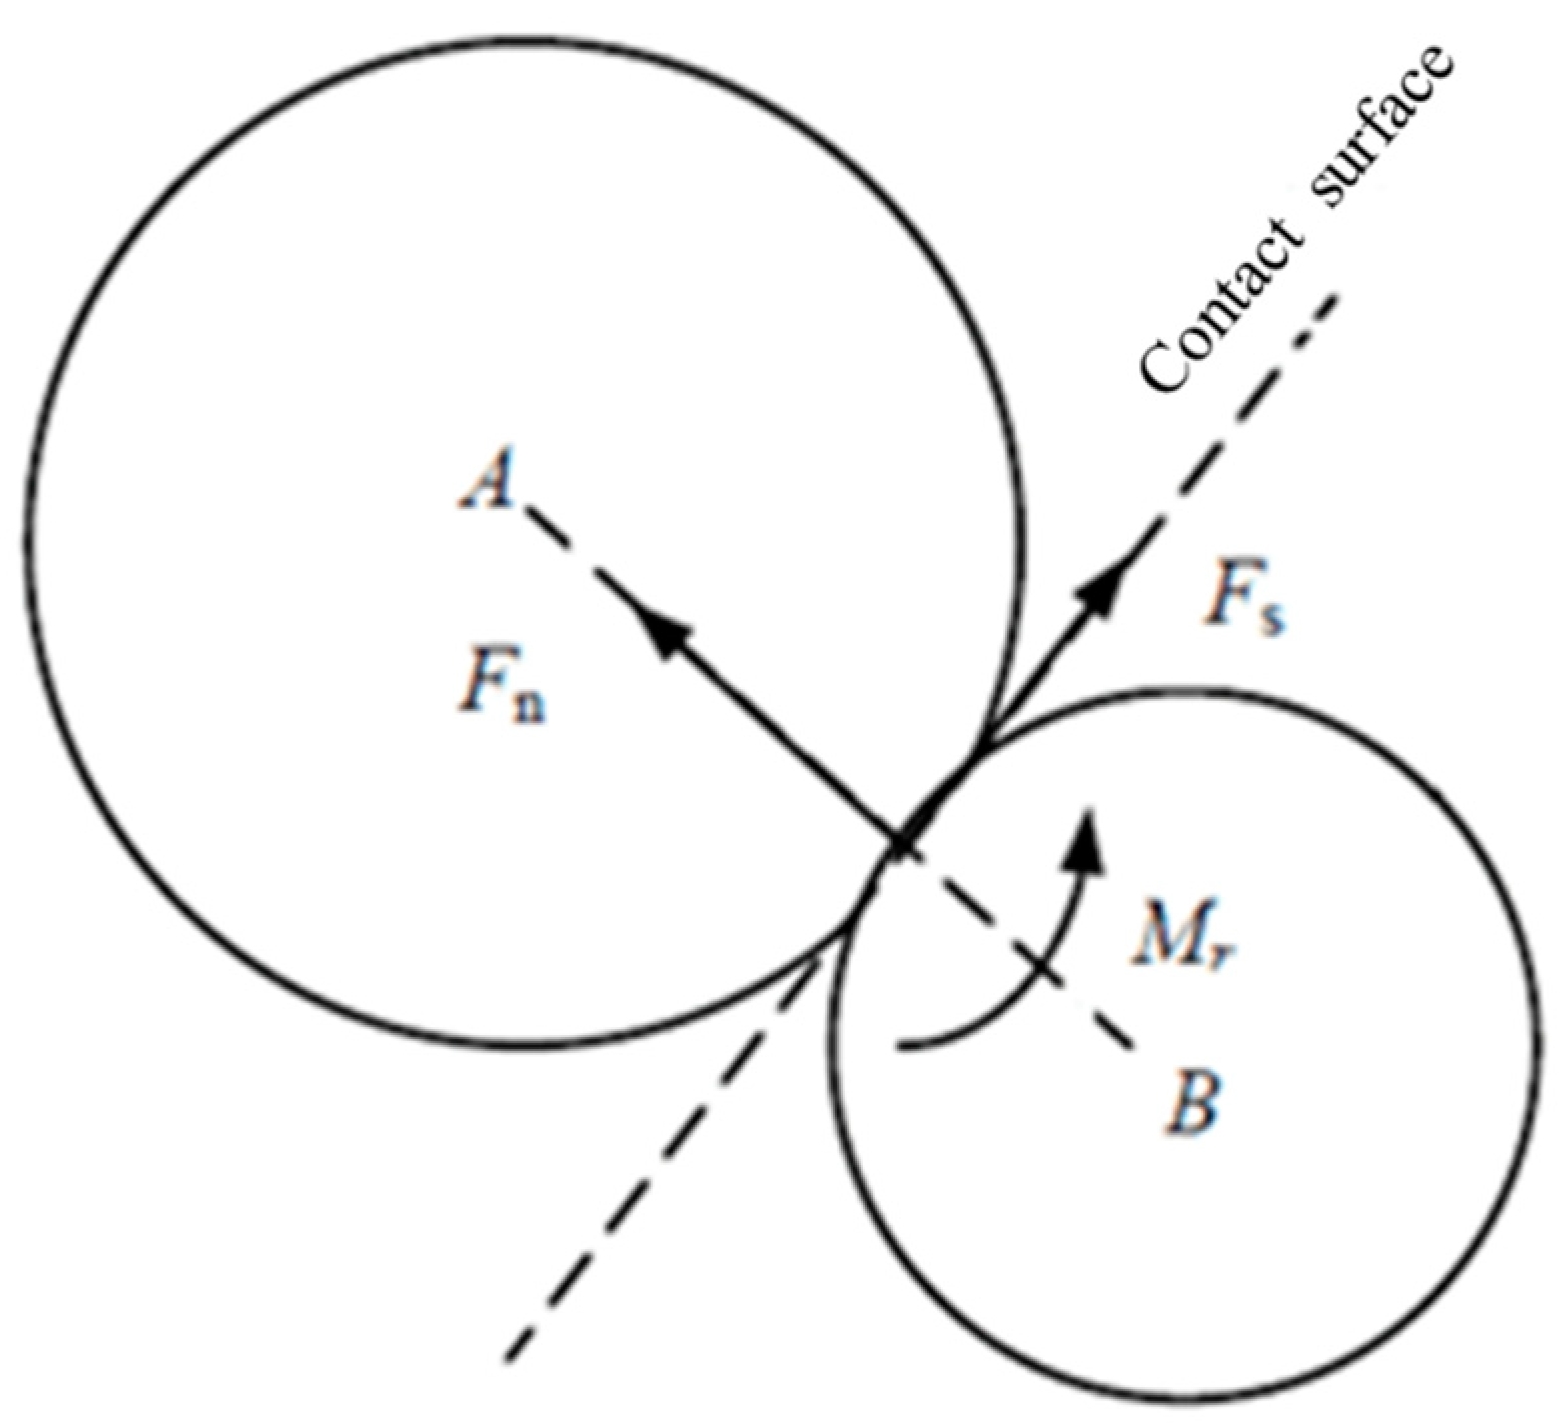
2.1. Rolling Resistance Contact Model

PFC3D uses Newton’s second law and force–displacement law to determine the movement of particles and the force on the contact surface. The core of particle behavior is the contact characteristics of particles, that is, the contact constitutive model. At present, there are two main modeling methods for particles of non-cohesive soil that consider the influence of particle shape: one aims to directly simulate the shape of complex particles; the other aims to establish a complete contact model considering the influence of particle shape [23]. Since the main material in this sample is sand particles, the material itself does not exhibit obvious anisotropy, and the calculation efficiency is low due to the establishment of a complex-shaped real model, we comprehensively consider the selection of a rolling resistance contact model that can reflect the complete contact mechanical characteristics to establish the model, as shown in Figure 1.
The rolling resistance contact model of Oda et al. [24] and Jiang et al. [25] has received widespread attention, and its main mechanical principles are
F c = F l + F d
M c = M T
where F l is the linear force, F d is the damping force and M T is the anti-rolling moment.
The update principle of F l and F d in the rolling resistance contact model is the same as that of the linear model, and the update principle of M T is
M T : = M T k r Δ θ b
where Δ θ b is the relative rolling angle increment and k r is the rolling stiffness, which is defined as
k r = k s R ¯ 2
where k s is the normal contact stiffness and R ¯ is the effective contact radius, which is defined as
1 R ¯ = 1 R 1 + 1 R 2
where R 1 and R 2 are the radii of the contact particles; if the contact end is a wall, the radius is infinite.
Finally, the threshold M T of the update method is calculated as follows:
M T = M T ,   M T M M M T / M T ,     o t h e r w i s e
where M is the rolling resistance moment that meets the Coulomb friction law, which is defined as
M = μ r R ¯ F n l
where μ r is the rolling resistance coefficient, and F n l is the normal contact force of the linear part.
The rolling resistance contact model can take the relative bending at the contact point into account, and is usually used for contact analysis where the rotation effect of particle systems is obvious. In this study, rubber particles and sand particles are modeled as spherical particles, which are more likely to have obvious rotation effects than real particles. The use of a rolling resistance contact model can effectively offset the rotation effects caused by spherical particles. During the action of the rolling resistance contact model, the contact bending moment increases linearly from the accumulated relative rotation. When the accumulated amount reaches the maximum product of the normal force, the rolling friction coefficient and the effective contact radius, the limit value of the rolling resistance moment is reached [26].

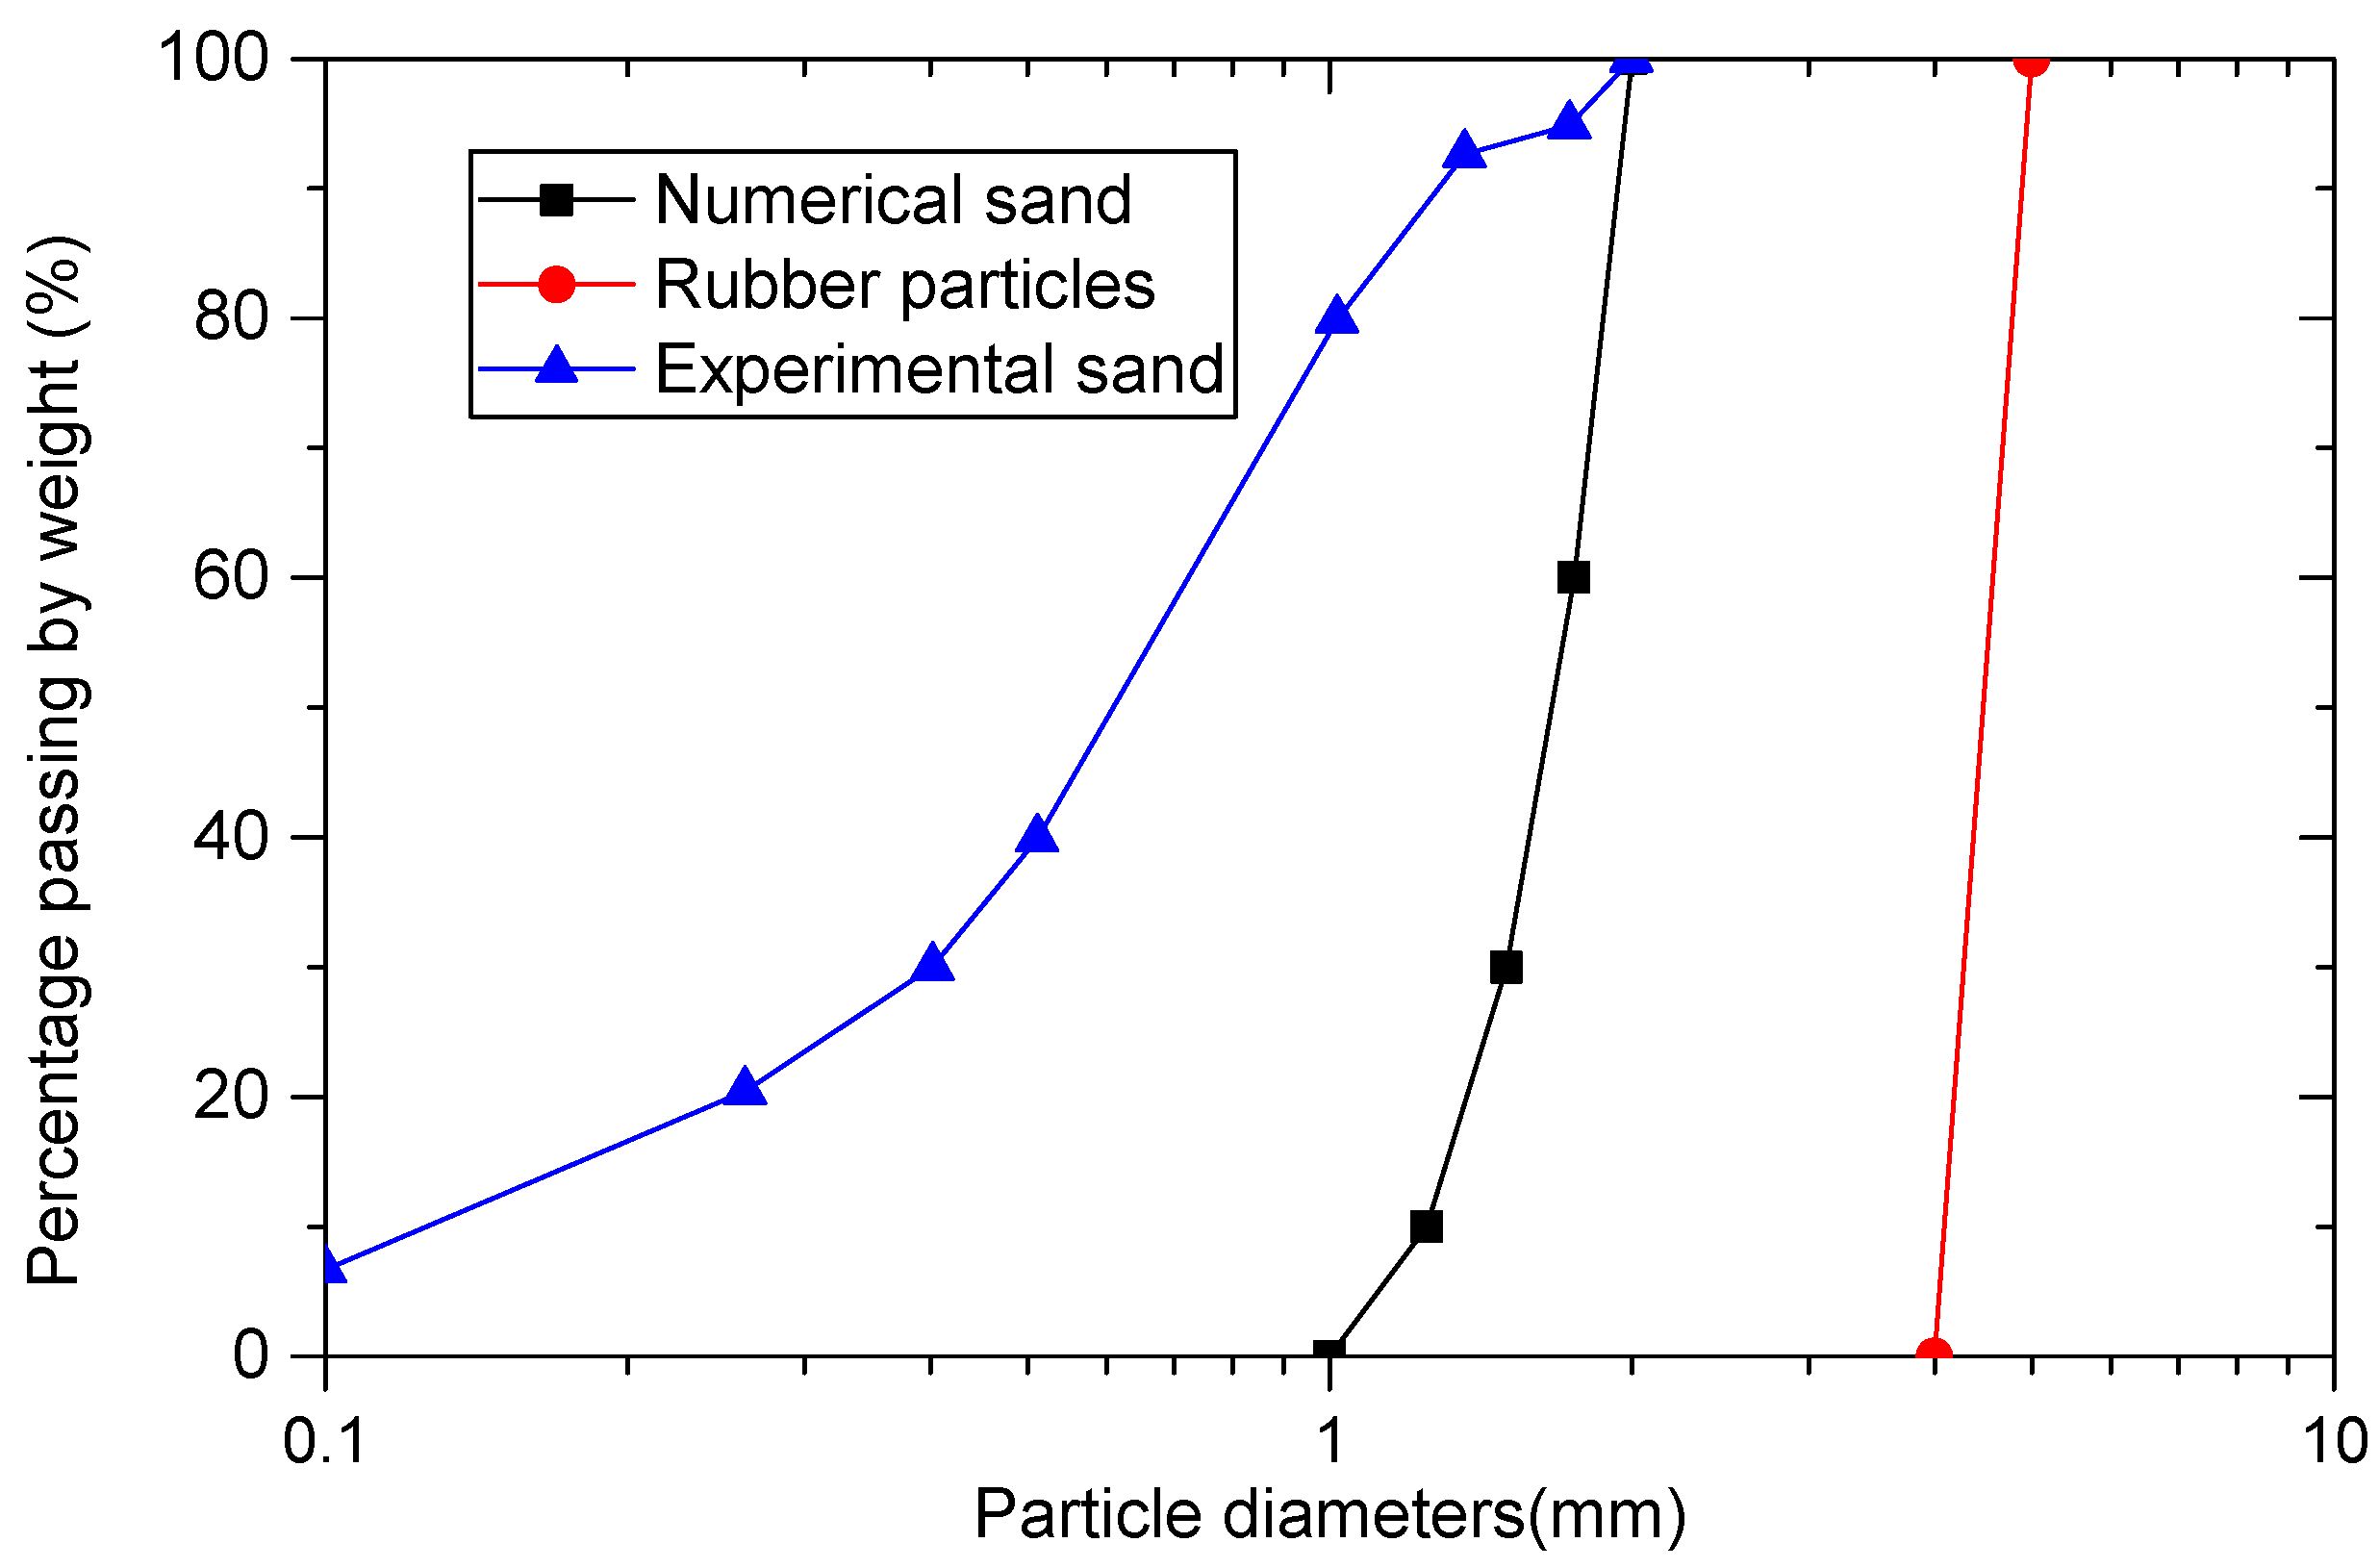
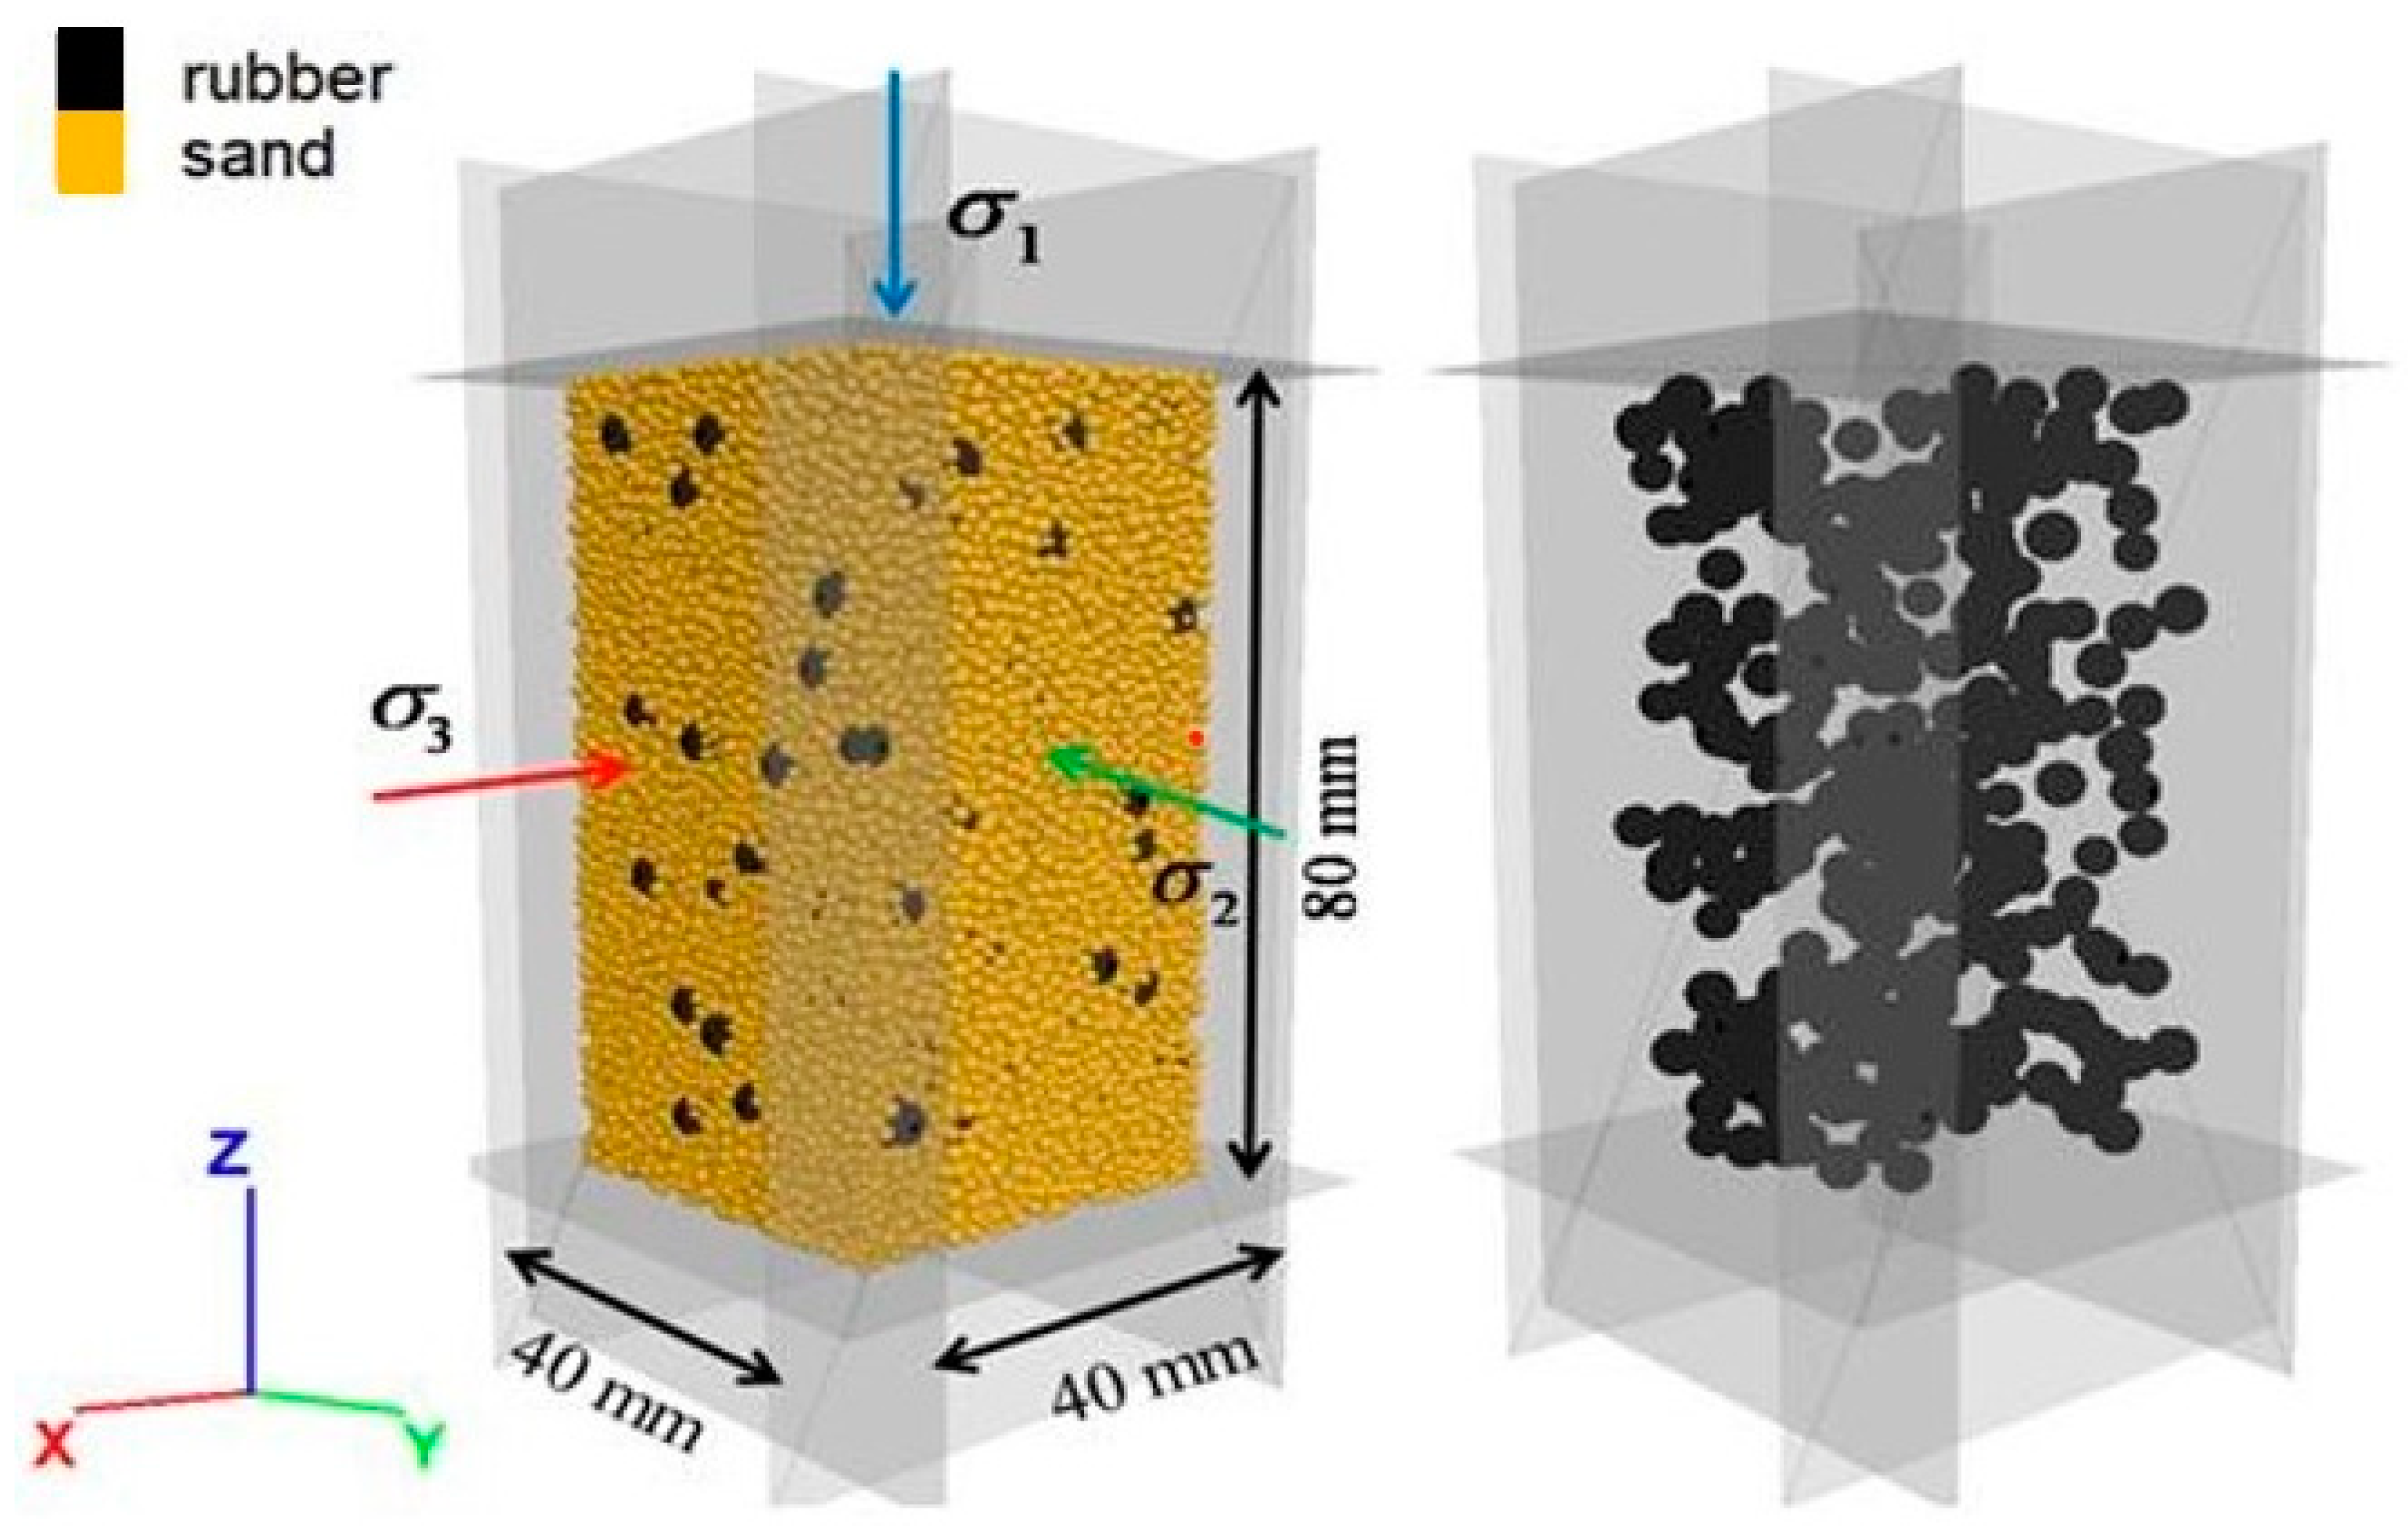
2.2. Numerical Sample Preparation and Experimental Procedures

An RSM is a typical binary mixture consisting of rubber particles and sand particles. Figure 2 gives the gradation curves of the numerical sand and rubber particles. The numerical rubber particles have a uniform particle size distribution of 4 mm~5 mm. The rubber particle contents (RCs) are 0%, 10% and 30%. RC is defined as the percentage of the mass of rubber particles to the total mass of the mixture. The numerical model is illustrated in Figure 3. The numerical sample is a cuboid compression chamber composed of six frictionless rigid plates with initial dimensions of 40 mm in length, 40 mm in width and 80 mm in height.
The preparation process of the numerical RSM sample is as follows. Spherical particles including rubber and sand particles are generated according to the particle gradation in the cuboid compression chamber. The porosity of the sample is the same as the test data in Deng et al. [1]. A very small friction coefficient value is assigned to both the rubber and sand particles to prevent high internal forces and ensure the compactness and uniformity of the sample. After the preparation, the numerical samples are consolidated by moving six frictionless rigid plates by means of a servo system. In order to avoid the initial anisotropy caused by sample preparation, three-way isostatic stress is applied at the same time until the target confining pressure is reached. In the shearing stage, the upper and lower walls are used to load, and the servo mechanism is used to control the stress in the other two directions to keep the b value unchanged. The shear process will not be stopped until the major principal strain reaches 15%. In this study, the major principal strain refers to the principal strain in the major principal stress direction.
In this study, the RC values are set to 0%, 10% and 30%, and the confining pressures are σ c = 100 kPa and 200 kPa. The intermediate principal stress ratios are b = 0.0, 0.2, 0.4, 0.6, 0.8 and 1.0. Under the control stress path of equal b and σ 3 , the stress path of the p-q stress space is a straight line. When σ 3 is constant, the b value is the only simulated experiment variable. Therefore, the influence of the intermediate principal stress ratio b value on the strength of the RSM can be analyzed. Among them, the intermediate principal stress ratio b, average stress p and generalized deviator stress q are defined as follows [27]:
b = σ 2 σ 3 σ 1 σ 3
p = σ 1 + σ 2 + σ 3 3
q = ( σ 1 σ 2 ) 2 + ( σ 2 σ 3 ) 2 + ( σ 3 σ 1 ) 2 2

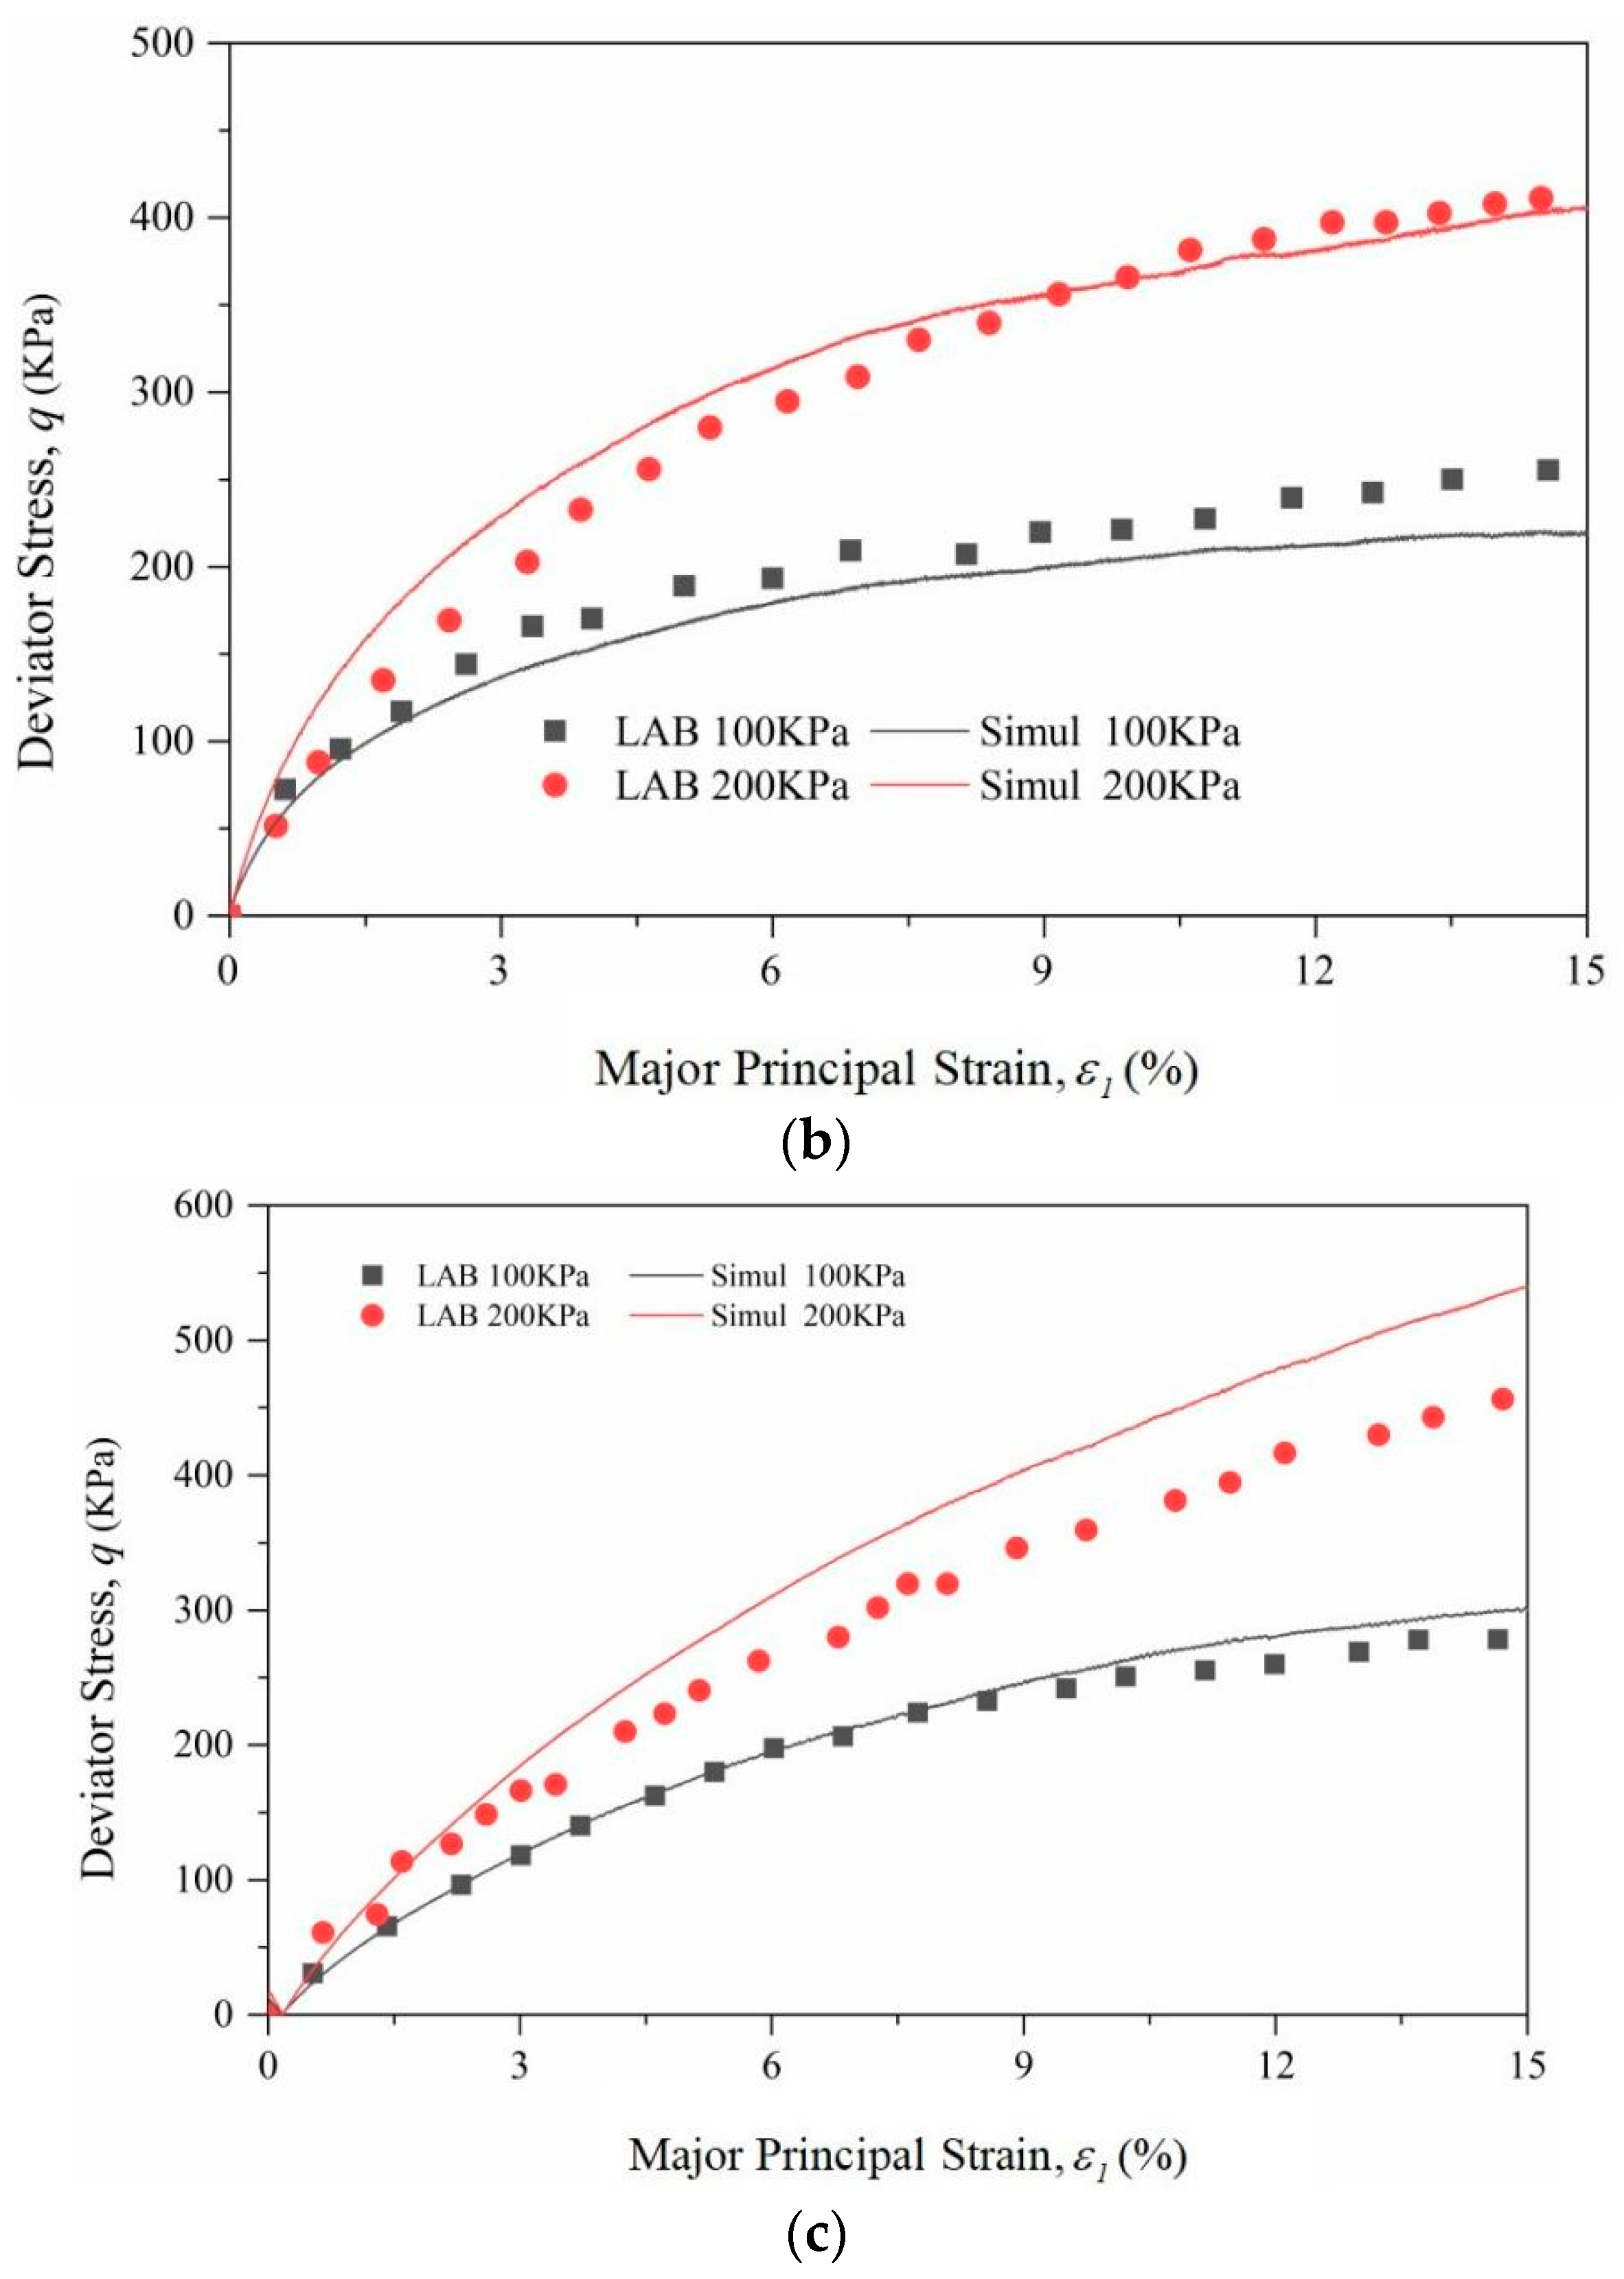
2.3. Parameter Calibration

The selection of micro-parameters is a key factor in determining the accuracy of the numerical simulation. This study summarizes the micro-parameters of RSMs in previous research, and illustrates them in Table 1. It is found that the contact stiffness of sand particles and rubber particles differs by 1000 times. And we also find that the rolling resistance contact model can be effectively applied to simulate RSM materials [18].
In this paper, the micro-parameters of rubber and sand particles are calibrated based on the experimental results of Deng et al. [1], and conventional triaxial tests are carried out to conduct the calibration. The materials’ parameters and contact micro-parameters are shown in Table 2 and Table 3. The calibration process is as follows: Firstly the sand–sand contact parameters between pure sand particles are calibrated; then, 10% rubber–sand is used to calibrate the rubber–sand contact parameters. Based on the sand–sand contact parameters and the small number of large rubber particles, the rubber–rubber contact has a weak contribution to the strength, so the rubber–sand contact parameters are calibrated. Finally, 30% rubber–sand is used to calibrate the rubber–rubber contact parameters.
Figure 4 shows a comparison between the numerical simulation curves of this study and the indoor experimental results of Deng et al. [1] with b = 0.0 and σ 3 = 100 kPa and 200 kPa. It is shown that the numerical results have good agreement with the experimental results.

3. Results

3.1. Macroscopic Behavior

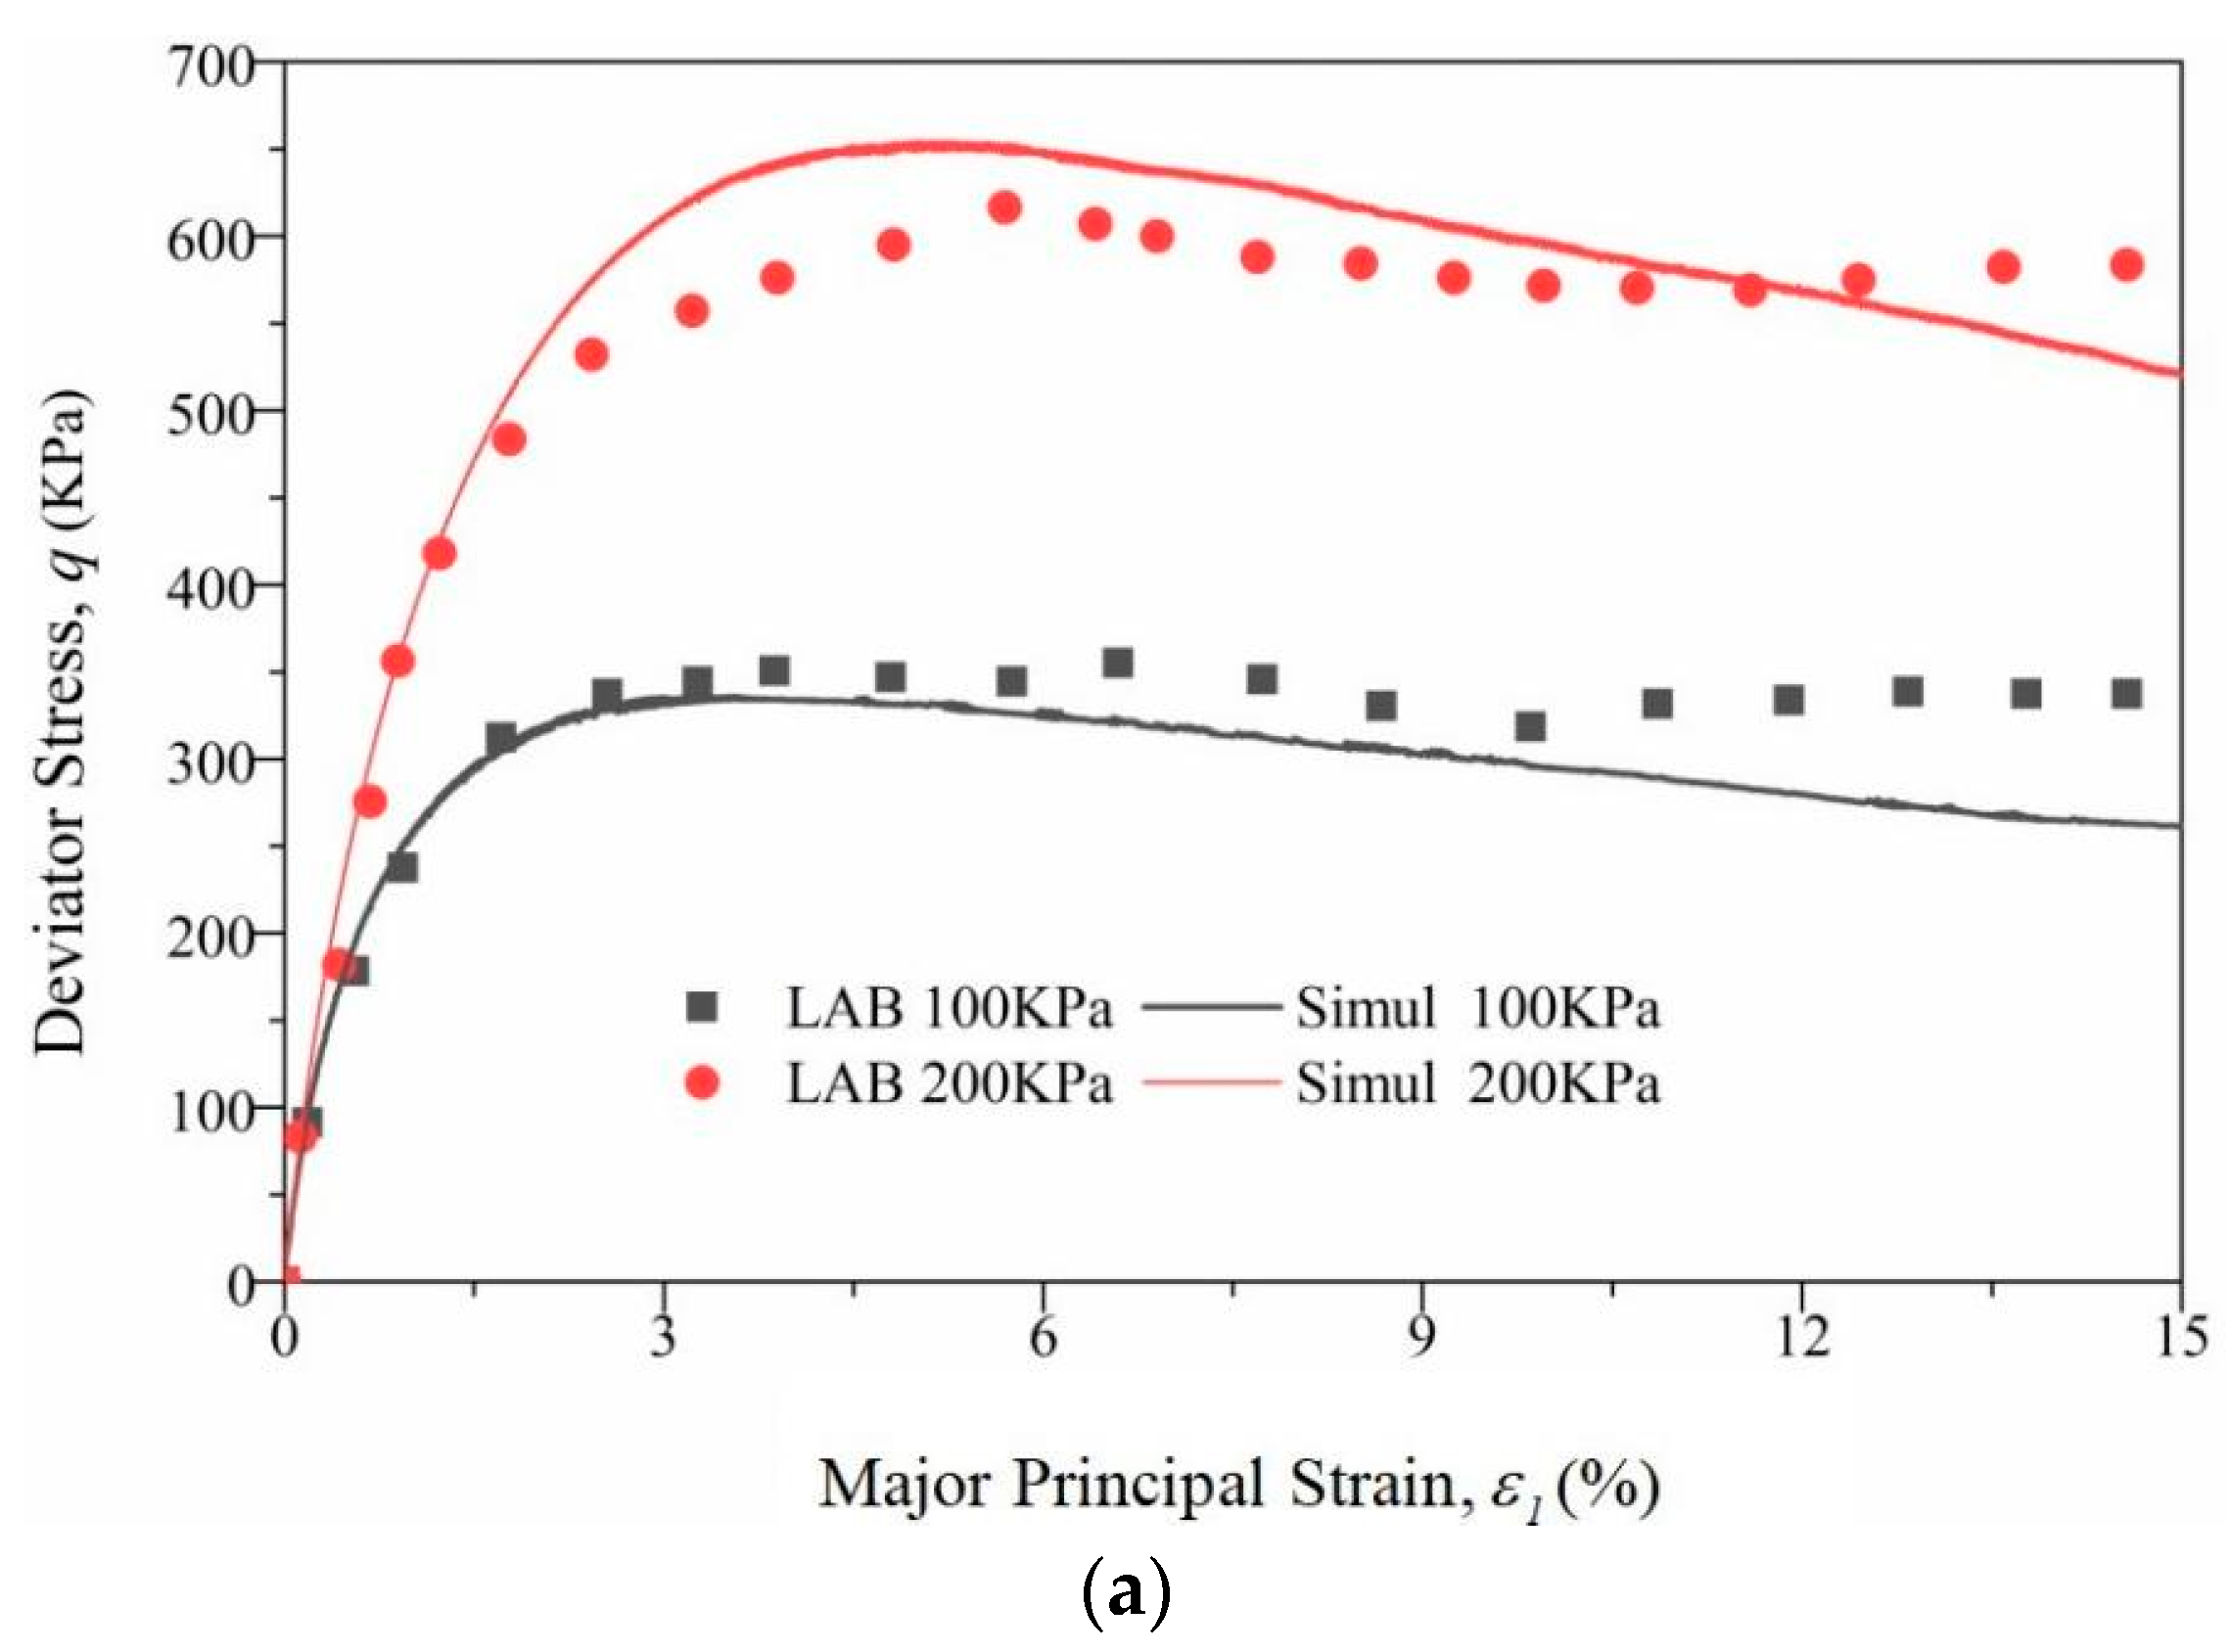
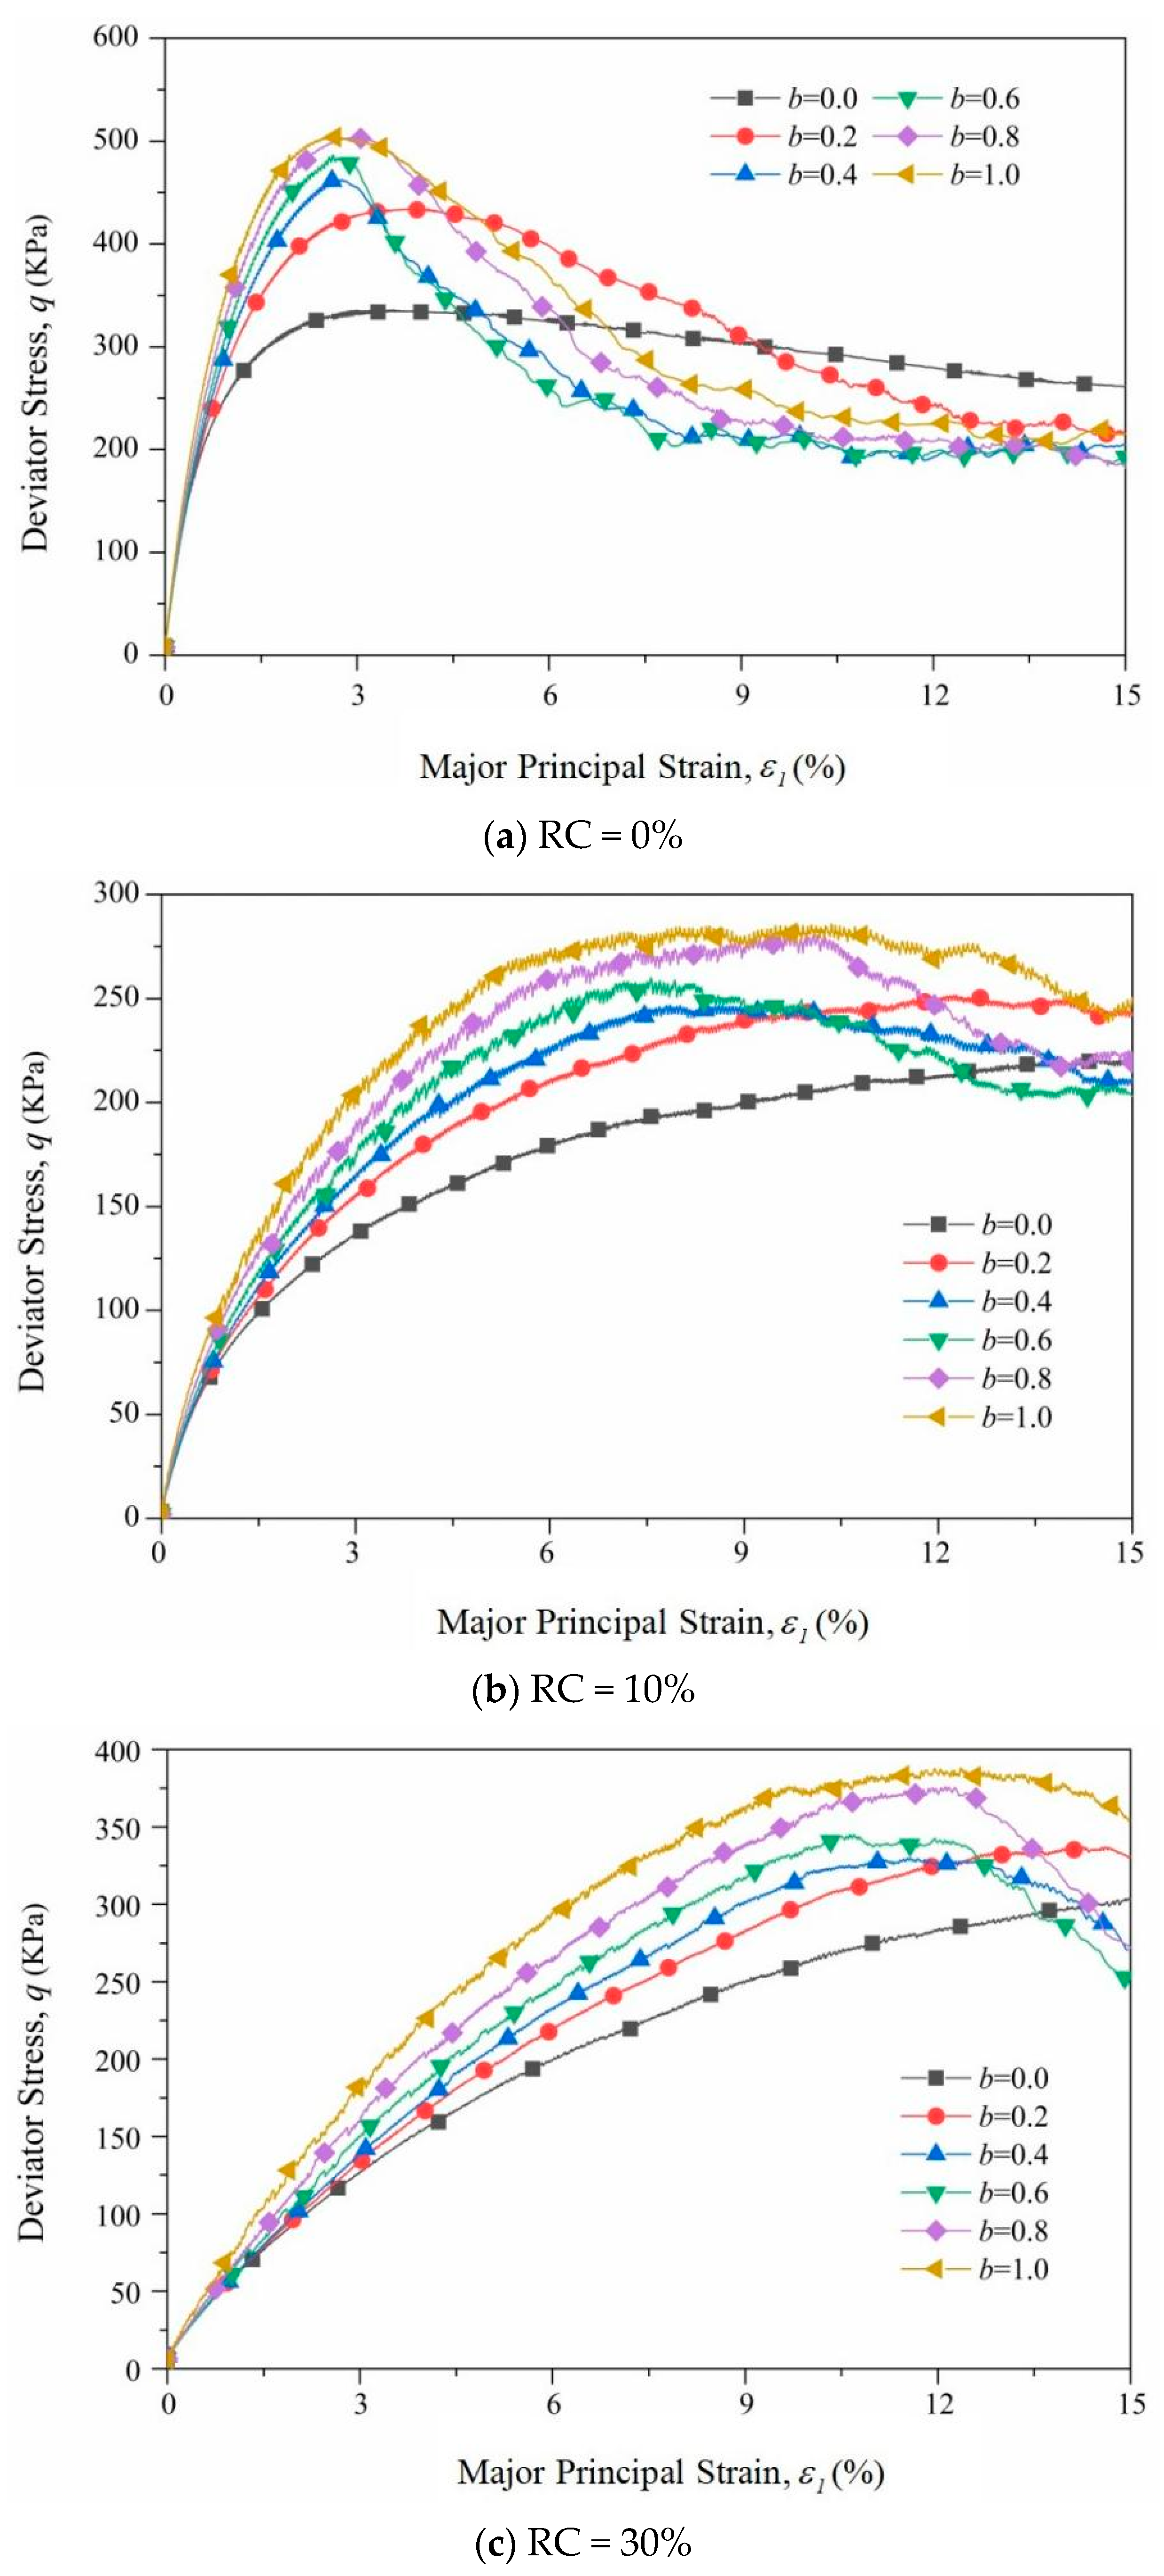
3.1.1. Stress–Strain Relationship

Figure 5 shows the stress–strain relationship curves of samples with different RCs under a confining stress of σ 3 = 100 kPa. It is demonstrated in Figure 5a that when RC = 0%, as the value of b increases, the curve becomes steeper and steeper and the tangential modulus and peak strength continue to increase. The samples show obvious strain softening during the shearing process, and the softening characteristics are more obvious as b increases. Figure 5b,c illustrate that when RC = 10% and RC = 30%, 0 ≤ b ≤ 0.4, and the sample does not show obvious strain softening; and when 0.6 ≤ b ≤ 1.0 in the test, strain softening appears, but the phenomenon of strain softening is not very significant. With the addition of rubber particles, the increase in b values leads to an increase in the peak deviatoric stress, and the sample gradually transitions from strain hardening to strain softening. This phenomenon may occur because rubber particles are less rigid than sand particles, and the material itself has high compression-rebound characteristics, so the deviator stress gradually increases with an increase in the medium principal stress. The addition of large rubber particles can also cause the samples to initially be dominated by large pores. With the loading and redistribution of small particles, the large pores are filled with sand particles, and the porosity ratio of the sample decreases and the strength increases.

3.1.2. Comparison of Internal Friction Angle Variation and Common Failure Criteria

Figure 6 shows the relationship between the peak internal friction angles of samples with different rubber contents and b values. The angle of internal friction is an index of soil stress intensity and is often used to measure material strength. The peak internal friction angle is defined as follows [30]:
φ b = arcsin ( σ 1 σ 3 σ 1 + σ 3 ) f
When the influence of intermediate principal stress is not considered, it is the same as the Mohr–Coulomb strength criterion. In order to compare and verify whether the true triaxial numerical model meets the requirements under equal stress path loading, the numerical simulation results when RC = 0% are compared with the indoor experimental results for pure sand of Shi Weicheng et al. [31] and Xu Chengshun et al. [32]. It can be seen from Figure 6 that the peak internal friction angle for the sample increases first and then decreases as the value of b increases. The peak point of the sample appears at b = 0.6. The overall trend is consistent with the results of the indoor experiment, thus verifying the feasibility of the discrete element model of RSM materials under different stress paths. When RC = 10% and RC = 30%, the peak points of the samples all appear at b = 0.8, which is different from the results of pure sand samples.
In recent years, many scholars have proposed three-dimensional failure criteria that consider the influence of intermediate principal stress, such as the modified Lade–Duncan criterion [33], SMP criterion [34], FKZ criterion [35] and DP criterion [36]. In order to verify whether the rubber–sand mixture meets the existing failure criteria, these four common failure criteria are used for comparative verification.
Figure 7 compares the numerical simulation results with these four commonly used failure criteria. As shown in Figure 7a, when RC = 0%, the results of the numerical simulation of the internal friction angle are basically consistent with the predicted results of the modified Lade–Duncan criterion and the SMP criterion, showing a trend of first increasing and then decreasing; at the same time, the FKZ criterion and the DP criterion are clearly not applicable. As shown in Figure 7b,c, for the medium-rubber-content RSM (RC = 10~30%), when 0 ≤ b ≤ 0.4, the simulation result is close to the SMP criterion result, and when 0.8 ≤ b ≤ 1.0, the simulation result is close to the modified Lade–Duncan criterion. When 0.4 < b < 0.8, the peak internal friction angle is larger than the that of the SMP criterion and smaller than that of the modified Lade–Duncan criterion, placing it between the two criteria. In summary, when considering the strength of large-particle rubber and sand mixtures, there is no existing failure criterion that can be fully expressed, and further research is needed.

3.2. Micro-Mechanical Response

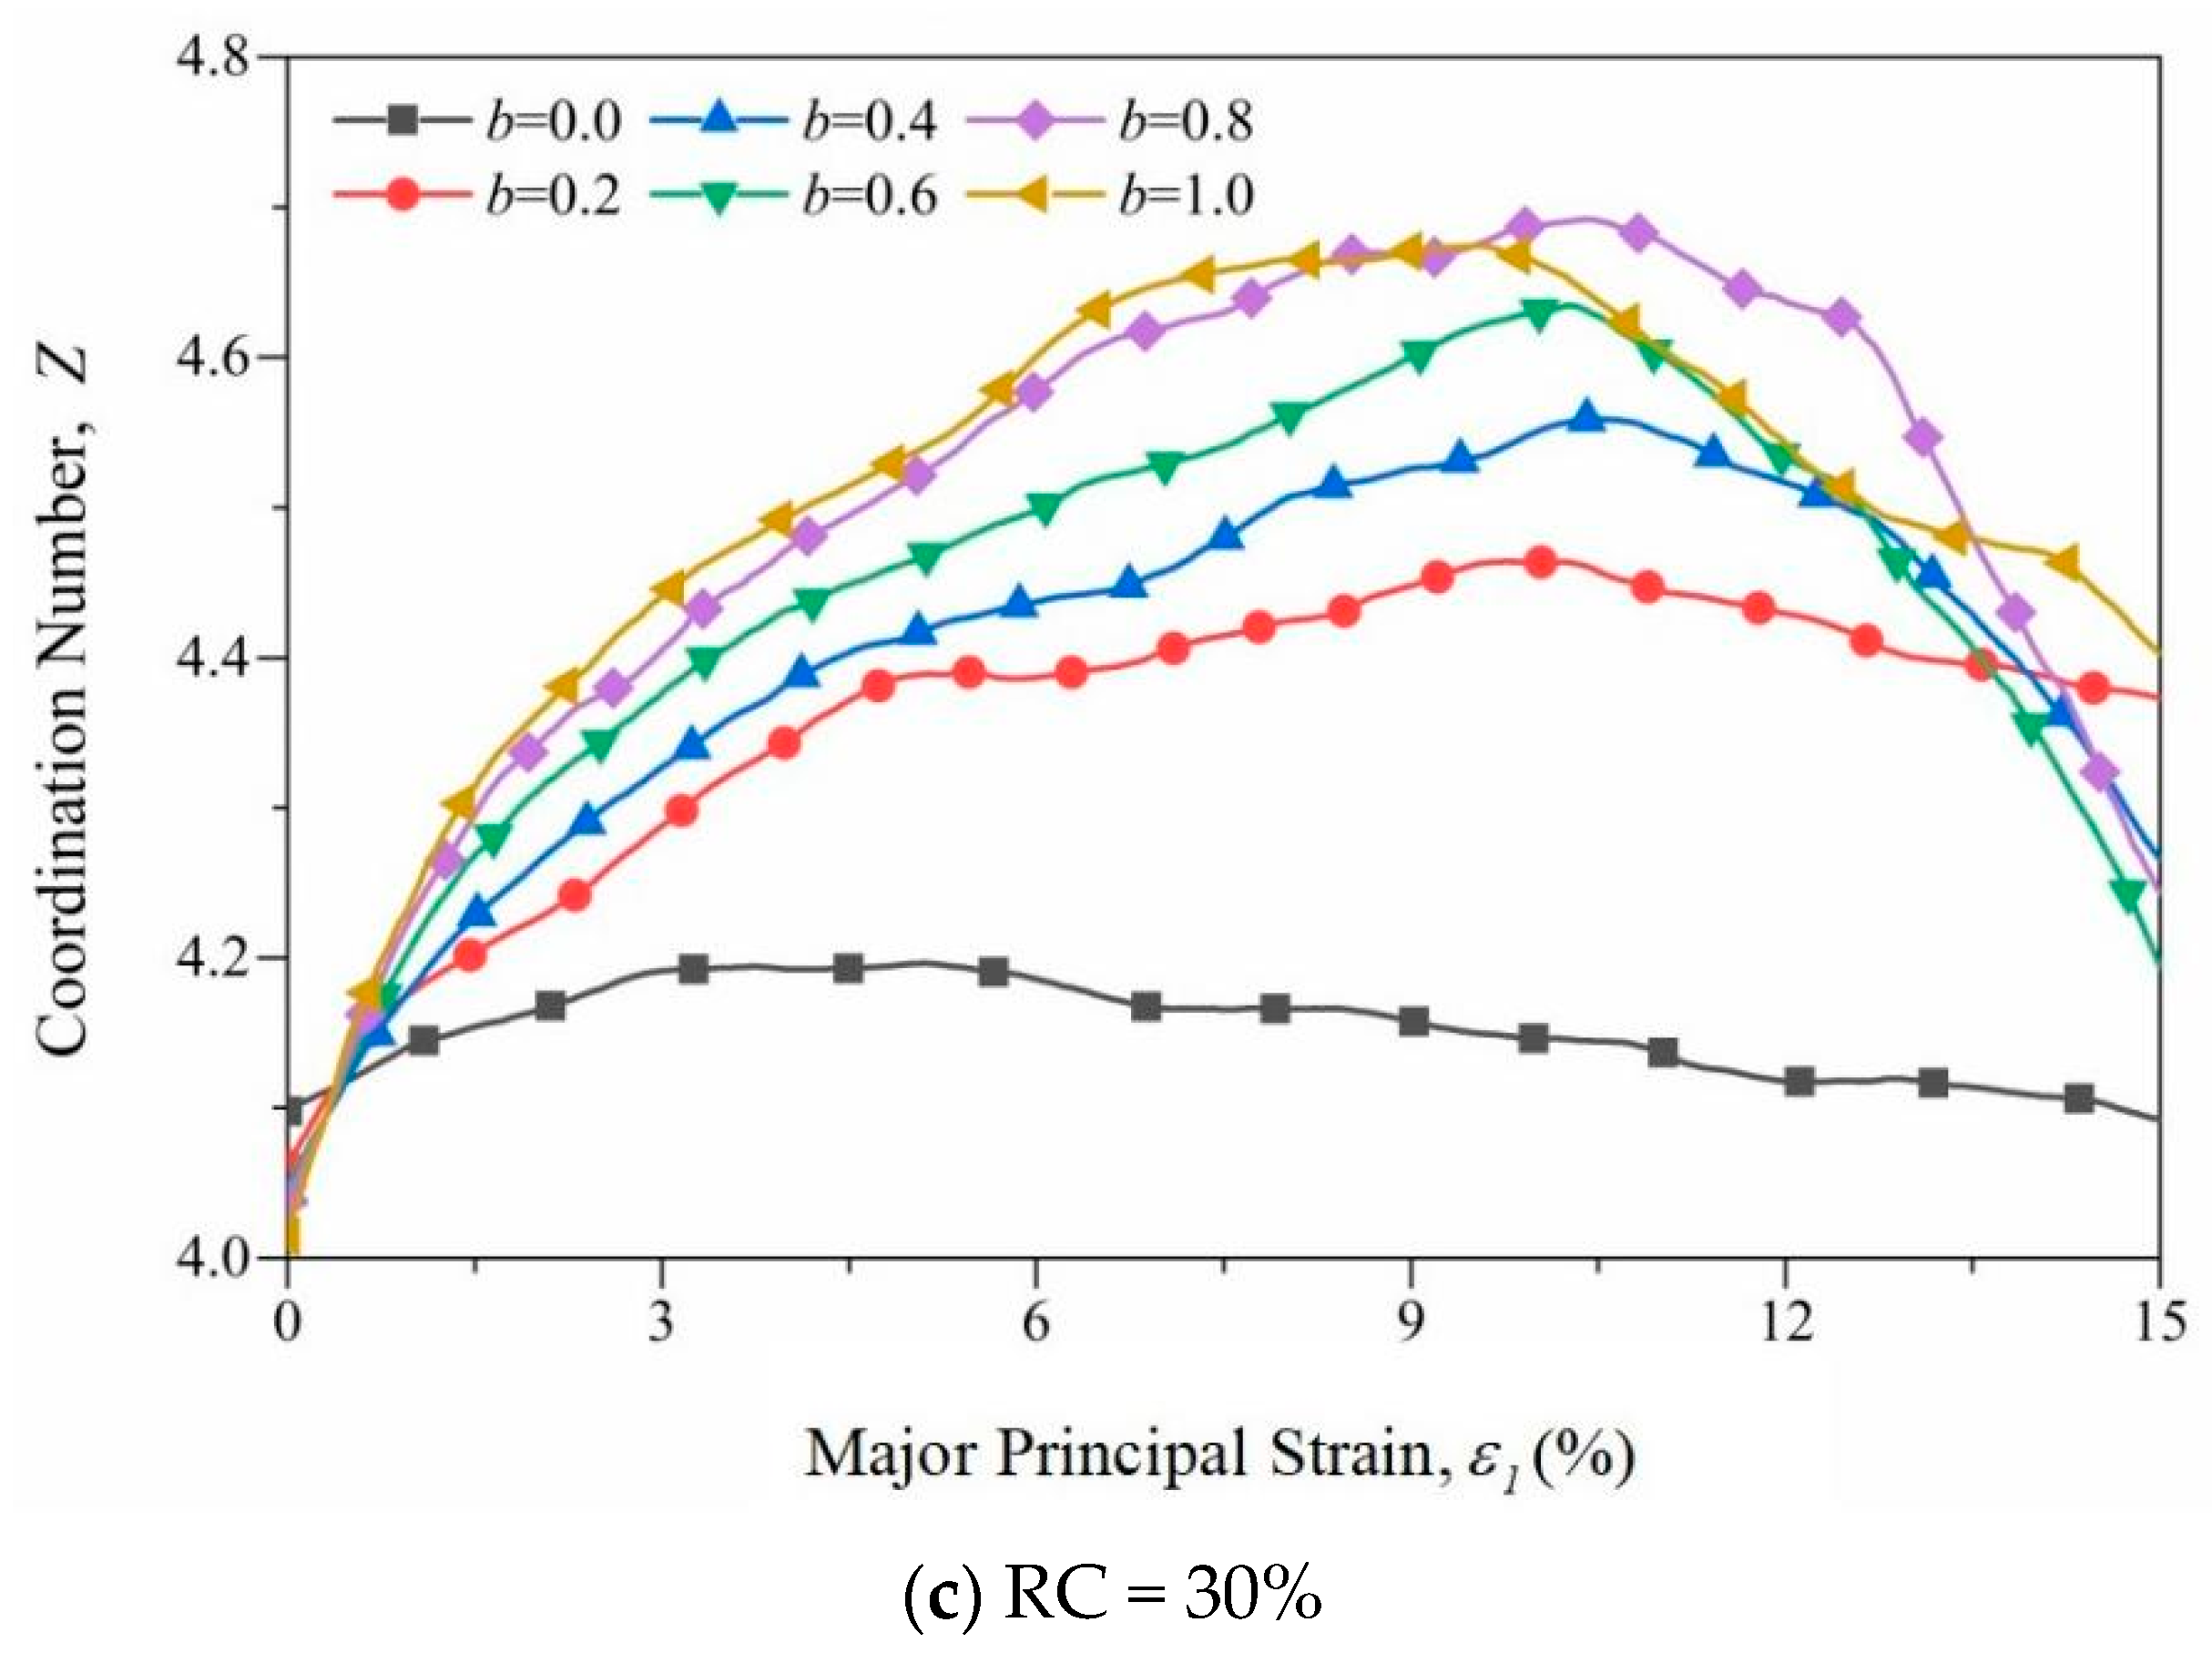
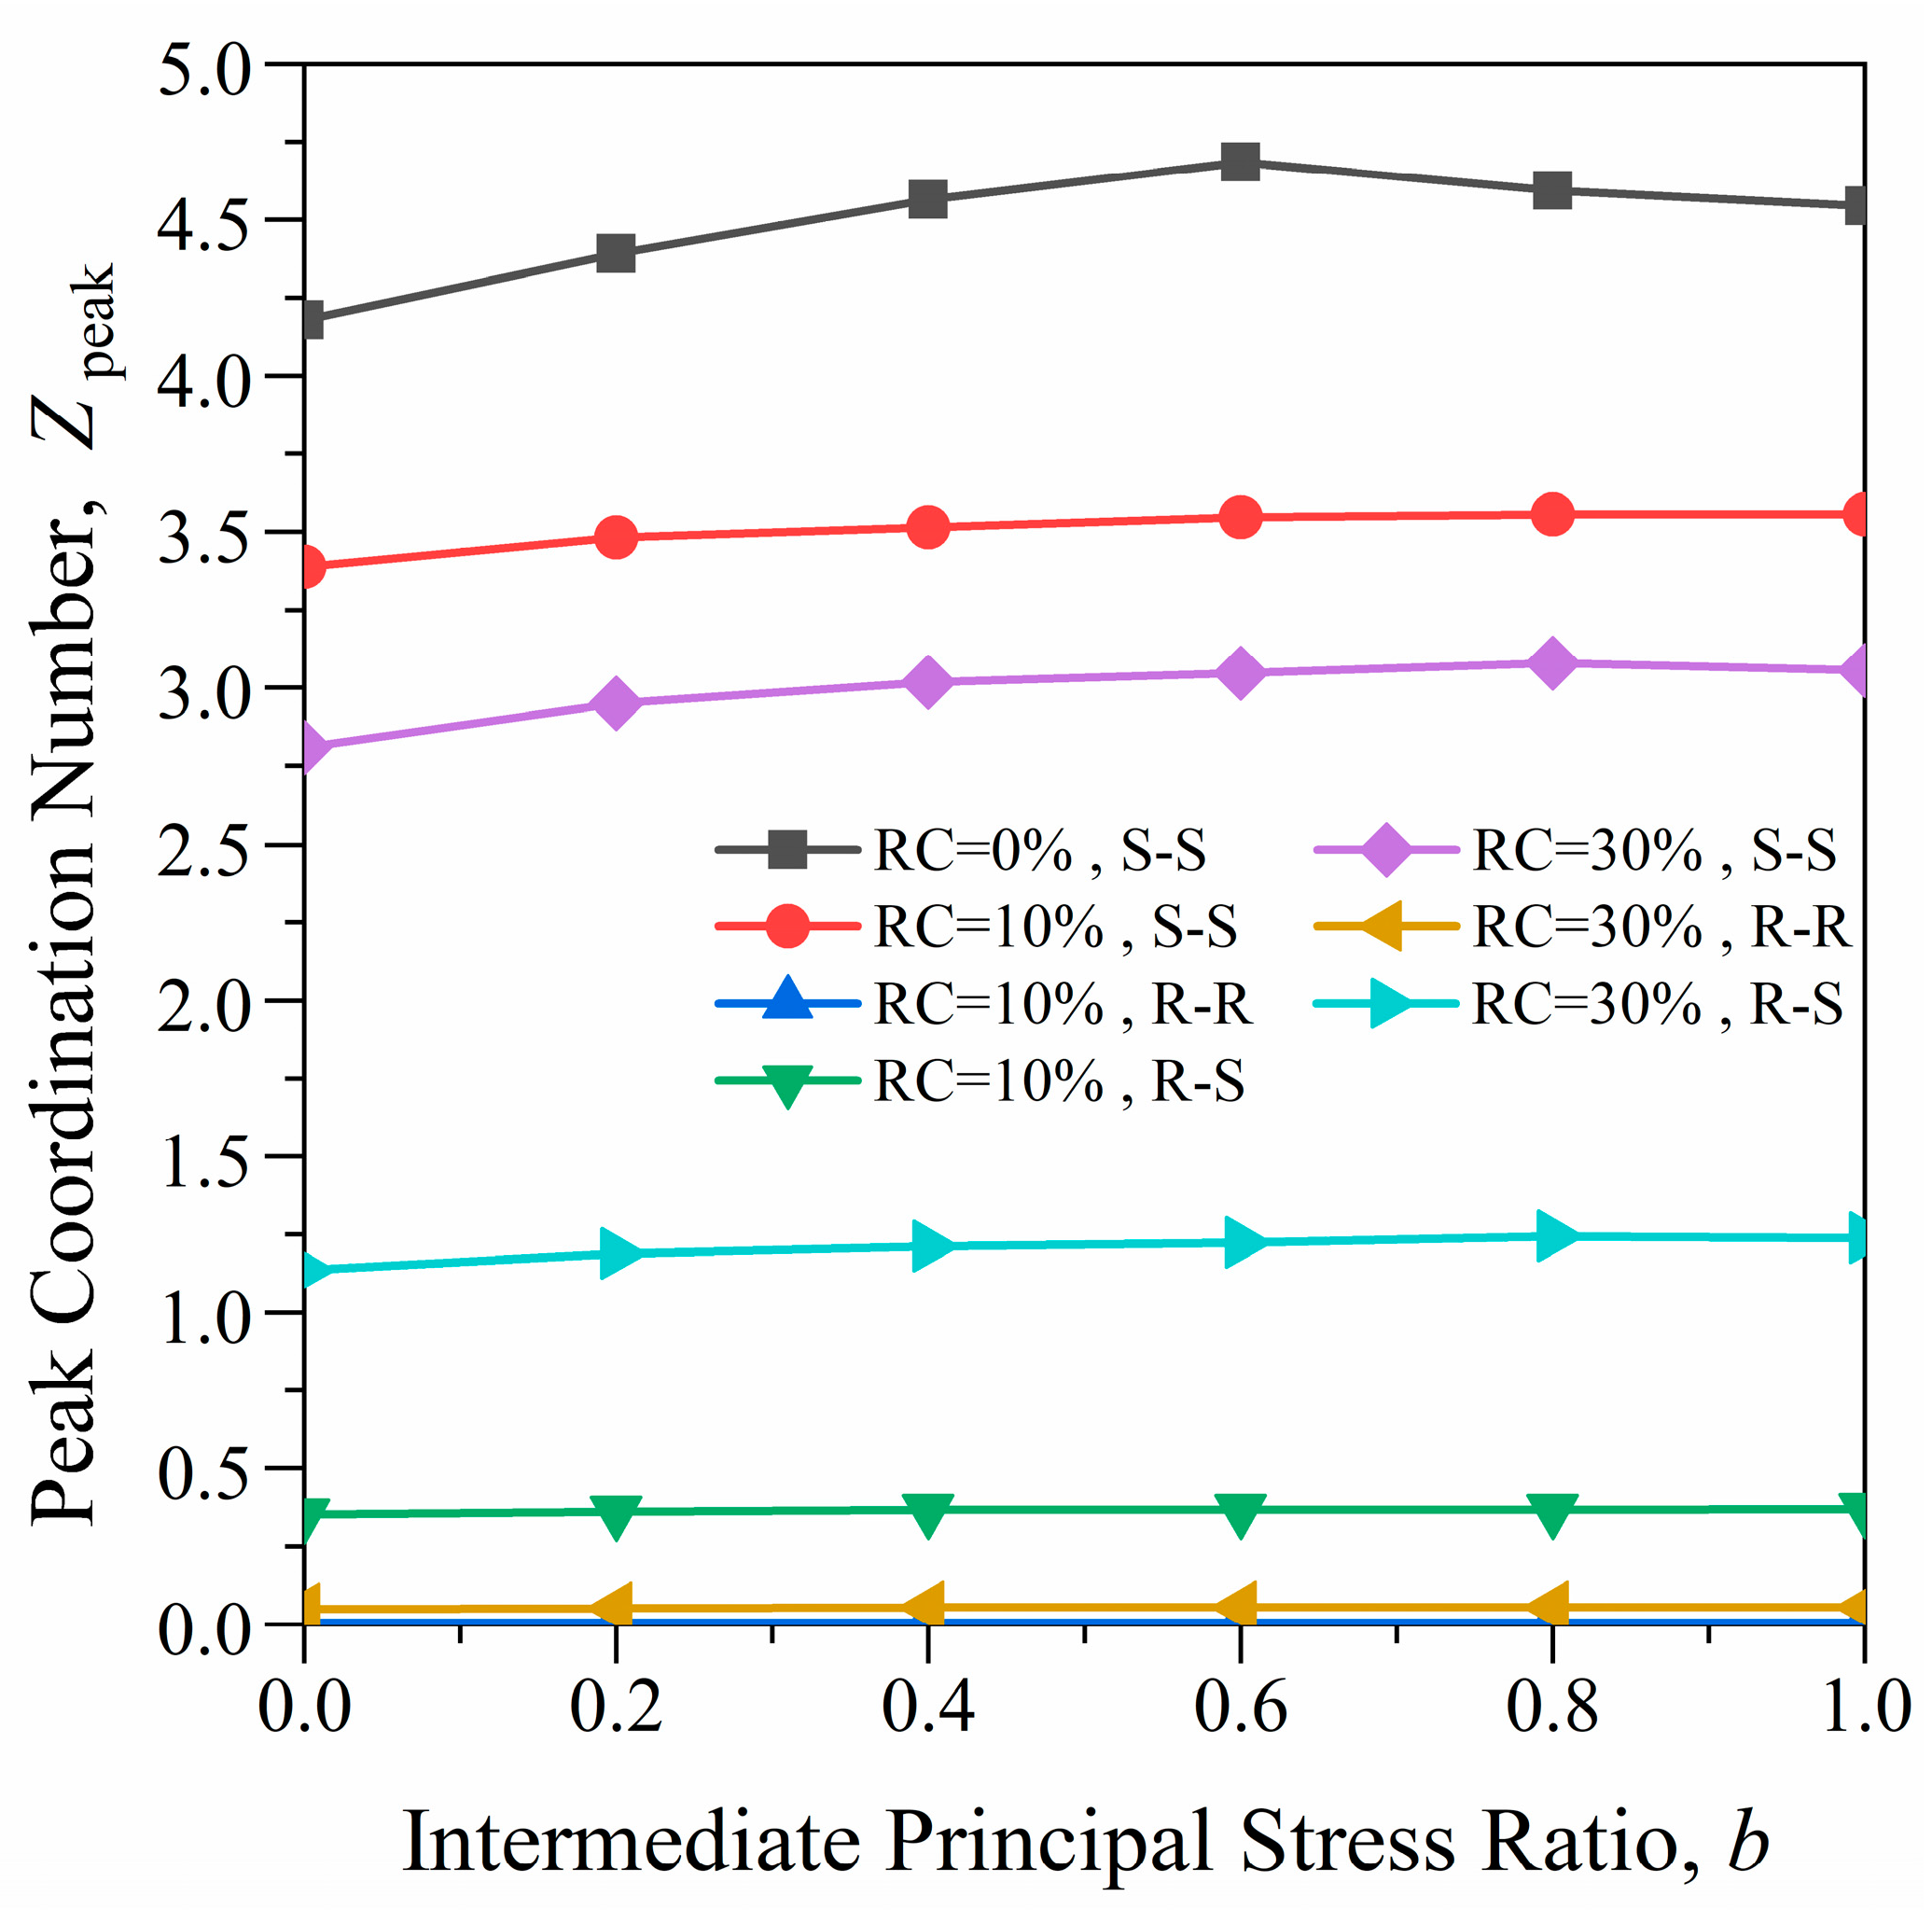
3.2.1. Coordination Number

At the microscopic level of discrete element numerical simulations, the coordination number is often used to quantify the average contact number of each particle in the sample, which is defined as
Z = 2 N c / N p
where N c is the number of contacts and N p is the number of particles. According to the research of Perez et al. [17,18,19], there are three different contact types of RSM (sand–sand contact, rubber–rubber contact and sand–rubber contact), and the coordination numbers can be defined according to these three kinds of contacts:
Z s s = 2 N c s s / N p s
Z r s = 2 N c r s / N p
Z r r = 2 N c r r / N p r
where N p s is the number of sand particles and is N p r the number of rubber particles. Since the different preparation methods of numerical simulation samples will have a certain impact on the coordination number, the same sample preparation method is used in this study, and the consistency of the samples may reduce the impact on the coordination number.
Figure 8 shows the change curve of the overall coordination number in the shearing process of samples with different RCs. Figure 8a shows that the coordination number of pure sand is 5.4 after isotropic consolidation. As the shear progresses, the coordination number Z gradually decreases to a stable value. For different intermediate principal stresses, as the value of b increases, the sample changes little at the initial stage of loading, and then increases, and its corresponding residual value is similar to the peak deviatoric stress. In Figure 8b,c, due to the addition of large rubber particles, the coordination number of the sample decreases significantly after isotropic consolidation. During the shearing process, it first increases and then decreases. The peak number of digits increases as the middle principal stress coefficient increases. Analyzing the reasons for the above phenomenon, when the RCs in the RSM are different, different pore states will appear in the sample, and with particle compression, climbing and rotation occur in the particle assembly during the shearing process, resulting in a change in pore volume and a coordination number change; the influence mechanism of intermediate principal stress in RSMs involves the large pores inside the sample occupying an absolute advantage. As the loading progresses, the large pores are first filled with smaller particles of smaller pores to make the sample denser. The homogenization process is not greatly affected by the ratio of intermediate principal stress.
Figure 9 shows the variation curve of peak coordination number with b value for different contact types. As shown in the figure, the peak coordination number is almost unaffected by the intermediate principal stress ratio. As RC increases, Z s s decreases, while Z r r and Z r s gradually increase. When RC = 10%, Z r r and Z r s are both less than 0.5, and Z s s is less than 3.5, indicating that the system is highly unstable.

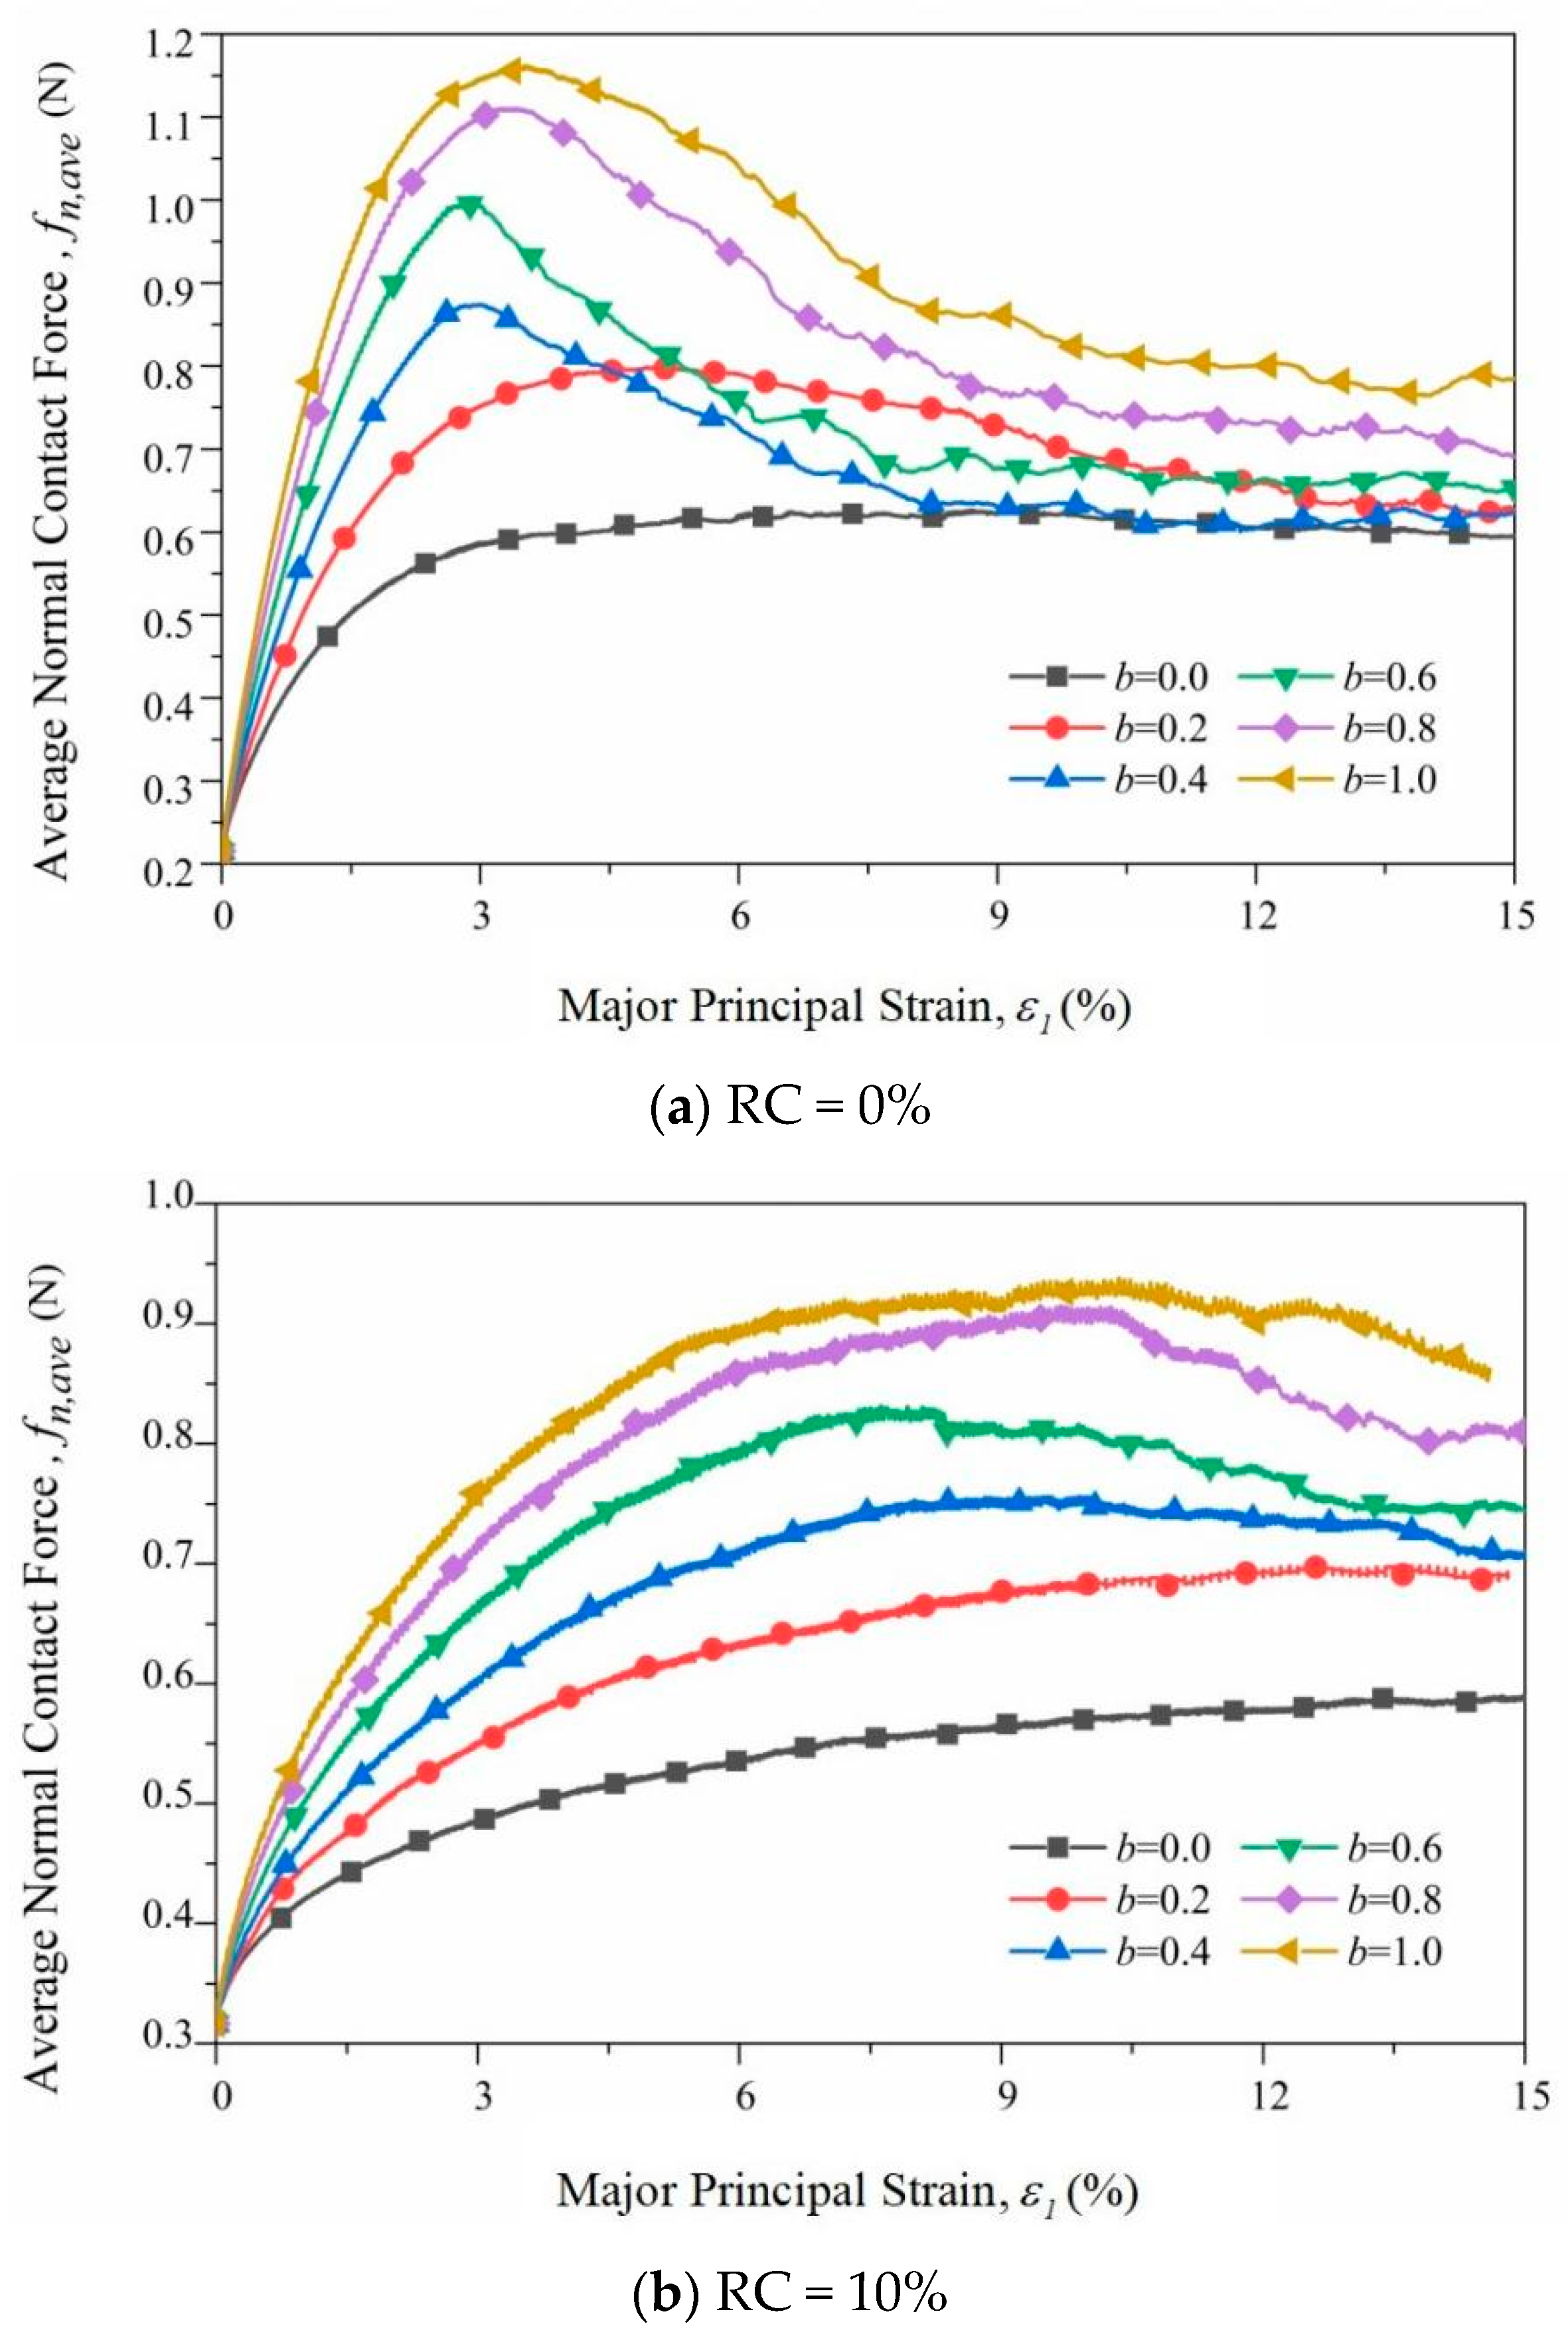
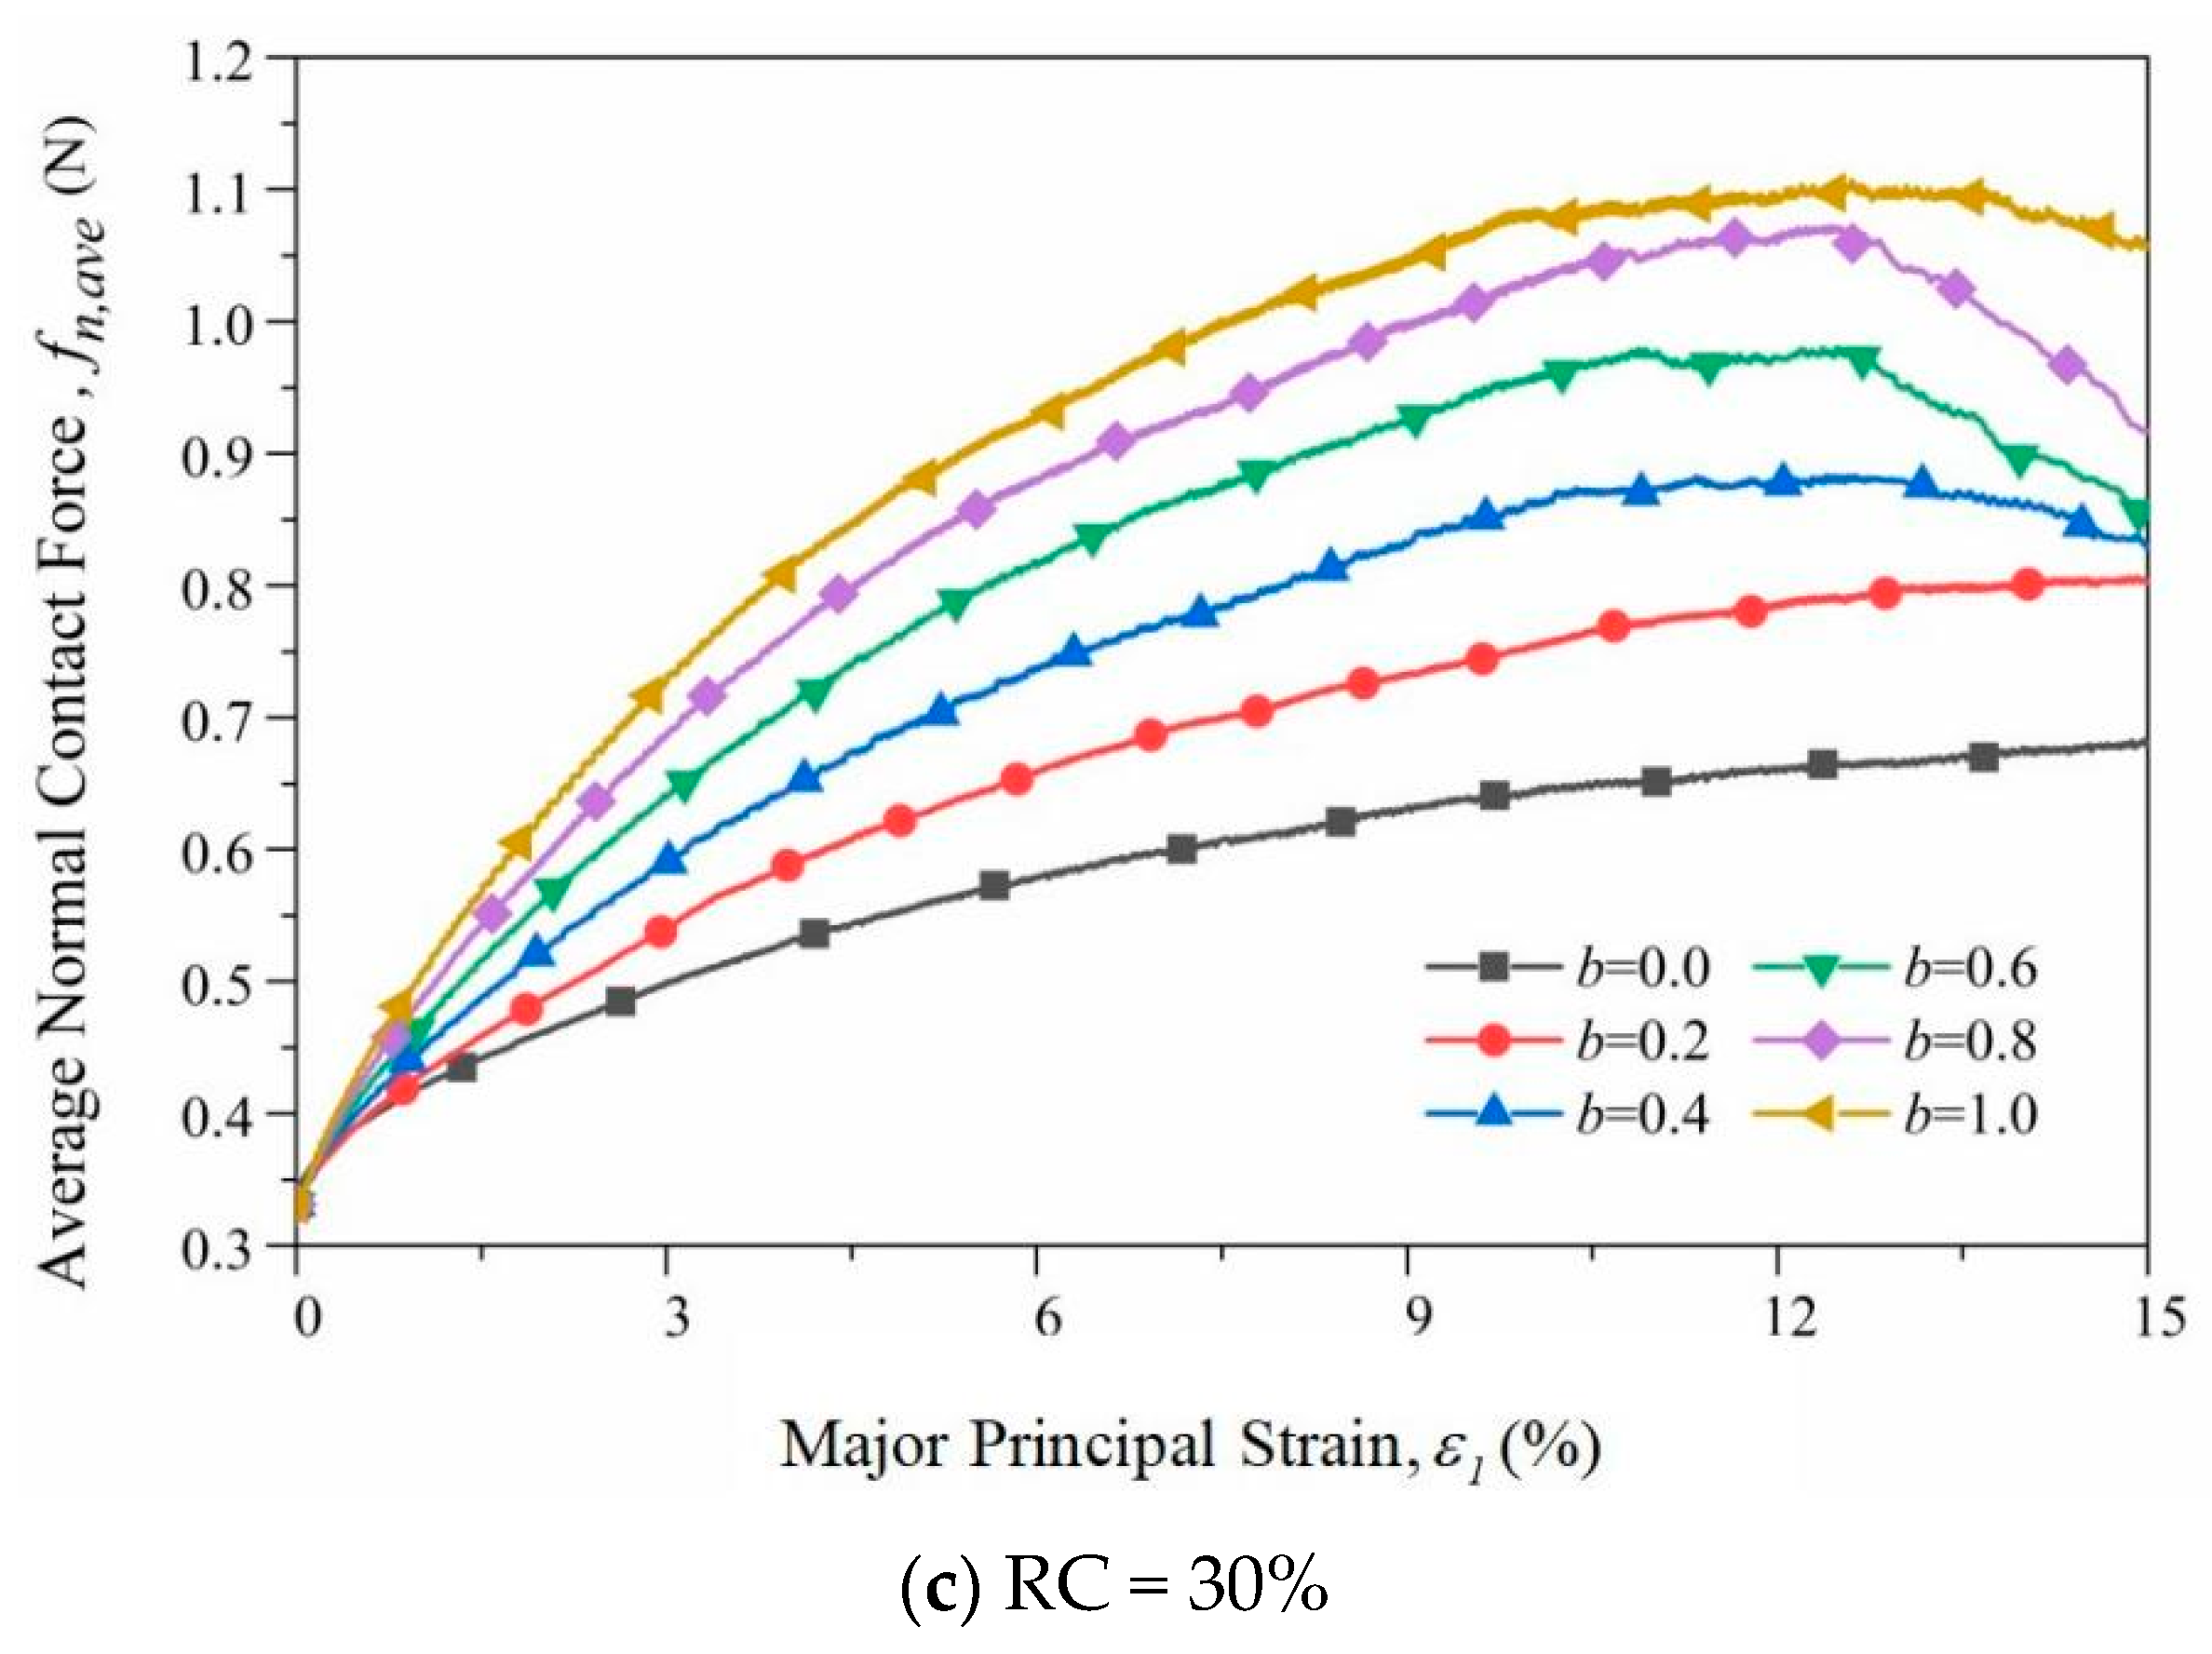
3.2.2. Normal Contact Force

Radjai et al. [37] showed that the average normal contact force between particles plays a major role in the external load. The average normal contact force in the numerical simulation represents the ratio of the sum of the normal contact force of all effective contacts to the number of contacts. Figure 10 shows the average normal contact force vs. the major principal strain of samples with different RCs. It can be seen from the figure that when RC = 0%, the average normal contact force first rapidly increases to the peak value and then gradually decreases to a stable value. As the intermediate principal stress increases, the average normal contact force also increases. With the addition of large rubber particles, when b > 0.4, the average normal contact force will appear similar to the “strain softening” phenomenon, while when b < 0.4, the average normal contact force increases with an increase in the axial strain. Figure 11 shows the curve of the peak deviatoric stress and the average normal contact force with the b values in the peak state. It can be seen that the average normal contact force exhibits a similar law to the peak deviatoric stress.

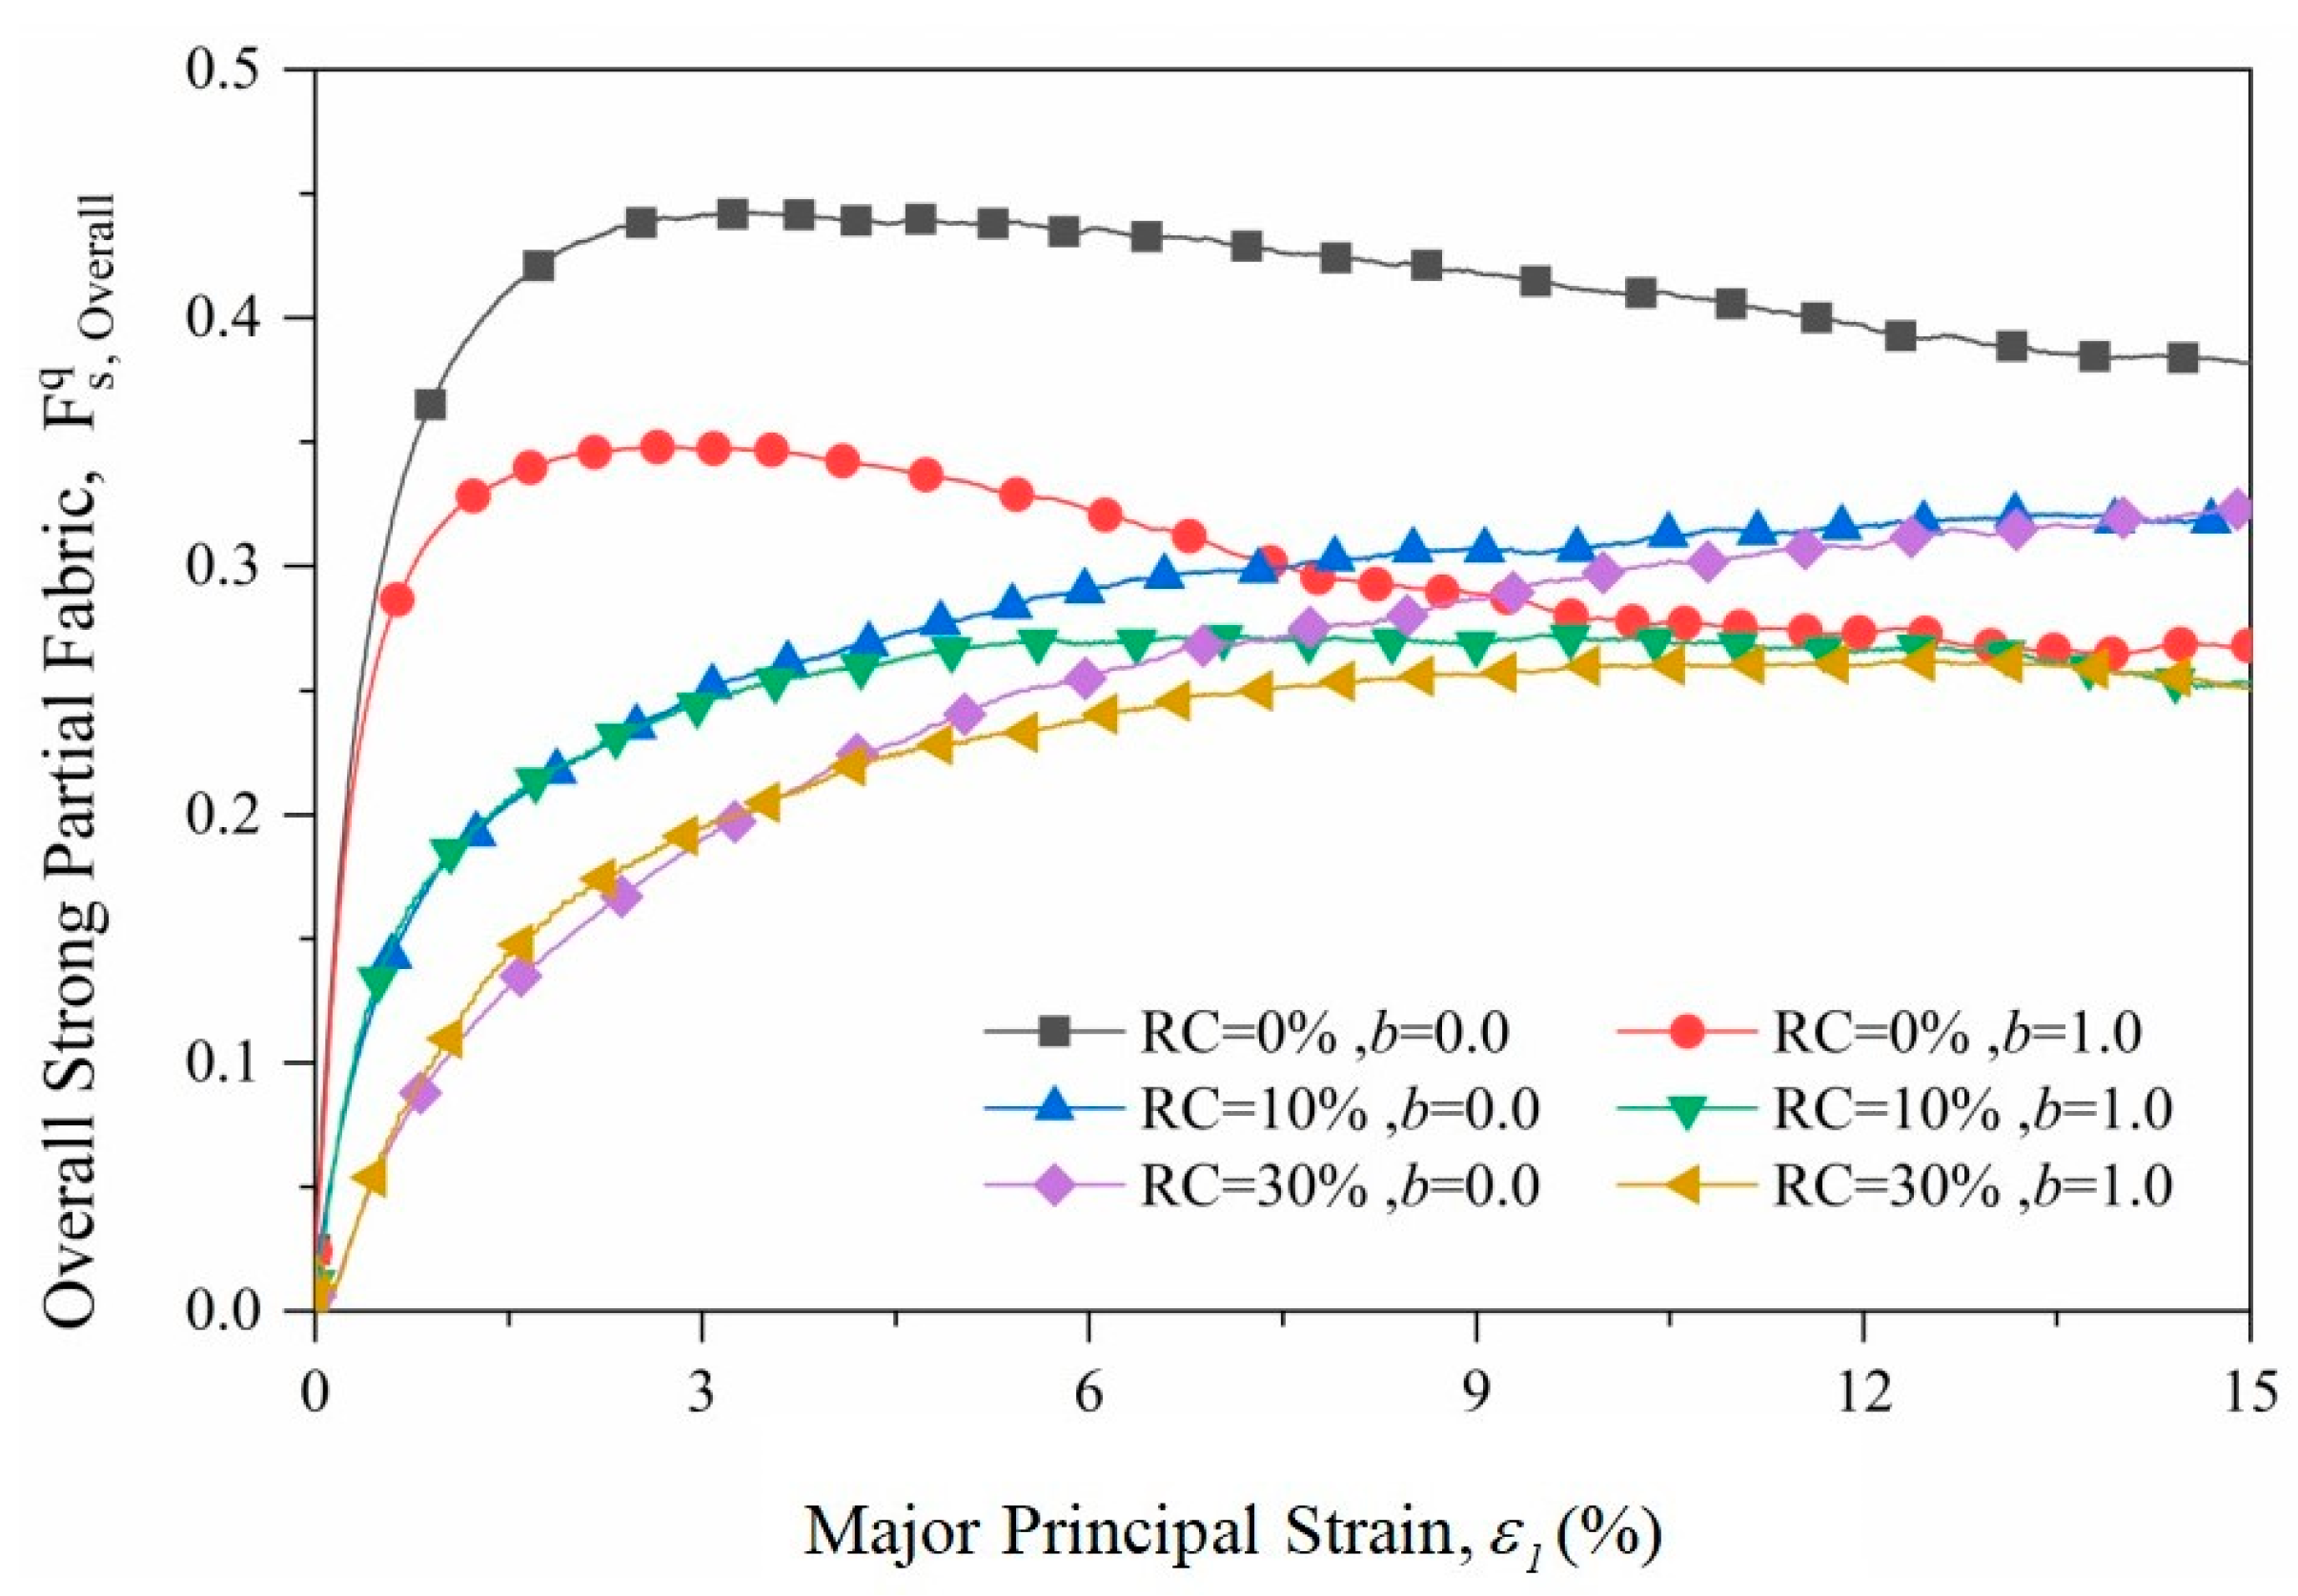
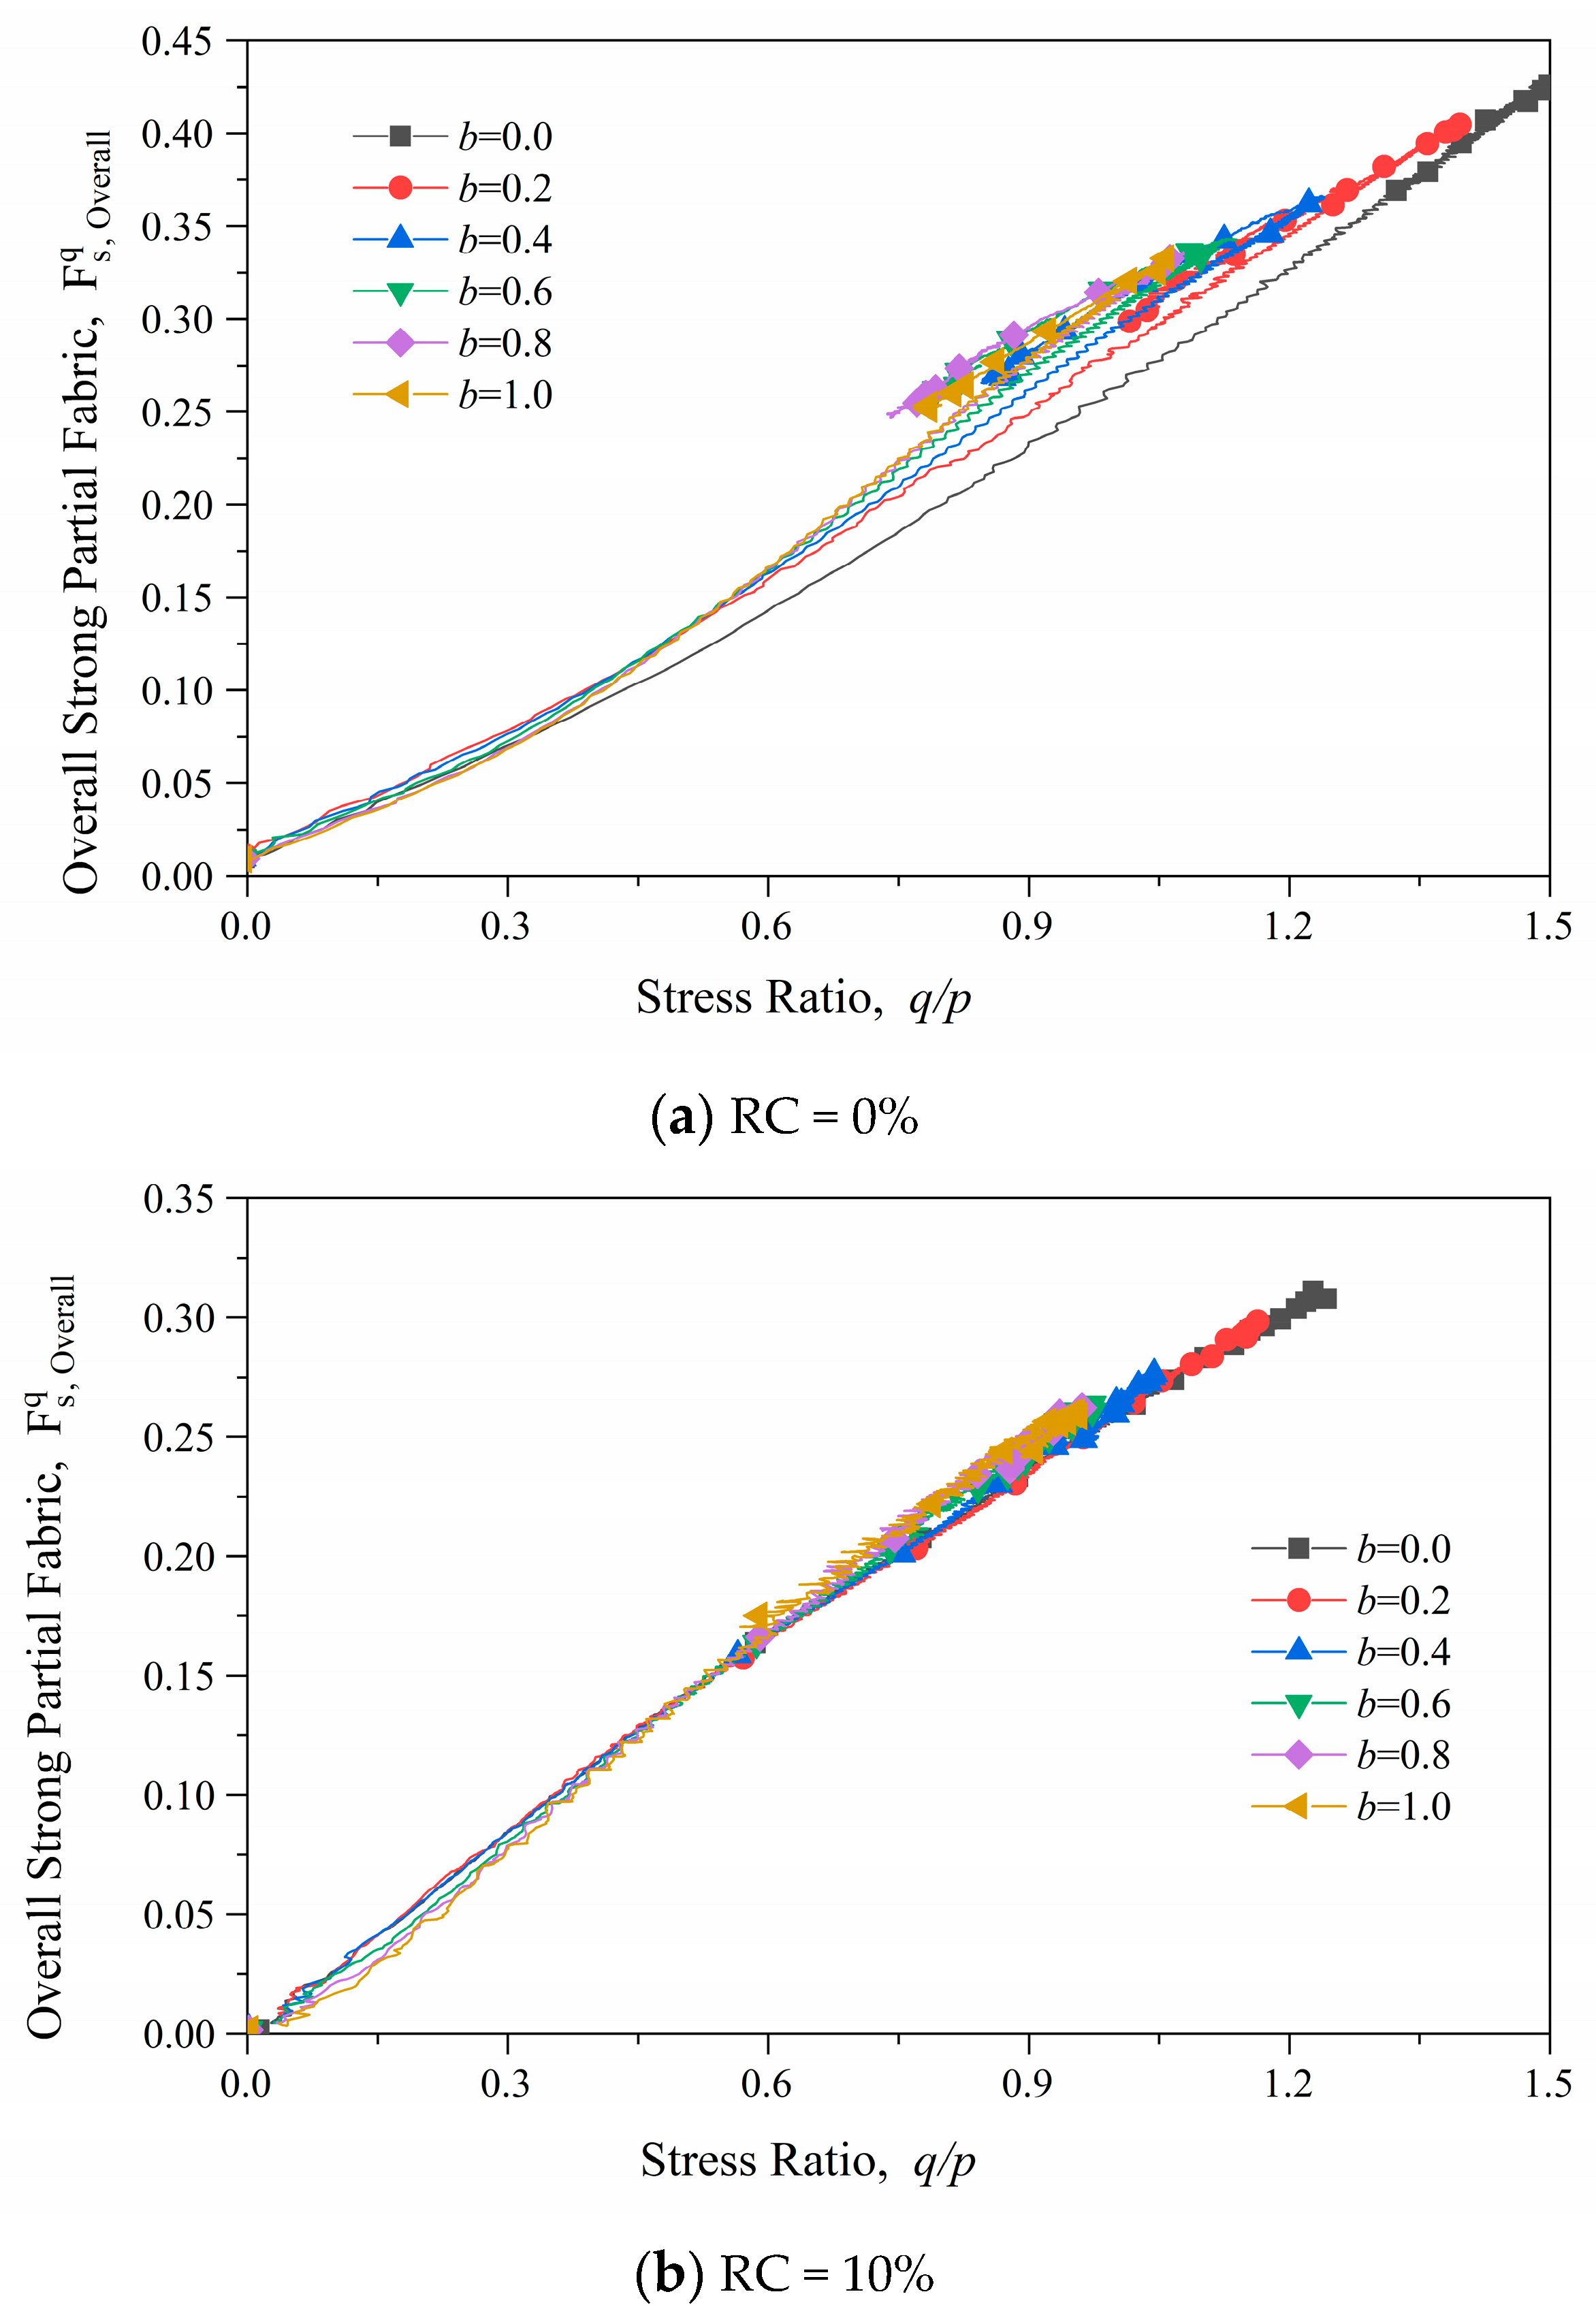
3.2.3. Fabric Anisotropy

In order to quantitatively describe the anisotropy of granular materials, Satake [38] introduced a calculation formula for fabric tensors:
F ij = 1 n c = 1 N n i c n j c
where F ij represents the components of the fabric tensor in different directions, N is the contact number, and n c is the unit normal contact vector upon contact c with i, j = 1, 2, 3.
Zhang et al. [39] used the concept of generalized deviatoric stress to quantitatively describe material anisotropy under true triaxial conditions, and adopted the second unbiased definition of a fabric tensor to define ‘generalized partial fabric (or fabric deviator)’.
F q = 1 2 ( F 11 F 22 ) 2 + ( F 22 F 33 ) 2 + ( F 11 F 33 ) 2
In this formula F 11 ,   F 22   a n d   F 33   are the three principal values of the fabric tensor—the major principal fabric; the mediate principal fabric; and the minor principal fabric—and F q is the partial fabric. Figure 12 shows the evolution of partial fabric of samples with different rubber contents under the loading paths of b = 0.0 and 1.0. The partial fabric increases rapidly and then slowly decreases during the shear process for pure sand samples, while for RSM materials, the partial fabric increases gradually to a stable value. It is also found that the differences between the RSM samples under b = 0.0 and b = 1.0 are much smaller than those of the pure sand samples. This means the pure sand samples have higher anisotropy than the RSM samples. And intermediate principal stress has less influence on the anisotropy of the RSM samples than on the pure sand samples. Figure 13 shows the relationship between the strong partial fabric and the stress ratio of samples with different RCs. It is shown in Figure 13 that the strong partial fabric of the rubber–sand sample has a linear relationship with the stress ratio. The linear relationship between the strong partial fabric and the stress ratio for a mixture of two separate soft and hard RSM materials with stiffness differences of 1000 times remains constant with an increase in RC. This phenomenon shows that despite variations in particle size distribution and particle stiffness, granular materials have an inherent linear relationship between the stress ratio and the partial fabric.

4. Conclusions

(1)
The intermediate principal stress ratio b has a significant impact on the strength of the RSM. As the intermediate principal stress coefficient b increases, the shear strength q gradually increases and the peak internal friction angle of the shear strength index first increases and then decreases. The addition of large rubber particles makes the strength greater than RC = 10% when RC = 30%, which is different from other rubber particles of similar particle size.
(2)
The failure behavior of RSM materials was compared with four widely used existing failure criteria. The results show that the relationship between the peak internal friction angle and the b value is basically consistent with the modified Lade–Duncan criterion. All the existing criteria cannot represent the failure behavior of RSM materials, and further research needs to be conducted to develop new failure criteria for mixture materials with components that possess very different properties.
(3)
When 0% < RC < 30%, the normal contact force plays a major role in the bearing of external loads, and it is consistent with the change law of the peak deviatoric stress.
(4)
The intermediate principal stress has a significant impact on the anisotropy of the system. However, despite variations in particle size distribution and particle stiffness, RSM materials have an inherent linear relationship between the stress ratio and the partial fabric.

Author Contributions

Conceptualization, Y.L. and X.G.; methodology, Y.L.; data curation, X.G. and L.Y.; formal analysis, X.G. and H.D.; validation, Z.C.; writing—original draft, X.G.; writing—review and editing, H.D., L.Y. and Z.C. All authors have read and agreed to the published version of the manuscript.

Funding

This research received no external funding.

Institutional Review Board Statement

Not applicable.

Informed Consent Statement

Not applicable.

Data Availability Statement

Data is contained within the article.

Conflicts of Interest

The authors declare no conflict of interest.

Nomenclature

DEMDiscrete element method
RSMRubber–sand mixture
RCRubber content
bIntermediate principal stress ratio
q p e a k Peak deviator stress
φ b Peak internal friction angle
σ c Confining pressure
σ 3 Small principal stress
ε 1 Major principal strain
f n Normal contact force
< f n > Average normal contact force

References

  1. Deng, A.; Feng, J.R. Experimental study on sand-shredded tire lightweight fills. Jianzhu Cailiao Xuebao/J. Build. Mater. 2010, 13, 116–120. [Google Scholar] [CrossRef]
  2. Tsiavos, A.; Alexander, N.A.; Diambra, A.; Ibraim, E.; Vardanega, P.J.; Gonzalez-Buelga, A.; Sextos, A. A Sand-Rubber Deformable Granular Layer as a Low-Cost Seismic Isolation Strategy in Developing Countries: Experimental Investigation. Soil Dyn. Earthq. Eng. 2019, 125, 105731. [Google Scholar] [CrossRef]
  3. Reddy, S.B.; Kumar, D.P.; Krishna, A.M. Evaluation of the Optimum Mixing Ratio of a Sand-Tire Chips Mixture for Geoengineering Applications. J. Mater. Civ. Eng. 2016, 28. [Google Scholar] [CrossRef]
  4. Pistolas, G.A.; Pitilakis, K.; Anastasiadis, A. A Numerical Investigation on the Seismic Isolation Potential of Rubber/Soil Mixtures. Earthq. Eng. Eng. Vib. 2020, 19, 683–704. [Google Scholar] [CrossRef]
  5. Bandyopadhyay, S.; Sengupta, A.; Reddy, G.R. Performance of Sand and Shredded Rubber Tire Mixture as a Natural Base Isolator for Earthquake Protection. Earthq. Eng. Eng. Vib. 2015, 14, 683–693. [Google Scholar] [CrossRef]
  6. Zhang, T.; Cai, G.; Liu, S.; Duan, W. Laboratory Observation of Engineering Properties and Deformation Mechanisms of Cemented Rubber-Sand Mixtures. Constr. Build. Mater. 2016, 120, 514–523. [Google Scholar] [CrossRef]
  7. Bernal-Sanchez, J.; McDougall, J.; Barreto, D. Experimental Assessment of Stiffness and Damping in Rubber-Sand Mixtures at Various Strain Levels. Earthquake Geotechnical Engineering for Protection and Development of Environment and Constructions—Silvestri & Moraci (Eds). 2019. Available online: https://www.researchgate.net/publication/333918931 (accessed on 17 January 2019).
  8. Youwai, S.; Bergado, D.T. Strength and Deformation Characteristics of Shredded Rubber Tire—Sand Mixtures. Can. Geotech. J. 2003, 40, 254–264. [Google Scholar] [CrossRef]
  9. Liu, F.; Zhang, Y.; Ren, D. Stress-strain characteristics of rubber-sand mixtures in united triaxial shear and simple shear tests. Rock Soil Mech. 2016, 37, 10. [Google Scholar] [CrossRef]
  10. Das, S.; Bhowmik, D. Dynamic Behaviour of Sand-Crumbed Rubber Mixture at Low Strain Level. Geotech. Geol. Eng. 2020, 38, 6611–6622. [Google Scholar] [CrossRef]
  11. Shariatmadari, N.; Karimpour-Fard, M.; Shargh, A. An Experimental Investigation of Liquefaction Resistance of Sand–Ground Rubber Mixtures. Iran. J. Sci. Technol. Trans. Civ. Eng. 2018, 42, 217–230. [Google Scholar] [CrossRef]
  12. Cheng, Z.; Wang, J.; Li, W. The Micro-Mechanical Behaviour of Sand–Rubber Mixtures under Shear: An Experimental Study Based on X-ray Micro-Tomography. Soils Found. 2020, 60, 1251–1268. [Google Scholar] [CrossRef]
  13. Fu, R.; Coop, M.R.; Li, X.Q. Influence of Particle Type on the Mechanics of Sand–Rubber Mixtures. J. Geotech. Geoenviron. Eng. 2017, 143. [Google Scholar] [CrossRef]
  14. Nakhaei, A.; Marandi, S.; Kermani, S.S.; Bagheripour, M. Dynamic Properties of Granular Soils Mixed with Granulated Rubber. Soil Dyn. Earthq. Eng. 2012, 43, 124–132. [Google Scholar] [CrossRef]
  15. Ehsani, M.; Shariatmadari, N.; Mirhosseini, S.M. Shear Modulus and Damping Ratio of Sand-Granulated Rubber Mixtures. J. Central South Univ. 2015, 22, 3159–3167. [Google Scholar] [CrossRef]
  16. Madhusudhan, B.R.; Boominathan, A.; Banerjee, S. Static and Large-Strain Dynamic Properties of Sand–Rubber Tire Shred Mixtures. J. Mater. Civ. Eng. 2017, 29. [Google Scholar] [CrossRef]
  17. Perez, J.L.; Kwok, C.; Senetakis, K. Micromechanical Analyses of the Effect of Rubber Size and Content on Sand-Rubber Mixtures at the Critical State. Geotext. Geomembr. 2017, 45, 81–97. [Google Scholar] [CrossRef]
  18. Perez, J.L.; Kwok, C.; Senetakis, K. Effect of Rubber Size on the Behaviour of Sand-Rubber Mixtures: A Numerical Investigation. Comput. Geotech. 2016, 80, 199–214. [Google Scholar] [CrossRef]
  19. Perez, J.C.L.; Kwok, C.Y.; Senetakis, K.; Javankhoshdel, S.; Bathurst, R.J.; Cardile, G.; Moraci, N.; Pisano, M.; O’Sullivan, C.; Huang, X.; et al. Investigation of the Micro-Mechanics of Sand–Rubber Mixtures at Very Small Strains. Geosynth. Int. 2017, 24, 30–44. [Google Scholar] [CrossRef]
  20. Anastasiadis, A.; Senetakis, K.; Pitilakis, K. Small-Strain Shear Modulus and Damping Ratio of Sand-Rubber and Gravel-Rubber Mixtures. Geotech. Geol. Eng. 2011, 30, 363–382. [Google Scholar] [CrossRef]
  21. Pistolas, G.A.; Anastasiadis, A.; Pitilakis, K. Dynamic Behaviour of Granular Soil Materials Mixed with Granulated Rubber: Effect of Rubber Content and Granularity on the Small-Strain Shear Modulus and Damping Ratio. Geotech. Geol. Eng. 2018, 36, 1267–1281. [Google Scholar] [CrossRef]
  22. Gong, L.; Nie, L.; Xu, Y.; Wang, H.; Zhang, T.; Du, C.; Wang, Y. Discrete Element Modelling of the Mechanical Behaviour of a Sand-Rubber Mixture Containing Large Rubber Particles. Constr. Build. Mater. 2019, 205, 574–585. [Google Scholar] [CrossRef]
  23. Jiang, M. New paradigm for modern soil mechanics: Geomechanics from micro to macro. Chin. J. Geotech. Eng. 2019, 41, 195–254. [Google Scholar] [CrossRef]
  24. Iwashita, K.; Oda, M. Rolling resistance at contacts in simulation of shear band development by DEM. J. Eng. Mech. 1998, 124, 285–292. [Google Scholar] [CrossRef]
  25. Jiang, M.; Shen, Z.; Wang, J. A Novel Three-Dimensional Contact Model for Granulates Incorporating Rolling and Twisting Resistances. Comput. Geotech. 2015, 65, 147–163. [Google Scholar] [CrossRef]
  26. Shi, C.; Zhang, Q.; Wang, S. Numerical Simulation Technology and Application with Particle Flow Code(PFC5.0). Rock Soil Mech. 2018, 39, 36. [Google Scholar]
  27. Xu, C.S.; Luan, M.T.; He, Y. Effect of intermediate principal stress on undrained behavior of saturated loose sands under monotonic shearing. Yantu Lixue (Rock Soil Mech.) 2006, 689–693. [Google Scholar] [CrossRef]
  28. Liu, F.; Wu, M.; Wang, H. Effect of particle size ratio and mix ratio on mechanical behavior of rubber-sand mixtures. J. Eng. Geol. 2019, 27, 376–389. [Google Scholar] [CrossRef]
  29. Wang, C.; Deng, A.; Taheri, A. Three-dimensional discrete element modeling of direct shear test for granular rubber–sand. Comput. Geotech. 2018, 97, 204–216. [Google Scholar] [CrossRef]
  30. Zhao, X.; Evans, T.M. Numerical analysis of critical state behaviors of granular soils under different loading conditions. Granul. Matter 2011, 13, 751–764. [Google Scholar] [CrossRef]
  31. Shi, W.; Zhu, J.; Liu, H. Influence of intermediate principal stress on deformation and strength of gravel. Chin. J. Geotech. Eng. 2008, 30, 1449–1453. [Google Scholar]
  32. Xu, C. Experimental Study on Shear Behavior and Constitutive Model of Saturated Sands under Complex Stress Loading; Dalian University of Technology: Dalian, China, 2006. [Google Scholar]
  33. Lade, P.V.; Duncan, J.M. Elastoplastic stress-strain theory for cohesionless soil. J. Geotech. Eng. Div. 1975, 101, 1037–1053. [Google Scholar] [CrossRef]
  34. Nakai, T.; Matsuoka, H.; Okuno, N.; Tsuzuki, K. True triaxial tests on normally consolidated clay and analysis of the observed shear behavior using elastoplastic constitutive models. Soils Found. 1986, 26, 67–78. [Google Scholar] [CrossRef] [PubMed]
  35. Kaize, F. Failure Criterion of Soil—Influence of Intermediate Principal Stress. J. East China Tech Univ. Water Resour. 1986, 14, 71–81. [Google Scholar]
  36. Yin, Z. Principle of Soil Mechanics; Water Power Press: Beijing, China, 2007. (In Chinese) [Google Scholar]
  37. Radjai, F.; Wolf, D.E.; Jean, M.; Moreau, J.-J. Bimodal character of stress transmission in granular packings. Phys. Rev. Lett. 1998, 80, 61–64. [Google Scholar] [CrossRef]
  38. Satake, M. Fabric tensor in granular materials. In Proceedings of the IUTAM-Conference on Deformation and Failure of Granular Materials, Delft, The Netherlands, 31 August–3 September 1982; pp. 63–68. Available online: https://api.semanticscholar.org/CorpusID:136060027 (accessed on 13 April 2024).
  39. Yang, L.; Chang, C.S.; Duo, Z. Analytical solution of stress-fabric relationship and failure of granular materials in three dimensions. Chin. J. Geotech. Eng. 2014, 36, 401–408. [Google Scholar] [CrossRef]
Figure 1. A diagram of the rolling resistance model.
Applsci 14 04560 g001
Figure 2. Particle size distribution of SRM materials and numerical model.
Applsci 14 04560 g002
Figure 3. Numerical true triaxial model of rubber–sand mixtures with RC = 10%.
Applsci 14 04560 g003
Figure 4. Comparisons of the stress–strain curves between the laboratory experiments and the discrete element simulations: (a) 0%; (b) 10%; and (c) 30%.
Applsci 14 04560 g004aApplsci 14 04560 g004b
Figure 5. Stress–strain behavior of rubber–sand mixtures with rubber contents of (a) 10%, (b) 10% and (c) 30%.
Applsci 14 04560 g005
Figure 6. Relationship between the peak internal friction angles and b values.
Applsci 14 04560 g006
Figure 7. Comparisons of the peak internal friction angles with the four common strength criteria of samples with different rubber contents: (a) 0%; (b) 10%; and (c) 30%.
Applsci 14 04560 g007aApplsci 14 04560 g007b
Figure 8. The evolution of coordination number versus major principal strain for samples with various RCs: (a) 0%; (b) 10%; and (c) 30%.
Applsci 14 04560 g008aApplsci 14 04560 g008b
Figure 9. The relationship between the peak coordination number and the internal principal stress ratio b.
Applsci 14 04560 g009
Figure 10. The evolution of the average normal contact force versus major principal strain for samples with various RCs: (a) RC = 0%; (b) RC = 10%; and (c) RC = 30%.
Applsci 14 04560 g010aApplsci 14 04560 g010b
Figure 11. Curve of average normal contact force at peak state versus b value. (a) Relationship between peak deviator stress and b value. (b) Relationship between average normal contact force in peak state and b value.
Applsci 14 04560 g011
Figure 12. Variation curve of strong partial fabric with major principal strain.
Applsci 14 04560 g012
Figure 13. The relationship between the strong deviatoric fabric and the stress ratio of samples with (a) RC = 0%; (b) RC = 10%; and (c) RC = 30%.
Applsci 14 04560 g013aApplsci 14 04560 g013b
Table 1. Rubber–sand parameters reference table.
Reference2D or 3DContact Constitutive ModelNormal Stiffness k n / ( N / m )
(Rubber/
Sand)
Tangential Stiffness k s / ( N / m )
(Rubber/
Sand)
Initial Shear Modulus E / P a
(Rubber/
Sand)
Poisson’s Ratio λ
(Rubber/
Sand)
Friction Coefficient μ
(Rubber/Sand)
Rolling
Resistance Coefficient μ r
(Rubber/Sand)
Liu et al. [28]2DLinear1.5 × 105/1.5 × 1081.5 × 105/1.5 × 1081.0/0.5
Wang et al. [29]3DLinear8.0 × 105/5.9 × 1078.0 × 105/5.9 × 1070.60/0.55
Perez et al. [17,18,19]3DHertz1.2 × 107/8 × 1090.45/0.121.0/0.25
Gong et al. [22]3DRolling resistance1.0 × 103/emod-8 × 1071.0× 103/emod-8 × 1071.5/0.25—/0.25
Table 2. Material parameters of rubber–sand.
Particle TypeMaterial ParametersValue
SandDensity ρ / ( k g / m 3 ) 2620
Radius r / m m 2~2.5
Number N / - 43,693, 34,909, 18,995
Damping0.7
Friction coefficient μ 0.35
RubberDensity ρ / ( k g / m 3 ) 1330
rmin  r / m m
rmax/rmin
0.5
2.0
Number N / - 0, 299, 631
Damping0.7
Friction coefficient μ 1.0
Table 3. Contact micro-parameters of RSM.
Contact TypeMicro-ParametersValue
Sand–SandEffective modulus E / P a 1.0 × 10⁸
Stiffness ratio k n / k s 1.0
Friction coefficient μ 0.335
Rolling resistance coefficient μ r 0.35
Rubber–RubberNormal stiffness k n / ( N / m ) 3.5 × 10⁴
Tangential stiffness k s / ( N / m ) 3.5 × 10⁴
Friction coefficient μ 1.5
Rolling resistance coefficient μ r 1.0
Sand–RubberEffective modulus E / P a 8.0 × 10⁶
Stiffness ratio k n / k s 1.0
Friction coefficient μ 1.0
Rolling resistance coefficient μ r 0.5
Particle–WallEffective modulus E / P a 1.0 × 10⁸
Stiffness ratio k n / k s 1.0
Friction coefficient μ 0.0
Disclaimer/Publisher’s Note: The statements, opinions and data contained in all publications are solely those of the individual author(s) and contributor(s) and not of MDPI and/or the editor(s). MDPI and/or the editor(s) disclaim responsibility for any injury to people or property resulting from any ideas, methods, instructions or products referred to in the content.

