Article

A New Method for Detecting Weld Stability Based on Color Digital Holography

1
Faculty of Science, Kunming University of Science and Technology, Kunming 650500, China
2
Faculty of Civil Aviation and Aeronautics, Kunming University of Science and Technology, Kunming 650500, China
3
Yunnan Key Laboratory of Disaster Reduction in Civil Engineering, Kunming 650500, China
4
Faculty of Electromechanical Engineering, Kunming University of Science and Technology, Kunming 650500, China
*
Author to whom correspondence should be addressed.
Appl. Sci. 2024, 14(11), 4582; https://doi.org/10.3390/app14114582
Submission received: 19 March 2024 / Revised: 19 May 2024 / Accepted: 23 May 2024 / Published: 27 May 2024

Abstract

:
Weld stability is directly related to the safety and reliability of engineering, and continuous improvement of its detection technology has great research significance. This paper presents a novel method for weld stability detection based on color digital holography. A color digital holography optical path was designed to capture the holograms of welds under varying loads. Several common denoising algorithms were used to deal with speckle noise in the wrapped phase, among which the 4-f optical simulation integrated cycle-consistent generative adversarial network (4f-CycleGAN) denoising algorithm based on deep learning was more suitable for the color digital holographic detection system. The three-dimensional deformation fields of three samples (lap-jointed, butt-jointed, and defective butt-jointed aluminum alloy plates) under different loads were calculated. The center profile of the deformation field in the direction of load and holographic reconstruction images are used to determine the position of the weld. The coefficient of variation near the weld was used to evaluate the weld stability. The coefficient of variation for lap-jointed, butt-jointed and defective butt-jointed plates are 0.0335 (<0.36, good stability), 0.1240 (<0.36, good stability) and 0.3965 (>0.36, poor stability), respectively. The research results of this paper provide a new strategy for detecting weld stability.

1. Introduction

With the booming development of the manufacturing industry, welding, as a common permanent connection method, is widely used in fields such as construction [1], bridges [2,3], aerospace [4,5,6], etc. During the welding process, changes in many factors can have an impact on the formation of welds, thereby affecting welding quality and product performance. The weld stability is directly related to the safety and reliability of engineering, so the study of weld stability detection is of great research significance.
At present, the testing methods for welding quality can be divided into two categories: destructive testing [7,8,9] and non-destructive testing. Destructive tests include tensile tests, bending tests, and impact tests. In practical testing, destructive testing methods are widely used due to their low cost, but these methods can cause irreversible damage to the tested object and cannot measure the weld stability of the workpiece in service. Therefore, it cannot provide extensive, long-term, and stable testing for low-yield, high-cost, and structurally complex objects. Non-destructive testing methods include visual inspection [10], penetration testing [11], magnetic particle testing [12], radiographic testing [13,14,15], and ultrasonic testing [16]. Among them, visual inspection is the simplest and most commonly used non-destructive testing method, but its testing results are subjective and unreliable. The penetration testing method marks the surface cracks of the tested object with a penetrant, which can observe surface defects more clearly, but cannot reflect the internal condition of the tested object. Magnetic particle inspection is only applicable to ferromagnetic materials. The ultrasonic testing method is not suitable for objects with large particle sizes. The detection accuracy of radiographic testing methods is high, but they are harmful to human health and have high costs.
Color digital holographic imaging is an imaging technique based on coherent light interference [17,18,19], which is widely used in engineering inspection [20], biomedical inspection [21,22,23], optical imaging [24,25,26], and other fields. According to the inherent characteristics of interferometric imaging technology, speckle noise often accompanies the imaging process of digital color holography. It causes the boundaries of the wrapped phase to become blurred and discontinuous, making phase unwrapping very challenging. If speckle noise is not removed, the calculated deformation field will be severely distorted. When the surface of the test object is smooth and the stress distribution area is large, traditional spatial frequency domain methods can reduce speckle noise [27]. On the other hand, the surface of the weld seam is relatively rough and the stress distribution area is concentrated, which requires high noise reduction technology. Traditional spatial and frequency domain algorithms cannot meet the noise reduction requirements. Therefore, due to the limitations of traditional denoise technology, there are currently no literature reports on the use of color digital holography technology for detecting weld stability.
The aim of the present work was to propose a new method to detect the weld stability of aluminum alloy plates in service based on color digital holography. A color digital holography optical path was designed to capture the holograms of aluminum alloy plates under varying loads. Deep learning techniques were employed to eliminate speckle noise in wrapped phases. Finally, the coefficient of variation of lap-jointed, butt-jointed, and defective butt-jointed aluminum alloy plates was calculated and used to evaluate the weld stability.

2. Methods

2.1. The Basic Principles of the Color Digital Holography

Digital holography records the amplitude and phase of the object light in the interference fringes of the hologram. The complex amplitude distribution of object light is:
U o ( x , y ) = o ( x , y ) e x p ( j φ 0 ( x , y ) ) ,
The distribution of the reference light complex amplitude is:
U R ( x , y ) = R ( x , y ) e x p ( j φ R ( x , y ) ) ,
The complex amplitude of the hologram is:
I ( x , y ) = U o ( x , y ) 2 + U R ( x , y ) 2 + 2 o ( x , y ) R ( x , y ) c o s [ φ 0 ( x , y ) φ R ( x , y ) ] ,
where o ( x , y ) is the amplitude of object light, R ( x , y ) is the amplitude of the reference light, φ 0 ( x , y ) is the phase of object light, and φ R ( x , y ) is the phase of the reference light.
Single-channel digital holography can obtain the deformation of the measured object along the optical axis direction, while three-channel digital holography (also called color digital holography) can obtain the deformation of the measured object in the three x y z directions. The solution for three-dimensional deformation is as follows [28].
λ R Δ φ λ R λ G Δ φ λ G λ B Δ φ λ B = 2 π c o s θ z λ R s i n θ x z λ R s i n θ z λ R 1 + c o s θ z λ R c o s θ x z λ R c o s θ z λ G s i n θ x z λ G s i n θ z λ G 1 + c o s θ z λ G c o s θ x z λ G c o s θ z λ B s i n θ x z λ B s i n θ z λ B 1 + c o s θ z λ B c o s θ x z λ B μ x μ y μ z ,
where u x , u y , u z are the deformations in the x, y and z directions, respectively. θ z represents the angle between the illumination vector and its projection on the xoz plane, and θ x z represents the angle between the projection of the illumination vector on the xoz plane and the z-axis. Δ φ R , Δ φ G , and Δ φ B are the unwrapped phase differences for the red channel, green channel, and blue channel, respectively.

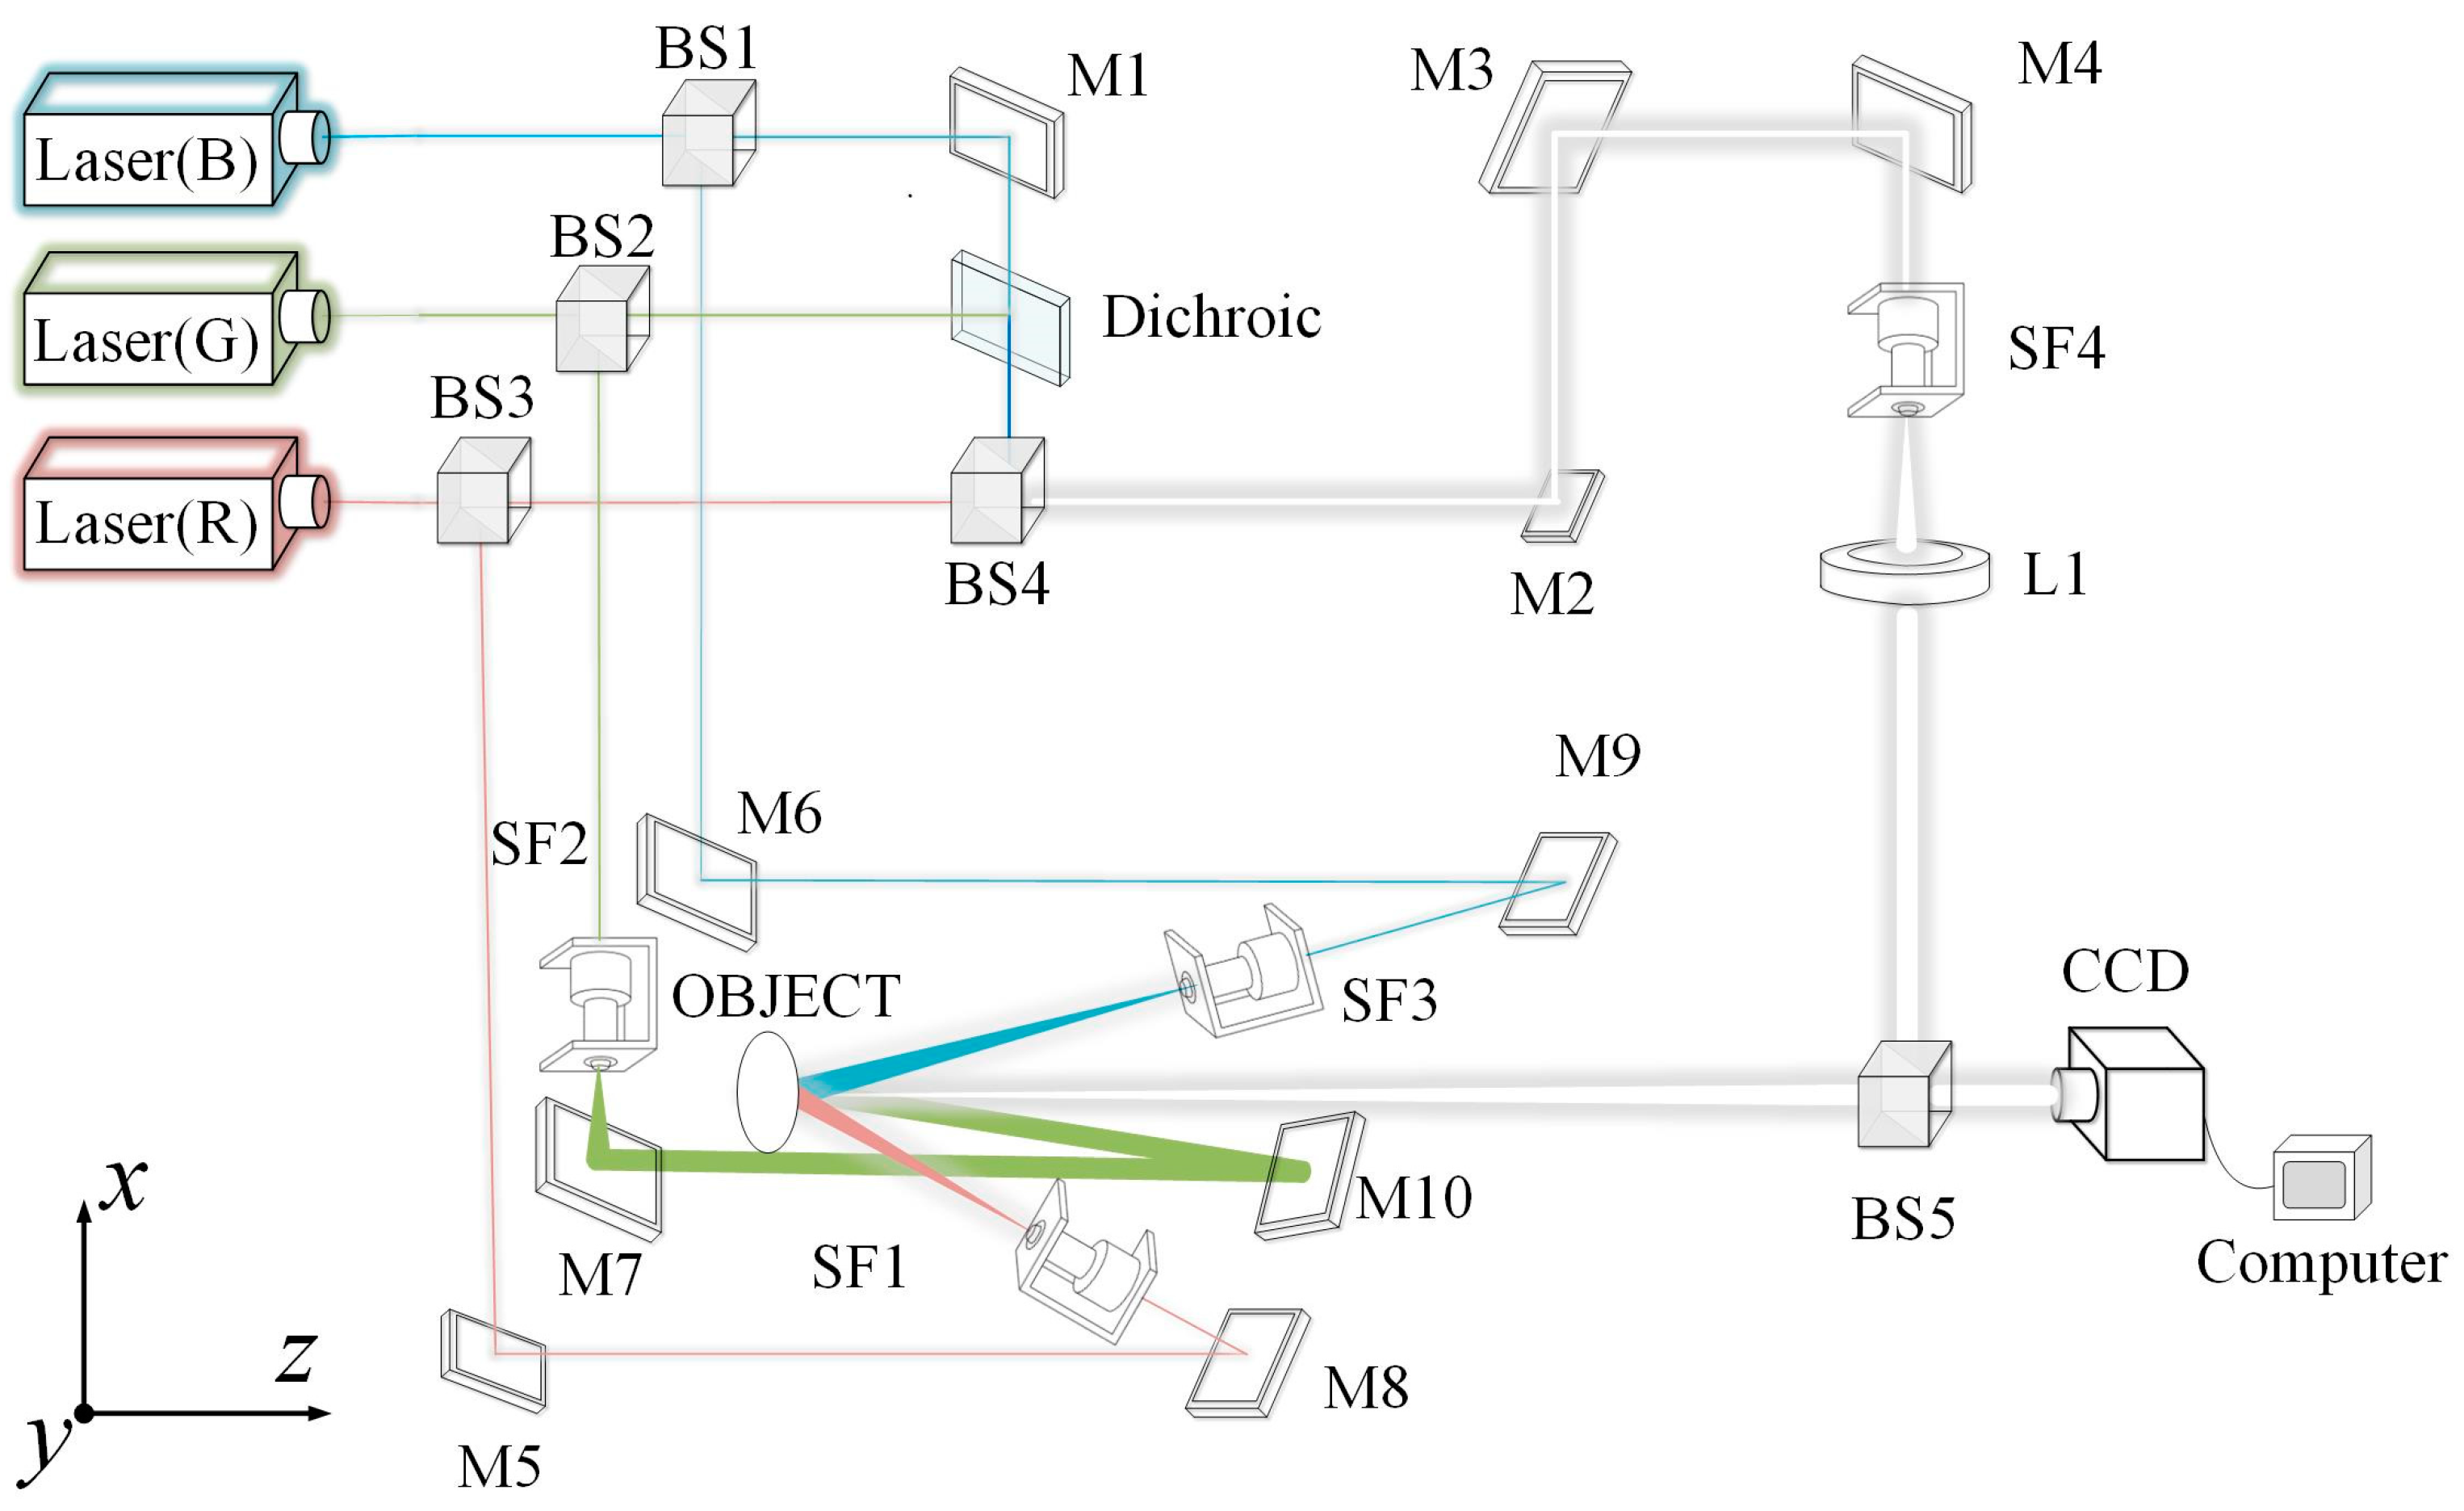
2.2. The Optical Path of the Color Digital Holography

The optical path of the color digital holography for detecting the weld stability is shown in Figure 1. The wavelength of the blue laser is 457 n m , the wavelength of the green laser is 532 n m , and the wavelength of the red laser is 671 n m . The pixel size of the charge-coupled device (CCD) (GRAS-50S5M-C) used in the experiment is 3.45 μ m .
The light waves emitted from the laser are decomposed into reference light and object light after passing through beam splitters (BS) (GCC-4011). Three reference beams are synthesized into white light on BS4, which is then expanded by SF4 and collimated by L1 to form parallel light. Finally, it is refracted into the CCD by BS5. The three beams of object light are, respectively, expanded into spherical waves by spatial filters (GCM-SF03M) (SF1, SF2, and SF3), then diffusely reflected on the surface of the object, and finally, enter CCD through BS5.
Figure 1 also shows the coordinate system on the optical platform (ZDT-B), where the plane parallel to the surface of the optical platform is defined as the xoz plane in the coordinate system, and the y-axis is perpendicular to the optical platform. Based on the path of the object light, the coordinates of the light points at M8, M9, M10, and OBJECT can be measured to calculate the illumination vectors of the RGB three beams. The distance from the object to the CCD is 840 mm, and the positions of the light points on M8, M9, M10, and OBJECT are (221, 250, 1392), (410, 253, 1593), (679, 250, 1733), and (583, 250, 1111), respectively.

2.3. Weld Samples

The samples in the experiment are lap-jointed and butt-jointed plates made of 6061 aluminum alloy and a defective butt-jointed plate made of 7075 aluminum alloy. These aluminum alloy plates were randomly selected from the laboratory and used common welding techniques in engineering. Their structure and dimensions are shown in Figure 2.
During the experiment, the load was applied in the y-direction of three samples. The load applied to the lap-jointed and butt-jointed aluminum alloy plates varies from 293.67 N to 301.50 N in steps of 3.92 N, while that applied to defective butt-jointed aluminum alloy plate varies from 293.87 N to 294.45 N in steps of 0.39 N. This is because a defective butt-jointed aluminum alloy plate is more prone to deformation, and the phase difference fringes obtained within the same load interval are very dense, exceeding the detection range of the system.

2.4. Denoising Algorithms Based on Deep Learning

Deep learning is a machine learning method, whose core is convolutional neural networks. It can automatically extract image features and is widely used in fields such as computer vision, image recognition, speech recognition, and medical image analysis. The research uses the Cycle Generative Adversarial Network (CycleGAN) [29] and 4-f optical simulation integrated cycle-consistent generative adversarial network (4f-CycleGAN) algorithms [30] of deep learning techniques to reduce speckle noise in wrapped phases. Compared to the original Generative Adversarial Network (GAN), CycleGAN is an unsupervised deep learning denoising method that does not require data pairing. Its network structure is a dual loop, which uses two generators ( G , F ) and two discriminators ( D x , D y ) to form a loop-generated network structure. Unlike CycleGAN, 4f-CycleGAN replaces the generator F in deep neural networks with a physically driven speckle simulation system (4F).
The 4f-CycleGAN algorithm fundamentally simulates the generation mechanism of speckle noise in digital holographic interferometry (DHI), thereby providing targeted guidance for the training process of the 4f-CycleGAN network. This method effectively suppresses artifacts and unexpected elements, significantly enhancing denoising performance. Figure 3 illustrates the network architecture of 4f-CycleGAN, which comprises two generators ( G and 4 F ) and two discriminators ( D x and D y ). During the algorithm’s execution, firstly, the original domain image X is transformed into an approximate representation of the target domain image Y by the generator G . Subsequently, the generator 4 F is utilized to transform the target domain image Y back to the original domain, resulting in a reconstructed version X ^ that closely resembles the original image X . This step aims to compute the loss function, which is based on the difference between the real input image X and the reconstructed image X ^ . During the X Y X ^ transformation process, the discriminator D y engages in adversarial training with the generator G to ensure that the generated image Y looks sufficiently realistic in the target domain. However, considering the reverse process from the target domain image Y back to the original domain image X ^ , another discriminator D x is introduced to engage in adversarial training with the generator 4 F , which ensures that the reconstructed image X ^ maintains consistency in the original domain. During the training process, the loss functions L c y c and L G A N are used to constrain the consistency between the input and output images. L c y c ensures the preservation of content integrity during image transformation, while L G A N ensures that the generated images are visually more realistic and believable. The 4f-CycleGAN algorithm demonstrates outstanding performance in denoising and image transformation tasks.
The pre-trained weights were obtained on the RTX 3090 TI GPU (NVIDIA, Santa Clara, CA, USA) [29]. The training set consists of 10,000 simulated phase differences containing speckle noise and 10,000 simulated clean phase differences without speckle noise. The training objective of deep learning is to map the network between the noisy image domain X and the noise-free image domain Y . The entire training process lasted for 70 rounds. In the paper, pre-trained weights with certified performance were used for denoising the phase differences.

3. Experiments and Results

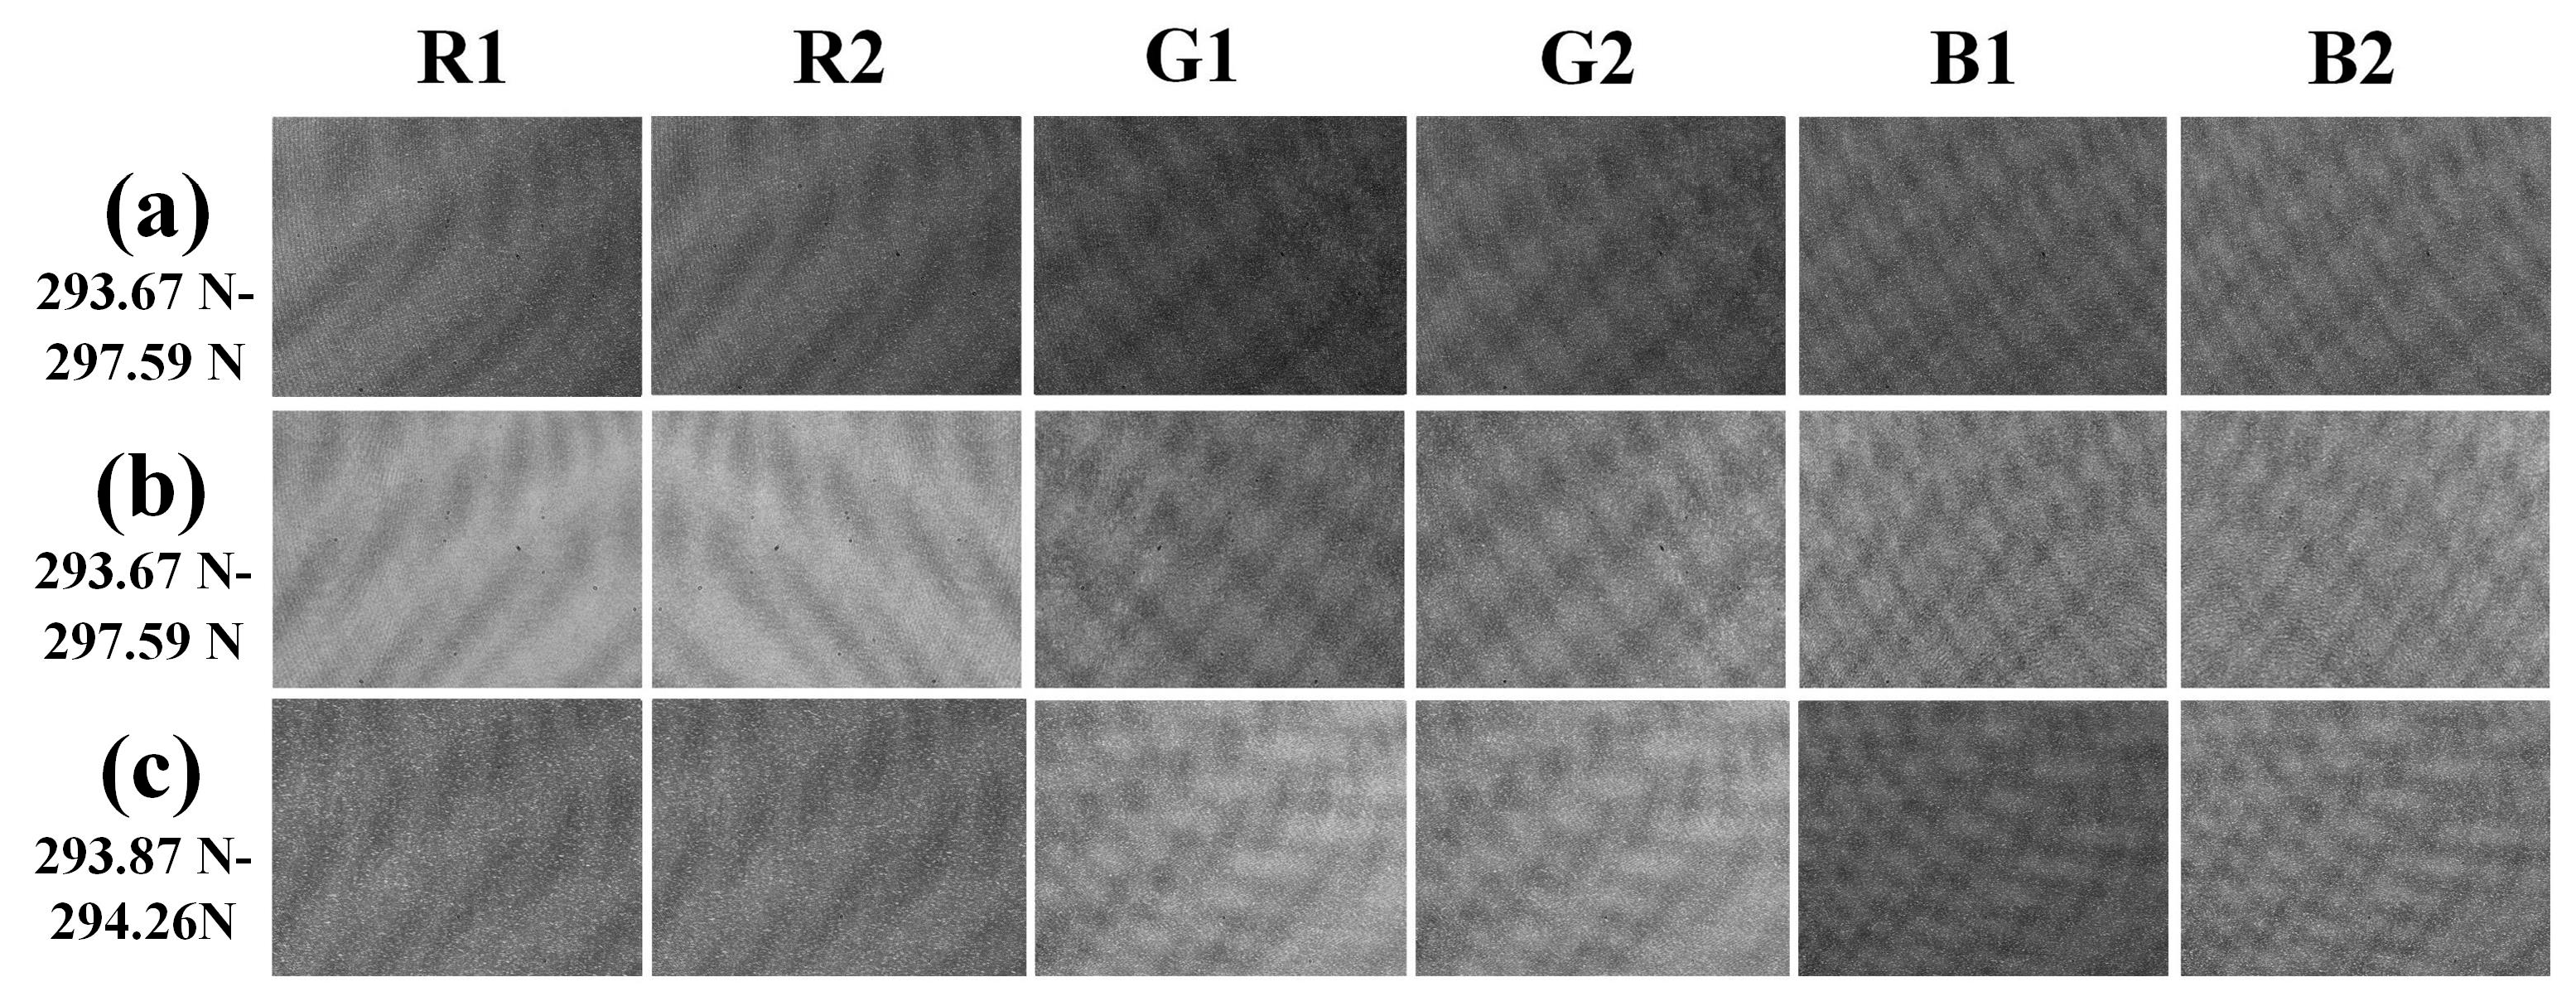
3.1. Digital Holograms

The aluminum alloy plates were placed in the OBJECT position in the color digital holographic optical path. The load was applied in the y-direction of three samples. The object light and the reference light interfere with the CCD, forming a hologram carrying the deformation information of the aluminum alloy plates. Figure 4a,b shows the holograms of three RGB channels of lap-jointed and butt-jointed aluminum alloy plates, where the load of R1, B1, and G1 is 293.67 N (Initial load), and the load of R2, B2, and G2 is 297.59 N. Figure 4c shows that of the defective butt-jointed plate, where the load of R1, B1, and G1 is 293.87 N (Initial load), and the load of R2, B2, and G2 is 294.26 N. By gradually increasing the load according to the experimental program, 18 holograms of any aluminum alloy plate can be obtained, with a total of 45 holograms for three samples.
The hologram is reconstructed by using the FIMG4FFT algorithm, and the phase difference of aluminum alloy plates under load changes is obtained. The phase difference after noise masking obtained from the reconstruction of the hologram in Figure 4 is shown in Figure 5. It can be observed that the phase differences are all disturbed by speckle noise and the boundaries of those phase differences are blurred and discontinuous. This makes phase unwrapping of those phase differences very challenging. To obtain accurate information about the 3D deformation field, the speckle noise needs to be reduced using a denoising algorithm.

3.2. Evaluation of Speckle Noise Reduction Algorithms

To minimize speckle noise, the research used traditional spatial and frequency domain algorithms alongside deep learning algorithms to denoise the wrapped phase difference, including the Median, Block Matching and 3D filtering (BM3D), 2-D Windowed Fourier transform (WFT2F), CycleGAN and 4f-CycleGAN algorithms. These algorithms were used to denoise the wrapped phase of the red channel in Figure 5a, and the results are shown in Figure 6.
As shown in Figure 6, the boundaries of the wrapped phase obtained by the median and BM3D algorithm are still fuzzy and discontinuous. The WFT2F algorithm outperforms the BM3D algorithm. In the results obtained with the WFT2F algorithm, the boundaries of the wrapped phase are clear and continuous. However, residual speckle noise persists, and there are line-like streaks due to incomplete noise reduction in areas of the phase distribution that are relatively flat. In the results obtained from the CycleGAN and 4f-CycleGAN algorithms, the wrapped phase appears smooth, with clear and continuous boundaries. Overall, deep learning algorithms are superior to traditional spatial and frequency domain algorithms, which is also the reason why deep learning algorithms have been widely used in recent years.
The sum of the peak signal-to-noise ratio (PSNR) was used to quantify the denoising results of these algorithms [31]. Table 1 shows the PSNR of five denoising algorithms for lap-jointed aluminum alloy plates. The sum of PSNR of the 4f-CycleGAN algorithm based on deep learning has a maximum value of 140.6 dB, indicating that its denoising result is the best. The sum of PSNR of the CycleGAN algorithm based on deep learning is 140.19 dB, indicating its better denoising result. The sum of PSNR of the WFT2F algorithm based on the frequency domain is 113.79 dB. The sum of PSNR of BM3D and median denoising algorithms based on the airspace is 26.88 dB and 70.82 dB, respectively, indicating that their denoising results are poor. Therefore, deep learning algorithms have better denoising results than traditional spatial and frequency domain algorithms for the detection system. The following research only uses the BM3D algorithm, the WFT2F algorithm, and the 4f-CycleGAN algorithm to study the denoising results.
Table 2 shows the PSNR of these algorithms for the butt-jointed aluminum alloy plate. The sum of PSNR for the 4f-CycleGAN algorithm in deep learning is the maximum, which is 118.81 dB, indicating that the 4f-CycleGAN algorithm has the best denoising result on the wrapped phase of the butt-jointed aluminum alloy plate.
Table 3 shows the PSNR of these algorithms for the defective butt-jointed aluminum alloy plate. The sum of PSNR for the 4f-CycleGAN algorithm in deep learning has a maximum value of 142.91 dB. This indicates that the 4f-CycleGAN algorithm still has the best denoising result for the defective butt-jointed aluminum alloy plate.
Comparing the sum of the PSNR for these algorithms, the 4f-CycleGAN algorithm based on deep learning is adopted to remove speckle noise in this paper.

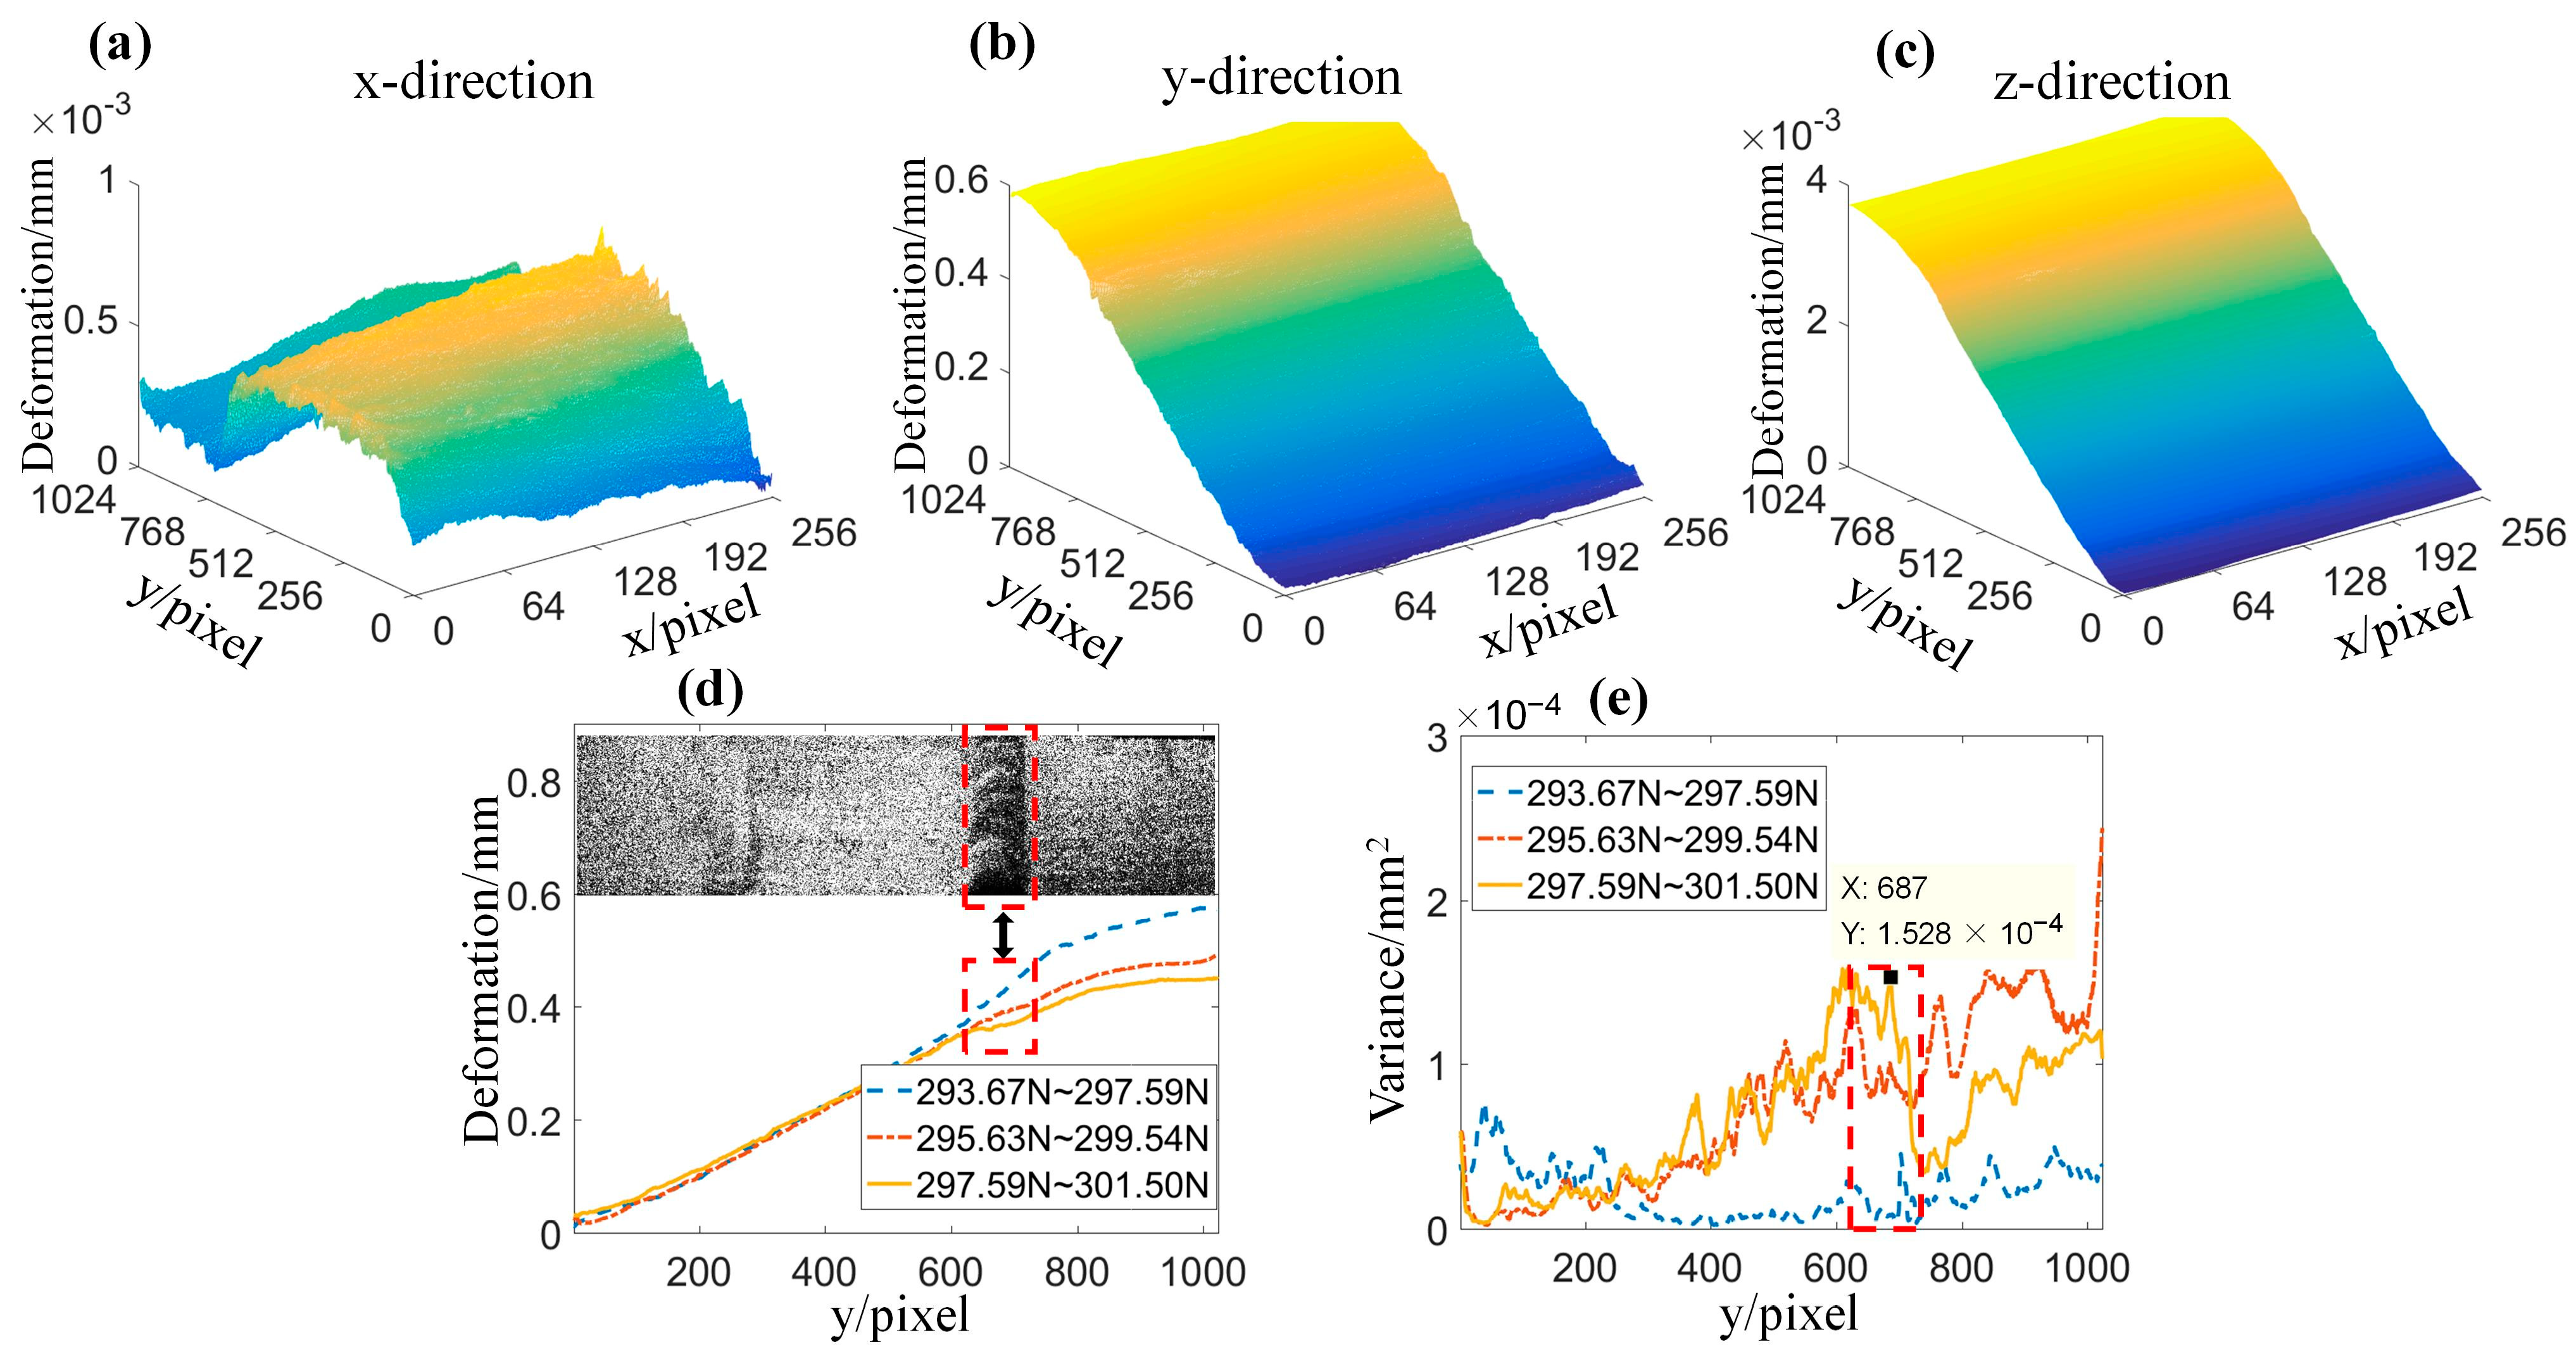
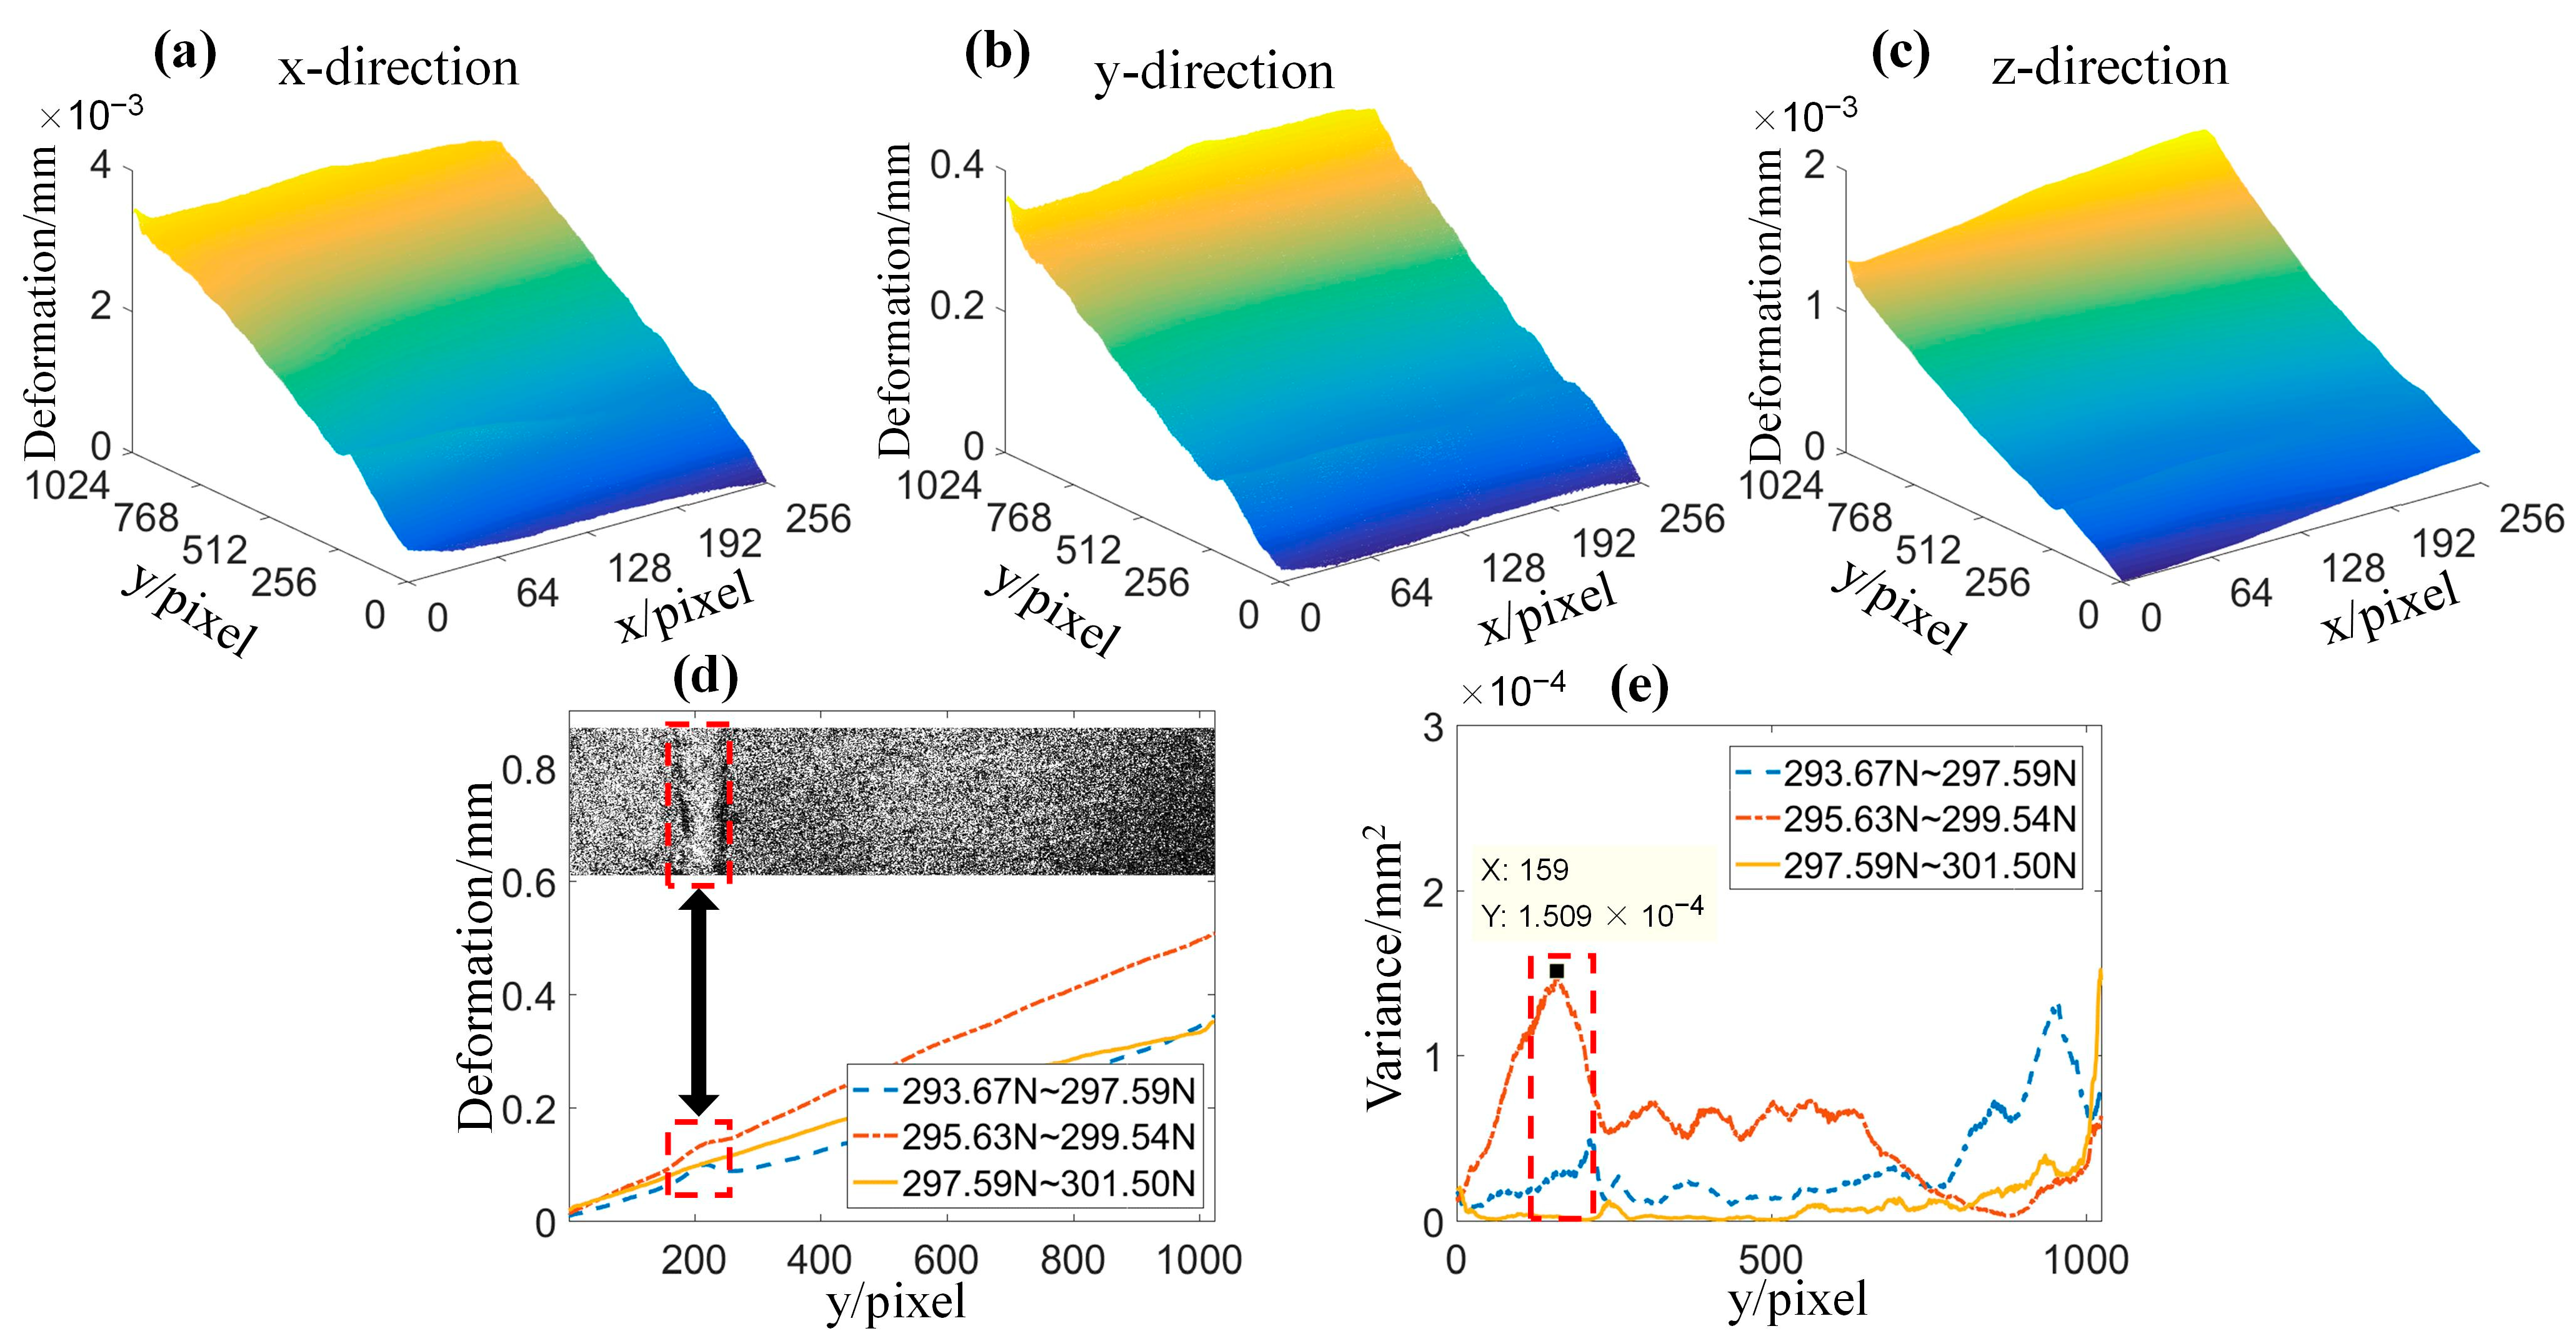
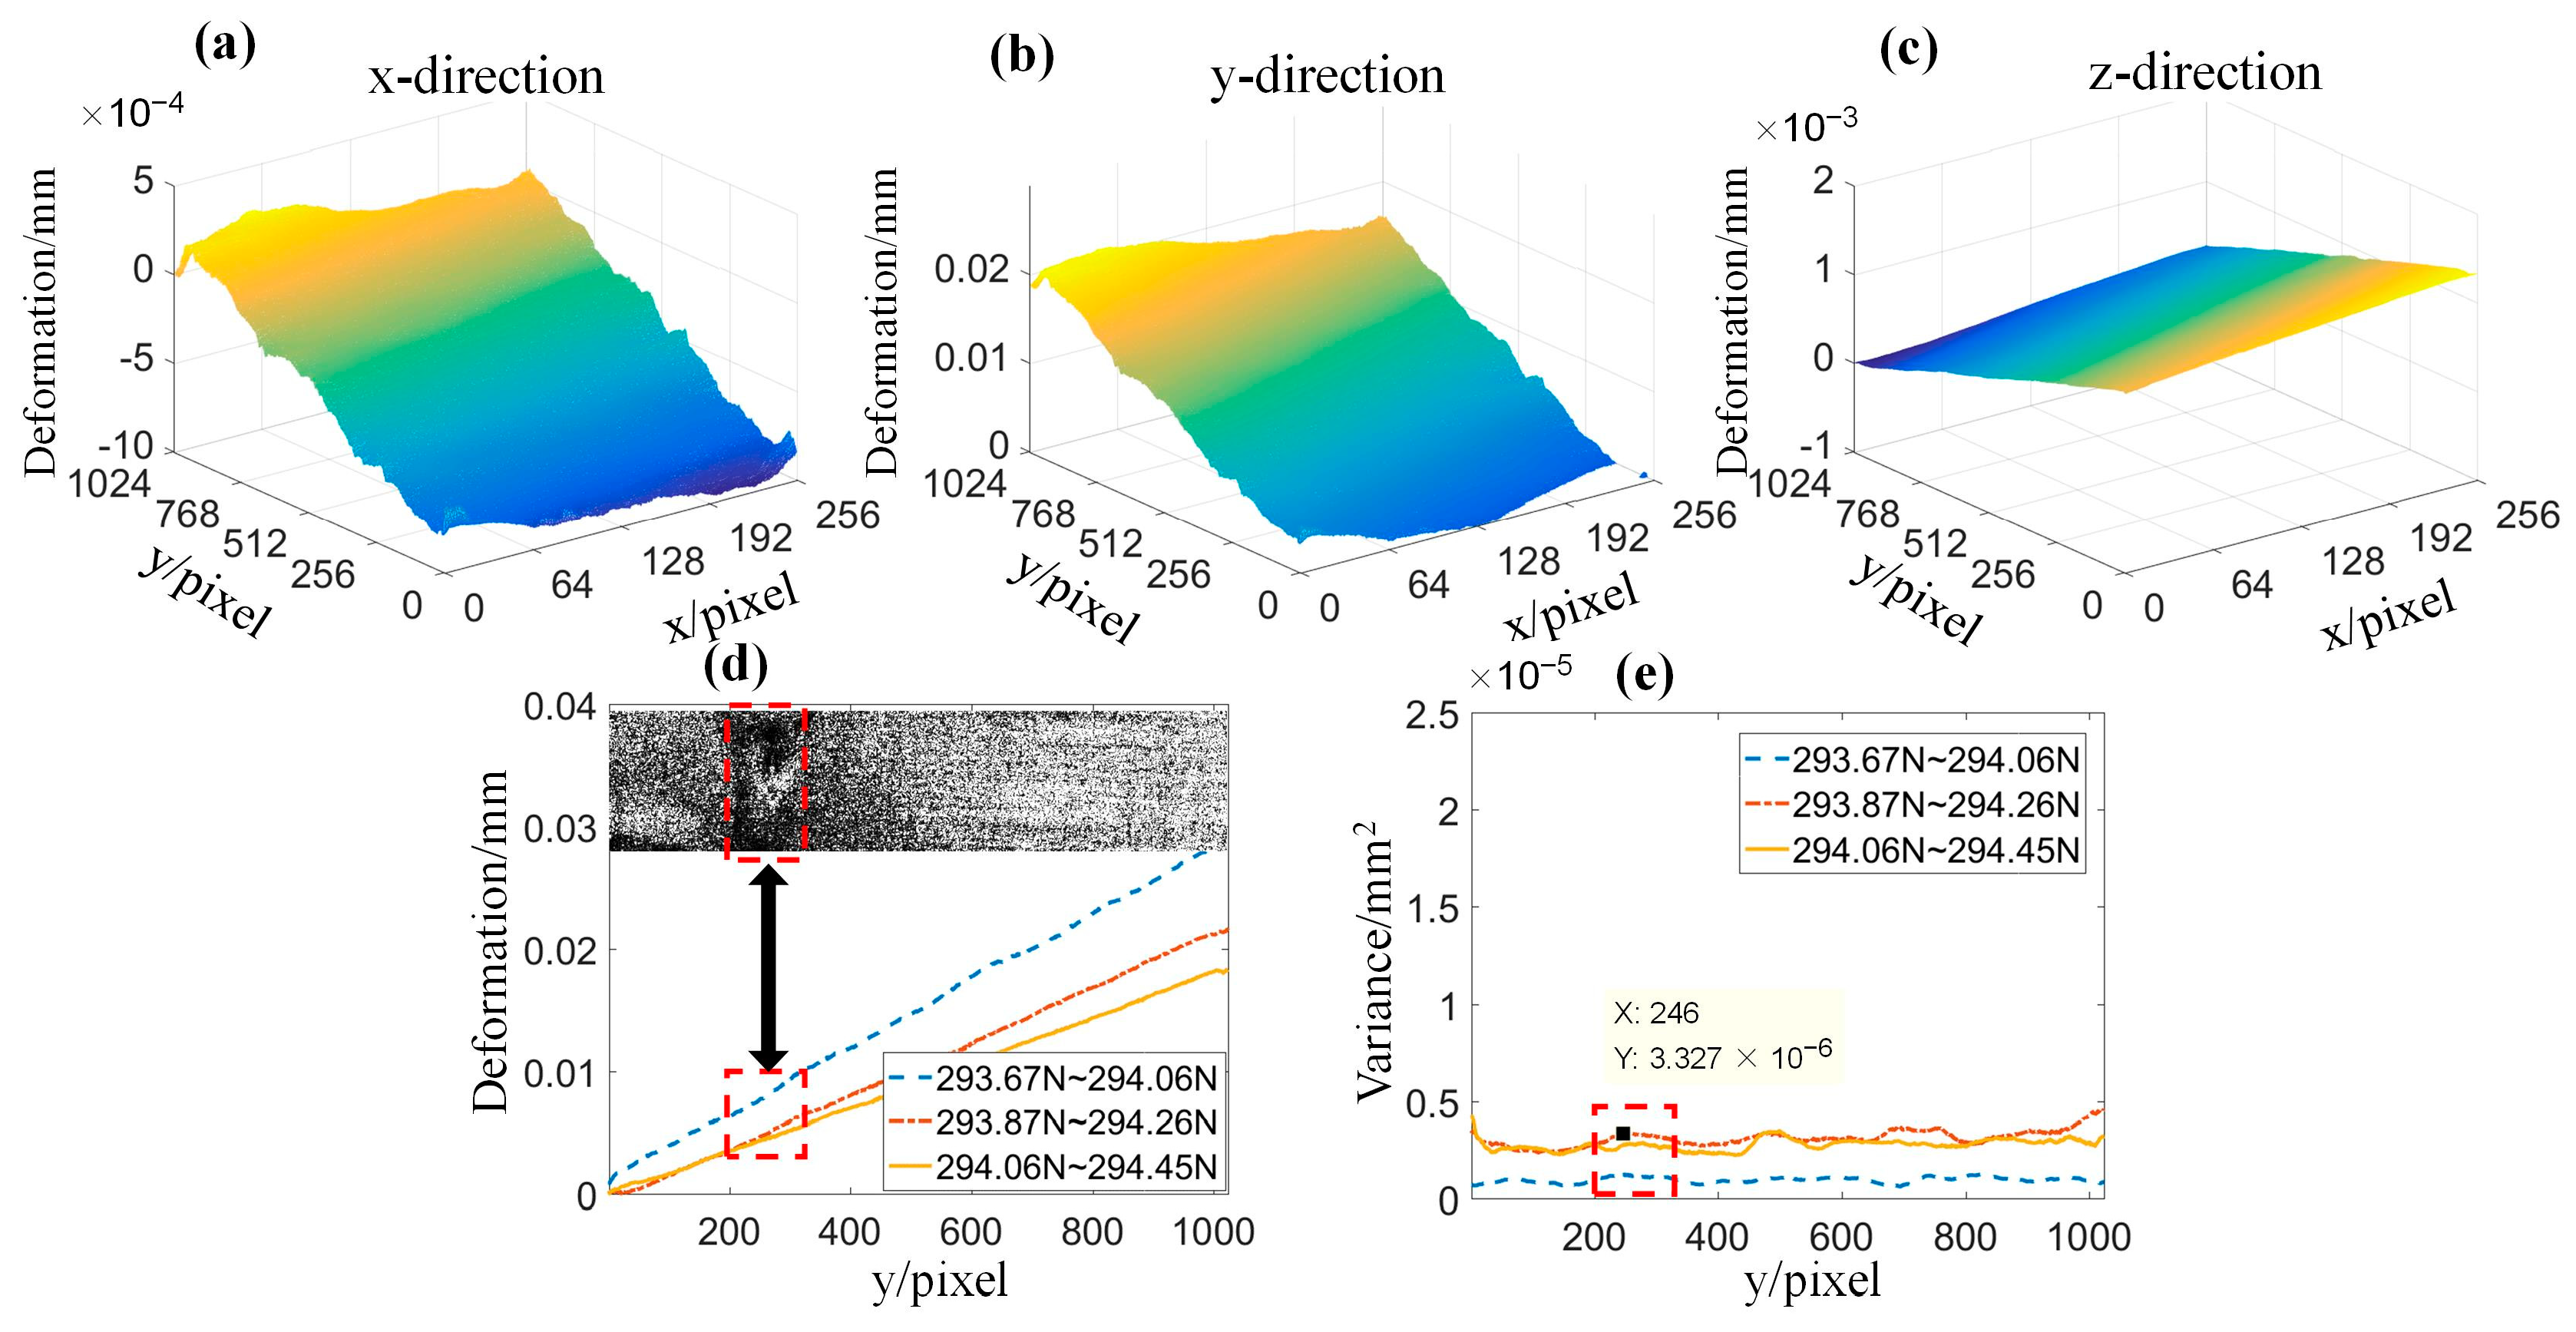
3.3. Evaluation of Weld Stability

Unwrapping the wrapped phase difference after noise reduction means that the three-dimensional deformation field of the aluminum alloy plate under different loads can be calculated using Equation (4). Figure 7a–c show the three-direction deformation field of the lap-jointed aluminum alloy plate with the load from 293.67 N to 297.59 N. The load is applied in the y-direction of the overlapped aluminum alloy plate, and the y-direction has the maximum deformation variable. Subsequently, we evaluate the weld stability of the lap-jointed aluminum alloy plate solely based on the deformation in the y-direction. Figure 7d shows the center section line of the y-direction deformation field with the load from 293.67 N to 301.50 N. When y changes from 0 to 630 pixels, the three curves have almost the same slope. According to Hooke’s law, the elastic modulus is constant, which is because it is composed of aluminum alloy plates with uniform materials. When y changes from 630 pixels to 720 pixels (red box), the slopes of all three curves show significant changes, which are caused by changes in the thickness and material of the weld, leading to changes in the elastic modulus. On the other hand, by calculating the holographic reconstruction images of the aluminum alloy plate [27,32], it can be seen that the thickness around the weld increases significantly (red box), and the position of the weld coincides with the range of significant changes in the slope of the three curves. Therefore, the position of the weld can be accurately determined by the center profile of the upward displacement field in the y-direction.
To evaluate the weld stability of the lap-jointed aluminum alloy plate, the variance of the y-direction deformation field and the coefficient of variation at the weld were calculated.
s 2 = i = 1 n ( x i x ¯ ) 2 n ,
c v = s x ¯ ,
where s 2 represents variance, x ¯ represents the mean deformation along the x-direction, s represents the standard deviation and c v represents the coefficient of variation.
The variance curves are shown in Figure 7e. Based on the weld position determined in Figure 7d, the coefficient of variation corresponding to the maximum variance near this position can be calculated. When y changes from 630 pixels to 720 pixels (red box), the variance has a peak value of 1.528 × 10 4   m m 2 at y = 687 pixel. Next, x ¯ = 0.3685   m m can be obtained, and finally, the coefficient of variation c v = 0.0335 can be obtained from Equation (6). It was reported that a coefficient of variation greater than 0.36 indicates poor weld stability, while a coefficient of variation less than 0.36 indicates good weld stability [31]. The smaller the coefficient of variation, the better the weld stability. Hence, we can conclude that the weld stability of the lap-jointed aluminum alloy plate is good.
Figure 8a–c show the three-direction deformation field of the butt-jointed aluminum alloy plate with the load from 293.67 N to 297.59 N. It can be seen that the deformation of the butt-jointed aluminum alloy plate mainly occurs in the y-direction, and the weld stability of the butt-jointed aluminum alloy plate would be evaluated only based on the deformation in the y-direction. Figure 8d shows the center section line of the y-direction deformation field with the load from 293.67 N to 301.46 N. Using the method shown in Figure 7d, the position of the weld seam can be determined at y [ 150 , 250 ] based on the significant changes in the slope of the three curves (red box) and the holographic reconstruction image (red box). The variance curve of the butt-jointed aluminum alloy plate is shown in Figure 8e. Near the weld ( y = 159 pixel), there is a peak in variance at y = 159 pixel, which is 1.509 × 10 4   m m 2 . Next, x ¯ = 0.0991   m m can be obtained, and finally, the coefficient of variation c v = 0.1240 can be obtained from Equation (6). Hence, it can be concluded that the weld stability of the lap-jointed aluminum alloy plate is good.
Figure 9a–c show the three-direction deformation field of the defective butt-jointed alloy plate with the load from 293.67 N to 294.45 N. It can be seen that the deformation of the defective butt-jointed aluminum alloy plate mainly occurs in the y-direction, and the weld stability of the defective butt-jointed aluminum alloy plate would be evaluated only based on the deformation in the y-direction. Figure 9d shows the center section line of the y-direction deformation field with the load from 293.67 N to 294.45 N. Using the method shown in Figure 7d, the position of the weld seam can be determined at y [ 210 , 290 ] based on the significant changes in the slope of the three curves (red box) and the holographic reconstruction image (red box). In addition, there are pits at the weld of the defective butt-jointed aluminum alloy plate, and the thickness of the weld is almost the same as that of the aluminum alloy plate, resulting in insignificant changes in the slope of the three curves. The variance curve of the defective butt-jointed aluminum alloy plate is shown in Figure 9e. When y changes from 210 pixels to 290 pixels (red box), the variance has a peak value of 3.327 × 10 6   m m 2 at y = 246 pixel. Next, x ¯ = 0.0046   m m can be obtained, and finally, the coefficient of variation c v = 0.3965 can be obtained from Equation (6). Hence, it can be concluded that the weld stability of the defective butt-jointed aluminum alloy plate is poor.
Therefore, an optical system based on color digital holography technology was designed successfully for detecting the weld stability. This optical detection system has many advantages, such as non-contact, non-destructive, dynamic, and full field detection, as well as detecting the weld stability of the workpieces in service. Of course, more parameters are needed to further evaluate the stability of the weld seam.

4. Conclusions

In summary, the article successfully designed an optical system for detecting the weld stability based on color digital holography technology. Regarding the roughness characteristics of the aluminum alloy plate surface, the 4f-CycleGAN algorithm based on deep learning has the maximum sum of PSNR and has the best denoising results for the speckle noise. The three-dimensional deformation fields of aluminum alloy plates with lap-jointed, butt-jointed, and defective butt-jointed were calculated, and the corresponding coefficients of variation were 0.0335, 0.1240, and 0.3965 respectively, indicating that the stability of the lap-jointed and butt-jointed aluminum alloy plates is good while the stability of the defective butt-jointed aluminum alloy plate is poor. The optical system can achieve non-contact, non-destructive, dynamic, and full field testing, as well as detect the weld stability of the workpiece in service. The research results of the paper would provide a new strategy for detecting the weld stability. There are potential application prospects in fields such as architecture, bridges, roads, and aerospace.

Author Contributions

Conceptualization and writing—original draft, Q.L.; writing—review and editing, G.H.; funding acquisition and validation, H.X.; conceptualization, R.W.; writing—review and editing W.Z.; funding acquisition, J.G.; software, Q.F.; software, C.G.; funding acquisition and writing—review and editing, Q.S. All authors have read and agreed to the published version of the manuscript.

Funding

This research was supported by the National Natural Science Foundation of China (62165007), the National Natural Science Foundation of China (11862008) and the National Natural Science Foundation of China (62065010).

Institutional Review Board Statement

Not applicable.

Informed Consent Statement

Not applicable.

Data Availability Statement

The data presented in this study are available on request from the corresponding author. The data are not publicly available because the data also form part of an ongoing study.

Conflicts of Interest

The authors declare no conflicts of interest.

References

  1. Hamed, R.; Asa, S.; Daniel, B.; Ali, M. Deep Learning Method to Detect Missing Welds for Joist Assembly Line. Appl. Syst. Innov. 2024, 7, 16. [Google Scholar] [CrossRef]
  2. Zhu, J.; Chen, Y.; Heng, J.; Wu, M.; Zhang, Y.; Li, Y. Probabilistic corrosion-fatigue prognosis of rib-to-deck welded joints in coastal weathering steel bridges exposed to heavy traffics. Int. J. Fatigue 2024, 182, 108210. [Google Scholar] [CrossRef]
  3. Francesco, A.; Josef, F.; Patrik, T. Complete modified notch functions for a welded detail of a trough bridge. Steel Constr.-Des. Res. 2023, 2023, 167–179. [Google Scholar]
  4. Tyystjärvi, T.; Fridolf, P.; Rosell, A.; Virkkunen, I. Deploying Machine Learning for Radiography of Aerospace Welds. J. Nondestruct. Eval. 2024, 43, 24. [Google Scholar] [CrossRef]
  5. Dhanya, M.S.; Manwatkar Sushant, K.; Kumar, G.; Narayana Murty, S.V.S. Metallurgical investigation of leakage observed in welded interface of Pilot pressure distributor of liquid stage for aerospace application. Eng. Fail Anal. 2023, 152, 107510. [Google Scholar] [CrossRef]
  6. Kristina, W.; Rikard, S.; Lars, L. Form Division for Welded Aero Components in Platform-Based Development. J. Aerosp. Eng. 2014, 28, 04014126. [Google Scholar]
  7. Zhang, T.; Li, J.; Yang, B.; Pei, X.; Jiang, W. An incremental indentation energy method in predicting uniaxial tensile properties of ferritic-austenitic dissimilar metal welds from spherical indentation tests. Int. J. Pres. Ves. Pip. 2023, 202, 300–312. [Google Scholar] [CrossRef]
  8. Walid, M.; Bojan, M.; Nenad, G.; Primož, Š.; Darko, V.; Aleksandar, S.; Marko, R. Fracture assessment of seam and seamless steel pipes by application of the ring-shaped bending specimens. Theor. Appl. Fract. Mec. 2019, 103, 102302. [Google Scholar]
  9. Liu, H.; Zhou, Y.; Wang, F.; Lu, Y.; Chen, Z. Experimental study on impact toughness of structural steel and its butt-welded joint at low temperature and corrosion. J. Constr. Steel Res. 2024, 212, 108298. [Google Scholar] [CrossRef]
  10. Li, Y.; Hu, M.; Wang, T. Visual inspection of weld surface quality. J. Intell. Fuzzy Syst. 2020, 39, 5075–5084. [Google Scholar] [CrossRef]
  11. Li, C.; Wang, Q.; Jiao, W.; Johnson, M.; Zhang, Y. Deep Learning-Based Detection of Penetration from Weld Pool Reflection Images. Weld. J. 2020, 99, 239S–245S. [Google Scholar] [CrossRef]
  12. Pydi, H.; Pradeep, A.; Vijayakumar, S.; Srinivasan, R. Examination of various weld process parameters in MIG welding of carbon steel on weld quality using radiography & magnetic particle testing. Mater. Today 2022, 62, 1909–1912. [Google Scholar]
  13. Peter, S. On the relationship between texture characteristics and residual stress levels: An X-ray diffraction study on α-Al2O3 hard coatings. Thin Solid Films 2023, 777, 139893. [Google Scholar]
  14. Zhu, P.; Gou, G.; Li, Z. Study of residual stresses in A7N01 aluminum alloy with Xray diffraction Debye ring analysis. Int. J. Mod. Phys. A 2019, 33, 1940032. [Google Scholar] [CrossRef]
  15. Kalbfleisch, S.; Zhang, Y.; Kahnt, M.; Buakor, K.; Langer, M.; Dreier, T.; Villanueva-Perez, P. X-ray in-line holotomography at the NanoMAX beamline. J. Synchrotron. Radiat. 2022, 29, 224–229. [Google Scholar] [CrossRef] [PubMed]
  16. Li, W.; Zhang, W.; Yang, G.; Chen, G. Application research on ultrasonic phased array detection algorithm for austenitic stainless steel with V-groove weld. Measurement 2024, 226, 114169. [Google Scholar] [CrossRef]
  17. Lyashenko, A.I.; Pol’shchikova, O.V.; Machikhin, A.S.; Vlasova, A.G.; Pozhar, V.E.; Kozlov, A.B. Three colour digital holographic microscopy based on a Mach-Zender interferometer and a solid state Rgb laser. Quantum Electron. 2020, 50, 662–666. [Google Scholar] [CrossRef]
  18. Tomohiro, K.; Daisuke, B.; Jun-ichiro, S.; Yoshio, H.; Toyohiko, Y. Color digital holography using a single monochromatic imaging sensor. Opt. Lett. 2012, 37, 3153–3155. [Google Scholar]
  19. Liu, T.; Wei, Z.; Yair, R.; Kevin, D.; Zhang, Y.; Wu, Y.; Aydogan, O. Deep learning-based color holographic microscopy. J. Biophotonics 2019, 12, 30–50. [Google Scholar] [CrossRef]
  20. Qin, Y.; Zhong, J. Theoretical and Experimental Research of Digital Holography with Partially Coherent Light Based on Light-Emitting Diode. Acta Opt. Sin. 2010, 30, 2236–2241. [Google Scholar] [CrossRef]
  21. LarivièreLoiselle, C.; Bélanger, E.; Marquet, P. Polychromatic digital holographic microscopy: A quasicoherent-noise-free imaging technique to explore the connectivity of living neuronal networks. Neurophotonics 2020, 7, 040501. [Google Scholar] [CrossRef] [PubMed]
  22. Li, H.; He, G.; Song, Q.; Xia, H.; Liu, Z.; Liang, J.; Li, T. The Study of Tooth Erosion Tested by the Color Digital Holography (CDH) Detection System. Appl. Sci. 2022, 12, 8613. [Google Scholar] [CrossRef]
  23. Xia, H.; Picart, P.; Montresor, S.; Guo, R.; Li, J.C.; Solieman, O.Y.; Durand, J.C.; Fages, M. Mechanical behavior of CAD/CAM occlusal ceramic reconstruction assessed by digital color holography. Dent. Mater. 2018, 34, 1222–1234. [Google Scholar] [CrossRef]
  24. Bourgade, T.; Sun, J.; Wang, Z. Compact Lens-less Digital Holographic Microscope for MEMS Inspection and Characterization. Jove-J. Vis. Exp. 2016, 1, 53630. [Google Scholar]
  25. Mohamed, T.; Saïd, I.; Rezki, B.; Denis, L.; Claude, R.; Ammar, H.; Thomas, G. Acousto-optically driven lensless single-shot ultrafast optical imaging. Light-Sci. Appl. 2022, 1, 628–643. [Google Scholar]
  26. Chen, A.; Gui, J.; Ma, X.; Liu, J.; Jiang, Z.; Song, Q. Compression of color digital hologram using wavelet thresholds and two-times quantization. Opt. Commun. 2023, 537, 129439. [Google Scholar] [CrossRef]
  27. Li, T.; Song, Q.; He, G.; Xia, H.; Li, H.; Gui, J.; Dang, H. A Method for Detecting the Vacuum Degree of Vacuum Glass Based on Digital Holography. Sensors 2023, 23, 2468. [Google Scholar] [CrossRef]
  28. Patrice, T.; Song, Q.; Karray, M.; Li, J.; Jean, M.D.; Pascal, P. Real-time three-sensivity measurements based on three-color digital Fresnel holographic interferometry. Opt. Lett. 2010, 12, 2055–2057. [Google Scholar]
  29. Zhu, J.; Park, T.; Isola, P.; Efros, A. Unpaired Image-to-Image Translation using Cycle-Consistent Adversarial Networks. IEEE Int. Conf. Comput. Vis. 2017, 244, 2242–2251. [Google Scholar]
  30. Yu, H.; Fang, Q.; Song, Q.; Silvio, M.; Pascal, P.; Xia, H. Unsupervised speckle denoising in digital holographic interferometry based on 4-f optical simulation integrated cycle-consistent generative adversarial network. Appl. Opt. 2024, 63, 3557–3569. [Google Scholar] [CrossRef]
  31. Elena, T.; Christine, S.; Alyssa, B.; Astrid, A.; Sam, C.; Kayla, S.; Jordan, G.; Medha, M. 297-OR: Usefulness of Coefficient of Variation (CV) to Assess Hypoglycemia in Older Adults with Type 1 Diabetes (T1D). Diabetes 2019, 68, 297. [Google Scholar]
  32. Ge, C.; Song, Q.; Caiyang, W.; Gui, J.; Li, J.; Qian, X.; Li, Q.; Dang, H. Improvement of Fresnel Diffraction Convolution Algorithm. Appl. Sci. 2024, 14, 3632. [Google Scholar] [CrossRef]
Figure 1. The optical path of color digital holography.
Applsci 14 04582 g001
Figure 2. The tested samples: (a) lap-jointed plate (b) butt-jointed plate; (c) defective butt-jointed plate.
Applsci 14 04582 g002
Figure 3. The network structure of 4f-CycleGAN.
Applsci 14 04582 g003
Figure 4. Holograms of (a) lap-jointed plate, (b) butt-jointed plate, (c) defective butt-jointed plate. (1600 pixels × 1200 pixels, 5.52 mm × 4.14 mm).
Applsci 14 04582 g004
Figure 5. Wrapped phases after noise masking of (a) lap-jointed plate (293.67 N~297.59 N, 1024 pixels × 256 pixels, 3.7 cm × 0.9 cm), (b) butt-jointed plate (293.67 N~297.59 N, 1024 pixels × 256 pixels, 3.1 cm × 0.8 cm), (c) defective butt-jointed plate (293.87 N~294.26 N, 1024 pixels × 256 pixels, 3.6 cm × 0.9 cm).
Applsci 14 04582 g005
Figure 6. The denoising results of (a) with noise, (b) median, (c) BM3D, (d) WFT2F, (e) CycleGAN, (f) 4f-CycleGAN. (293.67 N~297.59 N, 1024 pixels × 256 pixels, 3.7 cm × 0.9 cm).
Applsci 14 04582 g006
Figure 7. Stability evaluation of lap-jointed aluminum alloy plate. (a) x-direction deformation field; (b) y-direction deformation field; (c) z-direction deformation field; (d) the center section line; (e) the variance curve.
Applsci 14 04582 g007
Figure 8. Stability evaluation of butt-jointed aluminum alloy plate. (a) x-direction deformation field; (b) y-direction deformation field; (c) z-direction deformation field; (d) the center section line; (e) the variance curve.
Applsci 14 04582 g008
Figure 9. Stability evaluation of the defective butt-jointed aluminum alloy plate. (a) x-direction deformation field; (b) y-direction deformation field; (c) z-direction deformation field; (d) the center section line; (e) the variance curve.
Applsci 14 04582 g009
Table 1. PSNR (dB) of several algorithms for the lap-jointed aluminum alloy plate.
MedianBM3DWFT2FCycleGAN4f-CycleGAN
PSNR_R25.838.4944.5847.3547.54
PSNR_G22.519.3634.1948.4251.41
PSNR_B22.489.0335.0244.4241.65
SUM70.8226.88113.79140.19140.6
Table 2. PSNR (dB) of several algorithms for the butt-jointed aluminum alloy plate.
BM3DWFT2F4f-CycleGAN
PSNR_R8.9037.5036.53
PSNR_G10.0935.8244.04
PSNR_B10.2330.0038.24
SUM29.22103.32118.81
Table 3. PSNR (dB) of several algorithms for the defective butt-jointed aluminum alloy plate.
BM3DWFT2F4f-CycleGAN
PSNR_R10.1543.2244.97
PSNR_G10.6142.8752.00
PSNR_B11.0336.5745.94
SUM31.79122.66142.91
Disclaimer/Publisher’s Note: The statements, opinions and data contained in all publications are solely those of the individual author(s) and contributor(s) and not of MDPI and/or the editor(s). MDPI and/or the editor(s) disclaim responsibility for any injury to people or property resulting from any ideas, methods, instructions or products referred to in the content.

