Article

Precision Diagnosis of Glaucoma with VLLM Ensemble Deep Learning

by
Soohyun Wang
1,
Byoungkug Kim
2,
Jiheon Kang
3 and
Doo-Seop Eom
1,*
1
Department of Electrical and Computer Engineering, Korea University, 145 Anam-ro, Seoul 02841, Republic of Korea
2
Division of Computer Science and Engineering, Sahmyook University, 815 Hwarang-ro, Seoul 01795, Republic of Korea
3
Department of Software, Duksung Women’s University, 33 Samyang-ro, Seoul 01369, Republic of Korea
*
Author to whom correspondence should be addressed.
Appl. Sci. 2024, 14(11), 4588; https://doi.org/10.3390/app14114588
Submission received: 1 May 2024 / Revised: 22 May 2024 / Accepted: 23 May 2024 / Published: 27 May 2024

Abstract

:
This paper focuses on improving automated approaches to glaucoma diagnosis, a severe disease that leads to gradually narrowing vision and potentially blindness due to optic nerve damage occurring without the patient’s awareness. Early diagnosis is crucial. By utilizing advanced deep learning technologies and robust image processing capabilities, this study employed four types of input data (retina fundus image, region of interest (ROI), vascular region of interest (VROI), and color palette images) to reflect structural issues. We addressed the issue of data imbalance with a modified loss function and proposed an ensemble model based on the vision large language model (VLLM), which improved the accuracy of glaucoma classification. The results showed that the models developed for each dataset achieved 1% to 10% higher accuracy and 8% to 29% improved sensitivity compared to conventional single-image analysis. On the REFUGE dataset, we achieved a high accuracy of 0.9875 and a sensitivity of 0.9. Particularly in the ORIGA dataset, which is challenging in terms of achieving high accuracy, we confirmed a significant increase, with an 11% improvement in accuracy and a 29% increase in sensitivity. This research can significantly contribute to the early detection and management of glaucoma, indicating potential clinical applications. These advancements will not only further the development of glaucoma diagnostic technologies but also play a vital role in improving patients’ quality of life.

1. Introduction

Glaucoma is a leading cause of blindness worldwide, often progressing without early symptoms, making it difficult for patients to notice any signs until it leads to complete vision loss. Known as the “silent thief of sight”, the early detection and treatment of glaucoma are crucial. The disease typically progresses due to abnormal increases in intraocular pressure (IOP), which compresses and damages the optic nerve, leading to potential vision loss. Factors such as age, gender, ethnicity, and genetics also influence its irreversible onset [1].
Traditional methods for diagnosing glaucoma include visual field tests, IOP measurement, and the direct examination of the optic nerve head. However, these methods generally require significant time and specialized equipment and can be tiring for the examiner. Recent advances have seen the development of more effective detection and diagnostic techniques using high-resolution retina fundus imaging and optical coherence tomography (OCT). Among these, retina fundus imaging is less tiring, is cost-effective, and captures detailed images of the posterior eye, making it a crucial diagnostic tool for identifying structural changes in the optic nerve. The use of retina fundus imaging for computer-aided diagnosis (CAD) offers a quick, non-invasive, and cost-effective way to diagnose glaucoma. It is highly accessible and can be efficiently used in various clinical settings to provide large-scale examinations [2].
Developing an accurate deep learning-based diagnostic system using retina fundus imaging for early glaucoma detection is essential. For precise diagnosis, it is necessary to incorporate a specialist’s diagnostic perspective and identify the structural features of the fundus image. This paper explores the principles of glaucoma testing using retina fundus imaging, recent research outcomes, and how our proposed methods can contribute to glaucoma diagnosis. We also analyze the advantages and limitations compared to previous research methods and explore the potential of these methods as future diagnostic tools [3,4]. This approach is crucial for enhancing the accuracy of glaucoma diagnosis, ensuring that more patients receive timely and appropriate treatment.
The contributions of this study are as follows:
  • The proposal of a novel glaucoma diagnosis method utilizing optic nerve cells. Previous research has utilized retina fundus or ROI images but has not provided enough features. This new research method additionally incorporates the surrounding vasculature and the structural morphology of the optic nerve cells. As it accounts for the structural features of glaucoma, this approach holds significant importance.
  • Addressing the data imbalance issue in medical data by using a modified loss function. It is common to use data augmentation or mix multiple datasets to address data imbalance issues in medical data. However, we have mitigated this problem by modifying the loss function. This approach is highly effective when the classification accuracy of certain classes is low due to data imbalance.
  • A new ensemble model utilizing the vision large language model (VLLM). Traditional ensemble models typically employ methods such as voting, bagging, and boosting. The method we propose uses the predicted probabilities from four types of input data and their similarity to the actual answers to determine weights for each input data type for the ensemble. By reflecting the unique characteristics most similar to the correct answers among the input data types, this technique is a new ensemble approach that can enhance the final accuracy.

2. Related Work

2.1. Glaucoma Diagnosis Using Fundus Imaging

A wide range of techniques, from basic machine learning methods to advanced deep learning approaches, have been proposed for detecting glaucoma. Typically, studies using machine learning techniques have adopted the methods used by ophthalmologists to examine retina images. Initially, the optic disc area is segmented from the fundus image, and then glaucoma is classified based on features such as the optic cup-to-disc ratio (CDR) and the ISNT rule. This content is explained in Figure 1.
Cheng et al. [5] utilized the superpixel technique to segment the optic disc area and calculated the CDR using brightness differences. Experiments were conducted using the SiMES and SCES datasets, achieving AUC results of 83% and 88%, respectively. Chakravarty et al. [6] employed Hough transform to locate the optic disc area and extracted features using the projection texture and bag of words techniques. The classification between normal and glaucomatous cases was carried out using a support vector machine (SVM). By utilizing the DRISHITI-GS11 dataset, this study reported an accuracy of 76.8% and an AUC of 78.0%.
Mohamed et al. [7] enhanced contrast in fundus images by removing noise through preprocessing. He then used the linear iterative clustering superpixel technique to segment the optic disc area and determined glaucoma based on CDR values; a CDR of between 0.4 to 0.6 and glaucomatous when it exceeded 0.6 was considered normal. Selvathi et al. [8] applied a 2D discrete wavelet transform to extract features and trained a neural network. By using the HRF dataset, an accuracy of 95.8% was achieved.
Maheshwari et al. [9] also applied wavelet transform to extract features from fundus images, not directly from the original but from transformed images in red, green, blue, and grayscale. The features were classified using a least squares SVM. Testing with the RIM-ONE dataset yielded an accuracy of 81.3%.
Research on detecting glaucoma using deep learning has been actively pursued alongside traditional machine learning methods. Fu et al. [10] employed a U-Net model to extract the optic disc area, which was then transformed into polar co-ordinates to spread around the center for analysis. The classification model used was ResNet, and it was trained on the original images, the optic disc region images, and the modified images. Three models were trained on each input type, and their results were combined using a voting ensemble method. The experiments conducted with the SCES and SINDI datasets yielded accuracies of 83.2% and 66.6%, respectively.
Guo et al. [11] preprocessed original fundus images to generate six feature images, which were then fused to locate the central point of the optic nerve area. The six feature images included a bottom-hat transformation image, a top-hat transformation image, a combined bottom-top-hat transformation image, an enhanced brightness image, a blood vessel extraction image, and a composite image of the previous five features. Following the identification of the optic disc’s central point, the optic disc and surrounding areas were segmented separately using U-Net. The segmented optic disc area was then subtracted from the surrounding area to form a donut-shaped region, which was segmented into quarters according to the ISNT rule and classified using a random forest method. By utilizing the ORIGA dataset, this study achieved an accuracy of 76.9% and an AUC of 83.1%.
Although the separation of the optic disc and surrounding area was managed through deep learning, the process of locating the optic disc area and classifying normal from glaucoma leaned more towards machine learning techniques, complicating the classification of the approach as being purely based on deep learning.
Diaz-Pinto et al. [12] used five different CNN models (InceptionV3, XceptionNet, VGG16, VGG19, and ResNet50) to classify normal and glaucomatous cases. Each model was trained individually, and ultimately, XceptionNet, which offered the best performance relative to the number of parameters, was chosen for classification experiments across multiple datasets, including HRF, DRISHITI-GS1, RIM-ONE, sjchoi86-HRF, and ACRIMA. The accuracies recorded were 80.0%, 75.2%, 71.2%, 70.8%, and 70.2%, respectively.
Li et al. [13] utilized a deformable shape model, traditionally used for object detection, to segment the optic disc area into nine parts according to the ISNT rule, using the ORIGA dataset to achieve an AUC of 0.8384. Bock et al. [14] used FFT coefficients and SVM to achieve an AUC of 0.87 from a personal dataset of 575 images, and Krishnan et al. [15] used HOS, TT, DWT, and SVM to achieve an accuracy of 0.91 from a personal dataset of 60 images. Al-Bander et al. [16] used a 23-layer CNN combined with SVM to achieve an accuracy of 0.88 on the RIM-ONE dataset. Christopher et al. [17] used transfer learning with ResNet, Vgg16, and Inception v3 to achieve an AUC of 0.91 from a personal dataset of 14,822 images. Juan J Gomez- et al. [18] developed a model that automatically classifies color fundus images using a CNN and transfer learning processes, achieving an accuracy of 0.94 across three datasets, including two public (RIM-ONE and DRISHITI-GS1) and one private dataset comprising 2313 images.
Chaudhary and Pachori et al. [19] devised a glaucoma detection model by employing two distinct methods and leveraging datasets, including RIM-ONE, ORIGA, and DRISHTI-GS. The segmentation of the boundary was facilitated using the 2D Fourier-Bessel series expansion-based empirical wavelet transform. Two approaches were explored: one based on machine learning (ML) models and the other utilizing an ensemble approach with the CNN architecture ResNet. The first method, executed at full scale, yielded the most favorable outcomes.
For the second method, by employing the ensemble technique at full scale, the model achieved impressive performance metrics: 91.1% accuracy, 91.1% sensitivity, 94.3% specificity, 83.3% area AUC, and 96% receiver operating characteristic (ROC).
Many existing studies demonstrate high AUC values, as well as high sensitivity and specificity. However, a closer look reveals that these results are often limited to private datasets, and many studies do not disclose the number of normal and abnormal data used for classification, resulting in a lack of confusion matrices. Even when confusion matrices are present, some papers achieve high AUCs primarily by correctly predicting normal data.
While correctly identifying healthy individuals is important, the critical challenge is accurately diagnosing conditions such as glaucoma. The worst-case scenario is when a patient with glaucoma is misclassified as normal, remaining unaware of their condition and potentially worsening their situation. Unfortunately, many papers do not focus on or discuss this aspect sufficiently. we developed a model with a focus on improving the classification accuracy of glaucoma data while maintaining high accuracy for the primary screening in the health checkup process.

2.2. Data Imbalance

In the field of medical imaging, unlike general imagery, it is challenging to obtain data due to privacy concerns involving patient information and legal issues surrounding medical regulations. Furthermore, there’s a significant imbalance in the data available, with a majority of the tested population typically being healthy and a scarcity of data on those with conditions.
This imbalance between the types of data used is an inherent and ongoing issue. Particularly in medicine, where the majority of the tested population is healthy, and those with diseases are in the minority, medical fields are emblematic of sectors where data imbalance is prevalent. Numerous studies have been conducted to address this issue, using models ranging from machine learning to deep learning.
Traditional methods include undersampling and oversampling techniques. Undersampling involves reducing the data from the majority class to match the quantity of the minority class data. This can range from random sampling, where data is randomly selected, to methods such as Tomek Links, which eliminate the majority class data that are nearest to the minority class. There is also the NN-rule method, which uses the K-nearest neighbor (KNN) approach to create subsets of data by randomly selecting from the majority class to align with the entire minority class data. Another method, one-sided selection, combines Tomek links and NN-rules. While undersampling can quickly address data imbalance, it also reduces the amount of data available, leading to the potential loss of information.
On the other hand, oversampling adjusts the amount of minority class data to equal that of the majority class. This can be carried out through simple resampling, which involves randomly duplicating data from the minority class, or through more advanced methods, such as SMOTE, which synthesizes new minority class data points by using existing data. Borderline SMOTE focuses on creating synthetic data along the border between two classes. Similarly, ADASYN [20] adapts the amount of data it generates based on the density of the majority class data surrounding each minority class data point. Traditional machine learning has expanded these concepts into variants such as SMOTENC [21], SVM-SMOTE [22], and KNN-SMOTE [23], which combine SMOTE with various algorithms.
However, oversampling can lead to over-fitting due to the similarity between the newly generated data points, and it may perform poorly with noisy data or outliers, making it difficult to distinguish the boundaries between classes.
Due to the limitation of not being able to use most of the normal data with undersampling, oversampling techniques were used sparingly. Given the issue of data homogeneity and the overall scarcity of data, oversampling was not extensively employed. When the numbers were too small to adequately split into training, validation, and testing sets, oversampling was applied between the training and validation phases. Subsequently, only data augmentation methods that did not alter the original data were used to increase the dataset size.

2.3. Color Mapping of Thermal Camera

Thermal camera images differ significantly from standard RGB camera images. Thermal cameras measure the temperature of objects and generate images based on this temperature information. These images primarily detect infrared energy for temperature sensing, converting it into temperatures represented as visual data. The original images are essentially grayscale, composed solely of thermal information where brighter areas indicate higher temperatures and darker areas indicate lower temperatures. In order to aid user understanding, various color palettes are often applied to differentiate temperature variations through color. These color palettes typically use visible colors, assigning different colors to different temperature ranges.
Figure 2 shows the application of various palettes on a thermal camera by ATN Corp. Since the perception changes with different palettes, adjusting the palette according to the usage environment can enhance performance. This flexibility allows users to optimize the thermal imagery for specific applications, such as wildlife observation, security, or search and rescue operations, by selecting palettes that best highlight the features relevant to each context. This ability to switch between different color mappings is crucial for maximizing the utility and effectiveness of thermal imaging technology in diverse conditions.
Sundin et al. [24] utilized various color palettes in thermal cameras to visualize temperature changes, noting that different palettes can emphasize different features of the thermal images. Olaia et al. [25] evaluated the effectiveness of various color palettes used in tropical environments with thermal imaging. They highlighted how palettes can impact data accuracy and the ease of interpretation in environments with diverse and complex heat sources.
In ophthalmology, images are often viewed in black and white or with a green filter. However, as demonstrated in other fields, utilizing a variety of color palettes to enhance structural features can improve interpretability and lead to greater accuracy.
Figure 2. When applied with various color palettes, the heat vision cameras from ATN Corp show different recognition capabilities. Further details can be found in [26].
Applsci 14 04588 g002

3. Proposed Method

Medical data have characteristics that are different from general images. Basically, medical data encounter the problem of data imbalance, in which most of the data are normal, and there is little patient data. In addition, there must be a specialist in the related field to obtain high-quality data and labels, and each specialist has a different size or scope of the disease they suspect. In addition, in the case of medical images, it is possible to check data only by using a specific viewer rather than when the data are made in an open format. Therefore, it is difficult to expect high performance if the classification model of general image classification data, such as ImageNet, is applied as it is. Models for data composition, preprocessing, and analysis that consider the characteristics of medical data must be developed.

3.1. ROI and VROI

Figure 3 depicts a modified attention U-Net, ROI, and VROI that have been successfully extracted. This enhanced version of U-Net leverages attention mechanisms to focus more precisely on the relevant features within the images, such as specific anatomical structures in medical imaging. The attention module within the network helps to improve the accuracy of segmenting and highlighting critical areas, which is particularly useful for tasks requiring detailed analysis of specific regions within larger images. This approach not only improves the quality of the segmentation but also increases the efficiency of the analysis by directing computational resources toward areas of the image that contain the most pertinent information.
In retina fundus images, extracting just the cup-disk region, referred to as the cup-disk ROI image, is crucial, as it intuitively reveals structural changes and provides key indicators for diagnosing glaucoma. Typically, if the vertical measurement of the CDR exceeds 0.5, it is indicative of glaucoma. Accurately cropping this small area from fundus images to use as input data is essential. We have employed a modified attention U-net to extract this ROI from the retina fundus images.
The input data are resized to 256 × 256 and then passed through a convolution network to extract features. After passing through two convolutions (resulting in a 128 × 128 feature map), the pooling process reduces this to a 64 × 64 feature map, which is then concatenated in the next layer. This acts as an encoder that captures the features of the input image. Following this, the decoding process is used to identify regions of interest (ROI) and produce the final result. At this stage, mask data indicating the regions of interest in the input data is required. The decoding results are compared with the mask, training the network to ensure that the identified ROI matches the mask regions.
The attention gate plays a crucial role by assigning weights to the regions of interest, allowing the network to focus more on important information (the ROIs). The attention gate takes the gate signal (g) and the feature map ( x i ), which are passed through a skip connection as inputs. Since g is a 32 × 32 image, it undergoes transpose convolution to become 64 × 64, matching the size of x i . The two vectors are then element-wise added, where the central weights become larger and the noncentral weights become relatively smaller. This result is passed through ReLU and then through Sigmoid to create the attention coefficients. A higher attention coefficient indicates a more important area to focus on.
In this process, we utilize the mask data to refine the attention coefficients by calculating the weights for the pixel positions in the ROI, creating a modified attention gate. The resulting attention coefficients are then multiplied with the previous feature map, scaling according to the object relevance and further enhancing the learning process.
The eye is the only part of the body where blood vessels can be visibly analyzed, and they play a crucial role in carrying and distributing blood. Problems in blood circulation can lead to blocked and progressively thickening vessels, eventually causing new capillaries to form around the thickened areas. Persistent issues may cause these thickened vessels to burst, leading to hemorrhage. Such characteristics are indicative of ophthalmic diseases. In cases of glaucoma, damage to the optic nerve bundles prevents the visual information received by the eyes from being transmitted to the brain, leading to blindness. As the optic nerve deteriorates, the vessels die off and thin out, ultimately disappearing, with thin new capillaries forming to supply blood. In retina images, this can be observed in a red-free image, where the dead optic nerve appears as a dark shadow.
Similar to the ROI images, we utilized a modified attention U-net for constructing vascular images. The training involved using a vascular mask to ensure that vessels appear correctly in the input data. However, very few datasets possess a vascular mask for retina fundus images. Only the DRIVE [27] dataset and one other dataset were available, both of which have significantly limited data. Therefore, like the method used in IterNet [28], a recursive structure was employed, where the output of a U-net is fed back into the U-net to generate vascular images.

3.2. Color Palette

Color palettes were utilized to easily identify the characteristic thinning of the optic nerve bundles that occurs in glaucoma. The images were converted from an RGB three-channel data format to an RGBA four-channel format to represent luminance, and then these were transformed into grayscale before applying various palettes. Several transformations were experimented with from the diverse palettes available in the computer vision image libraries. Ultimately, ophthalmologists selected five specific palettes through a review and verification process. These included a binary series (BinaryR), a blue series (Bone, Mako, and Jet), and a red series (Gist-Heat). These palettes allow for the clear visualization of the structural features of the optic nerve bundles’ thickness, similar to how OCT equipment is used to measure the thickness of the optic nerve. Figure 4 schematically shows the process of applying color palettes.

3.3. Loss Function

In situations with data imbalance, using cross-entropy [29] alone in typical classification models has its limitations. We found this issue in object-detection models, which aim to locate and mark objects of interest in images with bounding boxes. The object-detection process involves identifying candidates in the image and determining whether they are objects of interest. Most areas are background, and the objects of interest are a minority, posing a significant problem. In order to address this, one common approach in object-detection models is the use of focal loss. Focal loss modifies the cross-entropy loss function by reducing the weight for well-learned classes and increasing it for classes that are not learning effectively. This feature allows more focused learning on minority classes, enhancing disease classification accuracy in scenarios with scarce data. This aligns with the goals of our research and significantly contributes to improving the classification of challenging data, such as those for glaucoma, compared to the classification of normal data.
Focal loss [30] is particularly meaningful in fields such as medical data, where the healthy data vastly outnumber disease data. Utilizing this loss function aligns well with the goals of our study, emphasizing the importance of higher classification accuracy for disease data over normal data, which is crucial for ensuring effective disease detection and management.
The equations below represent cross-entropy (1) and focal loss (2). y i denotes the probability distribution of the actual labels, and  y ^ i denotes the probability distribution of the predictions. α and γ are hyper-parameters used to address imbalanced samples. In order to mitigate data imbalance, we used α = 0.25 and  γ = 2. While cross-entropy uniformly learns from all classes, focal loss focuses on the classes that are misclassified, thereby improving the classification accuracy of those classes.
Cross Entropy ( y , y ^ ) = i = 1 N y i log ( y ^ i ) + ( 1 y i ) log ( 1 y ^ i )
Focal Loss ( y , y ^ ) = i = 1 N α ( 1 y ^ i ) γ y i log ( y ^ i )

3.4. Ensemble

By leveraging the unique features learned from each input data type, we constructed a final ensemble network based on the VLLM and achieved high accuracy. VLLM adapts a model originally used in natural language processing to address challenges in the vision domain. It delivers results through visual and language-based interactions in various applications, such as responding to visual questions and image searches.
Due to variations in how each input data influences network performance, we aimed to achieve high accuracy by constructing a final ensemble network. Specifically, we focused on analyzing glaucoma data more intensely than normal data to improve detection accuracy. Even if the classification from the original or cup-disk images is incorrect, if the classification from the vascular images or color palette is accurate, we weighted the results of the vascular and color palette classification models more heavily to obtain the final outcome. The classification results from each dataset are received and arranged in a flattened layer. The positions in this flattened layer contain the probability values from each of the input data before applying the softmax function. The scores are calculated by comparing these probability values with the actual correct answers. If a classification result is uniquely correct, its weight is increased. The newly determined ensemble score is turned into a positive number through exponential functions in the softmax process and normalized to a value between 0 and 1. This process is similar to the attention score mechanism in transformer models. This process can be checked in Algorithm 1 in the form of pseudocode.
Algorithm 1 Ensemble Weights
  1: Inputs:
  2: Q: Before Softmax Probability (batch_size, num_queries, d k )
  3: K: True label (batch_size, num_keys, d k )
  4: V: Ensemble Score (batch_size, num_keys, d v )
  5: Output:
  6: Binary Classification
  7: procedure Ensemble Weights( Q , K , V )
  8:         d k dimension of K along axis 2
  9:         e n s e m b l e _ s c o r e s dot product ( Q , transpose ( K , ( 0 , 2 , 1 ) ) ) / d k
10:      e n s e m b l e _ w e i g h t s softmax ( e n s e m b l e _ s c o r e s , axis = 1 )
11:      o u t p u t matmul ( e n s e m b l e _ w e i g h t s , V )
12:     return  o u t p u t , e n s e m b l e _ w e i g h t s
13: end procedure

4. Experiment Implementation

Figure 5 involves inputting retina fundus images and utilizing a modified attention U-Net along with color palettes to generate ROI, VROI, and Color Palette (JET, GIST-HEAT, BONE, BINARY_R, MAKO), respectively. Training is conducted using a pretrained EfficientNetV2 model, followed by a VLLM ensemble using the classification prediction results. Subsequently, the final classification outcome is obtained.

4.1. Data Argumentation

For data augmentation, we adjusted the size of input images to accommodate various sizes and cropped out background areas. We also applied techniques such as horizontal flipping, as images of the left eye need to mirror those of the right eye. Previous studies on glaucoma detection utilized additional data augmentation methods, such as image rotation and adding Gaussian noise. However, considering the importance of the optic cup-to-disc ratio as a critical indicator for diagnosing glaucoma, we refrained from using image-resizing methods that could alter this ratio. Instead, we chose to reduce the size of the images while preserving the original proportions.
Additionally, since retina fundus images are not typically captured in rotated positions, we did not use image rotation. We believe that altering medical data can impact the characteristics of the disease. Thus, we avoided using data augmentation methods that introduce transformations, such as adding noise. We systematically reduced the size of the images from their original dimensions down to 500 × 500, carefully cropping 10% from all four sides in stages to ensure that the optic nerve within the retina fundus images was not cut off. Horizontal flipping was applied to ensure symmetry between the corresponding left and right-eye images.
In order to address the issue of data imbalance, we conducted data augmentation to achieve a 1:1 ratio between normal and glaucoma cases. This approach maintains the integrity of medical imaging data while effectively increasing the dataset for balanced training.

4.2. Deep Learning Model

We received four types of data for analysis: original fundus images, cup-disk images, vascular images, and pseudo images. Each type of data was classified using a deep learning model, and the results from each input were combined using an ensemble approach to determine the final classification. For the initial values of our network, we used models trained on the ImageNet dataset. We constructed a network model that analyzes each of the four input data types and ensembles their respective results.
The training model was based on a modified version of EfficientNetV2 [31]. Instead of focusing solely on deepening the layers, as seen in earlier models, such as VggNet, ResNet, and Inception-ResNet, our model also incorporated approaches from models that emphasize cardinality—applying various sizes of convolution filters between layers, such as ResNext and MobileNet. Additionally, we considered models that have evolved based on the resolution of the input images.
EfficientNet V2 is an improved model focusing on speed and efficiency. In Figure 6, you can see this structure. It utilizes Fused-MBConv layers, which combine the traditional 1 × 1 and 3 × 3 convolutions into a single 3 × 3 convolution. This adaptation accelerates the training process right from the initial stages of input.
The vision transformer (ViT) [32] model is currently receiving significant attention across various fields due to its exceptional performance. Unlike traditional CNNs, the ViT processes information based on similarity calculations using the query, key, and value components. However, ViT requires a substantial amount of data, and in datasets where data are limited, CNNs may still yield better results. This is particularly true in the medical field, where data are often scarce. The use of CNN-based models is more common in such scenarios due to their adaptability to smaller datasets and the challenges associated with data augmentation, given the constraints of medical data. Thus, CNNs might be a more suitable choice under these conditions.

4.3. Datasets

REFUGE [33] (retina fundus glaucoma challenge) is a dataset provided to the Grand Challenge hosted by the Medical Image Computing and Computer Assisted Intervention Institute in Spain. The contests are given in the glaucoma classification, the segmentation of the optic disc and cup, and the segmentation of the macula. A total of 1200 sheets of data, with 400 sheets each for training, validation, and testing, are composed of 360 normal sheets and 40 glaucoma sheets. It has a JPG format, and the training data have a resolution of 2124 × 2056, and the validation and test data have a resolution of 1634 × 1634.
ORIGA [34] (an online retina fundus image database for glaucoma analysis and research) aims to provide clinical ground truth to benchmark segmentation and classification algorithms. It uses a custom-developed tool to generate manual segmentation for OD and OC. It also provides CDR and labels for each image as glaucomatous or healthy. This dataset has been used as a standard dataset in some of the recent state-of-the-art research for glaucoma classification. The dataset was collected by the Singapore Eye Research Institute and has 482 healthy images and 168 glaucomatous images.
The G1020 [35] dataset is a significant collection that is specifically designed to aid in the computer-aided detection and classification of glaucoma through retina fundus images. It includes 1020 high-resolution color fundus images collected under standard ophthalmological practices to provide a robust benchmark for glaucoma diagnosis. These images are annotated with critical details such as the vertical cup-to-disc ratio, the size of the neuroretinal rim across different quadrants, and the locations of the optic disc and optic cup. The dataset is composed of JPG images with a resolution of 3004 × 2423. It includes 580 images of normal data and 237 images of glaucoma data.
AI-HUB: This is a dataset built between 2018 and 2019 for Koreans led by Konyang University. It consists of wide-angle fundus images for macular degeneration and diabetic retinopathy and general fundus images for glaucoma. Three residents performed reading and inspection work to classify the data, and after two specialists performed reading and total inspection, only data with a 100% reading agreement among specialists were constructed as the final dataset. The general fundus image consisted of a total of 3372 images, including 1806 for glaucoma and 1566 for normal. Glaucoma has a resolution of 2796 × 2848, and normal has a resolution of 1964 × 2000. It was taken using Canon CR-2 equipment and is in jpg format.
As an ophthalmology hospital located in Daejeon, Korea, this is a private hospital that specializes in the treatment of glaucoma and cataract. Fundus images collected from Korean subjects consisted of a total of 583 images, including 299 normal and 284 glaucoma images. It has a resolution of 1270 × 793 and was used after converting to jpg format.
For datasets provided with separate training and testing sets, the data were split into a training-validation ratio of 8:2, forming the training and validation sets. For datasets where the training and testing sets were not provided separately, a ratio of 7:2:1 was used to split the data into training, validation, and testing sets. The training and validation sets were shuffled using the k-fold method. Table 1 summarizes the datasets we used. This study aimed for customized analysis tailored to the unique characteristics of each dataset, given that the imaging equipment used varies across datasets. Therefore, we did not mix it with other datasets.

4.4. Environment and Metrics
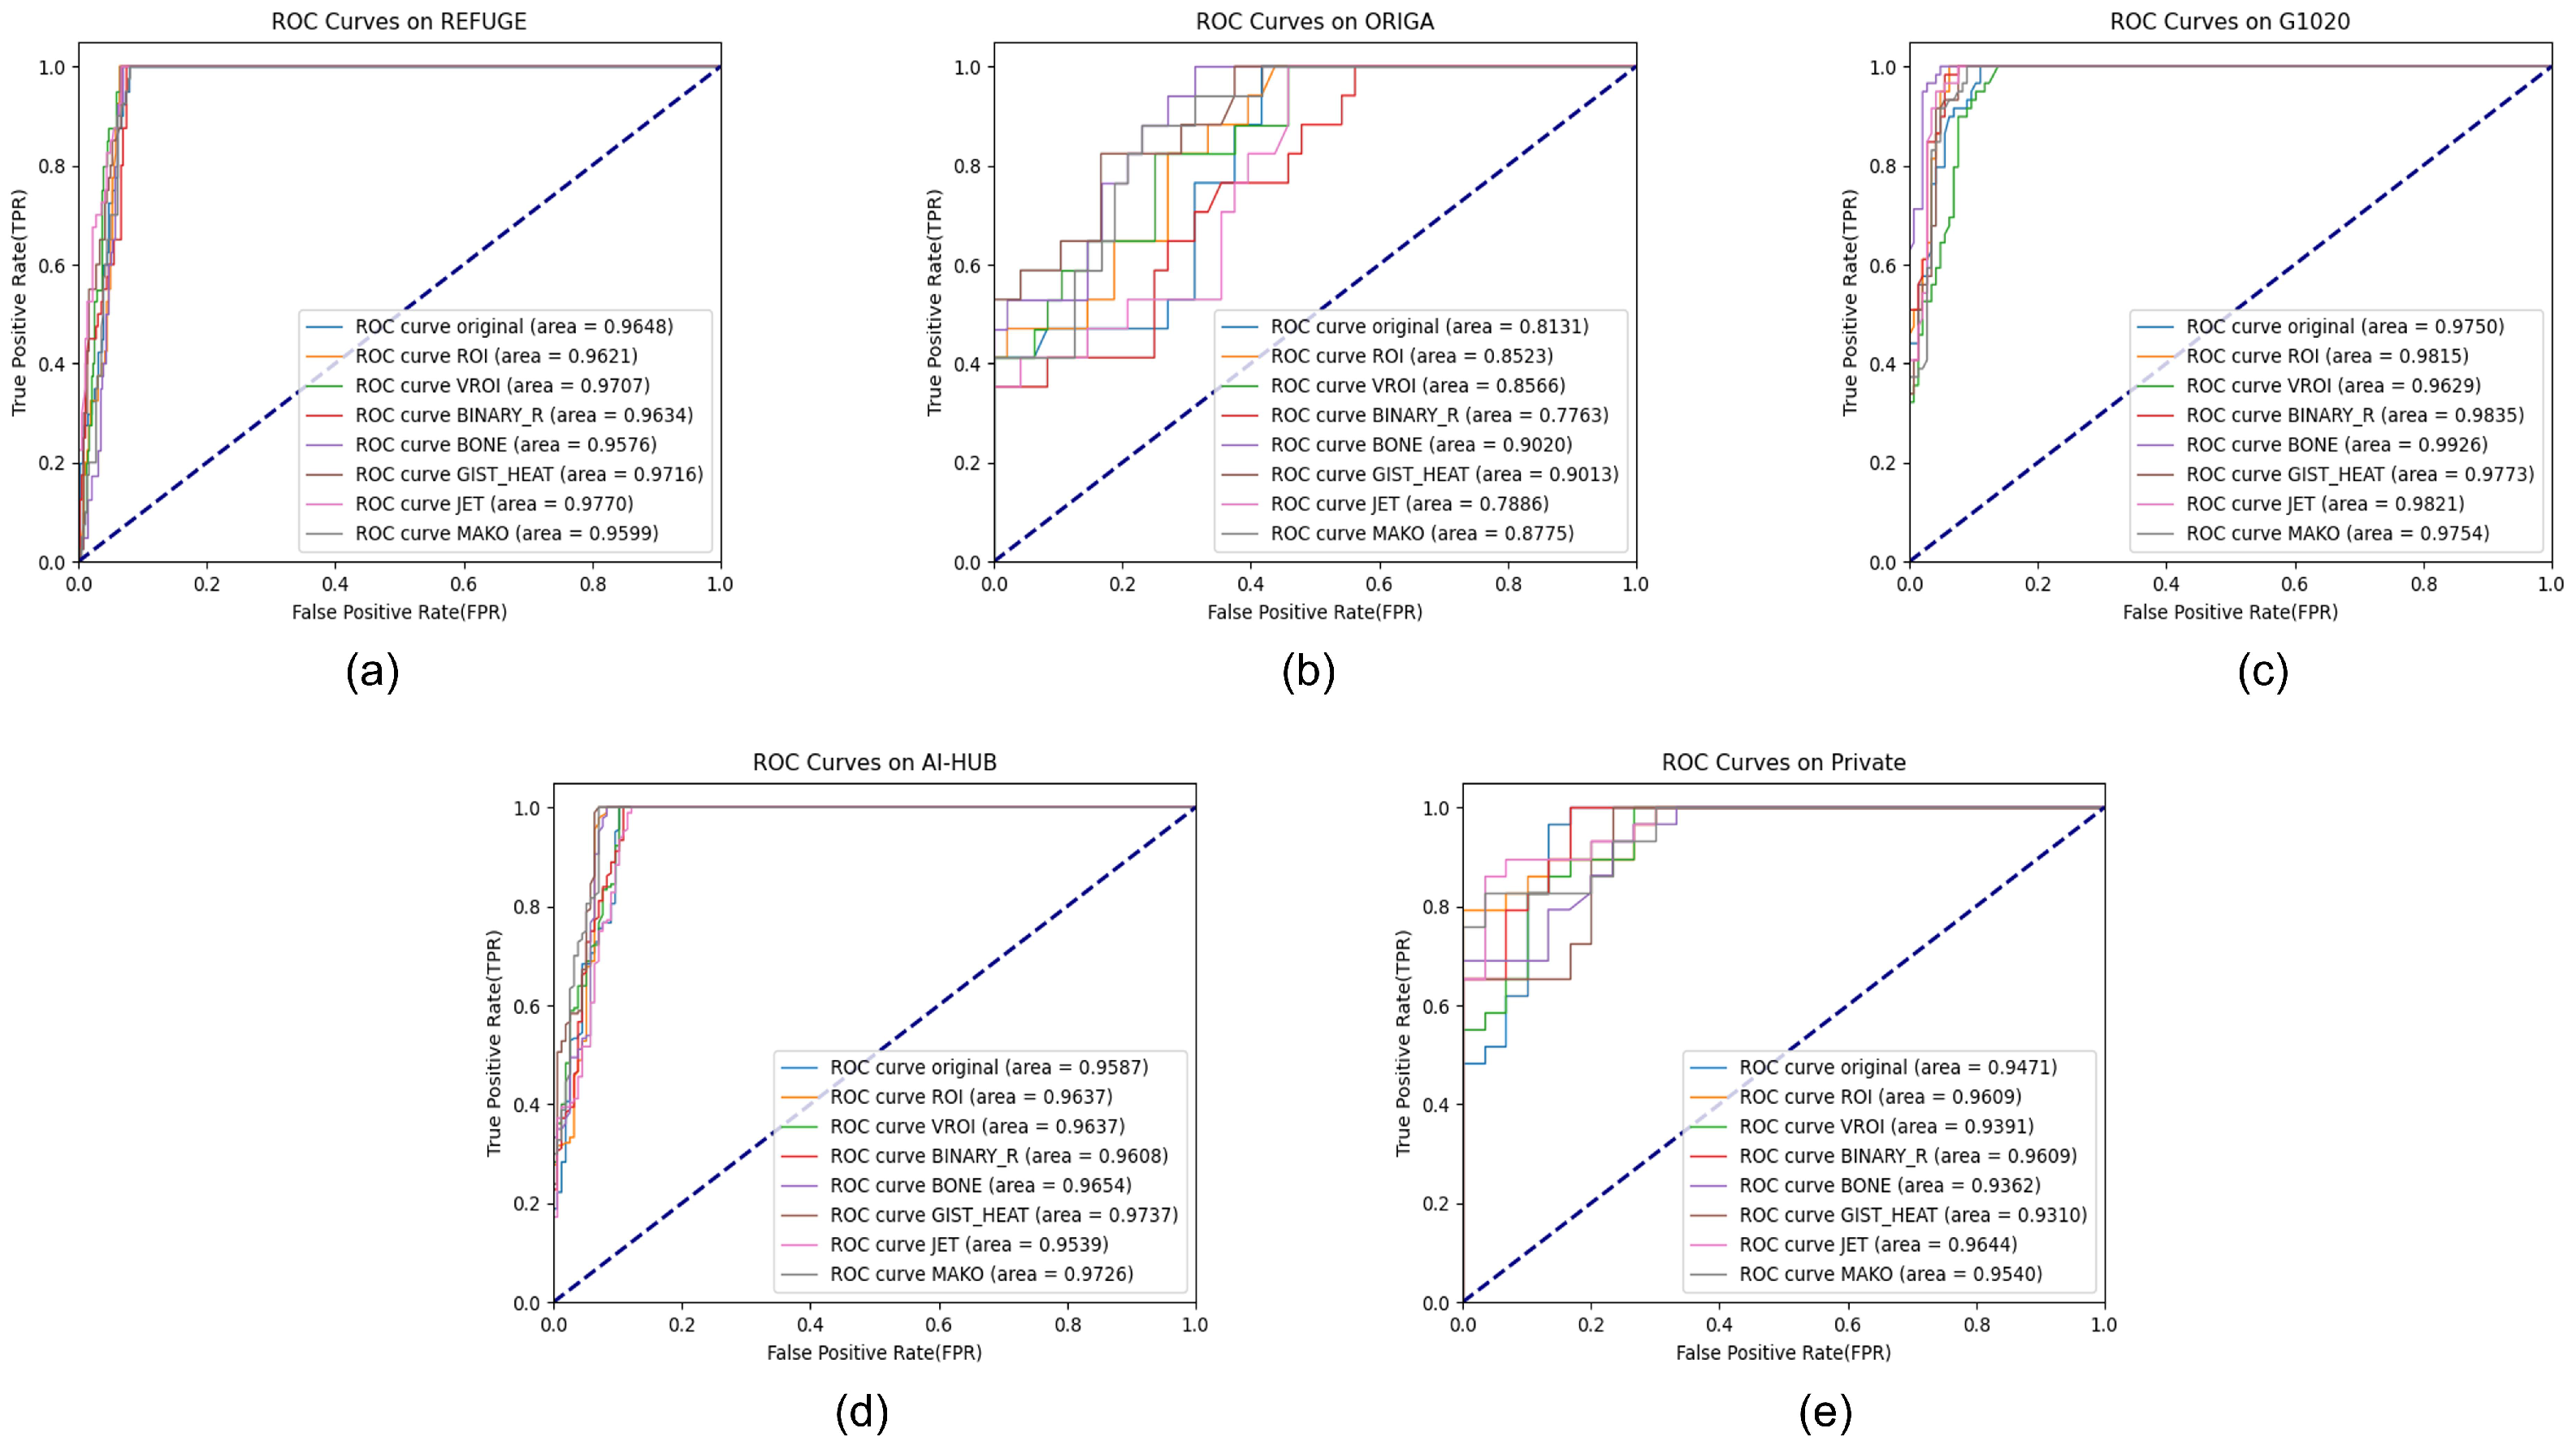
The experimental setup was conducted in a Linux environment, utilizing both PyTorch 1.7.1 and TensorFlow 2.10 frameworks. The batch size was set to 8, and the ADAM optimizer was used. The learning rate was adjusted according to the specific requirements of the experiments, ranging from 0.01 to 0.0001. This flexibility in adjusting the learning rate helped optimize the training process depending on the model’s performance and convergence rates during different phases of the experiment.
When assessing the system’s effectiveness, accuracy is a commonly used metric. It measures the proportion of correct predictions made by the classifier. The accuracy of a classifier is calculated by considering the total number of correct predictions divided by the total number of predictions made. Accuracy is evaluated using the following equation.
Accuracy ( ACC ) = T P + T N T P + T N + F P + F N
Sensitivity, also known as recall or the true positive rate, quantifies the ability of a classifier to correctly identify positive instances. It is calculated as the ratio of the number of true positive predictions to the total number of actual positive instances. Sensitivity is given as follows:
Sensitivity ( Recall ) = T P T P + F N
Specificity, also referred to as the true negative rate, measures the ability of a classifier to correctly identify negative instances. It is calculated as the ratio of true negative predictions to the total number of actual negative instances. Specificity is given as follows:
Specificity = T N F P + T N
Precision is the number of instances that are truly positive out of the total instances predicted as positive. Precision is given as follows:
Precision = T P T P + F P
The AUC curve, or Area Under the Curve, is a graphical representation commonly used in binary classification tasks to evaluate the performance of a model. It plots the true positive rate (TPR, Sensitivity) against the false positive rate (FPR, 1-Specificity) across different threshold values. A higher AUC value (closer to 1) indicates a better discrimination ability of the model, where it effectively distinguishes between positive and negative instances.
AUC = 0 1 TPR ( x ) d x , x = FPR

5. Results

5.1. REFUGE Dataset

We conducted experiments using a test dataset comprising 40 glaucoma images and 360 normal images. The results can be seen in Table 2. Using only the original fundus images, we achieved an accuracy of 0.9725, a sensitivity of 0.825, and a specificity of 0.9889. Compared to the glaucoma classification results based solely on fundus images, significant results were obtained with VROI data (sensitivity 0.8500) and JET (sensitivity 0.8750). The final ensemble results showed an accuracy of 0.9875, a sensitivity of 0.9000, a specificity of 0.9972, and an AUC of 0.9754. This represents an 8% increase in sensitivity and a 1% improvement in overall accuracy compared to retinal fundus images.
In the case of MAKO, although the classification accuracy for normal data increased (specificity 0.9889 to 1.0000), the results were unique compared to other data as the diagnosis of glaucoma decreased. Among the 40 glaucoma images used in the test, four images were not correctly classified by any of the eight models. Consequently, even the ensemble model did not improve the classification of these images.

5.2. ORIGA Dataset

The ORIGA dataset is known in other studies as well for showing low accuracy due to many of its images being darkly photographed, making it challenging to discern structural features based on contrast. We conducted experiments using a test dataset that included 17 glaucoma images and 48 normal images. In most studies using this dataset, the accuracy results ranged from 0.64 to 0.76. In our research, using the original data for training yielded an accuracy of 0.7231, a specificity of 0.8125, but a notably low sensitivity of 0.4706 compared to other datasets. However, with the BONE and GIST-HEAT color palettes, the sensitivity improved to over 0.7.
The final ensemble model in our study showed an accuracy of 0.8308, a sensitivity of 0.7647, and a specificity of 0.8542, achieving a performance improvement of 2% to 14% compared to previous studies. It has been established that the ORIGA dataset is particularly challenging for achieving high accuracy, especially in detecting glaucoma with low sensitivity (0.4706, 0.5294), confirming its status as a challenging dataset. When comparing the results with the retina fundus images, there was a dramatic increase in performance, with accuracy improving by 11% and sensitivity increasing by an impressive 29%. This is shown in Table 3.

5.3. G1020 Dataset

There were concerns that resizing high-resolution images in the G1020 dataset might result in a significant loss of features. However, contrary to these concerns, meaningful results were achieved. We conducted experiments using a test dataset that included 59 glaucoma images and 145 normal images. By using the original data, the accuracy was recorded at 0.9461, sensitivity at 0.8814, and specificity at 0.9724. Notably, improvements in glaucoma classification were observed with VROI data and the BONE (sensitivity 0.9661) and JET (sensitivity 0.9492) color palettes, as shown in Table 4.
The final ensemble results demonstrated an accuracy of 0.9853, a sensitivity of 0.9831, and a specificity of 0.9583, indicating robust performance across these metrics. These results highlight the effectiveness of the ensemble approach in enhancing the diagnostic accuracy of the dataset.

5.4. AI-HUB Dataset

We conducted experiments using a test dataset that included 180 glaucoma images and 156 normal images. In the AI-HUB dataset, we observed improved results for ROI (accuracy 0.9435; sensitivity 0.9611), MAKO (accuracy 0.9702; sensitivity 0.9778), and GIST-HEAT (accuracy 0.9613; sensitivity 0.9778) compared to the original data (accuracy 0.9405; sensitivity 0.9444; specificity 0.9359). The final ensemble results showcased an accuracy of 0.9702, a sensitivity of 0.9722, and a specificity of 0.9679. However, there were limitations in performance enhancement within the ensemble, as five normal data images could not be correctly identified by any model.
Specifically, in the MAKO color palette, while four misclassified images were correctly classified as normal by other input data, these classifications occurred with marginal probability values and, therefore, did not significantly influence the overall ensemble score. This indicates a potential area for further refinement in the ensemble methodology to better incorporate subtle classifications into the final results. This is shown in Table 5.

5.5. Private Dataset

An unpublished dataset consisting of 30 normal images and 29 glaucoma images was used for testing. Compared to the original data (accuracy 0.8305; sensitivity 0.7879), there was no significant improvement in the classification of glaucoma across any input model. However, there was an improvement (5.51%) in the accuracy of the normal data (specificity 0.8846 to 0.9333), leading to final results of an accuracy of 0.9322, a sensitivity of 0.9310, and a specificity of 0.9333, as shown in Table 6.
Given the nature of the data from a private clinic, where the majority are normal cases and glaucoma-suspect patients often visit temporarily, it was challenging for physicians to make definitive diagnoses of glaucoma based on these images without observing the progression of the condition. Therefore, it should be noted that the glaucoma images in this dataset were composed of cases where patients had repeatedly visited over several years and were definitively diagnosed with glaucoma, representing a small subset of all patients.
Table 7 presents the comparative analysis with previous studies. Many studies, as mentioned earlier, only mentioned AUC without providing a confusion matrix. Additionally, due to the issue of data scarcity, many studies combined multiple datasets for analysis, making it difficult to directly compare with our study. Nevertheless, the comparison of the results is as follows:
The results of the top four teams in the REFUGE competition ranged from 0.9885 (VRT team) to 0.856 AUC (Vismay et al. [36]), where Vismay et al. [36] achieved results similar to the best ones. For the ORIGA dataset, compared to the BAJWA study, we observed a 4% improvement in accuracy, and compared to Fan’s study, there was a 28% increase in accuracy. The AUC results were within the range of previous studies (AUC 0.83–0.84). Ayesha et al. [44] demonstrated the performance of their models on individual datasets, which is similar to our approach. However, since the test sets were augmented, the results may vary depending on the data augmentation techniques used. It is regrettable that direct comparisons were challenging due to the difficulty in determining how the data were composed, even with high accuracy. Despite various constraints, while direct comparisons were challenging, comparing results sporadically allowed us to conclude that obtaining similar or even superior results without combining multiple datasets is a meaningful analytical approach.
Figure 7 shows the analysis of test data using the best-performing models from each of the input data, represented by ROC curves. REFUGE shows an improvement in performance for VROI and JET, ORIGA in BONE and GIST-HEAT, and G1020 in BONE and JET. AI-HUB demonstrates a performance enhancement in ROI. In Figure 8, the confusion matrix represents the analysis results of the test dataset using the final ensemble model. Compared to utilizing retina fundus images as input data, an increase in accuracy (1–10%) and sensitivity (10–29%) is observed across all datasets.
Table 8 compares cross-entropy and focal loss, summarizing the results after ensemble learning across all input data. Although the accuracy might appear similar, a distinct difference is evident in sensitivity. The cross-entropy results in lower accuracy for glaucoma data due to its high accuracy for normal data. Consequently, even with ensemble methods, there is not a significant improvement in glaucoma data performance; instead, the accuracy increases as the correct predictions for normal data rise. These results demonstrate that focal loss, initially used in object detection, also proves effective in classification tasks by addressing class imbalance issues.

6. Limitation and Future Work

First, the diversity of color mapping, as shown in Figure 9, is problematic. Deciding on the appropriate palette required considerable time and effort. Although clinical physicians choose the color mapping based on their diagnostic perspective, this approach is inherently subjective. It is likely that among the color mappings we have not yet tried, there are those that could yield significant results. I would like to emphasize once again that our standard was based on a series of color mappings over time. This temporal approach to color mapping was selected to potentially reveal changes or patterns that might not be as noticeable with static or single-instance color mappings.
Secondly, the accurate visualization of blood vessels requires precise masks. However, data with masks is exceedingly rare, and even when this is available, the quantity is very limited. For datasets without masks, we relied on the results from training and evaluating datasets that do have masks, which makes it difficult to ensure the completeness of the vascular images. In particular, distinguishing between arteries and veins is crucial, as their differences can be pronounced in the presence of lesions. We aimed to construct data incorporating both arteries and veins, but assembling such datasets poses challenges, primarily due to the difficulty in obtaining continuous co-operation from experts. This limitation hinders the potential to fully leverage detailed vascular features for diagnostic enhancements.
Thirdly, it was challenging to build a continuous and granular model. While there are studies that have categorized glaucoma into stages such as early, middle, and late to research severity, the available data were severely limited. These data exhibit extreme data imbalance issues at each stage, necessitating a strategic approach in future research to address this challenge. Effective strategies might include developing sophisticated data augmentation techniques, leveraging synthetic data generation, or collaborating broadly to gather a more extensive and balanced dataset that adequately represents each stage of glaucoma for more nuanced modeling and analysis.
Lastly, we intend to develop a predictive model that uses time-series data to determine the likelihood of developing glaucoma in the future, even if the current state is normal. Given that glaucoma progresses without pain, predictive models are crucial. However, collecting longitudinal patient data over extended periods poses significant practical challenges and will not be an easy task. Such efforts require robust data infrastructure and long-term patient follow-up, which can be resource-intensive. Nonetheless, overcoming these challenges is essential for advancing early diagnosis and potentially improving outcomes for those at risk of developing glaucoma.

7. Discussion

We have proposed a deep learning-based primary screening diagnostic model focused on the accuracy of glaucoma classification. Reflecting medical knowledge of glaucoma, we composed four types of input data that can discern the structural features of the retina fundus images. We addressed the persistent issue of data imbalance in medical data through data augmentation and a modified loss function, which notably contributed to performance improvements by focusing specifically on glaucoma classification.
In order to enhance classification accuracy, we structured an ensemble model and calculated weights based on similarity to the correct answer to ensure that misclassified data could be correctly classified. The performance was validated across various datasets through cross-validation, demonstrating the robustness and reliability of our approach.
The results showed that the models developed for each dataset achieved 1% to 10% higher accuracy and 8% to 29% improved sensitivity compared to conventional single-image analysis. On the REFUGE dataset, we achieved a high accuracy of 0.9875 and a sensitivity of 0.9. In particular, for the ORIGA dataset, which is challenging in terms of achieving high accuracy, we confirmed a significant increase with an 11% improvement in accuracy and a 29% increase in sensitivity.

8. Conclusions

When compared to previous studies, the ORIGA dataset showed a 4% improvement in accuracy, and the REFUGE dataset achieved an AUC comparable to the best results in competitions. When compared according to the data type within each dataset, there was a 1–10% improvement in accuracy and an 8–29% increase in sensitivity relative to retina fundus images. We believe that applying this research to health screenings can contribute to public health improvement by enabling precise glaucoma diagnostics.

Author Contributions

Conceptualization, S.W. and D.-S.E.; methodology, S.W. and D.-S.E.; software, S.W.; validation, B.K. and J.K.; formal analysis, J.K.; investigation, B.K.; resources, S.W.; data curation, B.K. and J.K.; writing—original draft preparation, S.W.; writing—review and editing, D.-S.E. All authors have read and agreed to the published version of the manuscript.

Funding

This research received no external funding.

Institutional Review Board Statement

Not applicable.

Informed Consent Statement

Not applicable.

Data Availability Statement

The original contributions presented in the study are included in the article, further inquiries can be directed to the corresponding author.

Acknowledgments

The authors would like to thank the members of the Future Information Network Architecture Laboratory in Korea University.

Conflicts of Interest

The authors declare no conflicts of interest.

Abbreviations

The following abbreviations are used in this manuscript:
ROIRegion of interest
VROIVascular region of interest
ODOptic disc
OCOptic cup
CDRCup-disk ratio
ISNTInferior superior nasal temporal
VLLMVision Large language model
OCTOptical coherence tomography
SESqueeze and excitation
MBConvMobile inverted bottleneck convolution
AGAttention gate

References

  1. Yamamoto, T.; Kitazawa, Y. Vascular pathogenesis of normal-tension glaucoma: A possible pathogenetic factor, other than intraocular pressure, of glaucomatous optic neuropathy. Prog. Retin. Eye Res. 1998, 17, 127–143. [Google Scholar] [CrossRef] [PubMed]
  2. Nath, M.K.; Dandapat, S. Techniques of glaucoma detection from color fundus images: A review. IJ Image Graph. Signal Process. 2012, 4, 44–51. [Google Scholar] [CrossRef]
  3. Barros, D.M.; Moura, J.C.; Freire, C.R.; Taleb, A.C.; Valentim, R.A.; Morais, P.S. Machine learning applied to retinal image processing for glaucoma detection: Review and perspective. Biomed. Eng. Online 2020, 19, 20. [Google Scholar] [CrossRef] [PubMed]
  4. Phasuk, S.; Poopresert, P.; Yaemsuk, A.; Suvannachart, P.; Itthipanichpong, R.; Chansangpetch, S.; Manassakorn, A.; Tantisevi, V.; Rojanapongpun, P.; Tantibundhit, C. Automated Glaucoma Screening from Retinal Fundus Image Using Deep Learning. In Proceedings of the 2019 41st Annual International Conference of the IEEE Engineering in Medicine and Biology Society (EMBC), Berlin, Germany, 23–27 July 2019; pp. 904–907. [Google Scholar] [CrossRef]
  5. Cheng, J.; Yin, F.; Wong, D.W.K.; Tao, D.; Liu, J. Sparse dissimilarity-constrained coding for glaucoma screening. IEEE Trans. Biomed. Eng. 2015, 62, 1395–1403. [Google Scholar] [CrossRef] [PubMed]
  6. Chakravarty, A.; Sivaswamy, J. Glaucoma classification with a fusion of segmentation and image-based features. In Proceedings of the 2016 IEEE 13th international symposium on biomedical imaging (ISBI), Prague, Czech Republic, 13–16 April 2016; IEEE: New York, NY, USA, 2016; pp. 689–692. [Google Scholar]
  7. Mohamed, N.A.; Zulkifley, M.A.; Zaki, W.M.D.W.; Hussain, A. An automated glaucoma screening system using cup-to-disc ratio via simple linear iterative clustering superpixel approach. Biomed. Signal Process. Control 2019, 53, 101454. [Google Scholar] [CrossRef]
  8. Selvathi, D.; Prakash, N.; Gomathi, V.; Hemalakshmi, G. Fundus image classification using wavelet based features in detection of glaucoma. Biomed. Pharmacol. J. 2018, 11, 795–805. [Google Scholar] [CrossRef]
  9. Maheshwari, S.; Pachori, R.B.; Acharya, U.R. Automated diagnosis of glaucoma using empirical wavelet transform and correntropy features extracted from fundus images. IEEE J. Biomed. Health Inform. 2016, 21, 803–813. [Google Scholar] [CrossRef] [PubMed]
  10. Fu, H.; Cheng, J.; Xu, Y.; Zhang, C.; Wong, D.W.K.; Liu, J.; Cao, X. Disc-aware ensemble network for glaucoma screening from fundus image. IEEE Trans. Med. Imaging 2018, 37, 2493–2501. [Google Scholar] [CrossRef] [PubMed]
  11. Guo, F.; Mai, Y.; Zhao, X.; Duan, X.; Fan, Z.; Zou, B.; Xie, B. Yanbao: A mobile app using the measurement of clinical parameters for glaucoma screening. IEEE Access 2018, 6, 77414–77428. [Google Scholar] [CrossRef]
  12. Diaz-Pinto, A.; Morales, S.; Naranjo, V.; Köhler, T.; Mossi, J.M.; Navea, A. CNNs for automatic glaucoma assessment using fundus images: An extensive validation. Biomed. Eng. Online 2019, 18, 29. [Google Scholar] [CrossRef]
  13. Li, A.; Cheng, J.; Wong, D.W.K.; Liu, J. Integrating holistic and local deep features for glaucoma classification. In Proceedings of the 2016 38th annual international conference of the IEEE engineering in medicine and biology society (EMBC), Orlando, FL, USA, 16–20 August 2016; IEEE: New York, NY, USA, 2016; pp. 1328–1331. [Google Scholar]
  14. Bock, R.; Meier, J.; Nyúl, L.G.; Hornegger, J.; Michelson, G. Glaucoma risk index: Automated glaucoma detection from color fundus images. Med. Image Anal. 2010, 14, 471–481. [Google Scholar] [CrossRef] [PubMed]
  15. Krishnan, M.M.R.; Faust, O. Automated glaucoma detection using hybrid feature extraction in retinal fundus images. J. Mech. Med. Biol. 2013, 13, 1350011. [Google Scholar] [CrossRef]
  16. Al-Bander, B.; Al-Nuaimy, W.; Al-Taee, M.A.; Zheng, Y. Automated glaucoma diagnosis using deep learning approach. In Proceedings of the 2017 14th International Multi-Conference on Systems, Signals & Devices (SSD), Marrakech, Morocco, 28–31 March 2017; IEEE: New York, NY, USA, 2017; pp. 207–210. [Google Scholar]
  17. Christopher, M.; Belghith, A.; Bowd, C.; Proudfoot, J.A.; Goldbaum, M.H.; Weinreb, R.N.; Girkin, C.A.; Liebmann, J.M.; Zangwill, L.M. Performance of deep learning architectures and transfer learning for detecting glaucomatous optic neuropathy in fundus photographs. Sci. Rep. 2018, 8, 16685. [Google Scholar] [CrossRef] [PubMed]
  18. Gómez-Valverde, J.J.; Antón, A.; Fatti, G.; Liefers, B.; Herranz, A.; Santos, A.; Sánchez, C.I.; Ledesma-Carbayo, M.J. Automatic glaucoma classification using color fundus images based on convolutional neural networks and transfer learning. Biomed. Opt. Express 2019, 10, 892–913. [Google Scholar] [CrossRef]
  19. Chaudhary, P.K.; Pachori, R.B. Automatic diagnosis of glaucoma using two-dimensional Fourier-Bessel series expansion based empirical wavelet transform. Biomed. Signal Process. Control 2021, 64, 102237. [Google Scholar] [CrossRef]
  20. He, H.; Bai, Y.; Garcia, E.A.; Li, S. ADASYN: Adaptive synthetic sampling approach for imbalanced learning. In Proceedings of the 2008 IEEE International Joint Conference on Neural Networks (IEEE World Congress on Computational Intelligence), Hong Kong, China, 1–8 June 2008; IEEE: New York, NY, USA, 2008; pp. 1322–1328. [Google Scholar]
  21. Mukherjee, M.; Khushi, M. SMOTE-ENC: A novel SMOTE-based method to generate synthetic data for nominal and continuous features. Appl. Syst. Innov. 2021, 4, 18. [Google Scholar] [CrossRef]
  22. Tang, Y.; Zhang, Y.Q.; Chawla, N.V.; Krasser, S. SVMs modeling for highly imbalanced classification. IEEE Trans. Syst. Man, Cybern. Part B (Cybern.) 2008, 39, 281–288. [Google Scholar] [CrossRef] [PubMed]
  23. Siringoringo, R. Klasifikasi data tidak Seimbang menggunakan algoritma SMOTE dan k-nearest neighbor. J. Inf. Syst. Dev. (ISD) 2018, 3, 1. [Google Scholar]
  24. Sundin, P. Intuitive Colorization of Temperature in Thermal Cameras. KTH, School of Engineering Sciences (SCI), Applied Physics. 2015. Available online: https://urn.kb.se/resolve?urn=urn:nbn:se:kth:diva-162233 (accessed on 22 May 2024).
  25. Olalia, R.L., Jr.; Olalia, J.A.; Carse, M.G.F. Evaluating infrared thermal image’s color palettes in hot tropical area. J. Comput. Commun. 2021, 9, 37–49. [Google Scholar]
  26. ATN Corp. 1995–2024. Available online: https://www.atncorp.com/blog/black-and-white-thermal-imaging-vs-color-palettes-in-heat-vision-cameras (accessed on 22 May 2024).
  27. DRIVE. DRIVE 2012–2024. Available online: https://drive.grand-challenge.org/ (accessed on 22 May 2024).
  28. Li, L.; Verma, M.; Nakashima, Y.; Nagahara, H.; Kawasaki, R. IterNet: Retinal Image Segmentation Utilizing Structural Redundancy in Vessel Networks. arXiv 2019, arXiv:1912.05763. [Google Scholar]
  29. De Boer, P.T.; Kroese, D.P.; Mannor, S.; Rubinstein, R.Y. A tutorial on the cross-entropy method. Ann. Oper. Res. 2005, 134, 19–67. [Google Scholar] [CrossRef]
  30. Lin, T.Y.; Goyal, P.; Girshick, R.; He, K.; Dollár, P. Focal loss for dense object detection. In Proceedings of the IEEE International Conference on Computer Vision, Venice, Italy, 22–29 October 2017; pp. 2980–2988. [Google Scholar]
  31. Tan, M.; Le, Q. EfficientNetV2: Smaller Models and Faster Training. In Proceedings of the 38th International Conference on Machine Learning, PMLR, Virtual Event, 18–24 July 2021; Meila, M., Zhang, T., Eds.; Proceedings of Machine Learning Research. 2021; Volume 139, pp. 10096–10106. [Google Scholar]
  32. Dosovitskiy, A.; Beyer, L.; Kolesnikov, A.; Weissenborn, D.; Zhai, X.; Unterthiner, T.; Dehghani, M.; Minderer, M.; Heigold, G.; Gelly, S.; et al. An Image is Worth 16 × 16 Words: Transformers for Image Recognition at Scale. arXiv 2021, arXiv:2010.11929. [Google Scholar]
  33. Orlando, J.I.; Fu, H.; Breda, J.B.; Van Keer, K.; Bathula, D.R.; Diaz-Pinto, A.; Fang, R.; Heng, P.A.; Kim, J.; Lee, J.; et al. Refuge challenge: A unified framework for evaluating automated methods for glaucoma assessment from fundus photographs. Med. Image Anal. 2020, 59, 101570. [Google Scholar] [CrossRef]
  34. Zhang, Z.; Yin, F.S.; Liu, J.; Wong, W.K.; Tan, N.M.; Lee, B.H.; Cheng, J.; Wong, T.Y. Origa-light: An online retinal fundus image database for glaucoma analysis and research. In Proceedings of the 2010 Annual International Conference of the IEEE Engineering in Medicine and Biology, Buenos Aires, Argentina, 31 August–4 September 2010; IEEE: New York, NY, USA, 2010; pp. 3065–3068. [Google Scholar]
  35. Bajwa, M.N.; Singh, G.A.P.; Neumeier, W.; Malik, M.I.; Dengel, A.; Ahmed, S. G1020: A benchmark retinal fundus image dataset for computer-aided glaucoma detection. In Proceedings of the 2020 International Joint Conference on Neural Networks (IJCNN), Glasgow, UK, 19–24 July 2020; IEEE: New York, NY, USA, 2020; pp. 1–7. [Google Scholar]
  36. Agrawal, V.; Kori, A.; Alex, V.; Krishnamurthi, G. Enhanced optic disk and cup segmentation with glaucoma screening from fundus images using position encoded CNNs. arXiv 2018, arXiv:1809.05216. [Google Scholar]
  37. Sreng, S.; Maneerat, N.; Hamamoto, K.; Win, K.Y. Deep learning for optic disc segmentation and glaucoma diagnosis on retinal images. Appl. Sci. 2020, 10, 4916. [Google Scholar] [CrossRef]
  38. Chen, X.; Xu, Y.; Wong, D.W.K.; Wong, T.Y.; Liu, J. Glaucoma detection based on deep convolutional neural network. In Proceedings of the 2015 37th Annual International Conference of the IEEE Engineering in Medicine and Biology Society (EMBC), Milan, Italy, 25–29 August 2015; pp. 715–718. [Google Scholar]
  39. Saxena, A.; Vyas, A.; Parashar, L.; Singh, U. A glaucoma detection using convolutional neural network. In Proceedings of the 2020 International Conference on Electronics and Sustainable Communication Systems (ICESC), Coimbatore, India, 2–4 July 2020; IEEE: New York, NY, USA, 2020; pp. 815–820. [Google Scholar]
  40. Bajwa, M.N.; Malik, M.I.; Siddiqui, S.A.; Dengel, A.; Shafait, F.; Neumeier, W.; Ahmed, S. Two-stage framework for optic disc localization and glaucoma classification in retinal fundus images using deep learning. BMC Med. Inform. Decis. Mak. 2019, 19, 136. [Google Scholar]
  41. Ajitha, S.; Akkara, J.D.; Judy, M. Identification of glaucoma from fundus images using deep learning techniques. Indian J. Ophthalmol. 2021, 69, 2702–2709. [Google Scholar] [PubMed]
  42. Aziz-ur-Rehman; Taj, I.A.; Sajid, M.; Karimov, K.S. An ensemble framework based on Deep CNNs architecture for glaucoma classification using fundus photography. Math. Biosci. Eng. 2021, 18, 5321. Available online: https://link.gale.com/apps/doc/A686823558/AONE?u=anon~7c0fcd94&sid=googleScholar&xid=9729d182 (accessed on 25 May 2024). [CrossRef] [PubMed]
  43. Fan, R.; Alipour, K.; Bowd, C.; Christopher, M.; Brye, N.; Proudfoot, J.A.; Goldbaum, M.H.; Belghith, A.; Girkin, C.A.; Fazio, M.A.; et al. Detecting glaucoma from fundus photographs using deep learning without convolutions: Transformer for improved generalization. Ophthalmol. Sci. 2023, 3, 100233. [Google Scholar] [CrossRef]
  44. Shoukat, A.; Akbar, S.; Hassan, S.A.; Iqbal, S.; Mehmood, A.; Ilyas, Q.M. Automatic Diagnosis of Glaucoma from Retinal Images Using Deep Learning Approach. Diagnostics 2023, 13, 1738. [Google Scholar] [CrossRef]
Figure 1. Retina fundus image (on the left). In the provided images of the ROI for normal and glaucoma cases (on the right), the vertical dimension of the optic cup is referred to as the vertical cup diameter (VCD), and the vertical dimension of the optic disc is called the vertical disc diameter (VDD). These measurements are crucial for calculating the CDR, which is a significant parameter used in diagnosing glaucoma. The accurate measurement of VCD and VDD is essential for assessing the structural changes in the optic nerve head that are indicative of glaucoma.
Applsci 14 04588 g001
Figure 3. Modified Attention U-Net. The encoder part extracts features, and the decoder part uses these extracted features to generate images for specific purposes (ROI and VROI). The blue blocks represent convolution layers, the orange blocks represent pooling layers, and the red blocks represent attention gates.
Applsci 14 04588 g003
Figure 4. The process of color mapping using color palettes.
Applsci 14 04588 g004
Figure 5. The overall framework.
Applsci 14 04588 g005
Figure 6. EfficientNet V2 structure (on the left); Fused-MBConv and MBConv (on the right). MBConv: mobile vision convolutional network; SE: squeeze and excitation; FC: full connect; H: height; W: width; C: number of channels.
Applsci 14 04588 g006
Figure 7. AUCs of each dataset. (a) REFUGE, (b) ORIGA, (c) G1020, (d) AI-HUB, and (e) Private dataset. These results are the individual outcomes for each of the input data before the ensemble.
Applsci 14 04588 g007
Figure 8. Confusion matrix of ensemble result for each dataset. (a) REFUGE; (b) ORIGA; (c) G1020; (d) AI-HUB; (e) Private dataset.
Applsci 14 04588 g008
Figure 9. Appearance after applying various palettes.
Applsci 14 04588 g009
Table 1. Datasets used in this work.
DatabaseHealthy (Normal)Glaucoma (Abnormal)Resolution
REFUGE14401602124 × 2056 (train), 1634 × 1634 (test)
ORIGA4821653072 × 2048
G10206252963004 × 2423
AI-HUB 1156618062796 × 2848 (Healthy), 1964 × 2000 (Glaucoma)
Private 22992841270 × 793
1 These data are public, but for more detailed information, please contact the respective hospital. 2 These data are from a private hospital dataset and are not disclosed.
Table 2. Summarized glaucoma classification result of REFUGE.
ImageConfusion MatrixAccuracySensitivitySpecificityPrecision
RAW3370.97250.82500.98890.8919
4356
ROI3190.95750.77500.97780.7949
8352
VROI3460.96000.85000.97220.7727
10350
COLORMAP (BINARY_R)3280.97500.80000.99440.9412
2358
COLORMAP (BONE)3370.96750.82500.98330.8462
6354
COLORMAP (GIST_HEAT)30100.95750.75000.98060.8108
7353
COLORMAP (JET)3550.97750.87500.98890.8974
4356
COLORMAP (MAKO)25150.96250.62501.00001.0000
0360
Ensemble3640.98750.90000.99720.9730
1359
Table 3. Summarized glaucoma classification result of ORIGA.
ImageConfusion MatrixAccuracySensitivitySpecificityPrecision
RAW890.72310.47060.81250.4706
939
ROI980.78460.52940.87500.6000
642
VROI7100.72310.41180.83330.4667
840
COLORMAP (BINARY_R)6110.64620.35290.75000.3333
1236
COLORMAP (BONE)1250.80000.70590.83330.6000
840
COLORMAP (GIST_HEAT)1340.80300.76470.81630.5909
940
COLORMAP (JET_MPL)980.72310.52940.79170.4737
1038
COLORMAP (MAKO)890.69230.47060.77080.4211
1137
Ensemble1340.83080.76470.85420.6500
741
Table 4. Summarized glaucoma classification result of G1020.
ImageConfusion MatrixAccuracySensitivitySpecificityPrecision
RAW5270.94610.88140.97240.9286
4141
ROI5180.93140.86440.95860.8947
6139
VROI5450.92650.91530.93100.8438
10135
COLORMAP (BINARY_R)5450.96080.91530.97930.9474
3142
COLORMAP (BONE)5720.97550.96610.97930.9500
3142
COLORMAP (GIST_HEAT)5090.92650.84750.95860.8929
6139
COLORMAP (JET_MPL)5630.96080.94920.96550.9180
5140
COLORMAP (MAKO)5540.96570.93220.97930.9483
3142
Ensemble5810.98530.98310.98620.9667
2143
Table 5. Summarized glaucoma classification result of AIHUB.
ImageConfusion MatrixAccuracySensitivitySpecificityPrecision
RAW170100.94050.94440.93590.9444
10146
ROI17370.94350.96110.92310.9351
12144
VROI169110.93450.93890.92950.9389
11145
COLORMAP (BINARY_R)17280.95540.95560.95510.9609
7149
COLORMAP (BONE)170100.94640.94440.94870.9551
8148
COLORMAP (GIST_HEAT)17640.96130.97780.94230.9514
9147
COLORMAP (JET_MPL)168120.93750.93330.94230.9492
9147
COLORMAP (MAKO)17640.97020.97780.96150.9670
6150
Ensemble17550.97020.97220.96790.9722
5151
Table 6. Summarized glaucoma classification result of private dataset.
ImageConfusion MatrixAccuracySensitivitySpecificityPrecision
RAW2630.83050.78790.88460.8966
723
ROI2720.86440.81820.92310.9310
624
VROI2540.77970.73530.84000.8621
921
COLORMAP (BINARY_R)2720.84750.79410.92000.9310
723
COLORMAP (BONE)2720.84750.79410.92000.9310
723
COLORMAP (GIST_HEAT)2630.81360.76470.88000.8966
822
COLORMAP (JET)2630.89830.89660.90000.8966
327
COLORMAP (MAKO)2630.81360.76470.88000.8966
822
Ensemble2720.93220.93100.93330.9310
228
Table 7. Comparison with the existing state-of-the-art methods of glaucoma classification.
AuthorMethodDatabasePerformance
VRT [33]custom CNNREFUGEAUC: 0.9885
SDSAIRC [33]ResNet-50REFUGEAUC: 0.9817
CUHKMED [33]-REFUGEAUC: 0.9644
NKSG [33]SENetREFUGEAUC: 0.9587
Mammoth [33]ResNet18, CatGANREFUGEAUC: 0.9555

Vismay et al. [36]
DenseNet201, ResNet18
ResNet18
REFUGE
DRISHTI-GS1
Specificity: 0.75
AUC: 0.856, Sensitivity: 0.85
SRENG et al. [37]Pretrained CNN
SVM
REFUGE
REFUGE
ACC: 0.9559
AUC: 0.9510
CHEN et al. [38]6 layers CNNORIGA, SCESAUC: 0.831
LI et al. [13]VGG CNNORIGAAUC: 0.8384
Saxena et al. [39]CNNORIGA, SCESAUC: 0.822
BAJWA et al. [40]CNNORIGAACC: 0.7967
AUC: 0.8487
Ajitha et al. [41]CNNHRF, ORIGA, DRISHTI-GS1ACC: 93.86
Rehman et al. [42]Custom CNNACRIMA, ORIGA, RIM-ONEACC: 99.5
Chaudhary et al. [19]Ensemble ResNetRIM-ONE, ORIGA, DRISHTI-GS1ACC: 0.91
AUC: 83.3
Fan et al. [43]CNNORIGAACC: 0.55
Ayesha et al. [44]ResNet50G1020ACC: 0.9848
AUC: 0.97
ORIGAACC: 0.9259, Sensitivity: 0.9839
ProposedEfficientNetV2REFUGEACC: 0.9875
AUC: 0.9880
Sensitivity: 0.9
ORIGAACC: 0.8308
AUC: 0.8452
Sensitivity: 0.7647
G1020ACC: 0.9853
AUC: 0.9846
Sensitivity: 0.9831
AI-HUBACC: 0.9702
AUC: 0.9759
Sensitivity: 0.9722
PrivateACC: 0.9322
AUC: 0.9827
Sensitivity: 0.9310
Table 8. Comparison of cross-entropy and focal loss.
DatabaseCross EntropyFocal Loss
REFUGEACC: 0.9775, Sensitivity: 0.7500ACC: 0.9875, Sensitivity: 0.9000
ORIGAACC: 0.7423, Sensitivity: 0.6042ACC: 0.8308, Sensitivity: 0.7647
G1020ACC: 0.9784, Sensitivity: 0.8644ACC: 0.9853, Sensitivity: 0.9831
AI-HUBACC: 0.9554, Sensitivity: 0.9356ACC: 0.9702, Sensitivity: 0.9722
PrivateACC: 0.8644, Sensitivity: 0.8042ACC: 0.9322, Sensitivity: 0.9310
Disclaimer/Publisher’s Note: The statements, opinions and data contained in all publications are solely those of the individual author(s) and contributor(s) and not of MDPI and/or the editor(s). MDPI and/or the editor(s) disclaim responsibility for any injury to people or property resulting from any ideas, methods, instructions or products referred to in the content.

