Article

Green Synthesis of Nanoparticles Containing Zinc Complexes and Their Incorporation in Topical Creams with Antimicrobial Properties

by
Emil Ioan Muresan
1,*,
Aurel Pui
2,
Corina Cernatescu
1,
Ramona Cimpoesu
3,
Cristina Elena Horhogea
4,
Bogdan Istrate
5 and
Cristina Mihaela Rîmbu
4,*
1
Department of Organic, Biochemical and Food Engineering, “Cristofor Simionescu” Faculty of Chemical Engineering and Environmental Protection, “Gheorghe Asachi” Technical University of Iasi, 73 Prof. Dr. Docent D. Mangeron Blvd., 700050 Iasi, Romania
2
Department of Chemistry, Faculty of Chemistry, “Alexandru Ioan Cuza” University of Iasi, Bd. Carol I 11, 700506 Iasi, Romania
3
Department of Materials Science, Faculty of Materials Science and Engineering, “Gheorghe Asachi” Technical University of Iasi, 41A Prof. Dimitrie Mangeron Blvd., 700050 Iasi, Romania
4
Department of Public Health, “Ion Ionescu de la Brad” Iasi University of Life Sciences, 8 Mihail Sadoveanu Alley, 707027 Iasi, Romania
5
Department of Mechanical Engineering, Mechatronics and Robotics, Faculty of Mechanical Engineering, Mechatronics and Robotics, “Gheorghe Asachi” Technical University of Iasi, 43 Prof. Dimitrie Mangeron Blvd., 700050 Iasi, Romania
*
Authors to whom correspondence should be addressed.
Appl. Sci. 2024, 14(11), 4612; https://doi.org/10.3390/app14114612
Submission received: 18 April 2024 / Revised: 24 May 2024 / Accepted: 25 May 2024 / Published: 27 May 2024

Abstract

:
This article reports on a new way of valorizing vine leaves waste as a renewable resource of polyphenols. The nanoparticles containing zinc complexes were prepared by a green synthesis method using the aqueous extract of vine leaves as a natural source of ligands for the complexation of zinc ions. The prepared nanoparticles were characterized by UV-Vis spectroscopy, Fourier transform infrared spectroscopy (FTIR), and scanning electron microscopy (SEM) in conjunction with energy dispersive X-ray spectroscopy (EDX). Another objective of this study was to obtain a cream into which the biosynthesized nanoparticles would be incorporated. In the formulation of the new cream, we aimed to use the minimal required amounts of synthetic emulsifiers and to use natural products as co-emulsifiers or as viscosity modifiers. The organoleptic characteristics and the physicochemical properties of the obtained creams were evaluated. The experimental results confirmed that the creams wherein the nanoparticles containing zinc complexes were incorporated exhibited antimicrobial activity against the bacterial species Staphylococcus aureus, methicillin-resistant Staphylococcus aureus, Escherichia coli and the yeast Candida albicans. The values obtained for pH, viscosity and spreading diameter of the creams produced indicate that these formulations are suitable for topical applications.

Graphical Abstract

1. Introduction

The human skin hosts many species of bacteria and fungi, which together constitute the cutaneous microbiota. Cutaneous infections present an increased risk of complications, leading often to severe microbial infections [1]. One of the Gram-positive bacteria that causes skin and soft tissue infections is Staphylococcus aureus, whichis considered a highly dangerous pathogen according to the latest WHO global report concerning the resistance of microorganisms to antibiotics [2]. The introduction of penicillin helped to treat many patients with severe staphylococcal infections. However, after several years of clinical use, the Staphylococcus aureus bacteria became resistant to penicillin due to the production of β-lactamases. Afterward, methicillin, an antibiotic that can inactivate the β-lactamases, was synthesized, but shortly after the introduction of methicillin, new strains of Staphylococcus aureus were identified that exhibited resistance to the β-lactam antibiotics, known as methicillin-resistant Staphylococcus aureus (MRSA) [3]. Yeasts, like Candida albicans, a pathogenic yeast that can survive in various internal organs/systems of the body and on the surface of the skin, constitutes another threat to the life of patients with reduced immunity. Invasive candidiasis can be transmitted through surgery, burns and skin wounds. Usually, Candida albicans infections are treated using antifungal drugs. Although there are many classes of antifungal drugs, only a few of them can be used to treat systemic infections with various Candida species since most of the antifungal drugs present a series of limitations in terms of toxicity, limited action spectrum, route of administration, high cost and availability. The emergence of Candida albicans strains resistant to the action of the antifungal agents limits the use of these drugs [4]. To overcome these limitations, several studies have sought to identify new therapeutic strategies for treating candidiasis [5]. Nanoparticles (NP) act simultaneously by different mechanisms against microorganisms and thus become a promising alternative in the fight against antibiotic resistance [6,7,8]. The metals-containing nanoparticles have the advantage of acting simultaneously by multiple mechanisms against the microbes, and therefore, it is difficult for microbial cells to resist the action of nanoparticles. Different techniques were used to synthesize nanoparticles containing metals that can be grouped into physical methods, chemical methods and biological methods. Many species of plants, algae, fungi, bacteria and viruses were used to synthesize inorganic nanoparticles like silver, gold, copper, CuO, TiO2 and ZnO [9,10,11,12,13,14,15,16]. The green synthesis using different perennial plant species, available in large quantities, is a simple and cost-effective approach that is preferred to the chemical methods since these ones usually are more laborious, have higher production costs and might generate hazardous by-products, with adverse effects in the medical applications [17].
A significant number of scientific papers regarding the processing of grapevine by-products have been published so far, but most of them are focused on the valorisationof grape seeds, stems and skins [18,19,20,21]. There is only a limited number of studies that approach the valorisationof the residual vine leaves coming from the cleaning of grape vines. The available information regarding the chemical composition of the vine leaves indicates the presence of carboxylic acids, polyphenols, enzymes, vitamins, carotenoids and minerals such as K, Na, Ca, Mg, Fe, P, S [22,23]. The most important components of the vine leaves are the polyphenols, which can be divided into phenolic acids (derivatives of benzoic acid and derivatives of cinnamic acid), flavonoids (flavones, flavonols, flavanols, flavanones, isoflavones, chalcones and anthocyanins), stilbenes, lignans and tannins (hydrolysable tannins and condensed tannins) [24,25]. The vine leaves waste constitutes a cheap and renewable natural resource that can be used as a natural source of polyphenols to obtain zinc complexes. It is known that zinc-containing compounds exhibit numerous beneficial biological properties, such as antioxidant activity, sun screening properties and antimicrobial activity against a wide range of bacteria and fungi [26,27,28,29].
Considering these, the objectives of the study were (1) the obtaining of nanoparticles containing zinc complexes using as ligands the polyphenols coming from the vine leaves, (2) the formulation of some topical creams thatincorporate the nanoparticles containing zinc complexes and (3) the evaluation of the antimicrobial activity of these cream formulations.

2. Materials and Methods

2.1. Preparation of Aqueous Vine Leaves Extract

Plant waste consisting of vine leaves was collected from the same location in North-Eastern Romania between September 2022 and October 2022. Before use, the vine leaves were washed with tap water and then with distilled water to remove the dust and other impurities; after that, they were dried at room temperature (≈30 °C). The dried vine leaves were ground into a fine powder using a mechanical grinder. To prepare the aqueous extract, 60 g of dried vine leaves and 600 mL of distilled water were placed in a round bottom flask of 1000 mL capacity, hermetically sealed. The mixture was heated under stirring for 90 min at 95 °C using a digital magnetic stirrer with heating MSH-20D-Set (Witeg, Wertheim, Germany). The mixture was first filtered through a fine cotton cloth (the solid part was finally squeezed out to obtain a high yield of extraction). The aqueous extract was finally filtered under vacuum using a Whatman No.1 filter paper. A part of the aqueous extract was evaporated at a temperature of 50 °C in a rotary evaporator and used to obtain the vine leaves solid extract nanoparticles (VLSENPs), while the other part was used to obtain the nanoparticles containing the zinc complexes (ZnNPs).

2.1.1. Determination of Total Polyphenols Content

The total polyphenols content from the vine leaves extract was determined by the Folin–Ciocalteu colorimetric method, according to the procedure described by Singleton and Rossi with slight modifications [30,31]. Gallic acid was used as a standard for the plotting of the calibration curve. Next, 0.50 mL of aqueous vine leaves extract/respectively 0.50 mL of a standard solution of gallic acid (20, 40, 60, 80 and 100 μg/mL) was mixed with 2.5 mL of Folin–Ciocalteu reagent (previously diluted in a ratio of 1:10 with distilled water). After 5 min, 2 mL of sodium carbonate solution (7.5% w/w) was added, and the reaction mixture was kept at room temperature for 30 min. Thereafter, the reaction mixture was diluted by the addition of 15 mL of distilled water. The absorbance was measured on a UV–vis spectrophotometer at the 760 nm wavelength using distilled water as a blank sample. The experiment was performed in triplicate, and the average value of the obtained absorbances wasused in the calculations.

2.1.2. Determination of Total Flavonoids Content

The total flavonoid content was measured by the aluminium chloride colorimetric assay [32]. Quercetin was used as a standard for the plotting of the calibration curve. One millilitre of aqueous vine leaves extract/respectively, 1 mL of a standard solution of quercetin (20, 40, 60, 80 and 100 μg/mL) and 3 mL of 5% sodium nitrite solution were mixed with 40 mL of distilled water. Following an incubation at room temperature for 5 min, 3 mL of 10% aluminium chloride solution was added. After 6 min of reaction, 20 mL of 1 M sodium hydroxide was added to the mixture. Afterward, the mixture was diluted by adding 33 mL of distilled water and mixed thoroughly. The absorbance was measured at 510 nm using distilled water as a blank sample. The samples were analysed in triplicate.

2.2. Synthesis and Characterization of the Nanoparticles Containing Zinc Complexes

2.2.1. Synthesis of the Nanoparticles Containing Zinc Complexes

25 mL of the aqueous vine leaf extract and 15 mL of 10% zinc acetate solution were stirred at room temperature for 4 h using a magnetic stirrer at a stirring speed of 200 rpm, resulting in a brown precipitate. The obtained precipitate was filtered, washed with distilled water, dried in an oven at 60 °C and ground until a fine powder was obtained. The brown-coloured fine powder was analysedby FTIR, EDX-SEM and UV–Vis.

2.2.2. Characterization of the Nanoparticles Containing Zinc Complexes

SEM-EDX analysis. SEM micrographs and EDX spectra of the sample (in powder form) were performed using a Quanta 200 scanning electron microscope (SEM) (FEI Company (Hillsboro, OR, USA)) equipped with an EDAX Genesis 400 with Si(Li) Sapphire detector (Berlin, Germany) working in low-vacuum mode, at 20 kV with a large field detector (LFD). The morphology of the samples was analysedusing a Carl Zeiss (Jena, Germany) NEON 40 EsBCrossBeam SEM.
XRD analysis. The wide-angle X-ray diffraction (XRD) spectrum of the sample was recorded on a modular powder Philips X’PERT (Malvern, UK) diffractometer (MPD) in the 2θ range of 10.0016 ≤ 2θ ≤ 119.9939°, with a step size of 0.0131°, using a nickel-filtered Cu Kα radiation (KAlpha1 = 1.54060 Å; KAlpha2 = 1.54443 Å; K-A2/K-A1 Ratio = 0.50). Other anchor scan parameters were goniometer radius 240 mm, Dist. Focus-Diverg. Slit 100 mm.
FTIR analysis. The Fourier transform mid-infrared spectrum was recorded on a Jasco FT-IR 660+ spectrometer (Kyoto, Japan) equipped with an infrared standard source, potassium bromide beam splitter and TGS detector system using the conventional KBr disk technique. The registrations were performed in transmission mode in the wavenumber range 4000–400 cm−1 with a resolution of 4 cm−1 by the co-addition of 32 scans.
UV–vis spectroscopy. The UV-Vis diffuse reflectance spectrum was recorded on a Jasco V-750 UV-Visspectrophotometer (Hachioji, Tokyo, Japan) equipped with an integrating sphere assembly in the 190–900 nm wavelength range using barium sulphateas a reference.

2.3. Formulation and Evaluation of the Topical Creams That Contain ZnNPs

Therapeutic creams intended to be used for preventing and treating skin infections caused by bacteria or fungi were obtained by incorporatingnanoparticles containing zinc complexes into the creams.

2.3.1. Formulation of the Creams

Cream S1 was prepared by mixing the oily phase containing beeswax + olive oil + Span 80 with the aqueous phase containing chitosan, gelatine, glycerine, and Tween 80. To obtain the oily phase, the beeswax, together with the olive oil in which the Span 80 °C surfactant was dissolved, were heated to a temperature of 69 °C ± 2 °C until the complete melting of the wax. The aqueous solutionwas then gradually added, under stirring, over the oily phase (prepared at a temperature of 55 °C ± 2 °C) that contained Tween 80, glycerine, gelatine and chitosan. Cream S2 was prepared by the same method, but in the aqueous phase, 0.20 g of grapevine leaves solid extract was added. Creams S3, S4, S5 and S6 were prepared in the same way as cream S1, the difference consisting in the fact that in the aqueous phase used to obtain the creams, there were additionally added 0.20 g, 0.30 g, 0.40 g and, respectively, 0.50 g of ZnNPs. The compositions of the prepared creams are shown in Table 1.

2.3.2. Evaluation of the Creams

Microscopic analysis of emulsions
The microscopic images of cream formulations were taken after 24 h of storage using a KRUSS optical microscope equipped with a photo-digital camera (Nikon, Coolpix P 5100 (Tokyo, Japan)).
Organoleptic characteristics
The organoleptic characteristics of the creams (homogeneity, texture, color, stability, odor) were observed.
Determination of pH
One gram of each cream formulation was dispersed in 100 mL of deionized water and stored for 2 h. pH of the formulations was determined at room temperature using a HI8010 (Hanna instruments, Leighton Buzzard, UK) pH meter. For each cream, the pH was measured in triplicate. The mean values and the ± standard deviations were calculated.
Determination of viscosity
The viscosity of the formulated creams was determined at room temperature with a PCE-RVI 1ViscometerDeutschland GmbH viscometer using the spindle number 4. The stirring speed was set to 6 rpm. All viscosity measurements were performed in triplicate. The mean values and the ± standard deviations were calculated.
Spreadability
The spreadability of the cream formulations was determined by the parallel plate method [33]. Two glass slides of 20/20 cm were selected. 1 g of sample was applied between the two glass plates. Upon the upper glass plate was placed a weight with the mass (m) of 100 g so that the cream between the two slides was pressed uniformly to form a thin layer. After one minute from the placing of the weight, the diameter of the sample (d) was measured. The spreading diameter of each cream formulation (cm) was measured in triplicate to obtain the average spreading diameter ± standard deviation (SD).
Irritancy test
The testing of the skin irritation was carried out on five volunteers. A half gram of cream was applied on the forearm skin area of each volunteer for 24 h. After removal of the cream, the subjects were examined for 24 h, at 2 h intervals, to identify the occurrence of any erythema, redness, or sensation of itching.
‘In vitro’ evaluation of antibacterial activity
Antimicrobial activity testing was performed under the specific conditions for in vitro biological testing by exposing some samples to different microbial cultures. The test methods are selected and adapted according to the nature of the samples. The principle of these methods is based on the ability of molecules with antimicrobial properties to diffuse into the culture media used for microbial development and to interact with the microbial cells against which they exert an inhibitory effect or a microbicidal (bactericidal/fungicidal) activity. The antimicrobial activity of the cream samples (S1, S2, S3, S4, S5, S6) was tested against the bacterial species Staphylococcus aureus (ATCC 25923), Methicillin-resistant Staphylococcus aureus (MRSA ATCC 33591), Escherichia coli (ATCC 25922) and the yeast species Candida albicans (ATCC 90028), using the standardized Kirby–Bauer diffusion susceptibility method adapted for this type of sample.
Suspensions were prepared from the 24-h microbial cultures at a cell density of 1.5 × 10⁸ CFU/mL, corresponding to a 0.5 McFarland standard. On the surface of the culture media, Mueller Hinton Agar (Oxoid, for bacteria) and Potato Dextrose Agar (Oxoid, for yeast), previously added to the Petri dishes, 1 mL of the microbial suspension was spread. A volume of 100 µL of sample was applied using a dosing syringe. Plates were incubated at 37 °C for 24–48 h. The antimicrobial effect is represented by the width of the inhibition zone between the sample’s outer edge and the microbial culture’s limit. The wider the zone of inhibition is, the more effective the antimicrobial agent is. The tests were repeated three times, and the average values and standard deviations were determined. To evaluate the antimicrobial activity of the nanoparticles containing zinc complexes, the IC50 index (half maximal inhibitory concentration) was also calculated using the online available calculating tool at the web address https://www.aatbio.com/tools/ic50-calculator, accessed on 20 March 2024.

3. Results and Discussion

3.1. Characterization of Aqueous Vine Leaves Extract

3.1.1. Total Content of Polyphenols from the Aqueous Vine Leaves Extract

The total polyphenols content of the vine leaves extract was calculated using the regression equation of the calibration curve y = 0.0141∙x + 0.0058 (R2 = 0.984) wherein y represents the absorbance and x represents the concentration of gallic acid used as standard. The total content of polyphenols from the samples, expressed as milligrams of equivalent gallic acid per gram of extract weight, was calculated using the following formula:
C = c · f · V m
wherein C is the total phenolic content (µg GAE/g dry extract), c is the concentration of gallic acid obtained from the calibration curve (µg/mL), f is the dilution factor, V is the volume of aqueous vine leaves extract (mL), and m is the mass of solid extract (grams). The total polyphenol content of the vine leaves solid extract expressed as equivalent gallic acid was 47.18 mg GAE/g of dried extract.

3.1.2. Total Flavonoids Content from the Aqueous Vine Leaves Extract

The regression equation of the standard calibration curve, absorbance versus concentration of quercetin, was y = 0.001∙x + 0.002 (R2 = 0.978), wherein y represents the absorbance and x represents the concentration of quercetin used as standard. The total flavonoid content of the extract was expressed as mg equivalent quercetin per gram of solid extract (mg QE/g solid extract). The total flavonoid content of the vine leaves solid extract was 29.85 mg QE/g solid extract.

3.2. Characterization of the Nanoparticles Containing Zinc Complexes

3.2.1. SEM/EDX Analysis

Qualitative EDX analysis is based on identifying the specific energies of X-rays emitted by the atoms of a certain chemical element. Quantitative analysis involves measuring the intensity of the spectral peaks corresponding to the preselected elements both for the studied samples and for standards, calculating the intensity ratios (k values) and converting these k values into percentage concentrations (%wt and %at). The EDX spectrum of the ZnNPs sample, the elemental chemical composition of the ZnNPs sample and the EDX elemental mappings of the Zn, O and C atoms are shown in Figure 1. In the EDX spectrum (Figure 1a), the characteristic peaks from 1.012 (Lα), 8.630 (Kα) and 9.572 (Kβ), corresponding to the photon energies of x-ray emission lines belonging to the principal K- and L spectral series, confirm the existence of the zinc atoms in the biosynthesized nanoparticles. The low-intensity peaks detected in the EDX spectrum indicate the presence ofsmall amounts of Ca and Mg elements coming from the vine leaves. The EDX elemental mapping analysis of the ZnNPs sample revealed a homogeneous distribution of the Zn, O and C elements within the sample (Figure 1d–f).
Scanning electron microscopy was used to investigate the surface morphology of the ZnNP sample. From the SEM microphotographs recorded at 1000× magnification degree (Figure 1b) and respectively at 2020× magnification degree (Figure 1c), it can be noticed that the external surface of the sample looks like it would be madeup of agglomerations of nanoparticles that form a cluster-like structure. This agglomeration can be attributed to the fact that the NPs derived from plants possess a high surface area, and they strongly stick to each other [34].

3.2.2. XRD Analysis

Wide-angle XRD analysis was carried out to investigate the crystallinity of the ZnNPs sample and to evaluate the dimensions of the crystallites (Figure 2).
In the XRD spectrum, several characteristic diffraction peaks were identified, whose positions are shown in Table 2. The diffraction spectrum recorded for the ZnNP sample does not match any of the standard cards existing in the JCPDS database.
The crystallite sizes D were calculated with the Scherrer equation D = /(βcosθ) wherein K is a dimensionlessshape factor (the value chosen was 0.9), λ is the wavelength of the X-rays, θ is the diffraction angle, and β is the peak width measured at half of the maximum peak height (FWHM). The average size of the crystallites was 1.295 nm.

3.2.3. Fourier Transform Infrared Spectroscopy (FTIR)

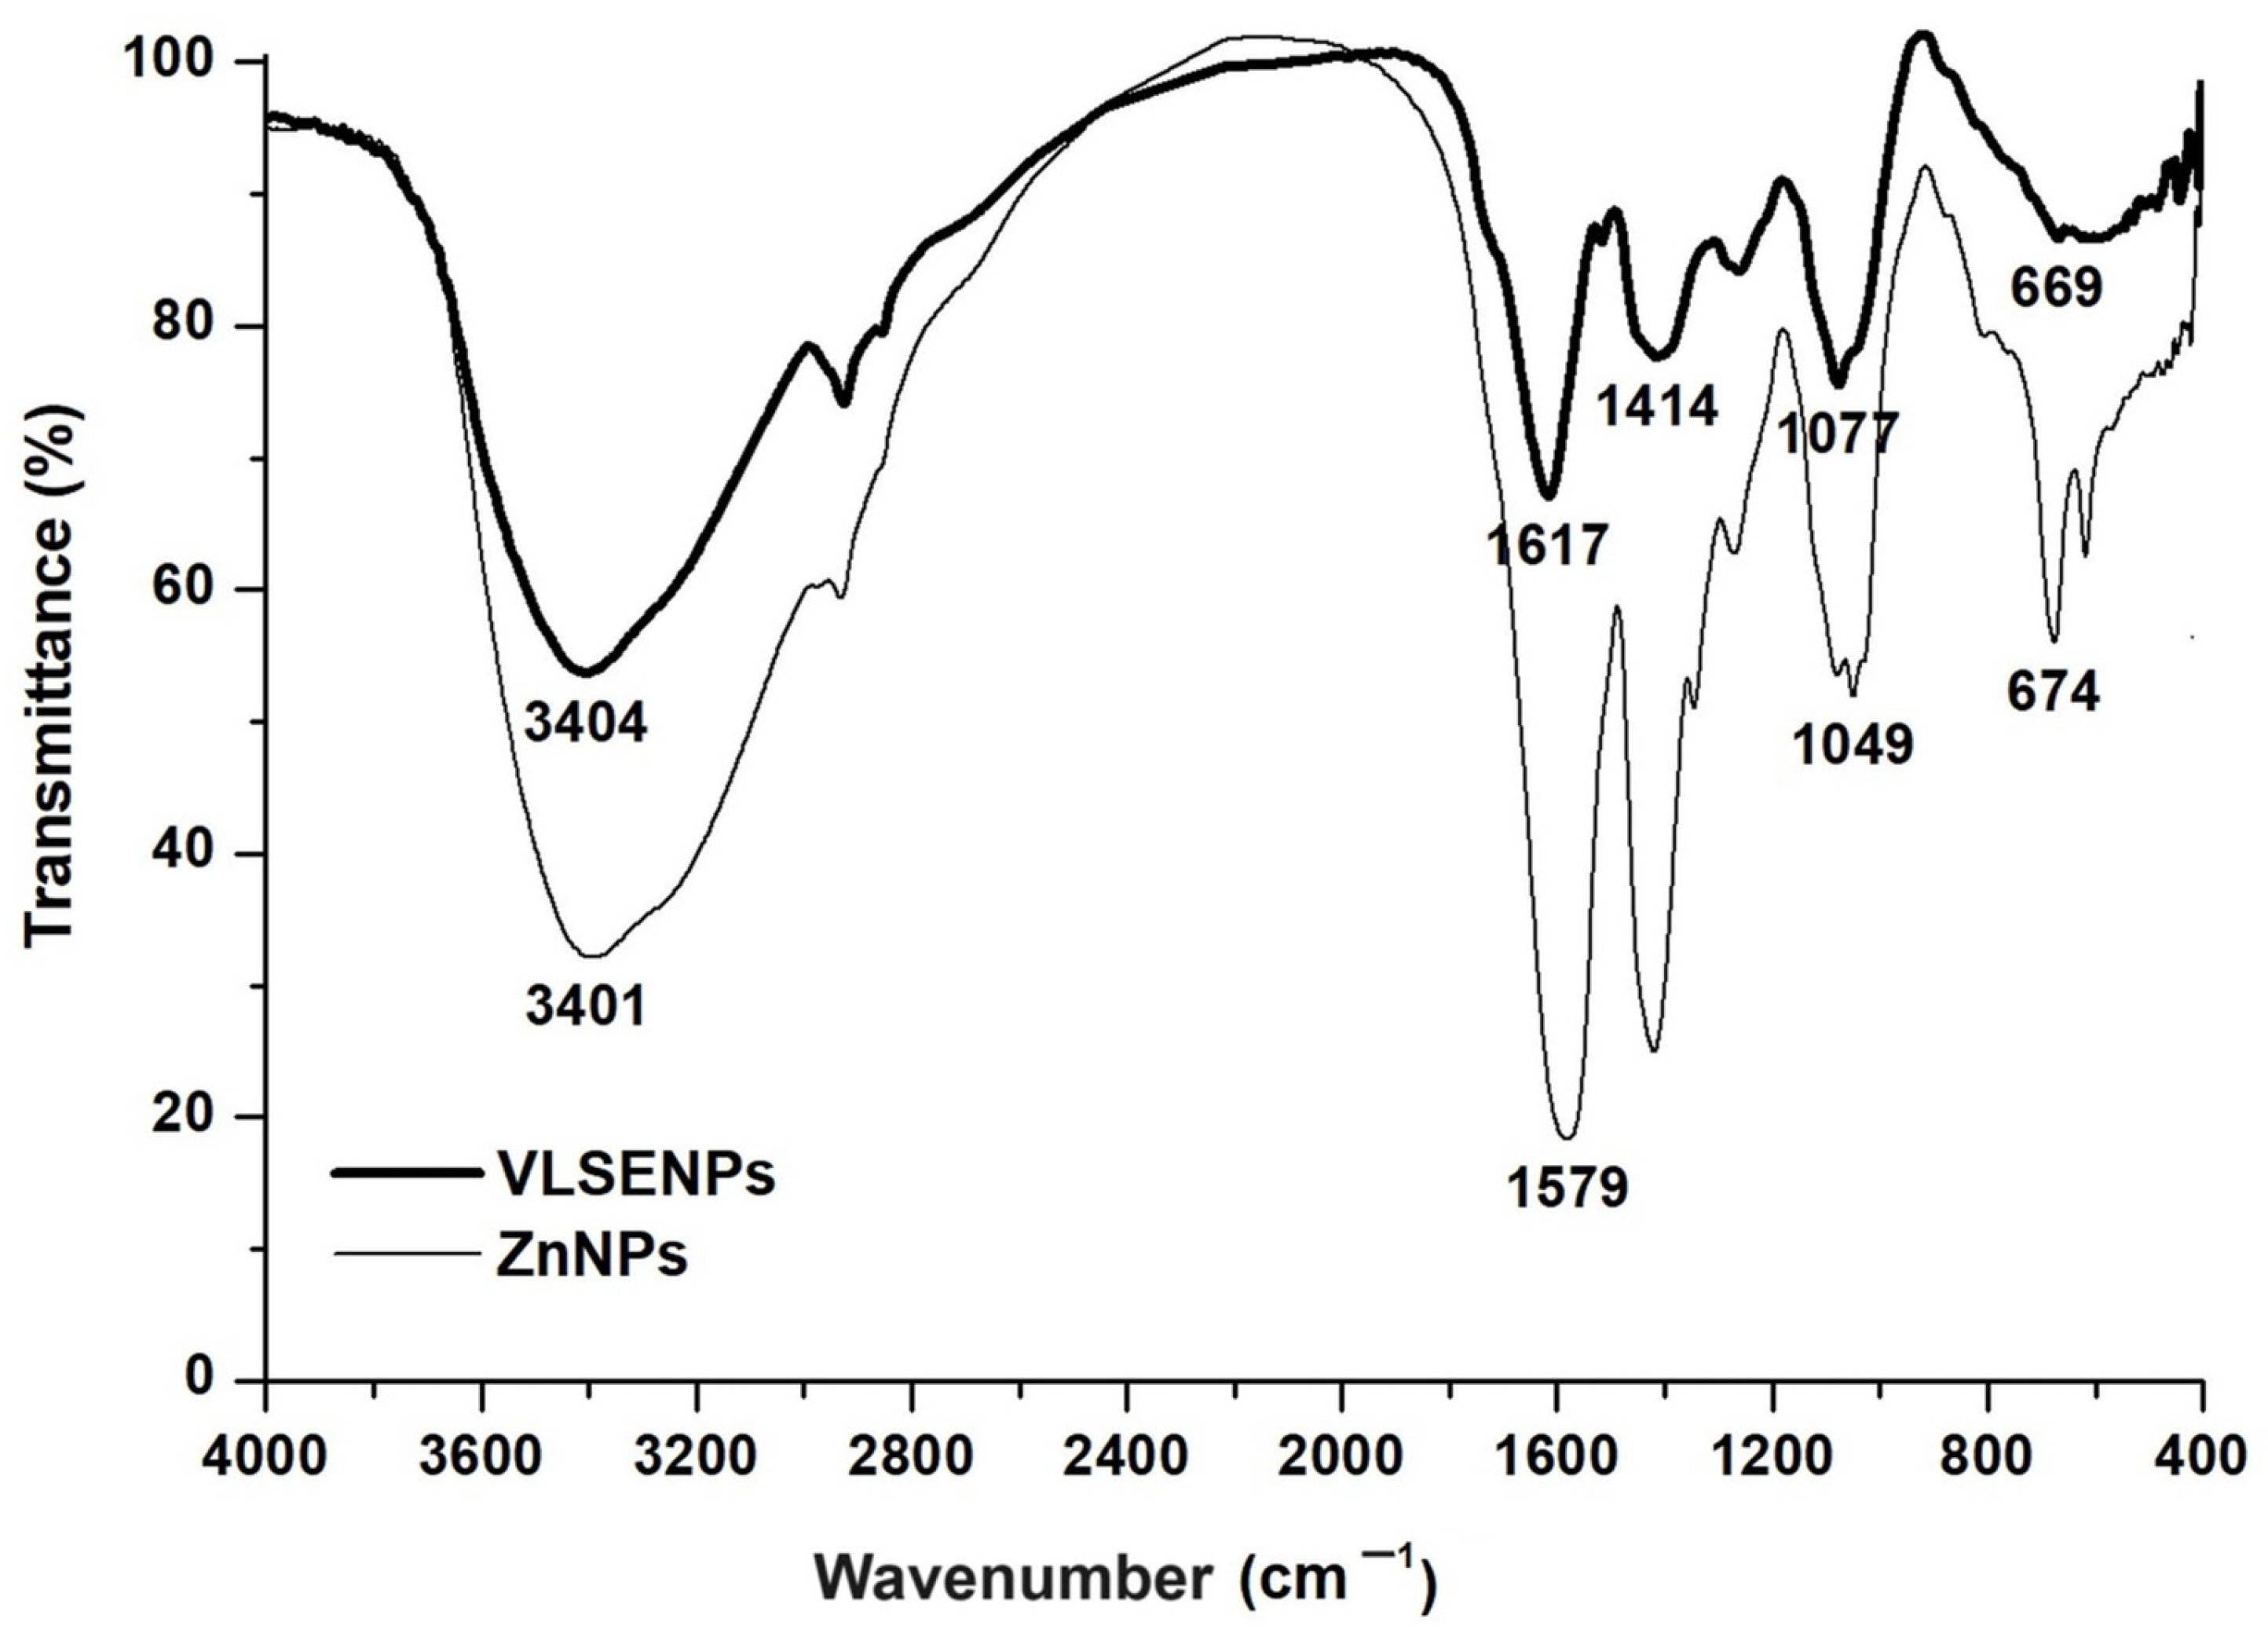
IR spectroscopy provides information concerning the interactions of the functional groups of the ligands from the vine leaves extract with the zinc ions [35,36,37,38]. The main absorption bands that occurred in the mid-infrared spectra of the VLSENPs and ZnNPs samples (Figure 3) are assigned to the vibrational modes of the following groups of atoms: stretching vibrations of the O–H bonds from the phenolic groups (3404 cm−1 and 3401 cm−1); asymmetrical stretching vibrations of the C–H bonds from the methine and methylene groups (2926 cm−1 and 2931 cm−1); stretching vibrations of the C=O bonds belonging to the carbonyl group of the aromatic ring (1617 cm−1 and 1579 cm−1); overlapping of the stretching vibrations of the C–C and C=C bonds present in the aromatic ring with the out of plane bending vibrations of the O–H bonds from polyphenols (1414 cm−1 and 1419 cm−1); overlapping of the stretching vibrations of the phenolic C–O bonds with the stretching vibrations of the C–O bonds from the carboxylic groups of the phenolic acids (1077 cm−1 and 1049 cm−1).
The peaks detected at 674 cm−1 and respectively to 618 cm−1 in the FTIR spectrum of ZnNPs are attributed to the asymmetrical stretching vibrations and, respectively, to the symmetrical stretching vibrations of Zn–O covalent bonds from ZnNPs. The absorption band attributed to the stretching vibrations of the O-H bonds from the hydroxyl groups of the polyphenols is more intense in the FTIR spectrum of the ZnNPs sample (3401 cm−1) compared to the one from the FTIR spectrum of the VLSENPs sample (3404 cm−1), what it indicates the involvement of the hydroxyl group in the formation of the Zn–O covalent bond. The shifting of the absorption band assigned to the stretching vibrations of the C=O bonds from 1617 cm−1 in the FTIR spectrum of VLSENPs to 1579 cm−1 in the FTIR spectrum of ZnNps indicates the involvement of the C=O functional group in the formation of a coordinative covalent bond with zinc ions. The formation of coordinative covalent bonds between the zinc ions and the carbonylic oxygen atoms and the formation of covalent Zn–O bonds with phenolic oxygen atoms are proved by the modification of the absorption bands from 1414 cm−1 to 1419 cm−1 and from 1077 cm−1 to 1049 cm−1.

3.2.4. DR UV–Visible Analysis

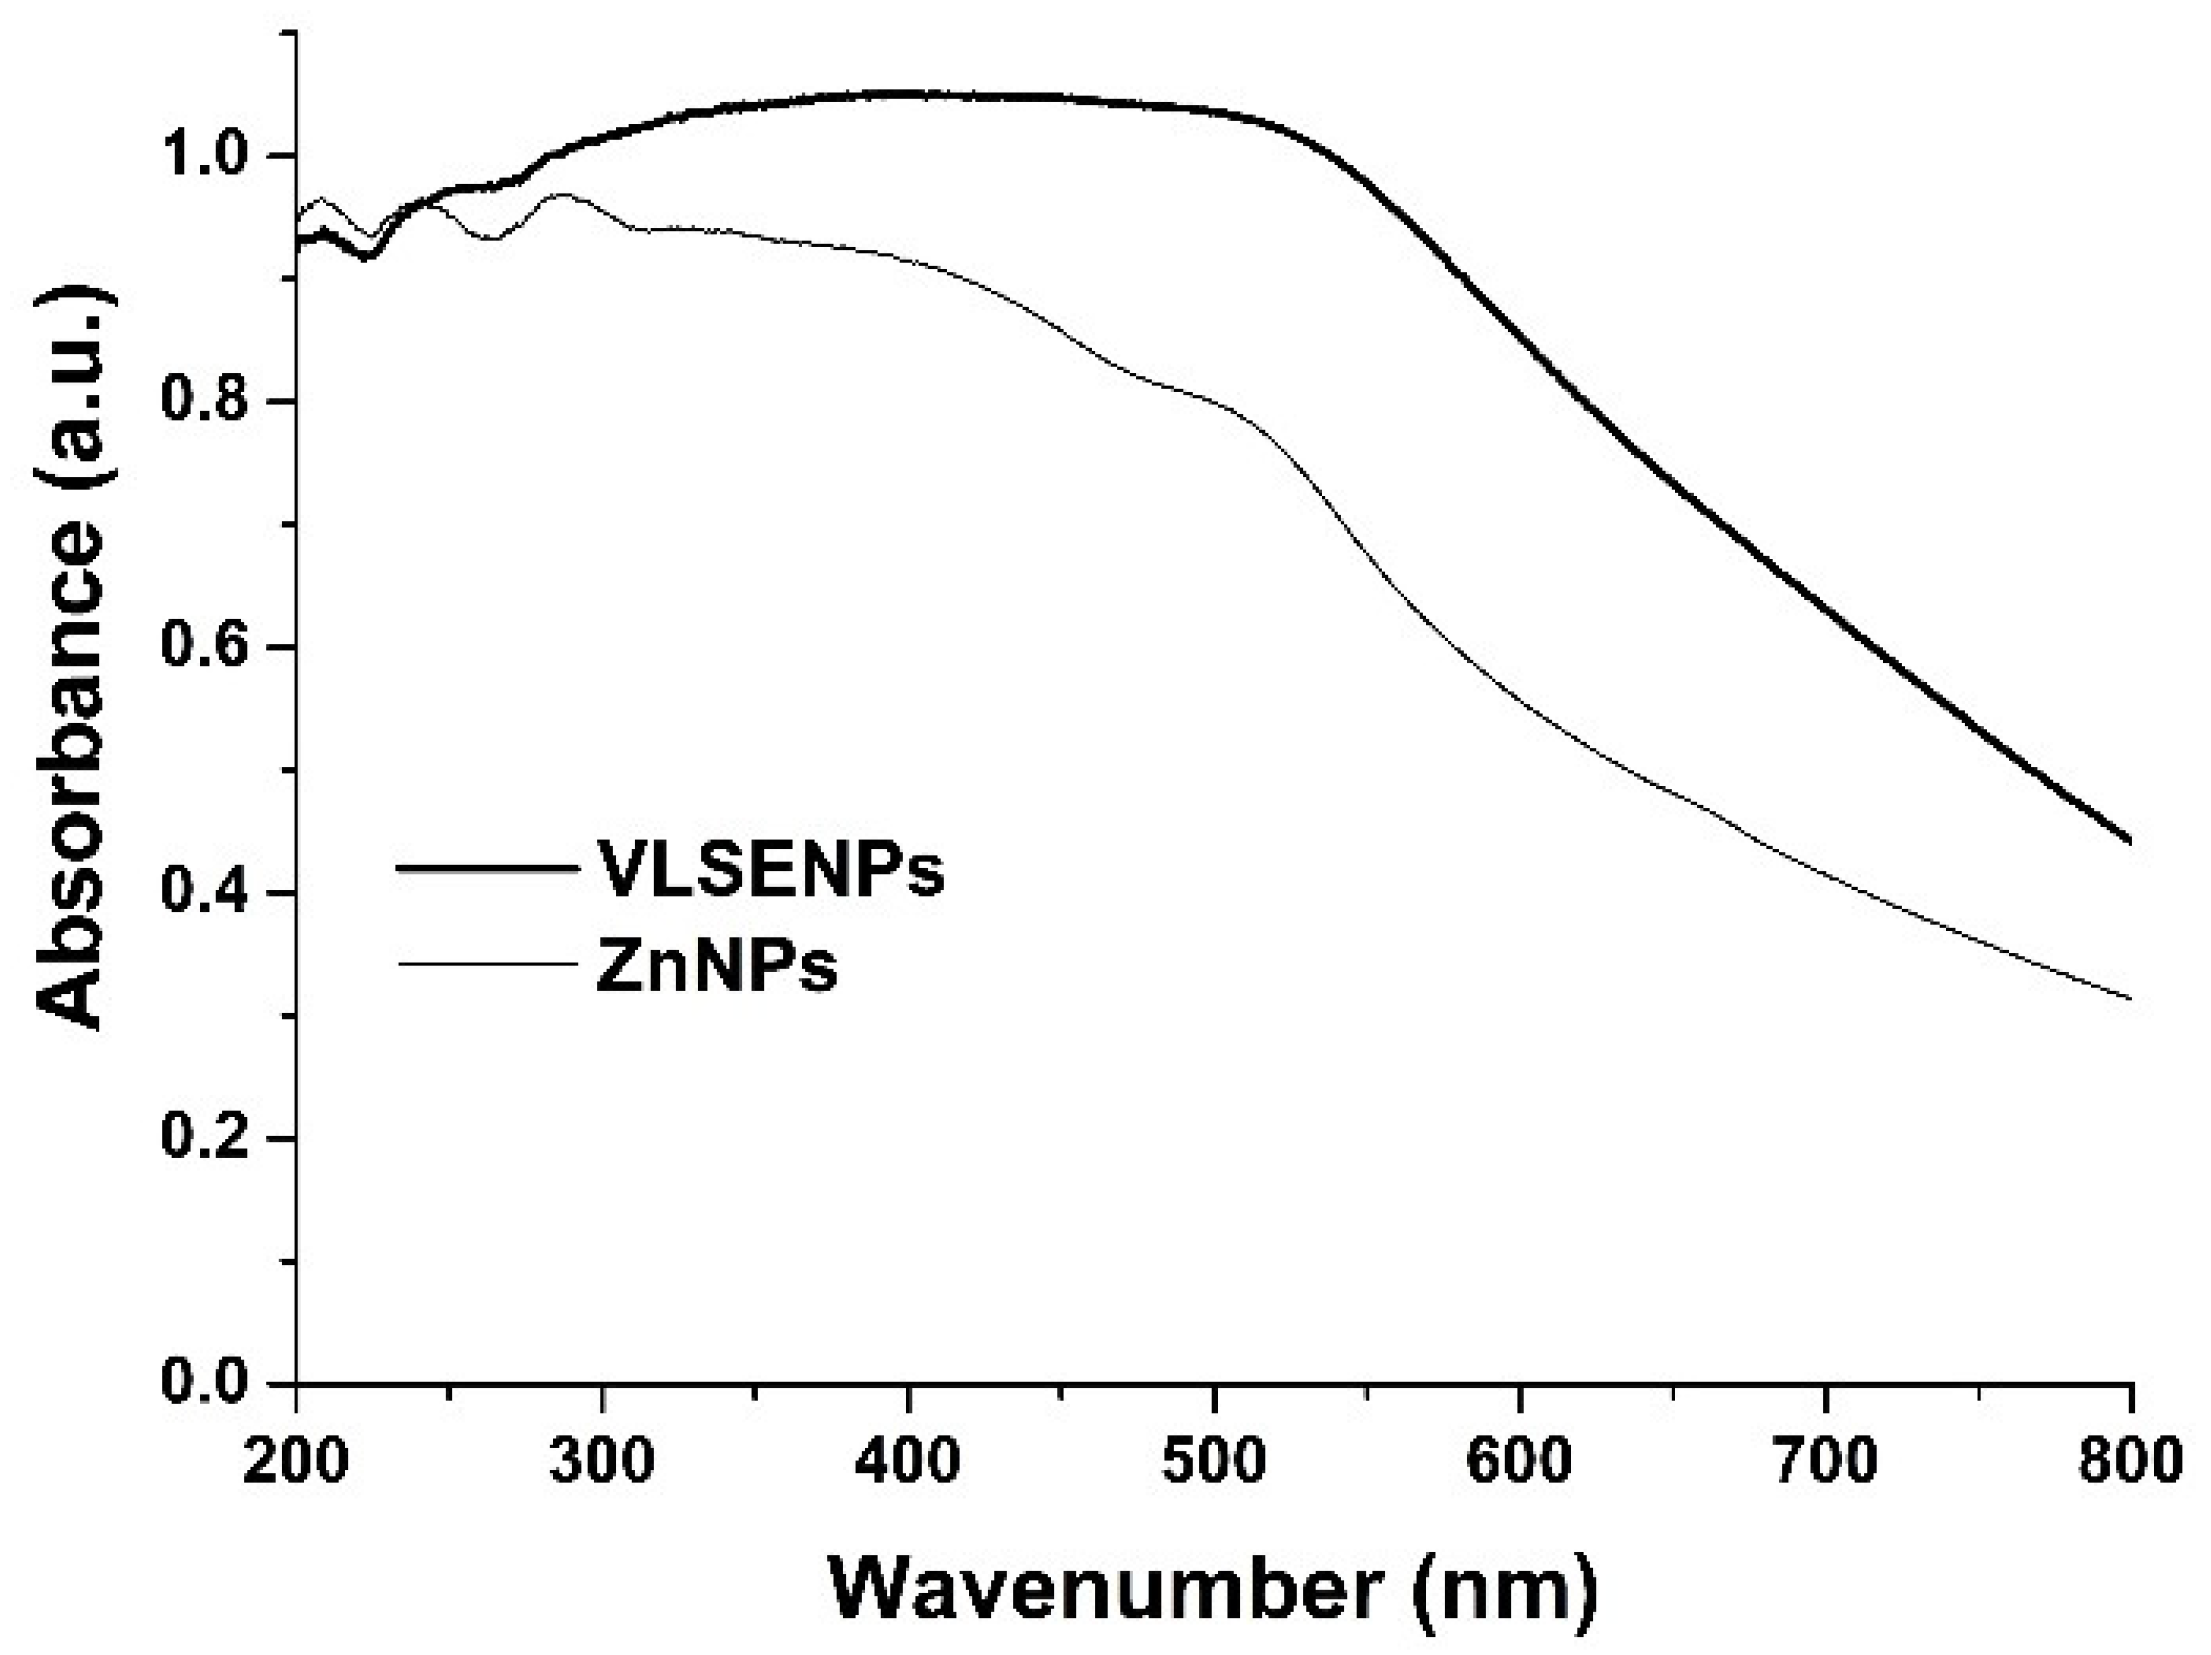
UV–visible absorption spectroscopy is a widely used technique to examine the optical properties of nano-sized particles. The absorption capacity depends on the size, concentration, level of aggregation and refractive index of the nanoparticles. Substances with a higher molecular weight tend to have a lower absorption capacity than those with a lower molecular weight. Substances that are more polar have a higher absorption capacity than those that are less polar. The DR UV-vis absorption spectra recorded for both the VLSENPs and ZnNP samples are shown in Figure 4.
The VLESNP sample exhibits a higher absorption capacity than the ZnNP sample since the complexes obtained by the formation of the polar covalent/coordinative covalent bonds between the zinc ions and the ligands present in the vine leaves aqueous extract have a higher molecular weight and a lower polarity compared to the free ligands contained by vine leaves. The DR UV–visible spectrum of ZnNPs consists of a broad band with a maximum absorption located in the domain of 300–400 nm. The two absorption peaks that occur at 245 nm and 290 nm highlight the formation of the zinc-phenolic acids and zinc–flavonoids complexes. After the complexation of polyphenols with zinc ions, the electron density at the O atoms from the hydroxyl groups of the polyphenols increased, the degree of conjugation increased, the electron delocalization in the system enhanced and the energy difference between the excited state and the ground state has decreased, so that the intensity of the absorption band corresponding to the π → π* transitions decreased. These results agree with the scientific literature data according to which the zinc-polyphenols complexes exhibit a broad UV absorption band in the range comprised from 280–410 nm [8,21,39,40]. The absorption band recorded in the visible region (400–800 nm) is due to the n → π* electronic transitions wherein the electron pairs are involved from the n non-bonding orbitals of the oxygen atoms from the carbonyl groups and the π* anti-bonding molecular orbitals of the carbon atoms from the aromatic rings as well as to the ππ* electronic transitions.

3.2.5. Evaluation of the Creams

In order to obtain stable creams, it is necessary to use emulsifying agents, whose main role is to reduce the interfacial tension between the oily and the aqueous phases. For the preparation of the creams, the non-ionic emulsifiers Tween 80 (as an emulsifier in the aqueous phase) and Span 80 (as an emulsifier in the oily phase) were used since they are not irritating to the skin, are not easily influenced by pH and are non-toxic. When formulating the new cream, we aimed to use minimal amounts of synthetic emulsifiers and natural products with the role of co-emulsifiers or viscosity modifying agents. Chitosan and gelatine favorably influence the stability of the emulsion by forming a polymer network (gel framework) that increases the viscosity of the emulsion by decreasing the mobility of oil droplets, thus preventing the destabilization of the emulsion. Also, both the gelatine as well as the chitosan form protective films around the oil phase droplets, preventing, through electrostatic repulsion and by steric hindrances, the flocculation and/or the coalescence of the oily phase droplets. Glycerol acts as a humectant in skin hydration and as an emollient. Beeswax gives consistency, stability and texture to the creams. Olive oil was used as an emollient and as a non-polar solvent for beeswax.

Microscopic Analysis of the Creams

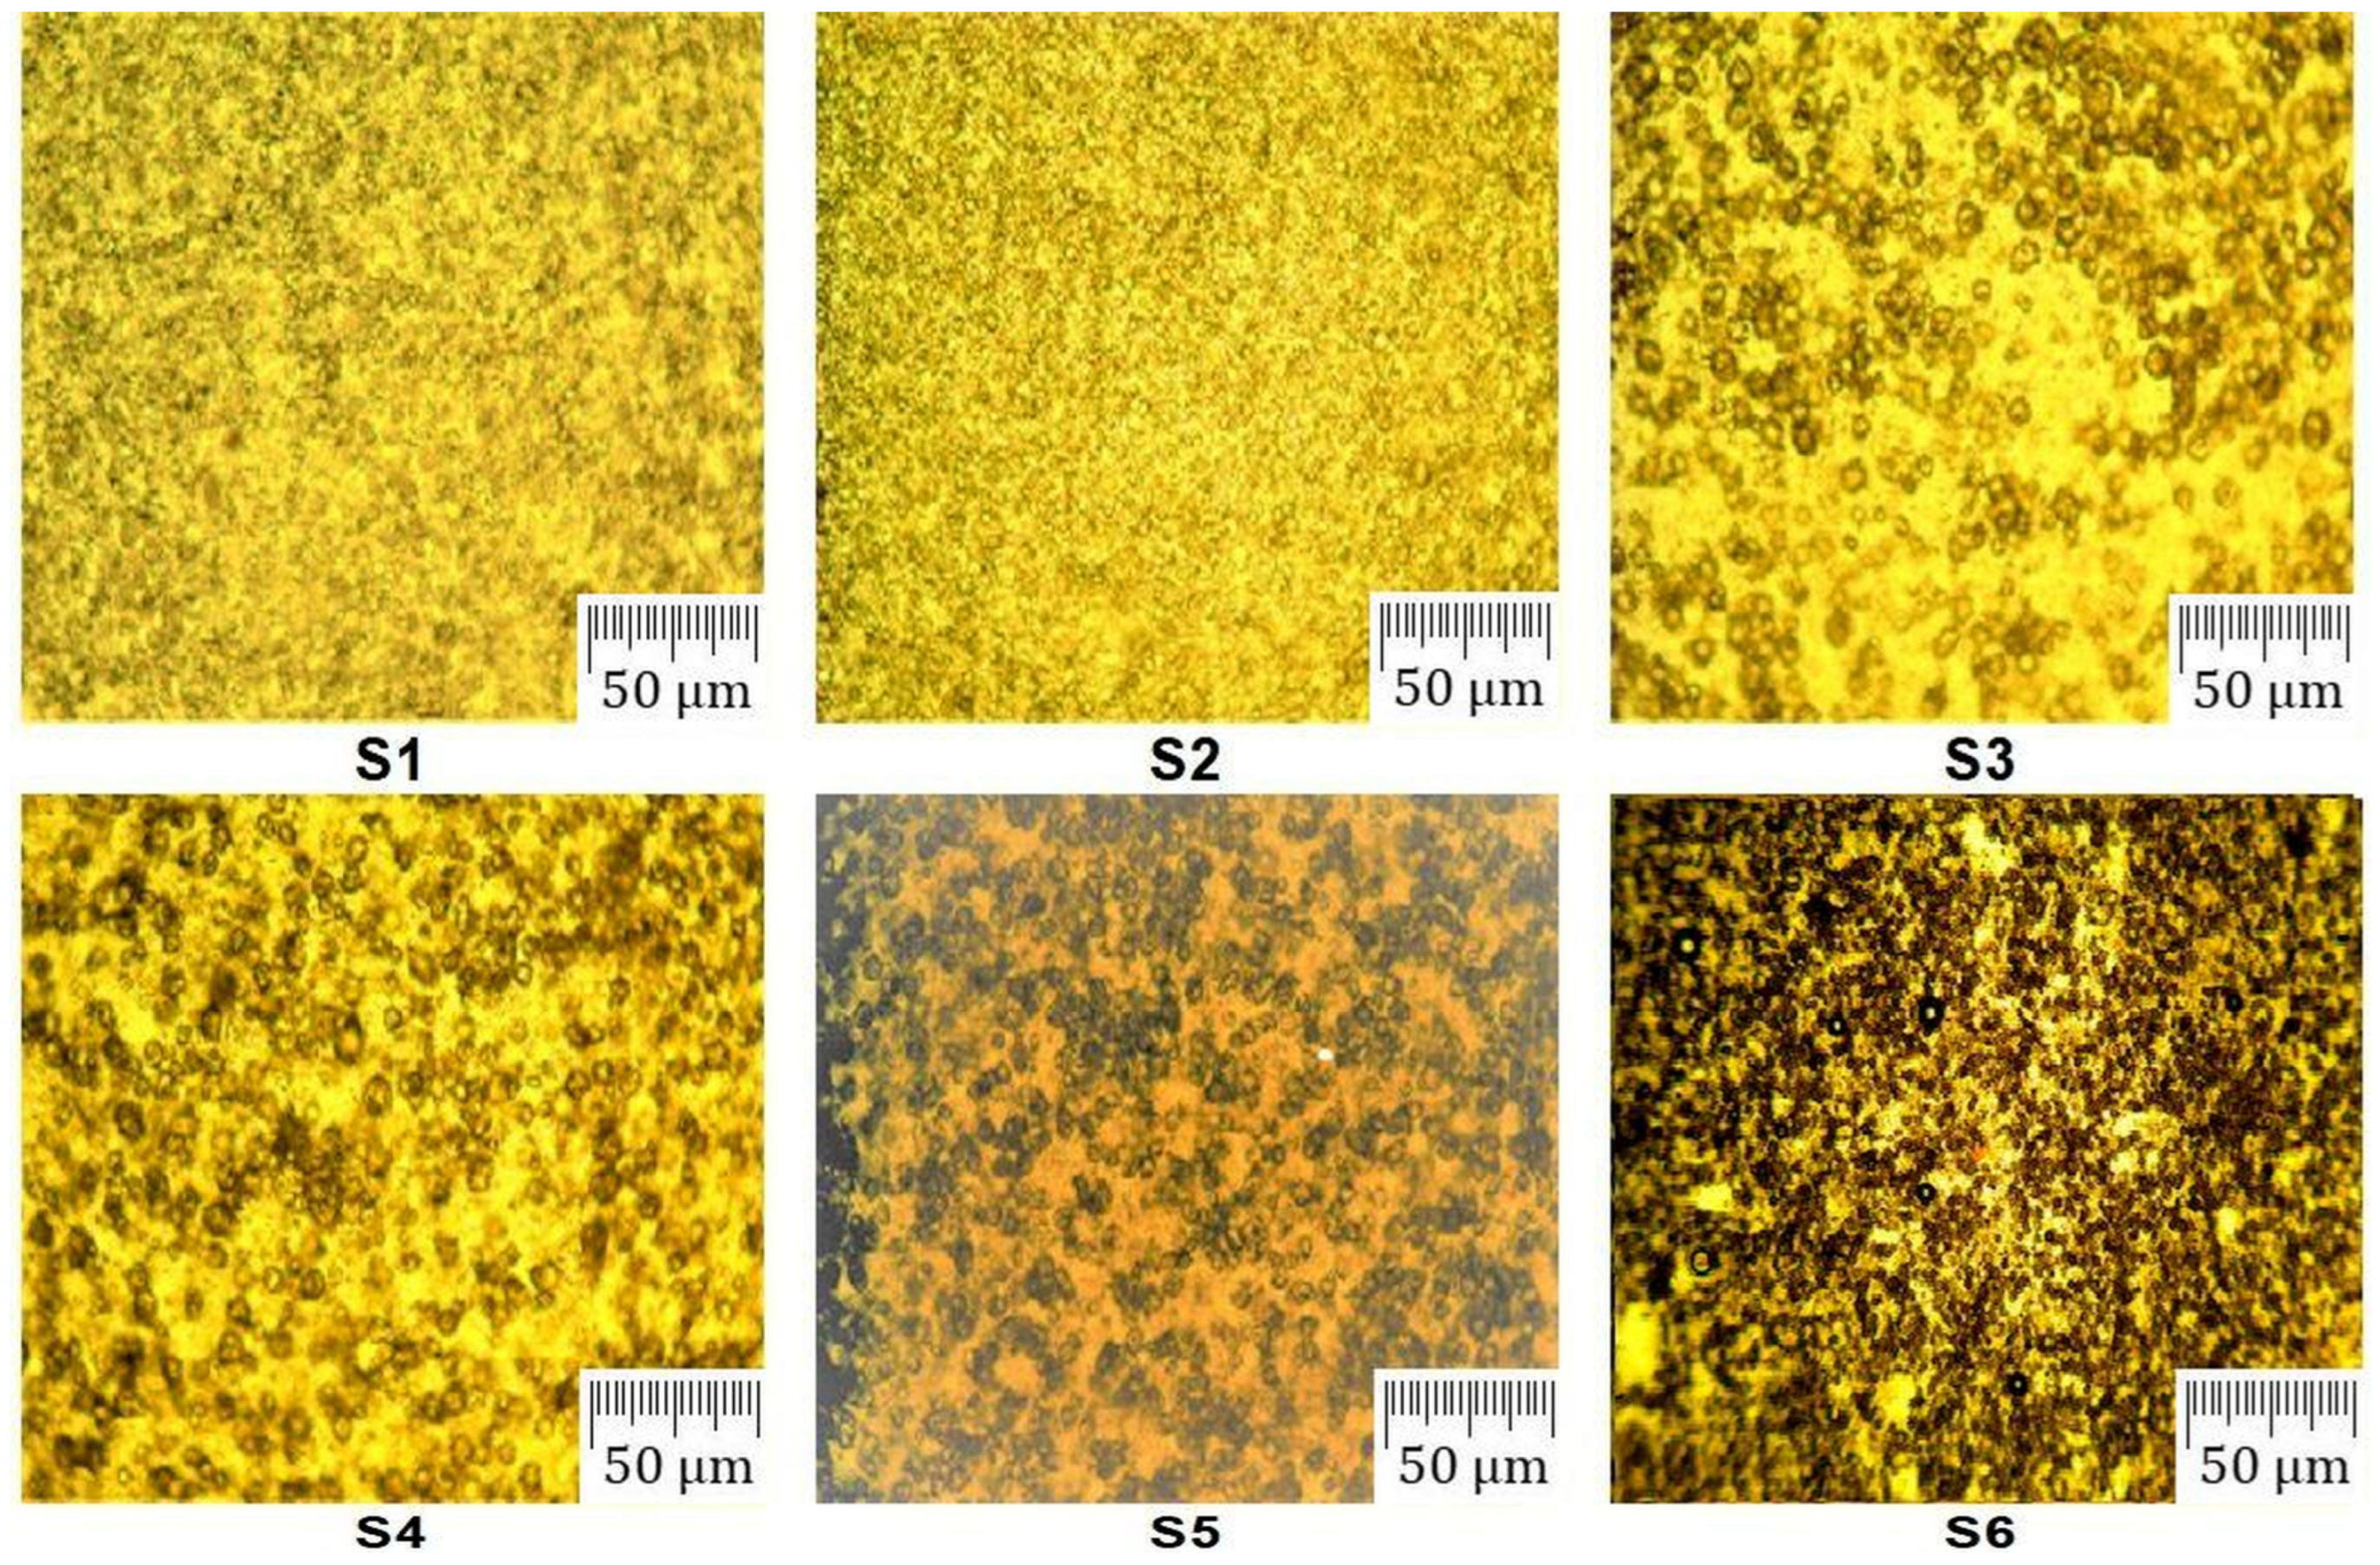
The microscopic photos accomplished after 6 h from the preparation of the creams (Figure 5) show that semisolid emulsions contain a high number of small droplets with a relatively uniform distribution of the particle size, indicating that the prepared creams have a very good stability.

Organoleptic Characteristics and Physical-Chemical Properties of the Creams

The organoleptic characteristics, pH, viscosities and spreading diameters values of the creams are shown in Table 3.
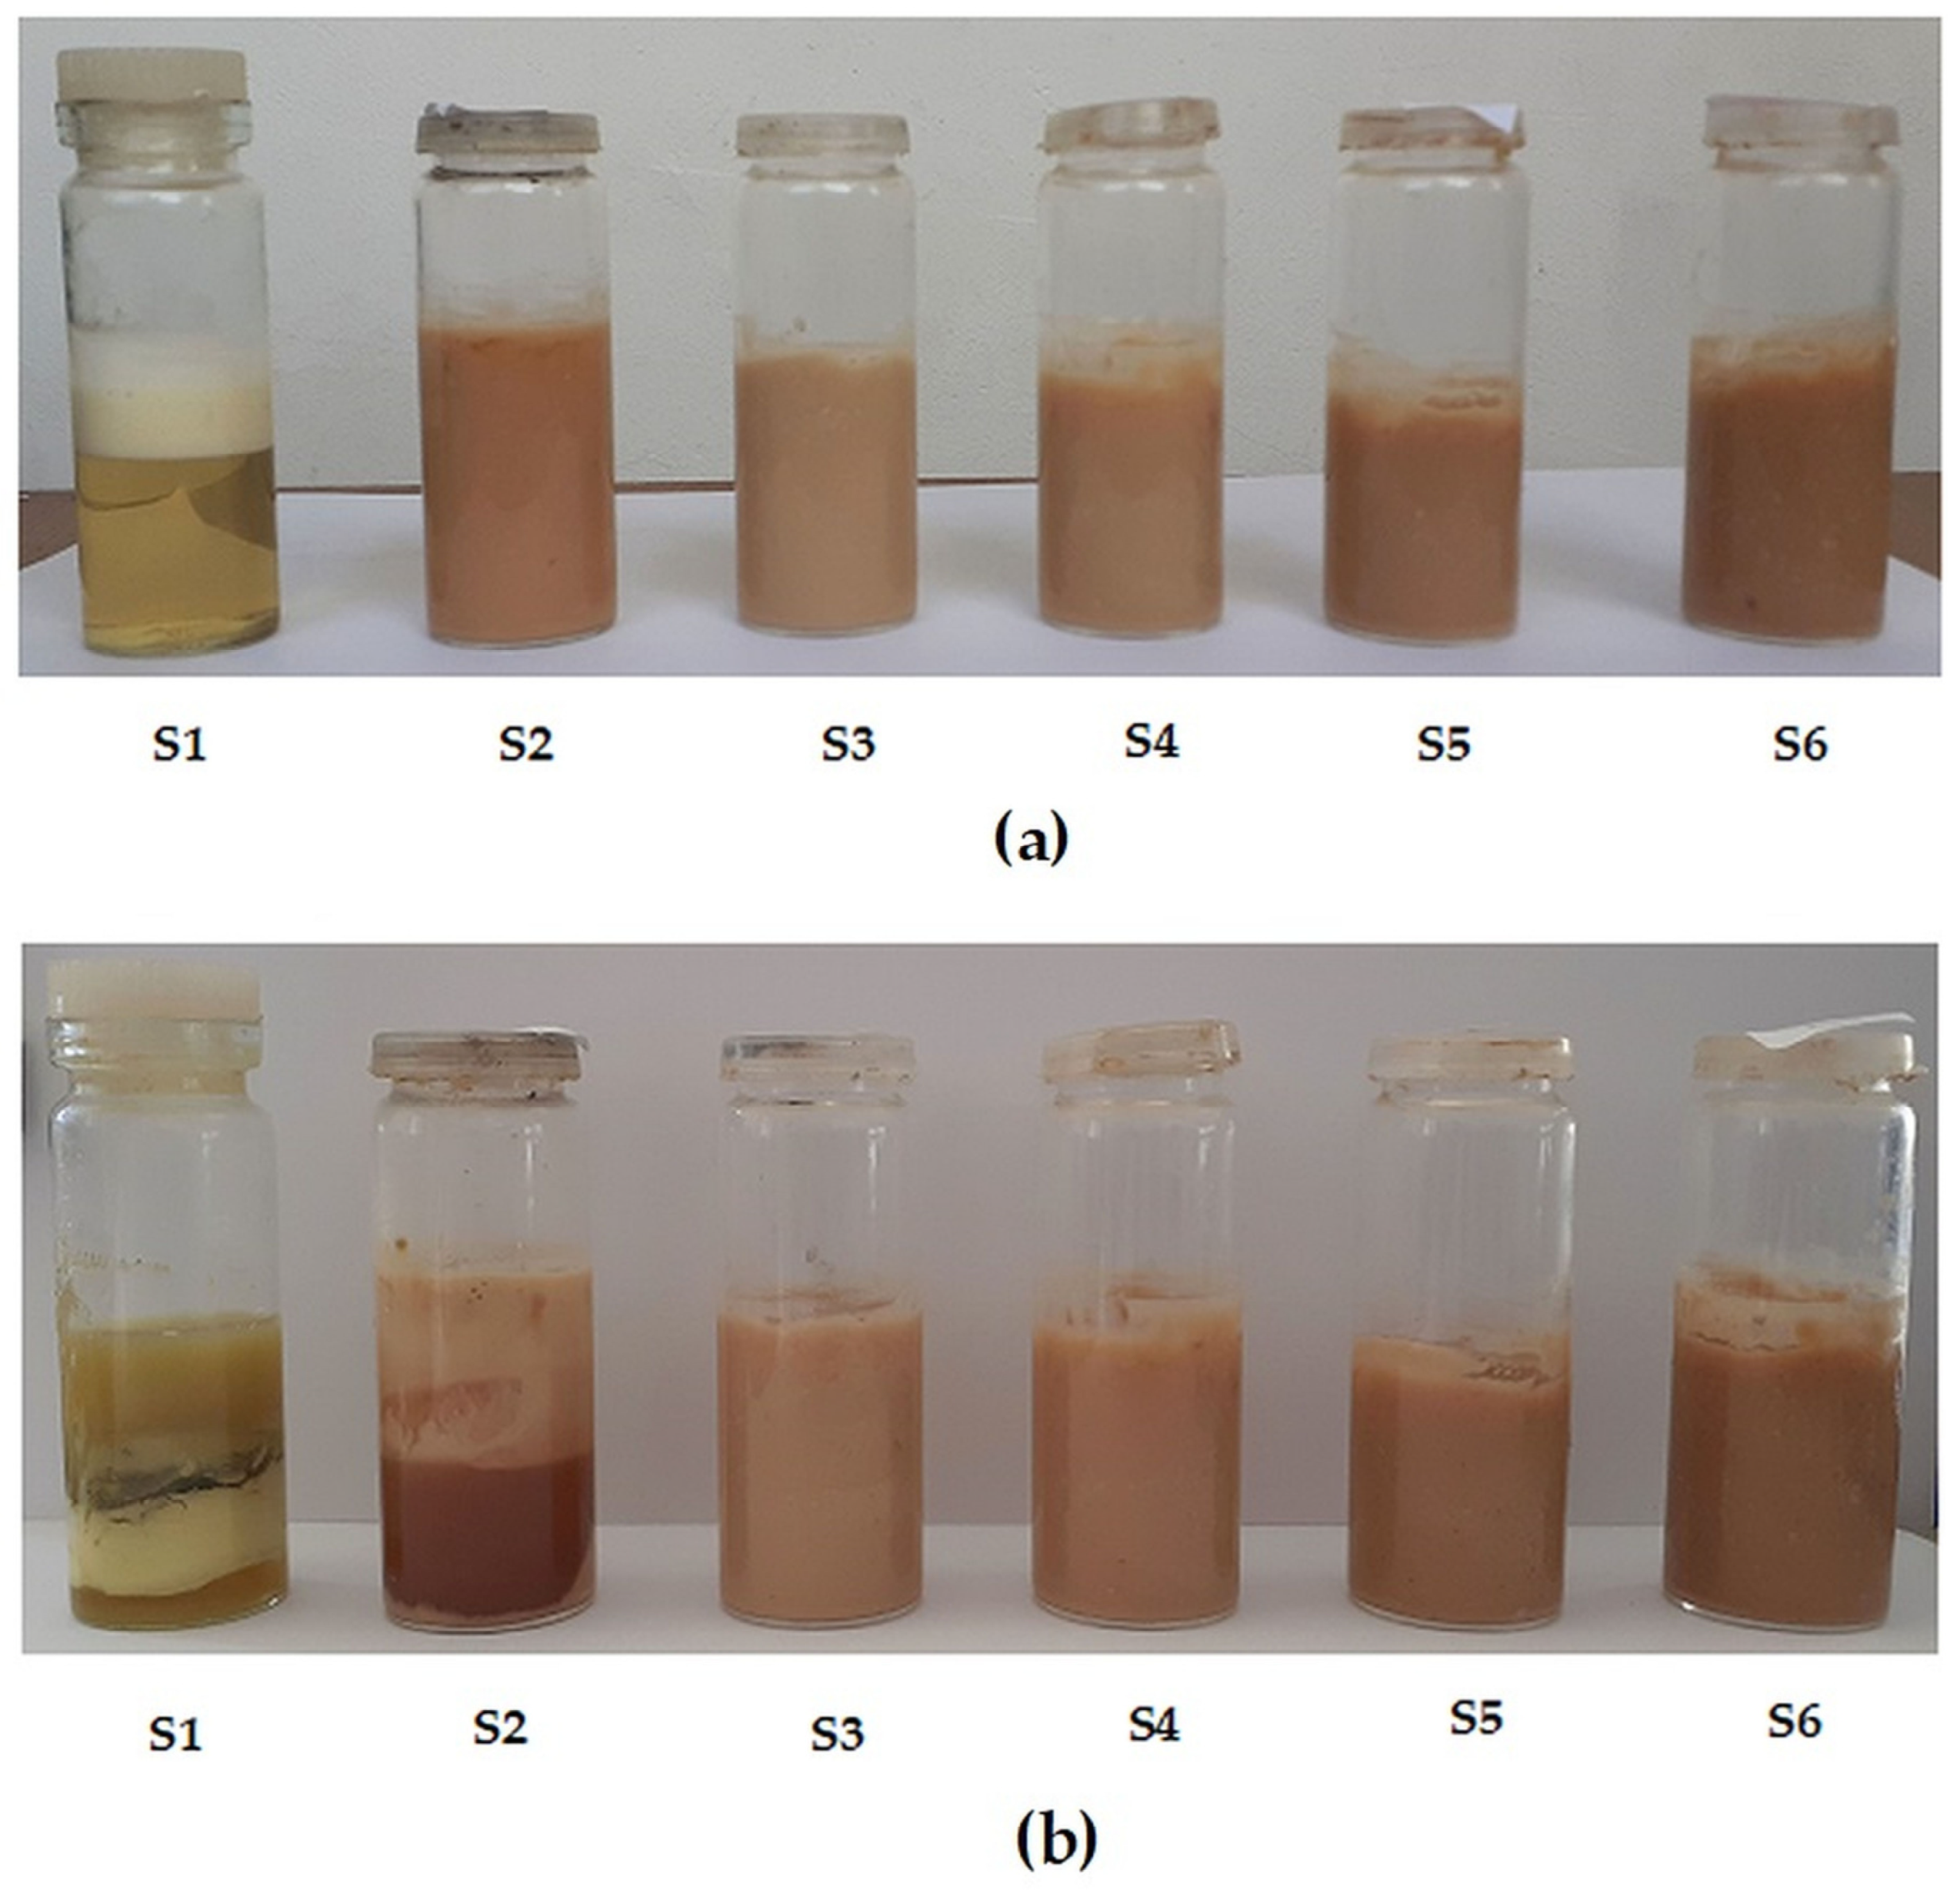
From the evaluations carried out after 1, 3, 6, 9 and 12 months, no changes inthe organoleptic characteristics were found in the case of the samples containing ZnNPs (Figure 6).
For sample S1, which does not contain nanoparticles, phase separation occurred after 6 months of storage (Figure 6a), while for sample S2,whichcontains VLSENP phases, separation was noticed after 9 months of storage at room temperature (Figure 6b). Additionally, in the case of samples S1 and S2, the appearance of some mold colonies after 9 months and, respectively, 12 months from the preparation of creams was noticed. The samples that contain the ZnNPs (samples S3–S6) did not exhibit any change intheir properties, although the containers wherein these creams have been kept were opened many times for taking of the samples required for the determination of viscosity, spreading diameters and pH. This fact proves once more the antimicrobial activity of the cream formulations that contain ZnNPs. The pH of the creams that contain ZnNPs ranged from 4.96 to 5.25 and did not significantly change over the storage time (over the period of 12 months wherein they were analysed). The pH values of the obtained creams fall within the pH range of the skin that, according to the most recent studies, varies from 4.1 to 5.8 [9,22,41]. The viscosity of the creams that contain ZnNPs (samples S3–S6) slightly increased with the increase of the zinc complexes amount added into the cream due to the intensification of the interactions between the hydrophobic components of the emulsion through van der Waals dispersion forces.
The values obtained for viscosity (comprised between 13.75 Pa∙s and 16.50 Pa∙s) and for the spreading diameters (comprised between 5.23 cm and 5.75 cm) showed that the obtained creams can be easily spread on the surface of the skin. The skin irritation test confirmed that the obtained creams did not produce any irritation, redness, or signs of erythema after being applied to volunteers.

Skin Irritancy Test

Skin irritation test showed that the prepared creams did not produce any irritation, redness, or sign of erythema on any of the volunteers to whom they were applied.

‘In Vitro’ Evaluation of the Antibacterial Activity

The antimicrobial activity of the creams was evaluated by measuring the width of the inhibition zones formed around the tested samples (Figure 7) of the ZnNPs against the tested microorganisms. The tests showed that sample S1 (whichdoes not contain either VLSENPs or ZnNPs), sample S2 (that contains only the VLSENPs) and sample S3 (that contains the smallest amount of ZnNPs-0.20 g) exhibited no antimicrobial activity.
Except for samples S1–S3, all the other samples, S4 (that contains 0.30 g ZnNPs), S5 (that contains 0.40 g ZnNPs) and S6 (that contains 0.50 g ZnNPs), showed an antimicrobial effect that correlated with the amount of ZnNPs. The best antimicrobial efficacy was found for the cream samples S5 and S6, which inhibited all the tested microbial cultures.
The inhibition zones obtained at the testing of the sample S5 against the Gram-positive bacteria Staphylococcus aureus (3.6 ± 0.3 mm, Figure 7a) and Methicillin-resistant Staphylococcus aureus (3 ± 0 mm, Figure 7b) as well as against the Gram-negative bacteria Escherichia coli (3 ± 0 mm, Figure 7c) they were similar size and decreased slightly when testing Candida albicans yeast (2.3 ± 0.3 mm, Figure 7d), (Table 4).
The antimicrobial effect of the sample S6 manifested itself identically against both Gram-positive (4.3 ± 0.3 mm) and Gram-negative species (4.3 ± 0.3 mm) but decreased significantly against Candida albicans (2.6 ± 0.3 mm). IC50 values of the ZnNPs incorporated in cream formulations against the tested microorganism were 7.318 mg/g cream (for Staphylococcus aureus), 9.37 (for MRSA), 9.683 mg/g cream (for Escherichia coli) and 9.338 mg/g cream (for Candida albicans).
The antibacterial activity of ZnNPs could be explained by several mechanisms [42,43]. They act simultaneously or in several steps by blocking the bacteria’s ability to form biofilms, damaging the cell membranes and releasing the cytoplasmic contents, by interaction with various cellular components, by generation of reactive oxygen species (ROS) such as hydroxyl radical, hydroperoxide radical and superoxide anion radical that exhibit a bactericidal action [6,16].

4. Conclusions

New cream formulations, in which nanoparticles containing zinc complexes have been incorporated, were prepared. The nanoparticles were obtained through a simple, eco-friendly and economical method using a grapevine leaf aqueous extract as a natural source of ligands. The concentration of the nanoparticles incorporated in the formulated creams varied between 2.5–12.5 mg ZnNPs/g cream. The formulated creams, wherein the nanoparticles containing zinc complexes were incorporated, have a brown reddishcolor, are homogenous and did not exhibit any tendency of phase separation in the 12-month period during which they were investigated. For the samples S3, S4, S5, and S6, the pH values are comprised between 4.97 and 5.25, the viscosities values are comprised between 13.75 Pa∙s and 16.50 Pa∙s and the spreading diameters are comprised between 5.23 cm and 5.76 cm, which indicates that these formulations are suitable for topical applications. The skin of the subjects that were treated with the obtained creams did not show any sign of redness, edema, inflammation, or irritation during the sensitivity test, indicating that these formulations are safe to use. The creams wherein the nanoparticles containing zinc complexes were incorporated exhibited antimicrobial activity against the tested microorganisms.

Author Contributions

Conceptualization, E.I.M.; methodology, E.I.M., A.P., C.C., R.C., C.E.H. and C.M.R.; software, E.I.M. and B.I.; validation, E.I.M. and C.M.R.; formal analysis, E.I.M., R.C., B.I. and C.M.R., investigation, E.I.M., A.P., C.C., R.C., C.E.H. and C.M.R.; resources, E.I.M., C.E.H. and C.M.R.; data curation, E.I.M., A.P., C.C., R.C., C.E.H. and C.M.R.; writing—original draft preparation, E.I.M.; writing—review and editing, E.I.M. and C.M.R.; visualization, E.I.M. and C.M.R.; supervision, E.I.M.; funding acquisition, C.M.R. All authors have read and agreed to the published version of the manuscript.

Funding

This research received no external funding.

Institutional Review Board Statement

Not applicable.

Informed Consent Statement

Not applicable.

Data Availability Statement

The original contributions presented in the study are included in the article, further inquiries can be directed to the corresponding author.

Conflicts of Interest

The authors declare no conflicts of interest.

References

  1. Ross, A.A.; Rodrigues Hoffmann, A.; Neufeld, J.D. The Skin Microbiome of Vertebrates. Microbiome 2019, 7, 79. [Google Scholar] [CrossRef] [PubMed]
  2. Lake, J.G.; Weiner, L.M.; Milstone, A.M.; Saiman, L.; Magill, S.S.; See, I. Pathogen Distribution and Antimicrobial Resistance Among Pediatric Healthcare-Associated Infections Reported to the National Healthcare Safety Network, 2011–2014. Infect. Control Hosp. Epidemiol. 2018, 39, 1–11. [Google Scholar] [CrossRef]
  3. Rodvold, K.A.; McConeghy, K.W. Methicillin-Resistant Staphylococcus Aureus Therapy: Past, Present, and Future. Clin. Infect. Dis. 2014, 58 (Suppl. S1), S20–S27. [Google Scholar] [CrossRef]
  4. Kamli, M.R.; Alzahrani, E.A.; Albukhari, S.M.; Ahmad, A.; Sabir, J.S.M.; Malik, M.A. Combination Effect of Novel Bimetallic Ag-Ni Nanoparticles with Fluconazole against Candida Albicans. J. Fungi 2022, 8, 733. [Google Scholar] [CrossRef] [PubMed]
  5. Nguyen, D.H.; Vo, T.N.N.; Nguyen, N.T.; Ching, Y.C.; Hoang Thi, T.T. Comparison of Biogenic Silver Nanoparticles Formed by Momordica Charantia and Psidium Guajava Leaf Extract and Antifungal Evaluation. PLoS ONE 2020, 15, e0239360. [Google Scholar] [CrossRef]
  6. Wang, L.; Hu, C.; Shao, L. The Antimicrobial Activity of Nanoparticles: Present Situation and Prospects for the Future. Int. J. Nanomed. 2017, 12, 1227–1249. [Google Scholar] [CrossRef]
  7. Correa, M.G.; Martínez, F.B.; Vidal, C.P.; Streitt, C.; Escrig, J.; de Dicastillo, C.L. Antimicrobial Metal-Based Nanoparticles: A Review on Their Synthesis, Types and Antimicrobial Action. Beilstein J. Nanotechnol. 2020, 11, 1450–1469. [Google Scholar] [CrossRef]
  8. Macovei, I.; Luca, S.V.; Skalicka-Woźniak, K.; Horhogea, C.E.; Rimbu, C.M.; Sacarescu, L.; Vochita, G.; Gherghel, D.; Ivanescu, B.L.; Panainte, A.D.; et al. Silver Nanoparticles Synthesized from Abies Alba and Pinus Sylvestris Bark Extracts: Characterization, Antioxidant, Cytotoxic, and Antibacterial Effects. Antioxidants 2023, 12, 797. [Google Scholar] [CrossRef] [PubMed]
  9. Guignard, M.I.; Campagne, C.; Giraud, S.; Brebu, M.; Vrinceanu, N.; Cioca, L.-I. Functionalization of a Bamboo Knitted Fabric Using Air Plasma Treatment for the Improvement of Microcapsules Embedding. J. Text. Inst. 2015, 106, 119–132. [Google Scholar] [CrossRef]
  10. Chopra, H.; Bibi, S.; Singh, I.; Hasan, M.M.; Khan, M.S.; Yousafi, Q.; Baig, A.A.; Rahman, M.; Islam, F.; Emran, T.B.; et al. Green Metallic Nanoparticles: Biosynthesis to Applications. Front. Bioeng. Biotechnol. 2022, 10, 874742. [Google Scholar] [CrossRef]
  11. Kruk, T.; Szczepanowicz, K.; Stefańska, J.; Socha, R.; Warszyński, P. Synthesis and Antimicrobial Activity of Monodisperse Copper Nanoparticles. Colloids Surf. B Biointerfaces 2015, 128, 17–22. [Google Scholar] [CrossRef]
  12. Jones, N.; Ray, B.; Ranjit, K.T.; Manna, A.C. Antibacterial Activity of ZnO Nanoparticle Suspensions on a Broad Spectrum of Microorganisms. FEMS Microbiol. Lett. 2008, 279, 71–76. [Google Scholar] [CrossRef] [PubMed]
  13. Bruna, T.; Maldonado-Bravo, F.; Jara, P.; Caro, N. Silver Nanoparticles and Their Antibacterial Applications. Int. J. Mol. Sci. 2021, 22, 7202. [Google Scholar] [CrossRef]
  14. Sidorowicz, A.; Fais, G.; Casula, M.; Borselli, M.; Giannaccare, G.; Locci, A.M.; Lai, N.; Orrù, R.; Cao, G.; Concas, A. Nanoparticles from Microalgae and Their BiomedicalApplications. Mar. Drugs 2023, 21, 352. [Google Scholar] [CrossRef] [PubMed]
  15. Sidorowicz, A.; Yigit, N.; Wicht, T.; Stöger-Pollach, M.; Concas, A.; Orrù, R.; Cao, G.; Rupprechter, G. Microalgae-derived Co3O4 nanomaterials for catalytic CO oxidation. RSC Adv. 2024, 14, 4575–4586. [Google Scholar] [CrossRef]
  16. Sidorowicz, A.; Margarita, V.; Fais, G.; Pantaleo, A.; Manca, A.; Concas, A.; Rapelli, P.; Fiori, P.L.; Cao, G. Characterization of nanomaterials synthesized from Spirulina platensis extract and their potential antifungal activity. PLoS ONE 2022, 17, e0274753. [Google Scholar] [CrossRef] [PubMed]
  17. Jadoun, S.; Arif, R.; Jangid, N.; Meena, R. Green Synthesis of Nanoparticles Using Plant Extracts: A Review. Environ. Chem. Lett. 2021, 19, 355–374. [Google Scholar] [CrossRef]
  18. Radulescu, C.; Buruleanu, L.; Nicolescu, C.M.; Olteanu, R.; Bumbac, M.; Holban, G.; Simal-Gandara, J. Phytochemical Profiles, Antioxidant and Antibacterial Activities of Grape (Vitis vinifera L.) Seeds and Skin from Organic and Conventional Vineyards. Plants 2020, 9, 1470. [Google Scholar] [CrossRef]
  19. Pascariu, S.; Pop, I.; Simeanu, D.; Pavel, G.; Solcan, C. Effects of Wine By-Products on Growth Performance, Complete Blood Count and Total Antioxidant Status in Broilers. Rev. Bras. Ciência Avícola 2017, 19, 2. [Google Scholar] [CrossRef]
  20. Sirohi, R.; Tarafdar, A.; Singh, S.; Negi, T.; Gaur, V.K.; Gnansounou, E.; Bharathiraja, B. Green Processing and Biotechnological Potential of Grape Pomace: Current Trends and Opportunities for Sustainable Biorefinery. Bioresour. Technol. 2020, 314, 123771. [Google Scholar] [CrossRef]
  21. Gómez-Brandón, M.; Lores, M.; Insam, H. Strategies for Recycling and Valorization of Grape Marc. Crit. Rev. Biotechnol. 2019, 39, 437–450. [Google Scholar] [CrossRef] [PubMed]
  22. Pintać Šarac, D.; Četojević Simin, D.; Berežni, S.; Orčić, D.; Mimica-Dukic, N.; Lesjak, M. Investigation of the Chemical Composition and Biological Activity of Edible Grapevine (Vitis vinifera L.) Leaf Varieties. Food Chem. 2019, 286, 686–695. [Google Scholar] [CrossRef] [PubMed]
  23. Pantelić, M.; Dabić, D.; Ćirić, I.; Pergal, M.; Relic, D.; Todic, S.; Natić, M. Phenolic Profiles, Antioxidant Activity and Minerals in Leaves of Different Grapevine Varieties Grown in Serbia. J. Food Compos. Anal. 2017, 62, 76–83. [Google Scholar] [CrossRef]
  24. Šuković, D.; Knežević, B.; Gašić, U.; Sredojević, M.; Ćirić, I.; Todić, S.; Mutić, J.; Tešić, Ž. Phenolic Profiles of Leaves, Grapes and Wine of Grapevine Variety Vranac (Vitis vinifera L.) from Montenegro. Foods 2020, 9, 138. [Google Scholar] [CrossRef] [PubMed]
  25. Nzekoue, A.F.; Kouamo Nguefang, M.L.; Alessandroni, L.; Mustafa, A.; Vittori, S.; Caprioli, G. Grapevine Leaves (Vitis vinifera): Chemical Characterization of Bioactive Compounds and Antioxidant Activity during Leave Development. Food Biosci. 2022, 50, 102120. [Google Scholar] [CrossRef]
  26. Malandrakis, A.A.; Kavroulakis, N.; Chrysikopoulos, C.V. Zinc Nanoparticles: Mode of Action and Efficacy against Boscalid-Resistant Alternaria Alternata Isolates. Sci. Total Environ. 2022, 829, 154638. [Google Scholar] [CrossRef] [PubMed]
  27. Wang, X. The Comparison of Titanium Dioxide and Zinc Oxide Used in Sunscreen Based on Their Enhanced Absorption. Appl. Comput. Eng. 2023, 24, 237–245. [Google Scholar] [CrossRef]
  28. Tegenaw, A.B.; Yimer, A.A.; Beyene, T.T. Boosting the Photocatalytic Activity of ZnO-NPs through the Incorporation of C-Dot and Preparation of Nanocomposite Materials. Heliyon 2023, 9, e20717. [Google Scholar] [CrossRef]
  29. Jarosz, M.; Magdalena, O.; Wyszogrodzka, G.; Mlyniec, K.; Librowski, T. Antioxidant and Anti-Inflammatory Effects of Zinc. Zinc-Dependent NF-kB Signaling. Inflammopharmacology 2017, 25, 11–24. [Google Scholar] [CrossRef]
  30. Damle, M.; Mallya, R. Development and Evaluation of a Novel Delivery System Containing Phytophospholipid Complex for Skin Aging. AAPS PharmSciTech 2016, 17, 607–617. [Google Scholar] [CrossRef]
  31. Fattahi, S.; Zabihi, E.; Abedian, Z.; Pourbagher, R.; Ardekani, A.; Mostafazadeh, A.; Akhavan, H. Total Phenolic and Flavonoid Contents of Aqueous Extract of Stinging Nettle and In Vitro Antiproliferative Effect on Hela and BT-474 Cell Lines. Int. J. Mol. Cell. Med. 2014, 3, 102–107. [Google Scholar] [PubMed]
  32. Phuyal, N.; Jha, P.; Raturi, P.; Rajbhandary, S. Total Phenolic, Flavonoid Contents, and Antioxidant Activities of Fruit, Seed, and Bark Extracts of Zanthoxylum Armatum DC. Sci. World J. 2020, 2020, 8780704. [Google Scholar] [CrossRef] [PubMed]
  33. Ramdhan, B.; Yusuf, A. Formulation and Evaluation of Avocado Leaf Extract (Persea Americana Mill.) Cream Based on Variations Stearic Acid Concentration. Ad-Dawaa J. Pharm. 2023, 1, 78–86. [Google Scholar] [CrossRef]
  34. Alamier, W.M.; Hasan, N.; Ali, S.K.; Oteef, M.D.Y. Biosynthesis of Ag Nanoparticles Using Caralluma Acutangula Extract and Its Catalytic Functionality towards Degradation of Hazardous Dye Pollutants. Crystals 2022, 12, 1069. [Google Scholar] [CrossRef]
  35. Krysa, M.; Szymańska-Chargot, M.; Zdunek, A. FT-IR and FT-Raman Fingerprints of Flavonoids—A Review. Food Chem. 2022, 393, 133430. [Google Scholar] [CrossRef] [PubMed]
  36. De Souza, R.F.; De Giovani, W.F. Synthesis, Spectral and Electrochemical Properties of Al (III) and Zn (II) Complexes with Flavonoids. Spectrochim. Acta Part A Mol. Biomol. Spectrosc. 2005, 61, 1985–1990. [Google Scholar] [CrossRef]
  37. Panhwar, Q.K.; Memon, S. Synthesis, Characterization and Antioxidant Activity of Rutin Complexes. Pak. J. Anal. Environ. Chem. 2014, 15, 61. [Google Scholar]
  38. Kalinowska, M.; Swiderski, G.; Matejczyk, M.; Lewandowski, W. Spectroscopic, Thermogravimetric and Biological Studies of Na(I), Ni(II) and Zn(II) Complexes of Quercetin. J. Therm. Anal. Calorim. 2016, 126, 141–148. [Google Scholar] [CrossRef]
  39. Uskoković-Marković, S.; Milenković, M.; Pavun, L. Zinc-Quercetin Complex: From Determination to Bioactivity. Acta Agric. Serbica 2020, 25, 113–120. [Google Scholar] [CrossRef]
  40. Guo, Z. Artemisinin Anti-Malarial Drugs in China. Acta Pharm. Sin. B 2016, 6, 115–124. [Google Scholar] [CrossRef]
  41. Lambers, H.; Piessens, S.; Bloem, A.; Pronk, H.; Finkel, P. Natural Skin Surface pH Is on Average below 5, Which Is Beneficial for Its Resident Flora. Int. J. Cosmet. Sci. 2006, 28, 359–370. [Google Scholar] [CrossRef] [PubMed]
  42. Mendes, C.; Dilarri, G.; Forsan, C.; Sapata, V.; Lopes, P.; Moraes, P.; Montagnolli, R.; Ferreira, H.; Bidoia, E. Antibacterial Action and Target Mechanisms of Zinc Oxide Nanoparticles against Bacterial Pathogens. Sci. Rep. 2022, 12, 2658. [Google Scholar] [CrossRef] [PubMed]
  43. Sirelkhatim, A.; Mahmud, S.; Seeni, A.; Kaus, N.H.M.; Ann, L.C.; Bakhori, S.K.M.; Hasan, H.; Mohamad, D. Review on Zinc Oxide Nanoparticles: Antibacterial Activity and Toxicity Mechanism. Nano-Micro Lett. 2015, 7, 219–242. [Google Scholar] [CrossRef] [PubMed]
Figure 1. EDX-SEM analysis of the ZnNPs sample: EDX spectrum (a), SEM microphotograph at 1000× magnification (b), SEM microphotograph at 2020× magnification (c), EDX elemental mapping of the Zn element (d), EDX elemental mapping of the O element (e), EDX elemental mapping of the C element (f). Inset from the EDX spectrum represents the elemental composition of the ZnNP sample calculated as the mean of three determinations (mean values ± SD).
Applsci 14 04612 g001
Figure 2. Wide angle XRD spectrum of the ZnNPs sample.
Applsci 14 04612 g002
Figure 3. Mid-infrared spectra of the ZnNPs and VLSENPs samples.
Applsci 14 04612 g003
Figure 4. DR UV–visible spectra of VLSENP and ZnNP samples.
Applsci 14 04612 g004
Figure 5. Microscopic images (400× magnification) of the prepared creams.
Applsci 14 04612 g005
Figure 6. Images regarding the stability of the creams: (a) after 9 months from their preparation; (b) after 12 months from their preparation.
Applsci 14 04612 g006
Figure 7. Antibacterial activity of the prepared creams against Staphylococcus aureus (a), Methicillin-resistant Staphylococcus aureus (b), Escherichia coli (c) and Candida albicans (d).
Applsci 14 04612 g007
Table 1. Composition of the topical cream formulations.
IngredientsSamples
S1S2S3S4S5S6
Beeswax (g)222222
10% (v/v) Span 80 solution in olive oil (mL)2.42.42.42.42.42.4
Glycerol (mL)2.72.72.72.72.72.7
20% Tween 80 solution (mL)333333
Gelatine (g)111111
3% chitosan solution (g)666666
VLSENPs (g)-0.2----
ZnNPs (g)--0.20.30.40.5
Distilled water (mL)22.222.022.021.921.821.7
The amounts from each ingredient required to obtain these creams have been established after preliminary tests.
Table 2. Structural parameters of the green synthesized ZnNPs.
Pos. (°2θ)Intensity (cts)FWHM (°2θ)d-Spacing
(Å)
Rel. Int.
(%)
MatchedCrystallites Size
[nm]
12.692012,169.390.09046.97475100.00No1.544441
16.65705866.620.14215.3223748.21No0.986918
17.9790489.560.20674.933884.02No0.679669
19.32411734.180.10344.5933814.25No1.361303
20.26513212.550.23264.3821726.40No0.606021
22.50842160.160.18093.9502417.75No0.782104
23.66351425.450.20673.7599611.71No0.685893
25.34012143.020.20673.5148617.61No0.688076
27.67061418.890.18093.2239011.66No0.789984
28.4806806.800.20673.134036.63No0.692603
31.6977318.050.31012.822912.61No0.465158
33.5606441.250.25842.670353.63No0.560888
35.983377.100.41342.495920.63No0.352917
37.3235226.710.51682.409321.86No0.283402
38.4623357.030.31012.340572.93No0.473921
39.3922114.440.31012.287430.94No0.475282
42.4444225.030.72352.129741.85No0.205746
44.7317335.420.15502.026022.76No0.968063
45.6036242.960.31011.989292.00No0.485409
46.5195201.670.31011.952231.66No0.487061
47.4308160.120.31011.916831.32No0.488748
51.9975127.010.51681.758721.04No0.298733
54.6402109.770.41341.679740.90No0.377802
65.0543609.610.09451.432585.01No1.741569
65.2281317.750.11031.432742.61No1.493543
78.1822457.020.09451.221623.76No1.891892
78.4221208.620.06301.221511.71No2.842678
99.105022.740.75631.012220.19No0.282812
111.965071.820.18910.929340.59No1.311658
116.544956.580.25210.905640.46No1.046672
Table 3. Organoleptic characteristics and physical-chemical properties of the prepared creams.
S1S2S3S4S5S6
Appearancehomogeneous semisolid
emulsion
homogeneous semisolid
emulsion
homogeneous semisolid
emulsion
homogeneous semisolid
emulsion
homogeneous semisolid
emulsion
homogeneous semisolid
emulsion
Colorlight yellowlighter reddish browndarker reddish browndarker reddish browndarker reddish browndarker reddish brown
StabilityStableStableStableStableStableStable
TextureSmoothSmoothSmoothSmoothSmoothSmooth
OdorCharacteristicCharacteristicCharacteristicCharacteristicCharacteristicCharacteristic
pH *4.96 ± 0.155.3 ± 0.124.97 ± 0.115.1 ± 0.145.25 ± 0.115.24 ± 0.13
Viscosity (Pa∙s) *
0 months22 ± 0.6524 ± 0.7414 ± 0.4316.25 ± 0.5016.50 ± 0.5116.50 ± 0.51
1 month15.25 ± 0.4423.25 ± 0.6713.75 ± 0.4016.25 ± 0.4716.50 ± 0.4816.50 ± 0.48
3 months9.50 ± 0.3123 ± 0.7613.75 ± 0.4516.25 ± 0.5316.50 ± 0.5416.50 ± 0.54
6 months-23 ± 0.7813.75 ± 0.4716.25 ± 0.5516.50 ± 0.5616.50 ± 0.56
9 months-23 ± 0.8213.75 ± 0.5416.25 ± 0.6216.50 ± 0.4416.50 ± 0.58
12 months--13.75 ± 0.4916.25 ± 0.5816.50 ± 0.5316.50 ± 0.55
Spreading diameters (cm) *
0 months5.66 ± 0.125.54 ± 0.115.71 ± 0.125.24 ± 0.115.23 ± 0.115.23 ± 0.11
1 month6.62 ± 0.155.59 ± 0.135.74 ± 0.135.24 ± 0.125.23 ± 0.125.23 ± 0.12
3 months6.79 ± 0.145.62 ± 0.125.75 ± 0.135.24 ± 0.125.23 ± 0.125.23 ± 0.11
6 months-5.66 ± 0.135.75 ± 0.145.25 ± 0.135.25 ± 0.125.25 ± 0.13
9 months-5.66 ± 0.145.75 ± 0.185.25 ± 0.155.25 ± 0.135.25 ± 0.13
12 months--5.75 ± 0.145.25 ± 0.135.25 ± 0.115.25 ± 0.13
* For each cream the pH, the viscosity and the spreading diameter were measured in triplicate. The mean values and the ±standard deviations were calculated.
Table 4. The mean value and standard deviation (SD) of the inhibition zones (mm) obtained forantimicrobial testing of cream samples using the diffusion method in a solid culture medium.
Microbial StrainsZones of Inhibition (mm)
Mean ± SD
Cream Samples
S1S2S3S4S5S6
Gram-positive BacteriaStaphylococcus aureus ATCC 259230002.3 ± 0.33.6 ± 0.34.3 ± 0.3
Methicillin-resistant Staphylococcus aureus (MRSA) ATCC 335910001.3 ± 0.33 ± 04.3 ± 0.3
Gram-negative
Bacteria
Escherichia coli ATCC 2592200003 ± 04.3 ± 0.3
YeastCandida albicans ATCC 9002800002.3 ± 0.32.6 ± 0.3
Disclaimer/Publisher’s Note: The statements, opinions and data contained in all publications are solely those of the individual author(s) and contributor(s) and not of MDPI and/or the editor(s). MDPI and/or the editor(s) disclaim responsibility for any injury to people or property resulting from any ideas, methods, instructions or products referred to in the content.