Article

Influence of Rock Slide Geometry on Stability Behavior during Reservoir Impounding

1
Institute of Applied Geology, Department of Civil Engineering and Natural Hazards, BOKU University, Peter Jordan-Strasse 82, 1190 Vienna, Austria
2
Institute of Structural Engineering, Department of Civil Engineering and Natural Hazards, BOKU University, Peter Jordan-Strasse 82, 1190 Vienna, Austria
*
Author to whom correspondence should be addressed.
Appl. Sci. 2024, 14(11), 4631; https://doi.org/10.3390/app14114631
Submission received: 16 April 2024 / Revised: 15 May 2024 / Accepted: 17 May 2024 / Published: 28 May 2024

Abstract

:
Assessing the stability behavior of deep-seated rock slides in the surroundings of large dam reservoirs requires an understanding of the geometry, the kinematics, the groundwater situation, and the rock mass and shear zone properties. This study focuses on the influence of rock slide geometry on stability evolution during initial reservoir impounding. Therefore, nine different rock slide models, mainly taken from published case studies with a well-explored geometry, were analyzed. Based on the assumption that the rock slides are close to limit equilibrium in a no-reservoir scenario, reservoir impounding causes a reduction in the factor of safety (FoS). The results show a large impact of the water level for rotational slides where the majority of the rock mass is located at the lower part of the slope. This results in a maximum reduction in the FoS of up to 12%. In contrast to this, translational rock slides are less affected by reservoir impounding. The stability analysis shows that the change in FoS is strongly controlled by the kinematics of the rock slide and the geometry near the foot of the slope. Consequently, a comprehensive in situ investigation of the geometry and kinematics is necessary in order to reliably assess the influence of initial reservoir impounding.

1. Introduction

Mountainous regions with steep slopes and high relief gradients provide a good terrain for hydropower generation. Worldwide, numerous dams are built and valley sections are impounded. However, numerous case studies show that reservoir impounding often affects the surrounding slopes in terms of groundwater flow and stability behavior [1]. Slope stability reduction resulting from an impounding reservoir may lead to the formation of new deep-seated rock slides or the reactivation and acceleration of pre-existing ones. Numerous case studies document the formation of a new first-time rock slide or the acceleration of a slowly moving deep-seated rock slide as well as the reactivation of an ancient rock slide caused by the operation of a dam reservoir [1,2,3,4,5,6,7,8,9]. One of the most catastrophic events in this context occurred in Italy in 1963 at the Vajont reservoir, where a rock slide mass with a volume of 280 million m3 suddenly failed, causing a giant water wave that destroyed many villages, leading to about 2000 fatalities [5]. With the exception of such very rare disastrous events, there are numerous cases documented worldwide where pre-existing dormant or very slowly moving rock slides have been reactivated or accelerated by dam reservoir operation [2,3,6,7,8,9]. Reactivated or accelerated rock slides typically require comprehensive monitoring programs and, in some cases, even the application of stabilization measures, such as the construction of a costly tunnel drainage system. It is therefore advisable to select the location of dams and the storage areas behind them on the basis of comprehensive feasibility studies, in order to avoid or minimize any influence from pre-existing deep-seated landslides [10]. In light of a worldwide boom in the construction of hydroelectric power plants—i.e., at least 3700 major dams, each with a capacity of more than 1 MW, are either planned or under construction [11]—the impacts of first-time reservoir impounding, annual reservoir management, and rapid drawdown need to be understood profoundly in order to assess the short- and long-term stability behavior [12,13,14] and perform slope risk management [15].
Research questions arise, mostly site-specific, concerning the influence of (i) the hydrogeological situation, (ii) the 2D/3D geometry and related type of movement (kinematics), (iii) slab development and shear zone characteristics, and (iv) the hydro-mechanically coupled parameters of the rock slide mass as well as the shear zones in the temporal variable stability evolution of such deep-seated rock slides. Apart from others, it is necessary to understand to what extent the geometry of rock slides influence the movement and stability evolution during initial impounding and later stages of reservoir management, a factor that has received little attention to date with regard to a systematic view. For the assessment, it is important to know whether the geometry (shape) of the rock slide has a minor or major influence on the stability development for the corresponding operational reservoir levels. The implications of this are manifold and have a significant impact on the proposed in situ investigation program, which is needed to assess the behavior during first-time impounding [10]. Furthermore, for already existing dam reservoirs located in the surroundings of active or inactive deep-seated rock slides, comprehensive assessment of long-term stability requires robust data of the geometry to determine the influence of cyclic loading due to reservoir infilling and lowering. Since different overlapping factors influence the stability in the natural environment, such as impounding, rapid drawdown, heavy precipitation, snowmelt, or others, it is necessary to know the amount of influence of these individual factors in order to make reliable assessments in the event of unexpected changes in slide movements [1].
This study focuses on the impact of the geometry and kinematics on the stability behavior during reservoir impounding of deep-seated rock slides in the surroundings of large dam reservoirs. The first part of this study deals with the underlying mechanisms that occur during the interaction of a dam reservoir and the valley flanks by building an analytical block model based on GNU Octave [16]. In the second part, the limit-equilibrium method is applied to case-study-related geometries to determine the change in the factor of safety during the initial impounding of a reservoir. A relationship between the reservoir level and the corresponding factor of safety for the different geometries is presented.

2. Materials and Methods

A series of naturally occurring deep-seated rock slides were selected to determine the impact of the geometry on the stability evolution during reservoir impounding by means of limit-equilibrium calculations. With the exception of two generically created models, representing extreme geometries, seven models were taken from the literature, where the location of the basal shear zone is well explored by geological mapping, seismic investigations, geodetic surveys, drillings, or other investigation methods. The selection was made in such a way as to cover a wide range of rock slide geometry types. Only five of the selected rock slides are situated in the surroundings of a dam reservoir. However, the main objective was to investigate the effect of the rock slide geometry on the change in the factor of safety during reservoir impounding, independent of a real or hypothetic situation, and it has to be stated that this study does not provide any information for the corresponding case study concerning the in situ stability or movement behavior. Thus, the FoS determined herein cannot be transferred to the real case studies. A brief description of the selected rock slide case studies including their profiles is given in Section 4.1.
GNU Octave Version 8.4.0 [16], which is a free software licensed under the GNU General Public License (see GNU General Public License for more details: http://www.gnu.org/licenses/ (accessed on 1 December 2023)), was used to calculate the solutions for the block model and to plot the results. Exemplarily, selected scripts of the analyses are provided as Supplementary Materials within this article. Diagrams showing the relationship between the height of the reservoir water level and the corresponding factor of safety were also created using GNU Octave. Geometrical profiles for the analytical block model and the limit-equilibrium analyses of the different case studies were drawn by AutoCAD [17]. In addition, profile sections of published rock slides were taken to perform 2D limit-equilibrium analyses using the software Slide2 Version 7 [18] to study the impact of the rock slide geometry on the factor of safety of the slope. The General Limit Equilibrium (GLE)/Morgenstern–Price method was chosen for the calculation as this method is described as rigorous and satisfies both equilibrium moment and equilibrium force [19]. The calculations were carried out with a gradual increase in the reservoir level, resulting in 15 to 26 water level stages depending on the case study.

3. Rock Slide Characterization and Dam Reservoir-Related Mechanisms

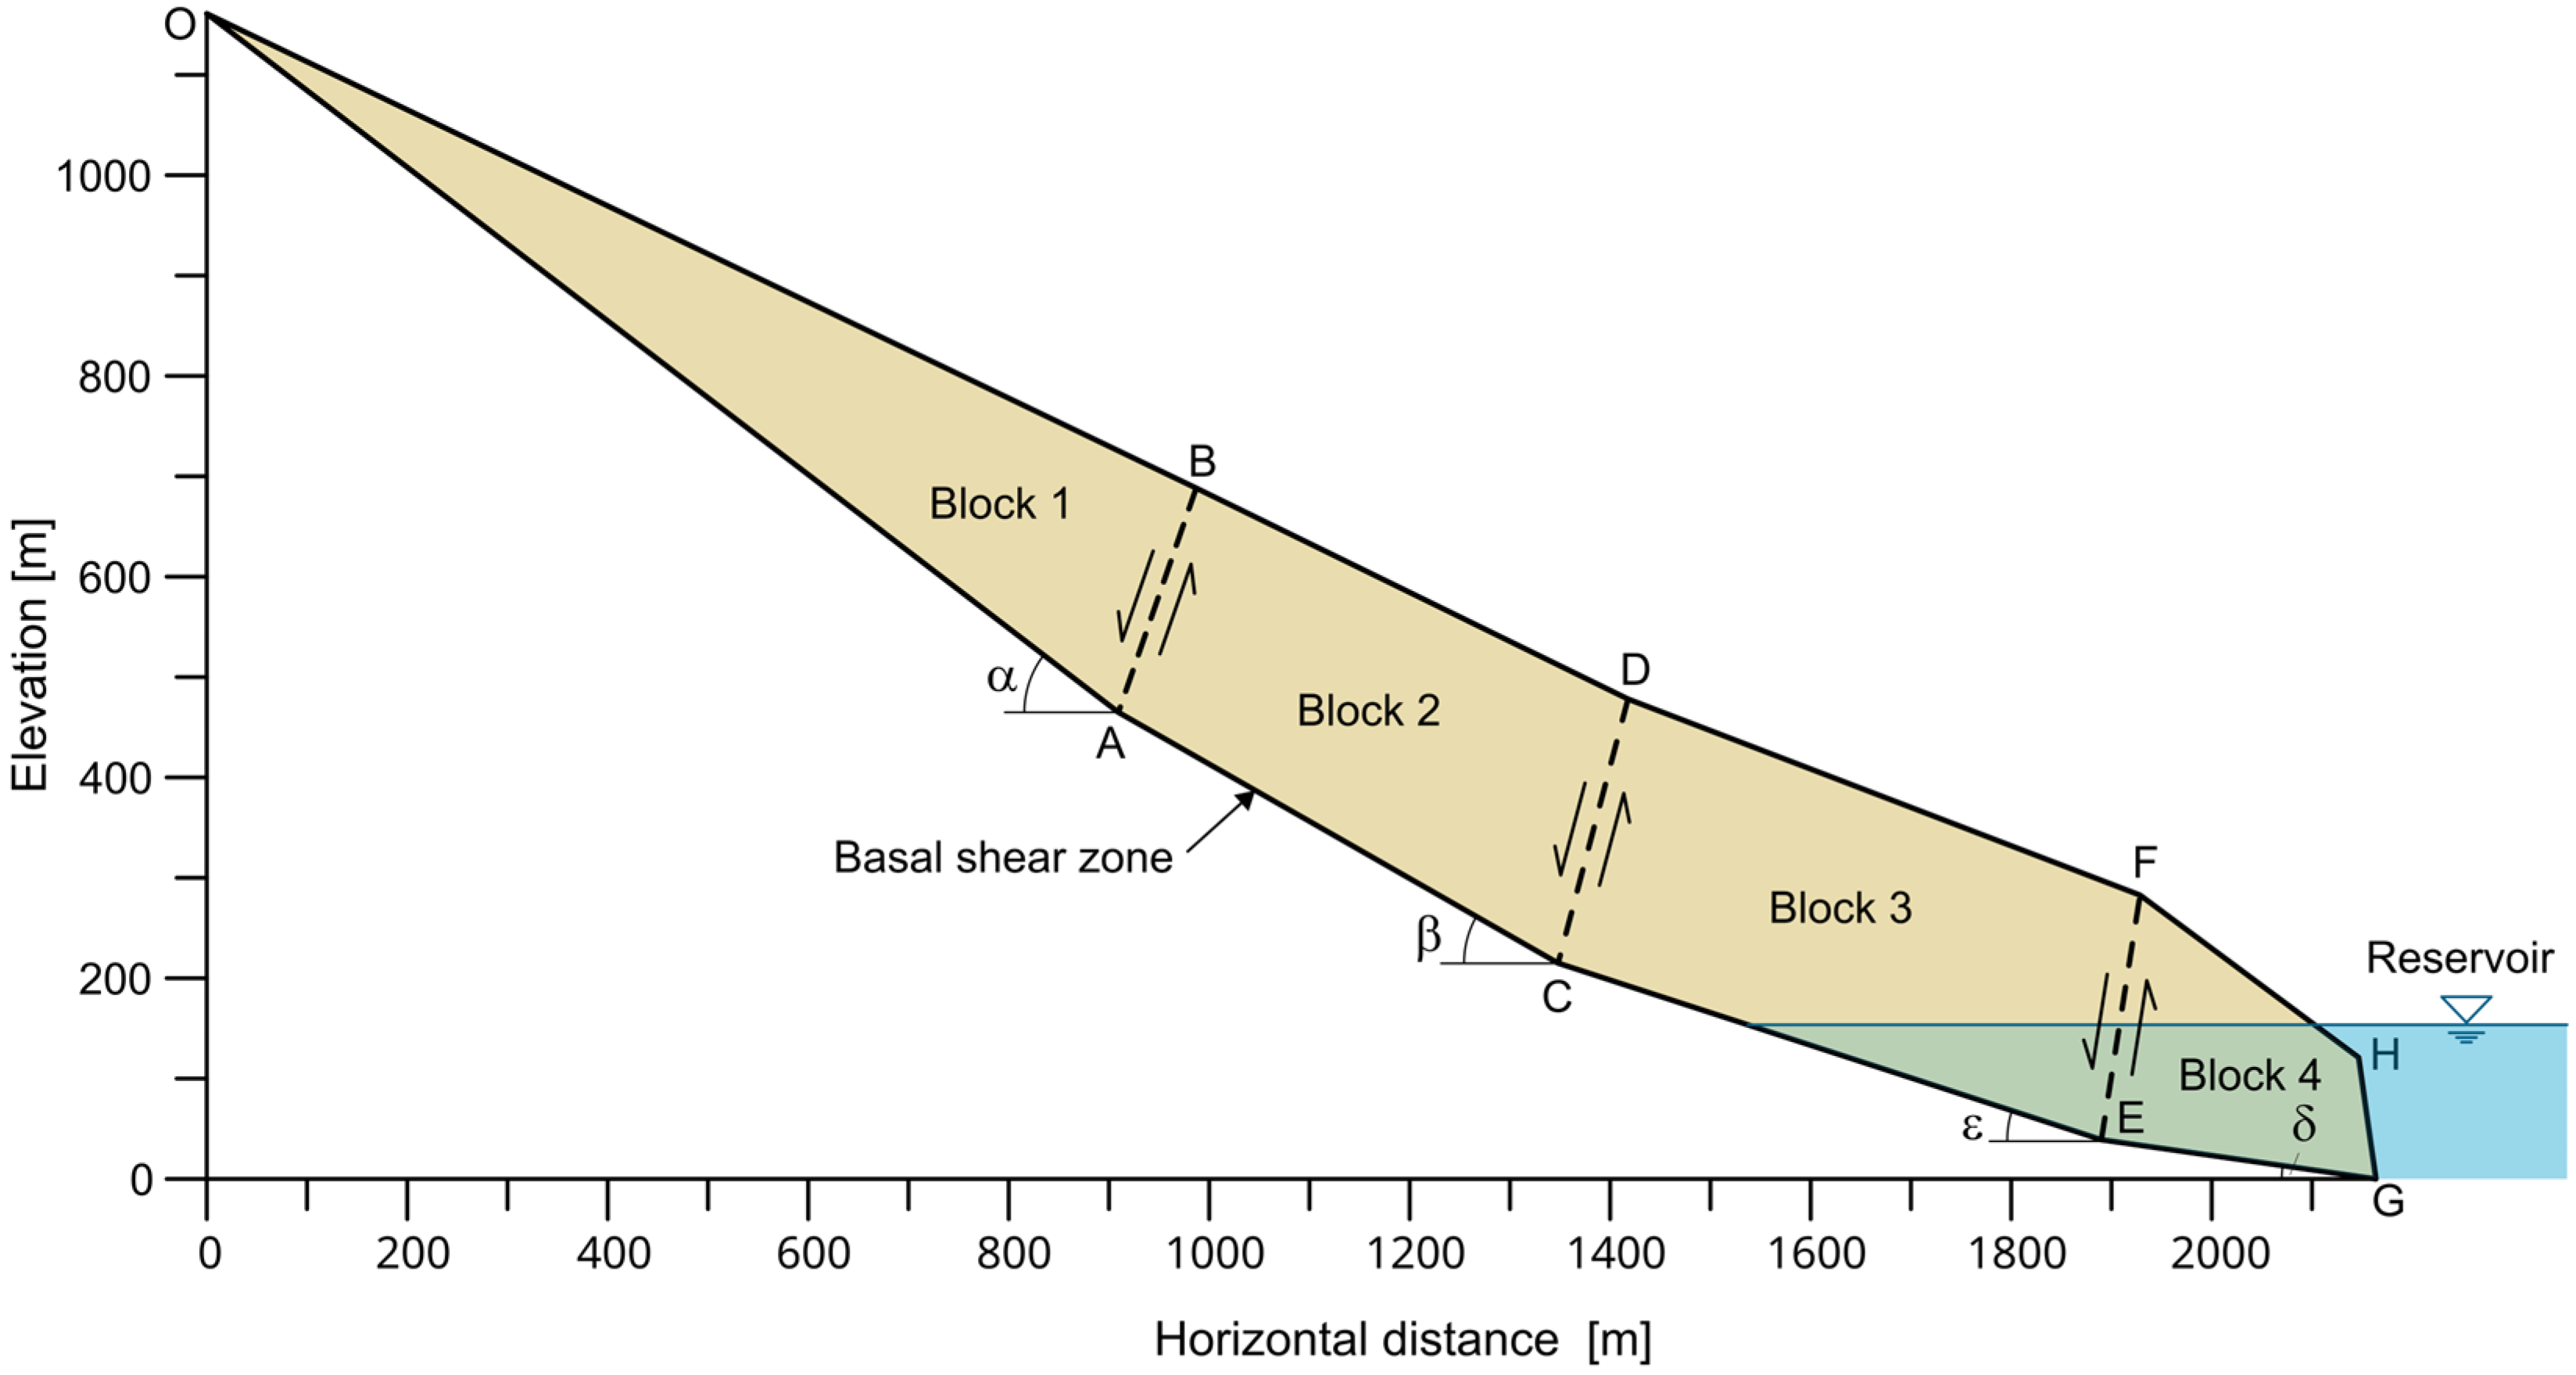
3.1. Rock Slide Structure and Hydrogeology
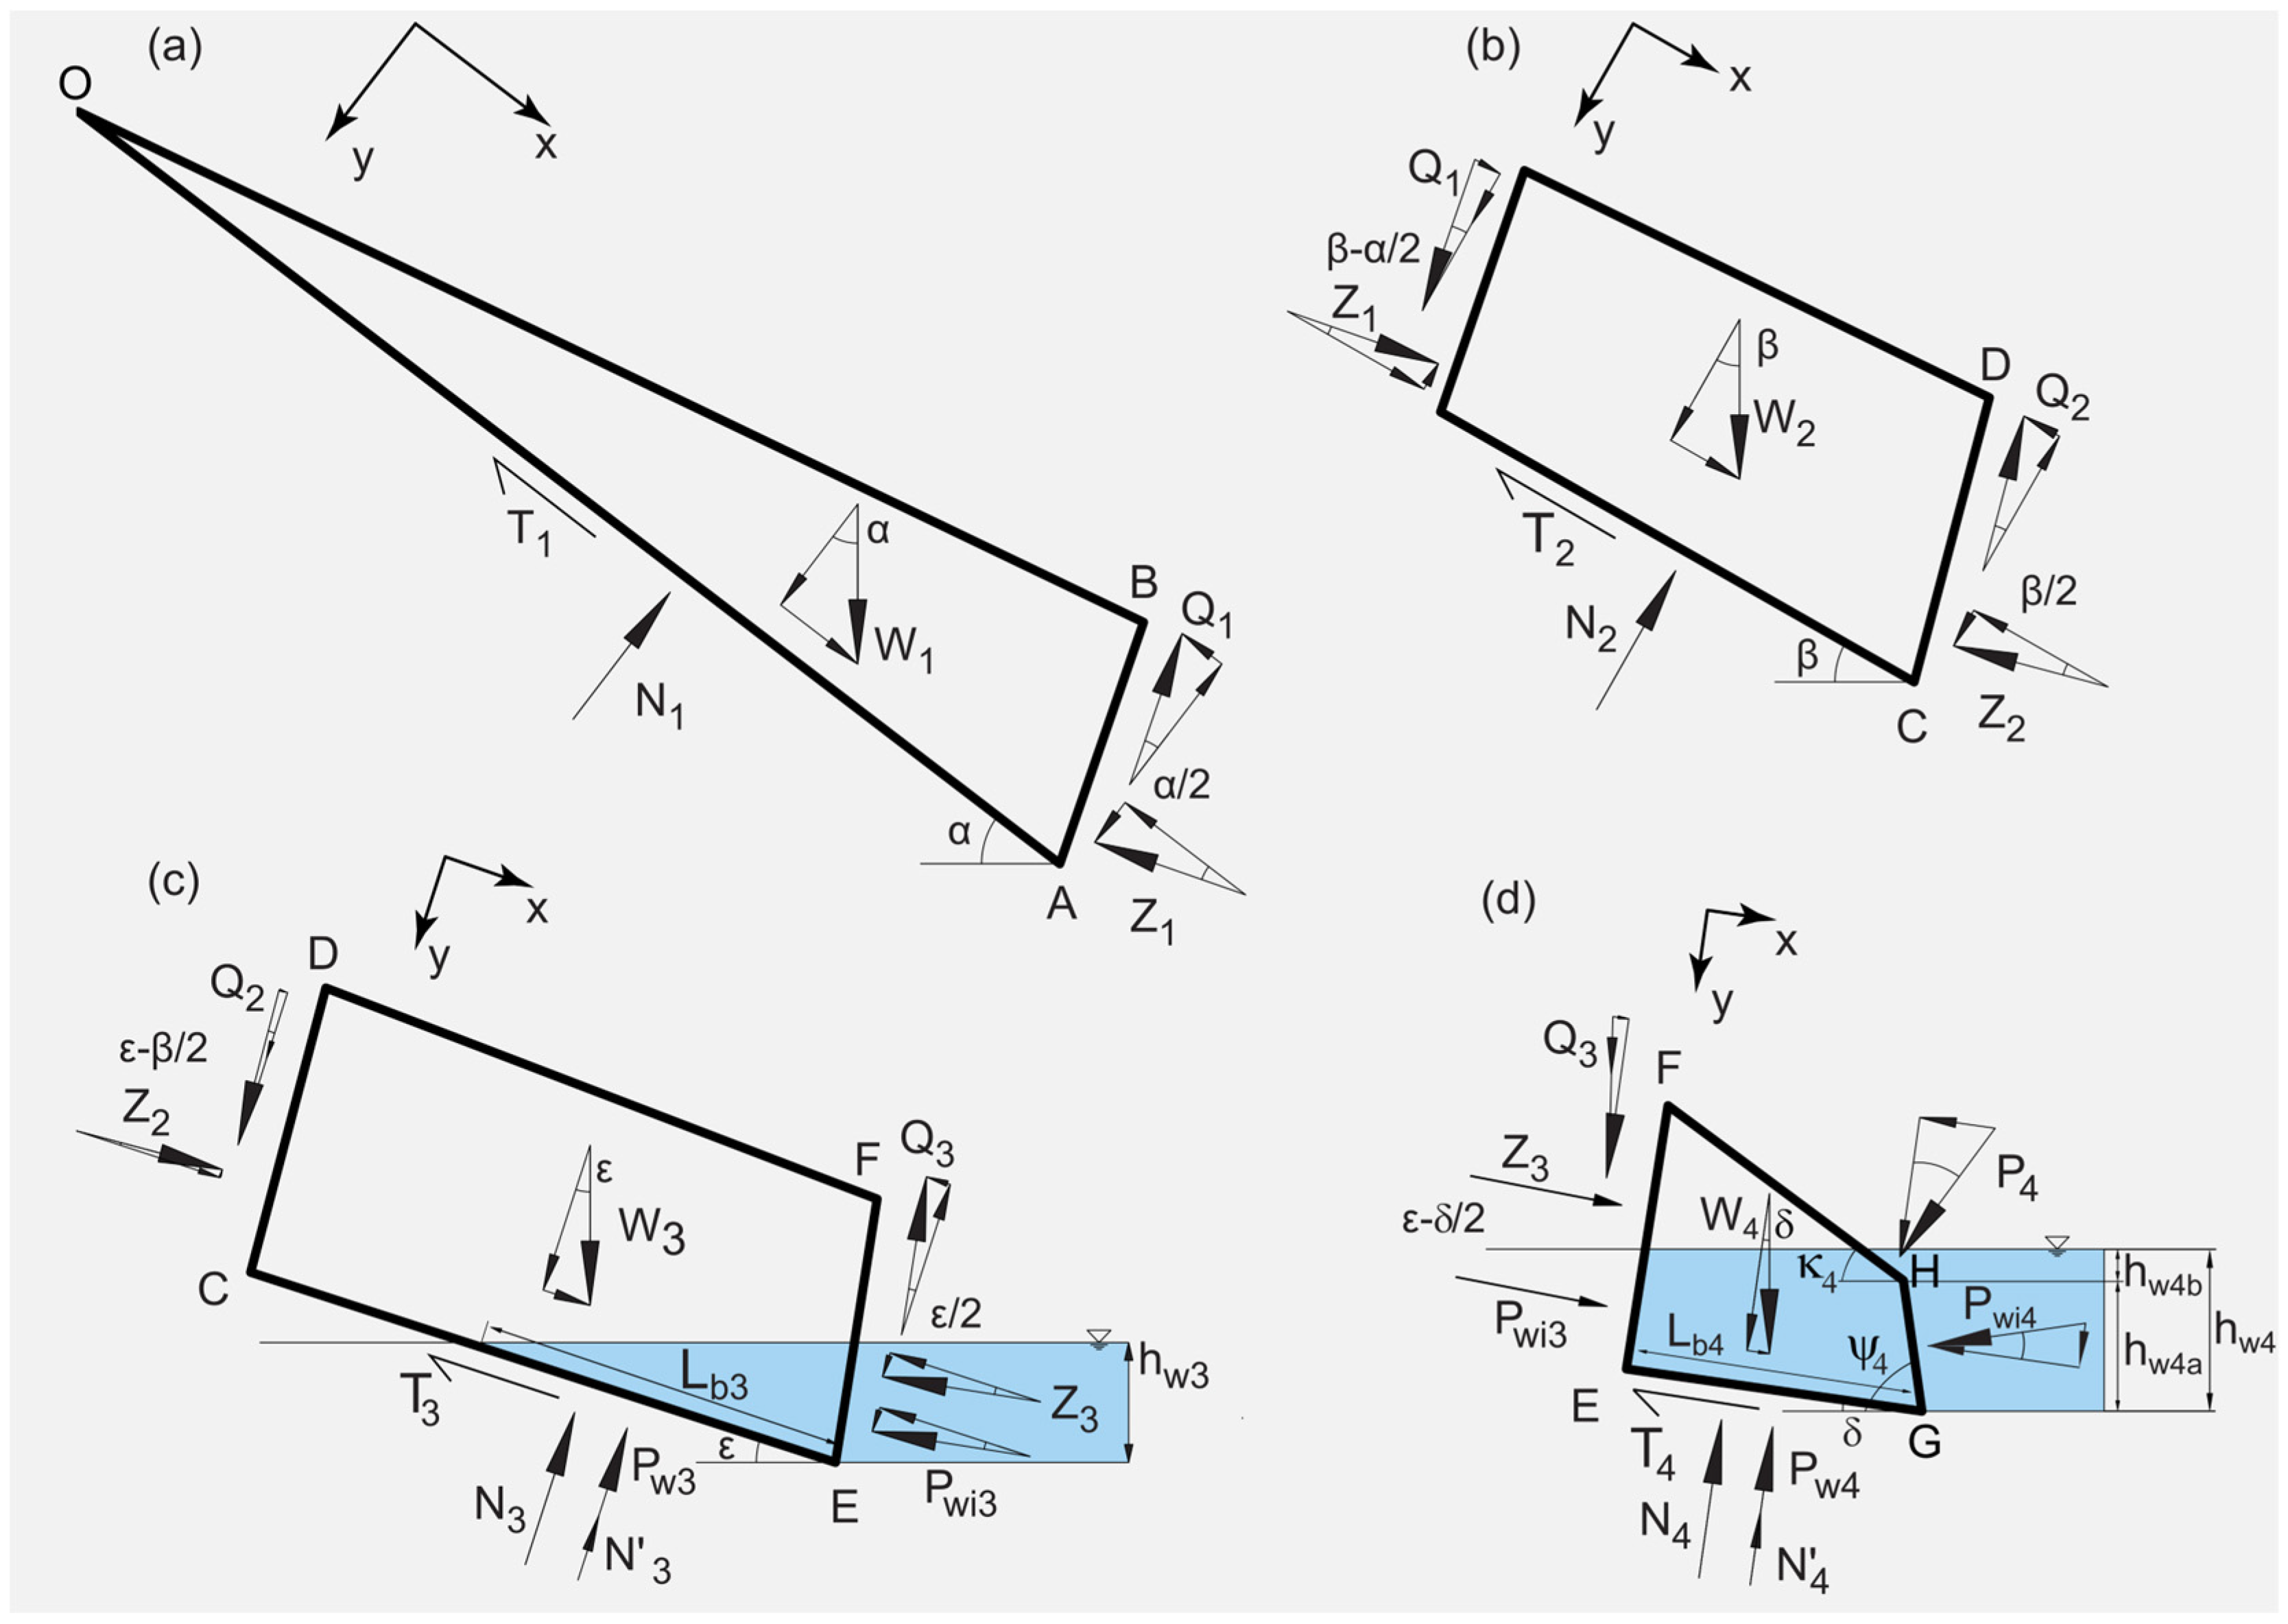
Deep-seated rock slides are characterized by the movement along one or multiple shear zones. They can reach large volumes of several hundred million cubic meters and thicknesses of up to 300 m [20,21]. In general, the stable bedrock is overlain by the heavily fractured rock slide mass and the basal shear zone is located in between. Hence, a conceptual rock slide model can be created based on three main domains, consisting of the highly fractured and loosened rock slide mass, the basal shear zone, and the stable fractured bedrock below. All of these three domains are characterized by specific geomechanical and hydrogeological properties.
Shear zones often follow pre-existing discontinuities such as foliation, bedding planes, tectonic fault zones, and joints, and are built up by highly disintegrated and crushed material with soil-like characteristics [22,23]. They can reach several meters to tens of meters in thickness [21,24]. During downslope displacements, strain localization causes intensive fragmentation and shearing which in turn leads to the formation of fault gouges and breccias along these shear zones. Accompanied by the sliding mechanism, ongoing rock slide mass deformation changes the overall slope topography. Consequently, many rock slides reaching an advanced deformation stage show a concave-shaped topography with a depression zone in the middle to upper part and a convex, bulge-like topography at the bottom of the slope [24,25]. Furthermore, internal fracturing and fragmentation of the rock slide mass into slabs is frequently observed and effects the geomechanical behavior and the groundwater flow regime.
In general, the presence of groundwater flow within a slope has destabilizing effects caused by the reduction in effective stresses due to the contributing water pressures in the discontinuity network and affected rock/soil. Transient water pressures are of significant relevance when considering the stability and deformation behavior of such rock slides, in particular when influenced by large dam reservoirs. The conceptual three-domain model proposed above also has implications for groundwater flow and, hence, the spatial and temporal variable pore pressure distribution. The intensively fractured and loosened rock slide mass is characterized by an extremely wide variation in hydraulic conductivity values, which can differ by many orders of magnitude [26,27]. The creation of new fractures and fracture zones as well as fracture opening, which increases the hydraulic aperture during ongoing slope movement, are responsible mechanisms, leading to spatial heterogeneities and a broad range of hydraulic conductivities [1,27,28,29]. On the one hand, progressive shear deformation along the shear zone results in a decline in hydraulic conductivity, and on the other hand, ongoing slope deformation increases the permeability of the rock slide mass itself. Similar to brittle fault zones, the hydraulic properties of shear zones can vary greatly. While clayey–silty fault gouges cause low hydraulic conductivities, sandy–gravelly fault breccias lead to significantly higher conductivities. Thus, a continuous gouge layer within a basal shear zone reaching hydraulic conductivities in the order of 1 × 10⁻⁹ m/s or even less can act as a hydraulic barrier [9,23,27]. According to experience from various case studies in metamorphic rocks, the hydraulic conductivity of the stable bedrock can also vary greatly, but it tends to be less permeable than that of the rock slide mass [27]. The existence of a low-permeability basal shear zone can lead to significant pore pressure gradients between the compact bedrock and the rock slide mass. For some case studies, it could be proven that the groundwater level in a rock slide mass corresponds to reservoir filling and lowering with a short time lag of hours to only a few days, indicating a highly permeable rock slide mass (e.g., [26,27]).

3.2. Block Model

In order to study and present the impact of reservoir impounding on the stability evolution of deep-seated rock slides in detail, an analytical block model was developed, comprising the essential features and geometries. For this block model, the geometry of the rock slide is divided into four individual blocks, each with a planar plane representing the basal shear zone. In reality, sections of planar shear zones are rare, but a major advantage of this approach over methods such as those of vertical slices is its simplicity and comprehensibility. The boundaries between the individual blocks are arbitrarily defined by steeply inclined contact planes, each with an angle equal to half the angle of the basal plane, measured from the vertical axis. The geometrical profile shown in Figure 1 represents a simplified geometry of a typical rock slide, separated into a four-block model with a reservoir at the foot of the slope. The cross-section in Figure 1 is characterized by the geometrical parameters given in Table 1 and Table 2.
The dip angles of the planar basal shear zone sections of blocks 1, 2, 3, and 4 were assigned to α = 37.4°, β = 29.7°, ε = 18.0°, and δ = 8.1°, respectively (Table 1 and Table 2). For this calculation, cohesion is neglected and assumed as c = 0 kPa. According to the back-calculations, a friction angle of the basal shear zone for each block of φ b = 24.2 ° is needed to meet equilibrium state (FoS = 1) if no reservoir is available. This means that blocks 1 and 2 are unstable, pushing onto the resisting blocks 3 and 4. The effective cohesion cr and friction angle φr along the steeply inclined contact planes between the individual blocks are set to cr = 0 kPa and φr = 30°. In order to investigate the influence of the reservoir on the stability of the rock slide, water pressures related to the reservoir level were applied. The water pressures are given by a horizontal phreatic level based on the assumption that the rock slide mass is highly permeable and overlying a compact, less permeable bedrock. For the sake of simplicity and comparability, a rising groundwater table within the rock slide and bedrock was neglected, but it is obvious that such a water table exists in natural conditions. The calculation is based on the equilibrium of forces; moments were not taken into account.
The factor of safety against sliding is defined by the ratio of the sum of the shear resistance, T i , on the base of the individual blocks (n = 4) to the sum of the applied shear forces, S i , and is calculated by
F o S = i = 1 n T i i = 1 n S i
The shear resistance on the base of the blocks is given by the Mohr–Coulomb failure criterion, transformed into forces, yielding
T i = c b · A b + N i · tan ( ϕ b ) ,
where N i is the sum of the normal reaction forces at the base of the individual blocks, φ b the friction angle, c b the cohesion, and A b the area of the basal shear zone section. The block geometries and external and internal forces of individual blocks are shown in Figure 2.
The shear force S1 of block 1 acting down the plane is calculated as
S 1 = W 1 · sin ( α ) Z 1 · cos ( α / 2 ) Q 1 · sin ( α / 2 ) ,
where W1 is the weight force, and Z1 and Q1 are interaction forces. For block 2, the calculation procedure of the shear force is similar. The shear force for block 3, including the resultants of water pressure forces, is calculated by
S 3 = W 3 · sin ( ε ) + Z 2 · cos ( ε β / 2 ) + Q 2 · sin ( ε β / 2 ) Z 3 · cos ( ε / 2 ) Q 3 · sin ( ε / 2 ) P w i 3 · cos ( ε / 2 ) .
The water pressure p at the base of the block can be expressed as
p = ρ w · g · h w 3 = γ w · h w 3 ,
with ρ w being the density of water and γ w the specific weight of water. The hydrostatic normal force acting at the sliding plane P w 3 of block 3 is determined as
P w 3 = γ w · h w 3 2 2 · sin ( ε ) ,
and the hydrostatic normal force at the lateral boundary of block 3, labeled as P w i 3 , is determined by
P w i 3 = γ w · h w 3 2 2 · cos ( ε / 2 ) .
For block 4, the reservoir water load affecting the exposed rock slide surface has to be considered, which leads to the shear force, S4.
S 4 = W 4 · sin ( δ ) + Z 3 · cos ( δ ε / 2 ) + Q 3 · sin ( δ ε / 2 ) + P w i 3 · cos ( δ ε / 2 ) P w i 4 · sin ( ψ 4 δ ) P 4 · sin ( κ 4 δ )
P w i 4 and P 4 are the water pressure forces acting on the rock slide surface and are given by
P w i 4 = γ w · ( h w 4 a 2 + h w 4 b ) · h w 4 a sin ( ψ 4 )
and, respectively,
P 4 = γ w · h w 4 b 2 2 · sin ( κ 4 ) .
In order to calculate the FoS of the rock slide, the forces induced by the weight of the blocks, i.e., W 1 to W 4 , and the interslice forces must be calculated starting from block 1, followed by a successive calculation of blocks 2, 3 and 4, resulting in Q 1 to Q 3 and Z 1 to Z 3 , respectively. Forces induced by the water pressures at the block boundaries, i.e., P w 3 , P w i 3 , P w 4 , P w i 4 , and P 4 , are determined for block 3 and 4. Based on this, the resulting normal (effective) forces N 1 , N 2 , N 3 , and N 4 were calculated to obtain the shear resistance, T1 to T4, of the basal plane of each block. Combining the shear resistances with acting shear forces at the basal plane provides the FoS of the slide. A detailed summary of the equations relevant for the calculation of the four-block model are shown in Appendix A.
Furthermore, FoS calculations were carried out by means of the software Slide2 [18] to verify the calculations conducted by hand. A factor of safety of FoS = 1 is assumed for the rock slide model without a reservoir. In doing so, the FoS reduces to values below one if the water pressure from the reservoir is included in the stability calculations. Figure 3 shows the calculated FoS values in relation with the reservoir water level. Regardless of the applied calculation method, the stability of the slope decreases by increasing the level of the reservoir until a certain threshold water level is reached. From this turning point, the FoS increases with further impounding. A similar FoS to reservoir level behavior was also obtained by previous studies (e.g., [12,30]).
The Fellenius method is considered the simplest of the methods of slices since the interslice forces are neglected [19]. In this study, the FoS calculations based on the Fellenius method provides the most conservative results, with an FoS lower than 3–5%. The method of Spencer and Morgenstern [19] gave similar results, only varying by less than 1%, at least at lower reservoir elevations. The FoS is slightly more conservative with lower values than those obtained by the method of Morgenstern and Spencer. The four-block model fits the Morgenstern and Spencer calculations reasonably well, especially in the section below the threshold water level. When the water level is further elevated, the deviation between both curves becomes larger, most likely influenced by the different calculation methods (Figure 3). The block model assumes a constant density of the rock slide mass, regardless of whether the mass is partially or completely saturated with water. Furthermore, the orientation and the shear properties of the arbitrarily chosen contact planes have an effect on the calculated FoS.

4. Impact of Rock Slide Geometry on Reservoir Impounding Behavior

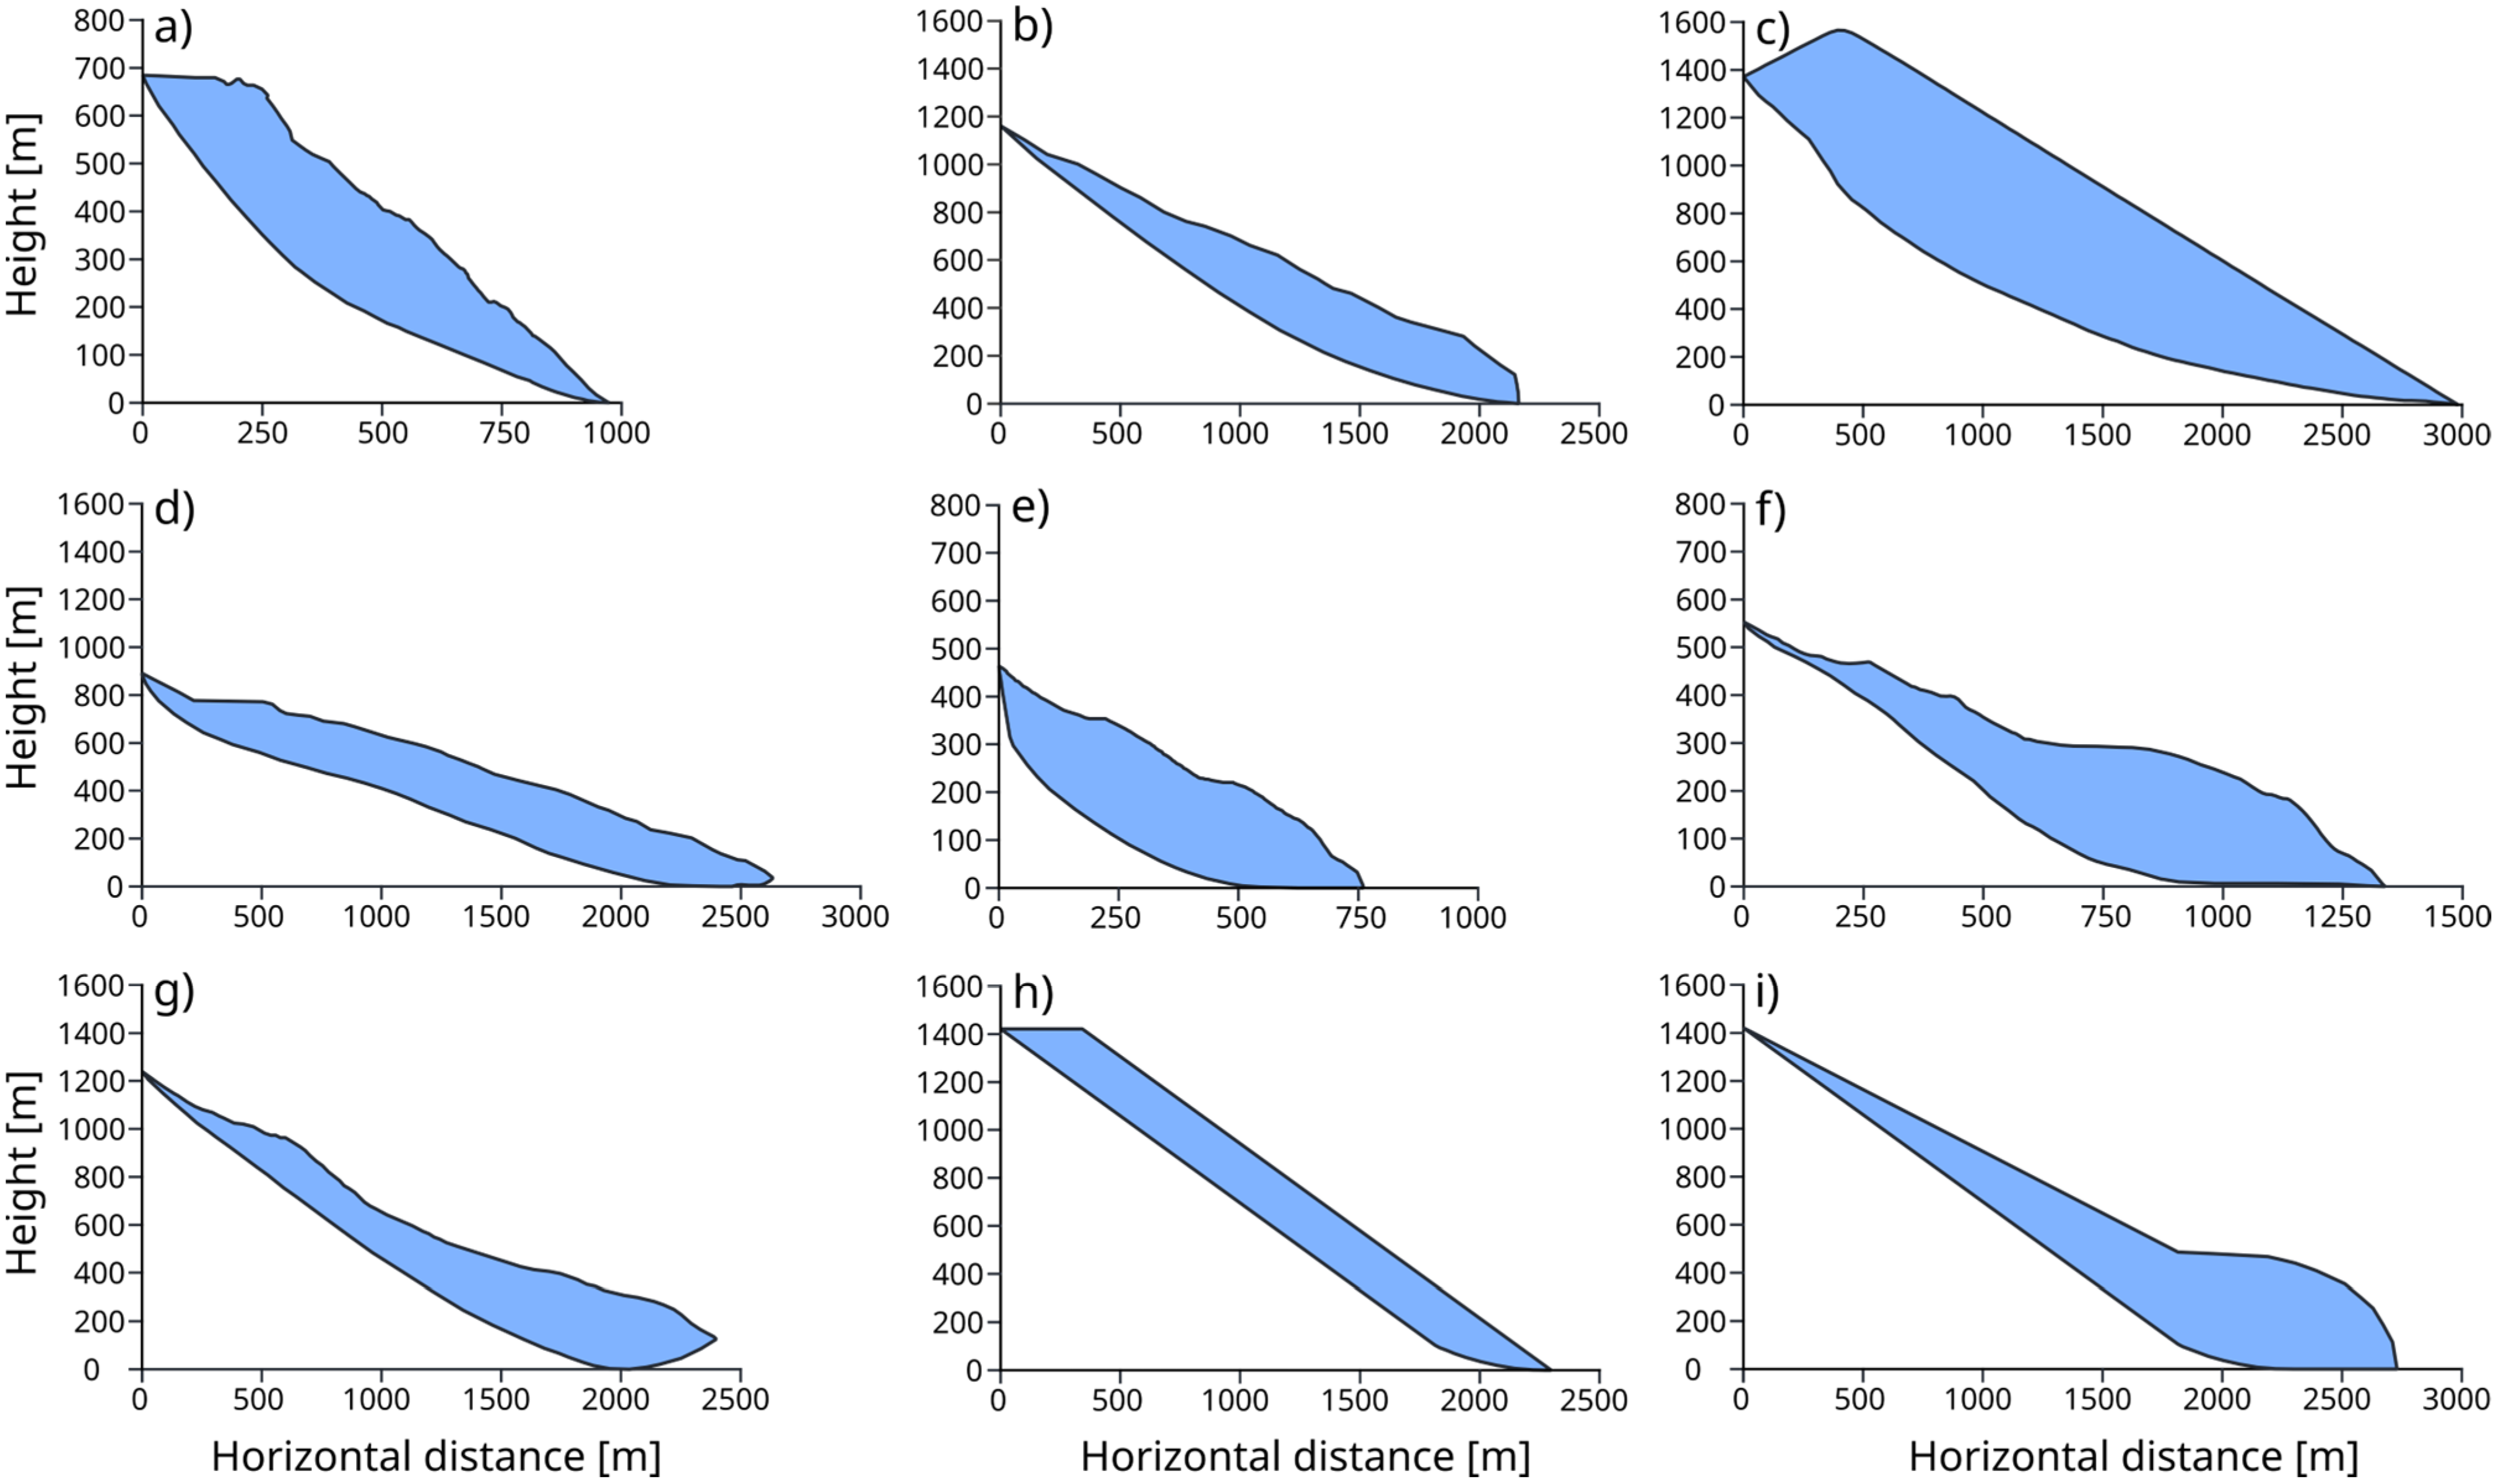
4.1. Selected Case Studies

Since the initial reservoir infilling of the Laxiwa Hydropower Station in March 2009, the orographically right valley flank has shown significant movements of a 700 m high and 1000 m wide area [7,8]. The shear offset of the more than 100 million m3 large deep-seated rock slide accumulated from the beginning of the infilling up to several tens of meters. Based on the geomorphological features, it is assumed that the Laxiwa rock slide is a pre-existing slide, situated in a heavily fractured and weathered granitic rock mass, that was reactivated during reservoir impounding. Several different geometries of the slide were proposed, including a rotational sliding mechanism [8] and a more translational mechanism [7]. This study is based on the rather simple model proposed by Zhang et al. [8] as shown in Figure 4a.
The Niedergallmigg rock slide is an up to 300 m thick active slide situated in Tyrol (Austria) with a volume of about 430 million m3 [25]. The main scarp of the rock slide indicates a total cumulative displacement of about 200 m with an estimated pre-failure mean slope inclination of 30° (Figure 4b). Kinematically, the rock slide shows a rotational sliding behavior which most likely originated from a deep-seated flexural toppling mechanism. The fractured rock mass is composed of foliated phyllitic gneisses, phyllites, and schists. Given that this rock slide shows a very typical geometry of a deep-seated rock slide in heavily foliated metamorphic rock, it was selected for this study, although there is no reservoir at the foot of the slope.
With a volume of more than 3000 million m3, the Köfels rock slide in the Ötztal Valley (Tyrol, Austria) represents the largest known fossil rock slide in metamorphic rock masses in the European Alps [31]. The rock slide formed in the early Holocene 9527–9498 cal. BP and failed as an extremely rapid and sudden event, with a source located in competent fractured orthogneisses [32]. Discontinuities play a major role in the development of the slide, the rotational sliding mechanism, and its failure geometry (Figure 4c).
The Downie slide is an approximately 1500 million m3 large rock slide situated on the west bank of the Revelstoke Reservoir in British Columbia, Canada [2,3,33]. The Downie slide attains a maximum thickness of 250 m and an overall slope angle of the surface topography and basal shear zone of about 18° was determined, predominantly leading to a translational sliding mechanism (Figure 4d). The rock mass is highly fractured and composed of granitic rocks with inter-layers of schists [28]. Site investigations revealed a basal shear zone ranging from less than 2 to nearly 50 m in thickness, composed of zones of heavily fractured rock, fault breccia, and clay-rich gouge. The geometrical model used for this study is based on Moore [2].
Beauregard is a rock slide located at the left abutment slope of the Beauregard reservoir in the Aosta Valley in north-western Italy [6,34]. The rock slide extends over an area of about 2100 by 2200 m, comprising a total volume of several hundred million m3, and is composed of different slabs. The most active rock slide slab which is in direct contact with the dam has a maximum thickness of 240 m and represents a rotational sliding mechanism (Figure 4e). Movements were first recognized in the 1960s during initial reservoir impoundment and have been recorded since then with a surface rate of approximately 4 to 6 mm/year. It is not clear whether the rock slide has been reactivated as a consequence of reservoir filling or if the movements existed already, but reservoir level fluctuations clearly influence the deformation rates. The fractured rock mass is composed of gneisses and mica schists, and the basal shear zone is composed of fault breccias and gouges, up to a maximum thickness of 20 m.
On 9 October 1963, the 270 million m3 large Vajont rock slide failed and slid rapidly into the Vajont reservoir, producing an enormous wave that overtopped the dam, destroying several villages and leading to more than 2000 fatalities [5]. The rock slide scarp area is located in a complex sequence of carbonatic rocks with thin clayey inter-layers. Since this event, numerous studies have been published that led to different geometrical models and interpretations (e.g., [30,35,36]). For this study, the original model of Hendron and Patton [35] was taken (Figure 4f).
The Little Chief slide is located 3 km upstream of Mica Dam in British Columbia, Canada, and is composed of mica gneiss, mica schist, and hornblende gneiss [9]. The rock slide reaches a maximum thickness of roughly 300 m at the slope toe and has a volume of approximately 800 million m3. Slope movement has been monitored since 1969, with a consistent rate of 4–14 mm/year [9]. The rock slide did not show any impact due to the filling of the Mica Dam reservoir in the 1970s, and the basal shear zone is composed of clay-rich gouges ranging from a few mm to about 200 mm in thickness [37]. The geometry proposed by Watson et al. [9] serves as the model for our calculation (Figure 4g).
Additionally, two generic rock slide models were established for this analysis, one representing a pure translational rock slide oriented parallel to a planar slope with a dip angle of 32° (Figure 4h) and another one, a compound-type model, with a massive mass located at the slope foot over a gentle inclined basal shear zone ([38], Figure 4i).

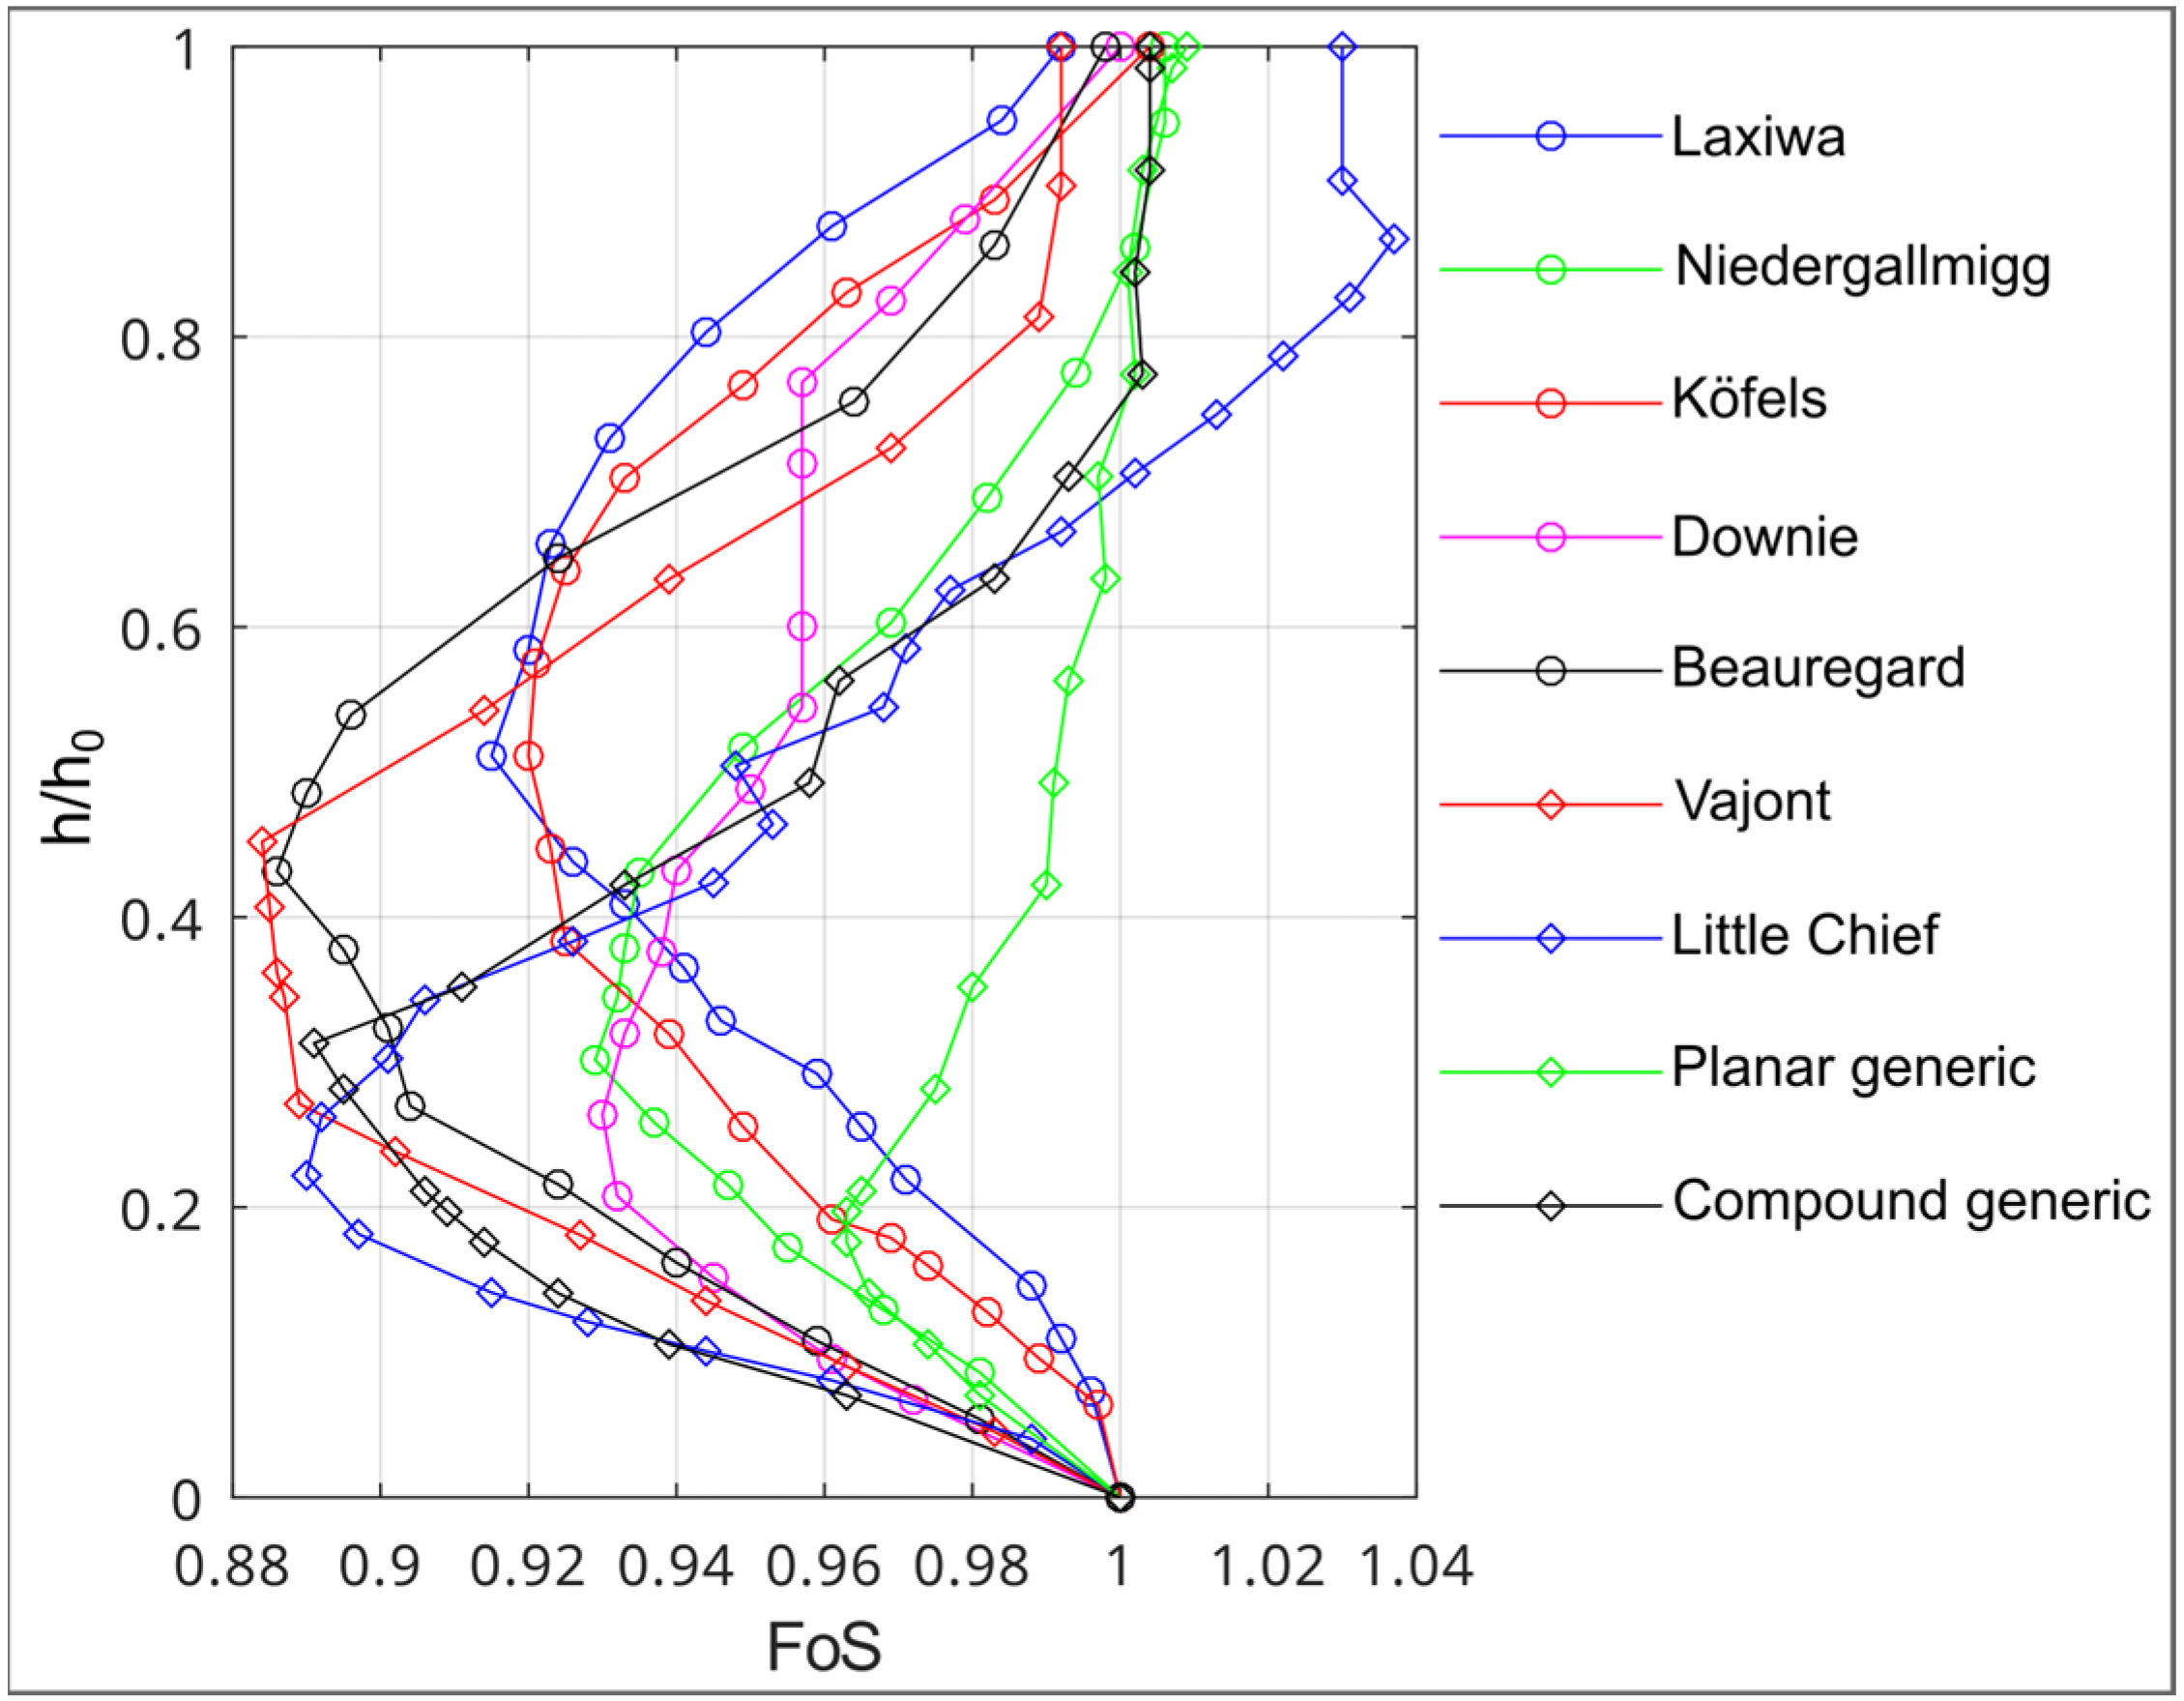
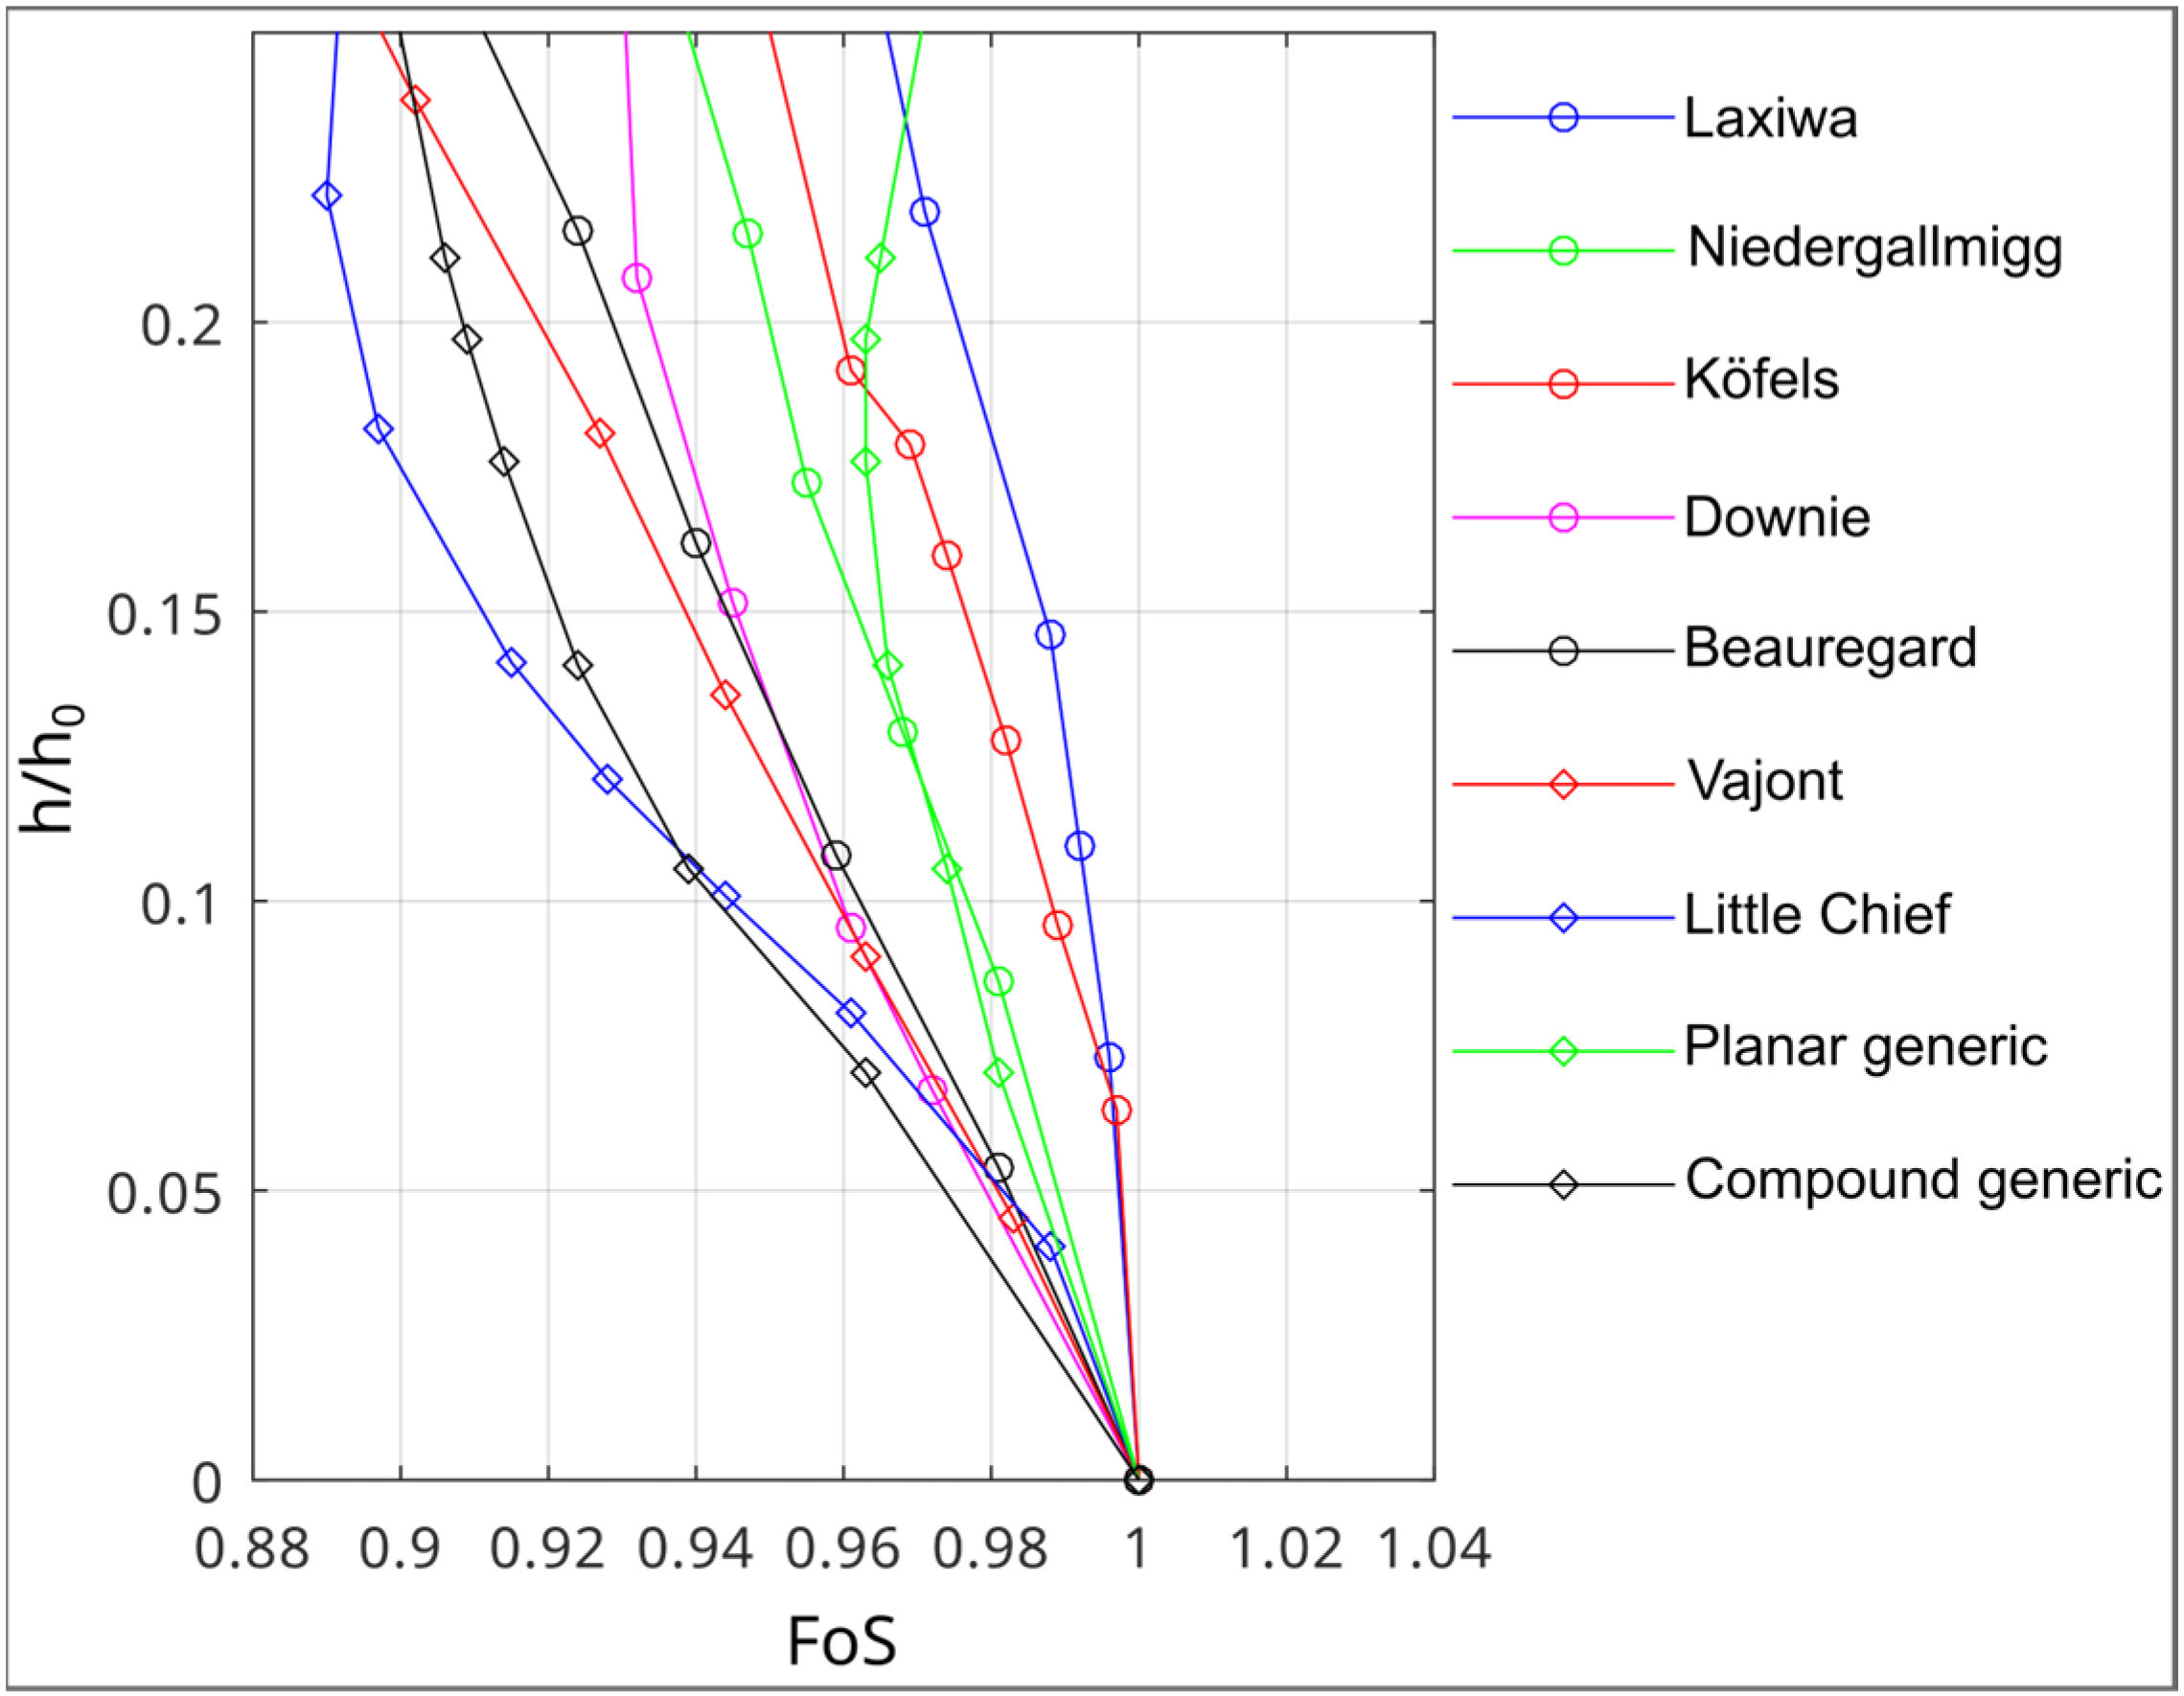
4.2. Limit-Equilibrium Analyses

The two-dimensional limit-equilibrium analysis was performed to investigate the reservoir-driven change in the FoS during reservoir impounding. Based on the nine different rock slide models, the impact of the geometrical factor on the stability evolution during first-time impoundment was studied in detail (Figure 4). Seven of the nine models represent pre-existing rock slides with a defined geometry and a basal shear zone composed of fault gouges and breccias. All rock slides are characterized by a sliding zone that outcrops at the foot of the slope. Slope stabilizing effects due to the accumulation of alluvial sediments at the slope foot were not considered.
It has to be mentioned that the aim of this study was not to perform a realistic stability analysis for the individual case studies. Instead, an attempt was made by using identical parameters to make these rock slide models comparable and to carry out a sensitivity analysis. Therefore, various assumptions were made. First of all, no inclined natural groundwater tables typically observed in such slopes were implemented. Only a horizontal groundwater table resulting from the reservoir and varying with its elevation was considered, and transient groundwater flow from the reservoir into the rock slide or vice versa is denied. As an initial step, FoS = 1 was calculated before reservoir impounding by varying the friction angle of the basal shear zone and keeping the other parameters constant. According to [12,39], it can be assumed that pre-existing rock slides are characterized by a low factor of safety close to one. The determined friction angle shown in Table 3 was then used for the respective model for the calculation with the reservoir at the foot, whereby the level was successively increased. Thereby, all other parameters were kept constant, and for the stability analysis, the widely used Mohr–Coulomb failure criterion was adopted.
Whilst increasing the reservoir levels, the pore pressure in the slope changes, causing a reduction in the FoS in relation to the initial condition. The amount of reduction in the FoS = 1 with the increasing water level provides information on the sensitivity of the rock slide geometry to initial infilling of the dam reservoir. However, it has to be mentioned that a decline in the FoS below one does not necessarily imply failure or displacement; numerous other factors must be taken into account. This study rather aims to provide a comparison of the change in the FoS in relation to raising reservoir levels. In all cases, the complete impounding of the reservoir of the rock slide was simulated, reaching the total vertical height (h0) of the slide.
For calculation purposes, the basal shear zone material was considered as a purely frictional material, and cohesion is neglected (c = 0 kPa) based on the assumption that the pre-existing shear zone is near a residual stage [12]. All material properties, with exception of the friction angle of the basal shear zone of the individual slides, are kept the same for all models. The rock slide material was assumed to be a highly fractured mass with a porosity of 20%, representing a common value obtained for numerous slides [25]. The unsaturated unit weight of the rock slide mass overlying the shear zone is 21 kN/m3 and the saturated unit weight is 23 kN/m3. The unit weight of the undisturbed bedrock is about 27 kN/m3.
The results clearly show that the rock slide geometry has a considerable influence on the evolution of the FoS during reservoir impounding. In Figure 5, the calculated FoS values are plotted versus the ratio of the submerged height (h) to the total height (h0) of the rock slides, from no reservoir up the total impounding of the rock slides. As expected from the block model, with the increasing reservoir water level, the FoS decreases until a minimum value at the threshold reservoir level is reached. With further increase in the reservoir water level, the FoS increases again and returns almost to its initial state when the rock slide is fully submerged, i.e., h/ho = 1.
For the Laxiwa slide, a maximum reduction to FoS = 0.915 at 51% impounding was found. The Niedergallmig slide is characterized by a reduction to FoS = 0.929, when the reservoir reaches a level of 30% of total infilling. The Köfels slide reaches its maximum change at 51% impounding with FoS = 0.920. The Downie slide’s minimum FoS = 0.930 occurs at 26% impounding. The Beauregard slide has a minimum FoS = 0.886 at 43% impounding. The Vajont slide needs 45% impounding to reach a minimum FoS = 0.884, which is the lowest value, obtained for all models. Similarly, the Little Chief slide is characterized by considerable changes to FoS = 0.890 at a reservoir level of only 22%. The planar generic model shows the minimum FoS = 0.963 at a reservoir level of 18%, and the compound generic model at 31% has FoS = 0.891.
Depending on the case study, the minimum FoS is reached when 18–51% of the rock slide height is submerged in reservoir water. The Little Chief slide shows the largest change in FoS with the lowest reservoir level of all case studies. Generally, the maximum reduction at the threshold water level from FoS = 1 was between FoS = 0.963 for the planar generic slide and FoS = 0.884 for the Vajont slide, i.e., resulting in a decrease in stability between 3.7% and 11.6%.
Figure 6, a detailed view of Figure 5, represents the FoS changes up to a ratio of h/h0 = 0.25. For the ratio of h/h0 = 0.1, i.e., 10% impounding, the FoS varies between 0.993 and 0.942, resulting in a change in FoS from 0.007 to 0.058, i.e., 0.7 to 5.8% (Table 3). If the ratio h/h0 is further increased to 0.2, i.e., 20% impounding, the FoS reduction is substantially larger and varies between 0.025 and 0.106. A more than 10% reduction was obtained for Little Chief, a slide which is characterized by a curved basal shear zone, dipping into the slope at the foot.
The largest influence due to reservoir infilling was observed for rock slides characterized by a geometry in which the majority of the mass lies in the lower section. The analyses also show that translational or rotational slides are influenced differently; a greater influence occurs for rotational and compound slides. The Vajont, Little Chief, Beauregard, and generic compound slides are characterized by the largest reductions of up to 12%, even if their height ratio h/h0 is rather different.

5. Discussion

This study focuses on the influence of geometry on stability evolution during the impounding of a reservoir by analyzing different real and generic deep-seated rock slide models. In addition, a block model was developed to introduce the fundamental mechanisms and to provide a tool for calculations.
Our study, which only focuses on the overall geometry, led to several implications when assessing rock slide hazards in the surrounding areas of reservoirs. At the beginning, the FoS continuously decreases until a threshold reservoir level with the lowest FoS is reached. From there, the FoS increases again until the rock slide is fully submerged. Practically, the impact of this reduction can be very different. In some cases, the reduction in the FoS can lead to the acceleration of the total slide or only slabs of it, or the formation of a new active slide. In the worst case, although extremely seldom, sudden failure of a slide can occur [5], and in contrast, case studies also show that there can be no observable or measurable impact on pre-existing slides [9]. In order to be able to assess the actual behavior of specific case studies, further investigations and numerical modeling are absolutely necessary.
Wo found a clear tendency that the decrease in the FoS is larger for rock slides where the majority of the mass is arranged at the foot of the slope. In contrast, rock slides whose mass is mainly located in the central to higher sections of the slope are less affected at the beginning of reservoir impounding. Nevertheless, the change in the FoS can also be very pronounced, but later when a larger height ratio, for example at h/h0 = 0.5, is reached. Thus, the height of the final operational reservoir level in relation to the total height of the rock slide has a significant influence on the maximum change in stability.
Depending on the rock slide geometry, i.e., translational, rotational, or compound, the maximum reduction in the FoS can be considerable and, in our case, reaches almost 12%. Since this study is based only on a few case studies, it is quite conceivable that even larger reductions are possible. It is also noteworthy that the greatest reduction in the FoS occurred for the Vajont case study, and for this slide, sudden failure did occur during the third impounding cycle [30].
Even if the FoS increases again at higher water levels, the threshold water level must have been passed during the initial impoundment. In this case, the threshold water level has to be taken for stability assessment and not the maximum reservoir level. Consequently, finding the most unfavorable water level characterized by the greatest reduction in the FoS is recommended by carrying out calculations with different water level heights. As a result, an FoS reservoir level height curve representing the relationship between height and slope stability can be obtained.
It should also be noted that deep-seated rock slides are often separated into individual slabs bounded by shear zones of fault gouge and breccia. In these conditions, each slab should be subjected to an impounding analysis and not just the entire rock slide. It is also necessary to assess whether the existing rock slide mass is prone to the formation of new slabs, especially at the foot of the slope. Lithological and structural zones of weakness as well as a high degree of fragmentation of the rock slide mass are predestined for progressive slope processes. Slab formation increases the complexity in terms of the temporal variable deformation behavior, slope stability, and the overall hydrogeological situation. Soil-like basal and internal shear zones separating individual slabs or the bedrock from the rock slide mass are spatially heterogenous in terms of shape, thickness, and hydro-mechanical coupled properties. Even highly advanced numerical modeling techniques are only suitable to a limited extent to satisfactorily simulate the diverse geometrical and hydro-mechanical coupled aspects of such rock slides when separated into variable active slabs.
Due to its simplicity and the low number of parameters, a wide range of influencing factors were not considered in this study. At this point, it must be mentioned again that the FoS determined herein cannot be transferred to the real case studies. An important criterion is the geological situation at the foot of the slope, i.e., how the basal shear zone emerges from the slope. Outcropping of the shear zone on the slope or interaction with alluvial deposits on the valley floor have completely different effects on stability [25]. In the latter, these sediments can act as a buttressing mass and have a positive effect on the stability behavior.
In addition, the geometrical and transient interaction of the natural groundwater situation (e.g., rising water table) in the slope with the reservoir (e.g., water level) is not taken into account in this study, nor is the role of complex material models of the shear zones, such as hydro-mechanical mechanisms, progressive fracturing, or time-dependent deformation processes.

6. Conclusions

Even though the rock slide models used herein are highly simplified and only two-dimensional, this study highlights the importance of having profound knowledge on rock slide geometry. Depending on the filling level of the reservoir, a maximum reduction in the FoS between 3.7 and 11.6% was achieved, indicating a remarkable influence of the factor of geometry. The reservoir level in relation to the vertical height of the rock slide mass was found to be an additional parameter controlling the reduction in the FoS. Hence, this reduction can lead to increased movement rates or reactivations of rock slides. In order to avoid adverse impacts during the impounding and operational phase, knowledge of the maximum reduction in stability and the complete reservoir impounding versus the relative change in safety factor is essential. However, this can only be achieved if the lithology, the discontinuity network, the geometry, the geomechanical properties, and the hydrogeological situation are investigated in detail for the respective case study.
Conclusively, this study emphasizes the need for comprehensive investigations based on a multi-method approach, comprising (i) detailed terrain analyses by using high-resolution digital elevation models, (ii) geomorphological and geological mapping, (iii) geophysical investigations, (iv) sufficiently deep core drillings to characterize the rock slide mass and to localize the basal shear zone (and internal shear zones if available), (v) hydrogeological investigations, (vi) rock slide deformation and hydrogeological monitoring, (vii) geometrical–kinematical rock slide model development, and (viii) numerical modeling analyses considering the hydro-mechanical coupled aspects of the slide.

Supplementary Materials

The following supporting information can be downloaded at: https://www.mdpi.com/article/10.3390/app14114631/s1, The m-file for the block model created by GNU Octave 8.4.0 is provided herein.

Author Contributions

Conceptualization, C.Z. and A.S.; methodology, C.Z.; software, A.S. and H.L.; validation, C.Z. and A.S.; formal analysis, H.L. and A.S.; investigation, H.L. and C.Z.; resources, C.Z.; data curation, C.Z.; writing—original draft preparation, C.Z.; writing—review and editing, C.Z. and A.S; visualization, C.Z.; supervision, C.Z. All authors have read and agreed to the published version of the manuscript.

Funding

This research received no external funding.

Data Availability Statement

The m-file for the block model created by GNU Octave (https://octave.org/ Version 8.4.0, accessed on 1 February 2024) is available in the Supplementary Materials. This program is free software: you can redistribute it and/or modify it under the terms of the GNU General Public License as published by the Free Software Foundation, either version 3 of the license or (at your discretion) any later version. This program is distributed in the hope that it will be useful, but without any warranty: without even the implied warranty of merchantability or fitness for a particular purpose. See the GNU General Public License for more details (http://www.gnu.org/licenses/ accessed on 1 December 2023).

Acknowledgments

The quality of this manuscript was improved by the constructive comments of two anonymous reviewers.

Conflicts of Interest

The authors declare no conflicts of interest.

Appendix A

Concerning the block 1 model’s geometry, the external and internal forces are shown in Figure 2a. The sums of the horizontal and vertical forces are calculated by
F x = W 1 · sin ( α ) T 1 Z 1 · cos ( α / 2 ) Q 1 · sin ( α / 2 )
F y = W 1 · cos ( α ) N 1 + Z 1 · sin ( α / 2 ) Q 1 · cos ( α / 2 )
For a static equilibrium, Equation (A2) leads to the normal reaction force at the base of the block, given by
N 1 = W 1 · cos ( α ) + Z 1 · sin ( α / 2 ) Q 1 · cos α / 2 .
The shear resistance on the base of the block is given by
T 1 = c r · L b 1 + N 1 · tan ( φ b )
and the interaction forces Q1 and Z1 are related through
Q 1 = c r · A B + Z 1 · tan ( φ r )
Equation (A1) combined with Equations (A3)–(A5) becomes
W 1 · a 1 Z 1 · a 2 + c r · A B · a 3 = 0
where a1, a2, and a3 are trigonometric constants:
a 1 = sin ( α ) cos ( α ) · tan ( φ b )
a 2 = sin ( α / 2 ) · tan ( φ b ) + cos ( α / 2 ) cos ( α / 2 ) · tan ( φ b ) · tan ( φ r ) + tan ( φ r ) · sin ( α / 2 )
a 3 = cos ( α / 2 ) · tan ( φ b ) sin ( α / 2 )
The normal interaction force between block 1 and 2 becomes
Z 1 = 1 a 2 W 1 · a 1 + c r · A B · a 3
The shear force (S1) acting down the plane is calculated as
S 1 = W 1 · sin ( α ) Z 1 · cos ( α / 2 ) Q 1 · sin ( α / 2 )
For block 2 and block 3, the geometry and external and internal forces are illustrated in Figure 2b,c. The calculation method of block 2 and block 3 is similar. The sums of the horizontal and vertical forces for block 3 are formed as
F x = W 3 · sin ( ε ) T 3 + Z 2 · cos ( ε β / 2 ) + Q 2 · sin ( ε β / 2 ) Z 3 · cos ( ε / 2 ) Q 3 · sin ( ε / 2 ) P w i 3 · cos ( ε / 2 )
F y = W 3 · cos ( ε ) N 3 Z 2 · sin ( ε β / 2 ) + Q 2 · cos ( ε β / 2 ) + Z 3 · sin ( ε / 2 ) Q 3 · cos ( ε / 2 ) + P w i 3 · sin ( ε / 2 ) P w 3
The normal reaction force at the base of block 3 is given by
N 3 = W 3 · cos ( ε ) Z 2 · sin ( ε β / 2 ) + Q 2 · cos ( ε β / 2 ) + Z 3 · sin ( ε / 2 ) Q 3 · cos ( ε / 2 ) + P w i 3 · sin ( ε / 2 ) P w 3
and the shear resistance (T3) and interaction force (Q3) are calculated as
T 3 = c b · L b 3 + N 3 · tan ( φ b )
Q 3 = c r · E F + Z 3 · tan ( φ r )
Equation (A11) combined with Equations (A13)–(A15) becomes
W 3 · c 1 + Z 2 · c 2 Q 2 · c 3 Z 3 · c 4 + c r · E F · c 5 P w i 3 · c 6 P w 3 · tan ( φ b ) = 0
with the trigonometric constants c1, c2, c3, c4 c5, and c6 as follows:
c 1 = sin ( ε ) cos ( ε ) · tan ( φ b )
c 2 = sin ( ε β / 2 ) · tan ( φ b ) + cos ( ε β / 2 )
c 3 = cos ( ε β / 2 ) · tan ( φ b ) sin ( ε β / 2 )
c 4 = sin ( ε / 2 ) · tan ( φ b ) + cos ( ε / 2 ) cos ( ε / 2 ) · tan ( φ b ) · tan ( φ r ) + tan ( φ r ) · sin ( ε / 2 )
c 5 = cos ( ε / 2 ) · tan ( φ b ) sin ( ε / 2 )
c 6 = sin ( ε / 2 ) · tan ( φ b ) + cos ( ε / 2 )
The normal interaction force (Z3) between blocks 2 and 3 becomes
Z 3 = 1 c 4 ( W 3 · c 1 + Z 2 · c 2 Q 2 · c 3 + c r · E F · c 5 P w i 3 · c 6 + P w 3 · tan ( φ b ) )
The shear force (S3) acting down the plane is calculated as
S 3 = W 3 · sin ( ε ) + Z 2 · cos ( ε β / 2 ) + Q 2 · sin ( ε β / 2 ) Z 3 · cos ( ε / 2 ) Q 3 · sin ( ε / 2 ) P w i 3 · cos ( ε / 2 )
The water force acting on the sliding plane is calculated as
P w 3 = γ w · h w 3 2 2 · sin ( ε )
and the water force Pwi3 as
P w i 3 = γ w · h w 3 2 2 · cos ( ε / 2 )
For block 4, the geometry and internal and external forces are shown in Figure 2d.
F x = W 4 · sin ( δ ) T 4 + Z 3 · cos ( δ ε / 2 ) + Q 3 · sin ( δ ε / 2 ) + U l · cos ( δ ε / 2 ) P w i 4 · sin ( ψ 4 δ ) P 4 · sin ( κ 4 δ )
F y = W 4 · cos ( δ ) N 4 + Z 3 · sin ( δ ε / 2 ) + Q 3 · cos ( δ ε / 2 ) + U l · sin ( δ ε / 2 ) + P w i 4 · cos ( ψ 4 δ ) + P 4 · cos ( κ 4 δ ) P w 4
For static equilibrium, Equation (A24) leads to the normal reaction force at the base of block 4.
N 4 = W 4 · cos ( δ ) + Z 3 · sin ( δ ε / 2 ) + Q 3 · cos ( δ ε / 2 ) + U l · sin ( δ ε / 2 ) + P w i 4 · sin ( ψ 4 δ ) + P 4 · sin ( κ 4 δ ) P w 4
which is given by
T 4 = c b · L b 4 + N 4 · tan ( φ b )
and the shear force (S4) acting down the plane is calculated as
S 4 = W 4 · sin ( δ ) + Z 3 · cos ( δ ε / 2 ) + Q 3 · sin ( δ ε / 2 ) + P w i 3 · cos ( δ ε / 2 ) P w i 4 · sin ( ψ 4 δ ) P 4 · sin ( κ 4 δ ) .
The water force acting on the sliding plane ( P w 4 ) is calculated as
P w 4 = γ w · L · ( h w 4 a + h w 4 b )
P w i 4 and P 4 are the water pressure forces acting on the slope at the foot surface and are calculated as
P w i 4 = γ w · ( h w 4 a 2 + h w 4 b ) · h w 4 a sin ( ψ 4 )
P 4 = γ w · h w 4 b 2 2 · sin ( κ 4 )

References

  1. Riemer, W. Landslides and reservoirs. In Proceedings of the 6th International Symposium on Landslides, Christchurch, New Zealand, 10–14 February 1992; pp. 213–224. [Google Scholar]
  2. Moore, D.P. Rock slopes and reservoirs—Lessons learned. In Proceedings of the 13th Annual Vancouver Geotechnical Society Symposium, Slope Stability and Landslides, Vancouver, BC, Canada, 28 May 1999. [Google Scholar]
  3. Kalenchuk, K.S.; Hutchinson, D.J.; Diederichs, M.S. Downie Slide: Numerical simulation of groundwater fluctuations influencing the behaviour of a massive landslide. Bull. Eng. Geol. Environ. 2013, 72, 397–412. [Google Scholar] [CrossRef]
  4. Macfarlane, D.F. Observations and predictions of the behaviour of large, slow-moving landslides in schist, Clyde Dam reservoir, New Zealand. Eng. Geol. 2009, 109, 5–15. [Google Scholar] [CrossRef]
  5. Genevois, R.; Tecca, P.R. The Vajont landslide: State-of-the-art. Ital. J. Eng. Geol. Environ. 2013, 15–39. [Google Scholar] [CrossRef]
  6. Barla, G.; Antolini, F.; Barla, M.; Mensi, E.; Piovano, G. Monitoring of the Beauregard landslide (Aosta Valley, Italy) using advanced and conventional techniques. Eng. Geol. 2010, 116, 218–235. [Google Scholar] [CrossRef]
  7. Lin, P.; Lui, X.; Hu, S.; Li, P. Large deformation analysis of a high steep slope relating to the Laxiwa Reservoir, China. Rock Mech. Rock Eng. 2016, 49, 2253–2276. [Google Scholar] [CrossRef]
  8. Zhang, D.; Wang, G.; Yang, T.; Zhang, M.; Chen, S.; Zhang, F. Satellite remote sensing-based detection of the deformation of a reservoir bank slope in Laxiwa Hydropower Station, China. Landslides 2013, 10, 231–238. [Google Scholar] [CrossRef]
  9. Watson, A.D.; Psutka, J.F.; Stewart, T.W.; Moore, D.P. Investigations and Monitoring of Rock Slopes at Checkerboard Creek and Little Chief Slide. In Proceedings of the 1st Canada-U.S. Rock Mechanics Symposium, Vancouver, BC, Canada, 27–31 May 2007. [Google Scholar]
  10. Zangerl, C.; Strauhal, T. Investigations and monitoring of deep-seated rock slides in feasibility studies for dam reservoirs. AUC Geogr. 2020, 55, 210–217. [Google Scholar] [CrossRef]
  11. Zarfl, C.; Lumsdon, A.E.; Berlekamp, J.; Tydecks, L.; Tockner, K. A global boom in hydropower dam construction. Aquat. Sci. 2015, 77, 161–170. [Google Scholar] [CrossRef]
  12. Alonso, E.E.; Pinyol, N.M. Landslides in reservoirs and dam operations. In Proceedings of the 2nd International Congress on Dam Maintenance and Rehabilitation, Zaragoza, Spain, 23–25 November 2010; CRC Press: Boca Raton, FL, USA, 2011; pp. 3–28. [Google Scholar]
  13. Miller, S.M.; Barla, G.; Piovano, G.; Barla, M. Geotechnical and temporal risk assessment of a large slope deformation. In Proceedings of the 42nd U.S. Rock Mechanics Symposium (USRMS), San Francisco, CA, USA, 29 June–1 July 2008. Paper No. ARMA-08-032. [Google Scholar]
  14. Alonso, E.E.; Pinyol, N.M. Criteria for rapid sliding I. A review of Vaiont case. Eng. Geol. 2010, 114, 198–210. [Google Scholar] [CrossRef]
  15. Macciotta, R.; Martin, C.D.; Morgenstern, N.R.; Cruden, D.M. Development and application of a quantitative risk assessment to a very slow moving rock slope and potential sudden acceleration. Landslides 2016, 13, 765–785. [Google Scholar] [CrossRef]
  16. Eaton, J.W.; Bateman, D.; Hauberg, S.; Wehbring, R. GNU Octave Version 8.4.0 Manual: A High-Level Interactive Language for Numerical Computations. 2023. Available online: https://www.gnu.org/software/octave/doc/v8.4.0/ (accessed on 1 December 2023).
  17. AutoCAD, Version 2016. 2016. Available online: https://www.autodesk.com/ (accessed on 1 May 2016).
  18. Rocscience Slide2, Version 7—2D Limit Equilibrium Slope Stability Analysis; Rocscience Inc.: Toronto, ON, Canada, 2018; Available online: www.rocscience.com (accessed on 15 December 2018).
  19. Abramson, L.W.; Lee, T.S.; Sharma, S.; Boyce, G.M. Slope Stability and Stabilization Methods; John Wiley & Sons: Hoboken, NJ, USA, 2001. [Google Scholar]
  20. Noverraz, F. Sagging or deep-seated creep: Fiction or reality? In Proceedings of the 7th International Symposium on Landslides, Trondheim, Norway, 17–21 June 1996; Balkema: Rotterdam, The Netherlands, 1996; pp. 821–828. [Google Scholar]
  21. Strauhal, T.; Zangerl, C.; Fellin, W.; Holzmann, M.; Engl, D.A.; Brandner, R.; Tessadri, R. Structure, mineralogy and geomechanical properties of shear zones of deep-seated rockslides in metamorphic rocks (Tyrol, Austria). Rock Mech. Rock Eng. 2017, 50, 419–438. [Google Scholar] [CrossRef]
  22. Agliardi, F.; Crosta, G.; Zanchi, A. Structural constraints on deep-seated slope deformation kinematics. Eng. Geol. 2001, 59, 83–102. [Google Scholar] [CrossRef]
  23. Crosta, G.B.; Di Prisco, C.; Frattini, P.; Frigerio, G.; Castellanza, R.; Agliardi, F. Chasing a complete understanding of the triggering mechanisms of a large rapidly evolving rockslide. Landslides 2014, 11, 747–764. [Google Scholar] [CrossRef]
  24. Bonzanigo, L.; Eberhardt, E.; Loew, S. Long-term investigation of a deep-seated creeping landslide in crystalline rock, Part I. Geological and hydromechanical factors controlling the Campo Vallemaggia landslide. Can. Geotech. J. 2007, 44, 1157–1180. [Google Scholar] [CrossRef]
  25. Zangerl, C.; Chwatal, W.; Kirschner, H. Formation processes, geomechanical characterisation and buttressing effects at the toe of deep-seated rock slides in foliated metamorphic rock. Geomorphology 2015, 243, 51–64. [Google Scholar] [CrossRef]
  26. Loew, S.; Strauhal, T. Pore Pressure Distributions in Brittle Translational Rockslides. Ital. J. Eng. Geol. Environ. 2013, 13, 181–191. [Google Scholar]
  27. Strauhal, T.; Loew, S.; Holzmann, M.; Zangerl, C. Detailed hydrogeological analysis of a deep-seated rockslide at the Gepatsch reservoir (Klasgarten, Austria). Hydrogeol. J. 2016, 24, 349–371. [Google Scholar] [CrossRef]
  28. Imrie, A.S.; Moore, D.P.; Enegren, E.G. Performance and maintenance of the drainage system at Downie Slide. In Proceedings of the 6th International Symposium on Landslides, Christchurch, New Zealand, 10–14 February 1992; pp. 751–765. [Google Scholar]
  29. Eberhardt, E.; Bonzanigo, L.; Loew, S. Long-term investigation of a deep-seated creeping landslide in crystalline rock. Part II. Mitigation measures and numerical modelling of deep drainage at Campo Vallemaggia. Can. Geotech. J. 2007, 44, 1181–1199. [Google Scholar] [CrossRef]
  30. Paronuzzi, P.; Rigo, E.; Bolla, A. Influence of filling-drawdown cycles of the Vajont reservoir on Mt. Toc slope stability. Geomorphology 2013, 191, 75–93. [Google Scholar] [CrossRef]
  31. Zangerl, C.; Schneeberger, A.; Steiner, G.; Mergili, M. GIS-based topographic reconstruction and geomechanical modelling of the Köfels Rock Slide. Nat. Hazards Earth Syst. Sci. Discuss. 2020, 1–31. [Google Scholar] [CrossRef]
  32. Nicolussi, K.; Spötl, C.; Thurner, A.; Reimer, P.J. Precise radiocarbon dating of the giant Köfels landslide (Eastern Alps, Austria). Geomorphology 2015, 243, 87–91. [Google Scholar] [CrossRef]
  33. Donati, D.; Westin, A.M.; Stead, D.; Clague, J.J.; Stewart, T.W.; Lawrence, M.S.; Marsh, J. A reinterpretation of the Downie Slide (British Columbia, Canada) based on slope damage characterization and subsurface data interpretation. Landslides 2021, 18, 1561–1583. [Google Scholar] [CrossRef]
  34. Barla, G. Long term behaviour of the Beauregard dam (Italy) and its interaction with a deep-seated gravitational slope deformation. In Mitteilungen für Ingenieurgeologie und Geomechanik, Proceedings of the 5th Colloquium of Rock Mechanics—Theory and Practice, Vienna, Austria, 26–27 November 2009; TU Wien: Vienna, Austria, 2010; Volume 9, pp. 111–125. [Google Scholar]
  35. Hendron, A.J.; Patton, F.D. The Vaiont Slide. A Geotechnical Analysis Based on New Geologic Observations of the Failure Surface, Volume 1: Main Text; US Army Corps of Engineers: Washington, DC, USA, 1985. [Google Scholar]
  36. Dykes, A.P.; Bromhead, E.N. New, simplified and improved interpretation of the Vaiont landslide mechanics. Landslides 2018, 15, 2001–2015. [Google Scholar] [CrossRef]
  37. Mansour, M.F.; Martin, C.D.; Morgenstern, N.R. Movement behaviour of the little chief slide. Can. Geotech. J. 2011, 48, 655–670. [Google Scholar] [CrossRef]
  38. Hungr, O.; Leroueil, S.; Picarelli, L. The Varnes classification of landslide types, an update. Landslides 2014, 11, 167–194. [Google Scholar] [CrossRef]
  39. ICOLD. Reservoir Landslides-Guidelines for Investigation and Management; Paris Bulletin 124; International Commission on Large Dams: Paris, France, 2002. [Google Scholar]
Figure 1. Geometrical profile of the four-block model with a reservoir at the foot of the slope, labeling the four blocks, the main corner points O to H, and the contact plane between the blocks (dashed line).
Applsci 14 04631 g001
Figure 2. Geometry and internal and external forces acting on block 1 (a), block 2 (b), block 3 (c), and block 4 (d).
Applsci 14 04631 g002
Figure 3. Factor of safety calculations of the four-block model with a comparison of different limit-equilibrium calculation methods. FoS is plotted versus the ratio of the submerged height h to the total height h 0 of the rock slide model, i.e., from no reservoir up to total impounding of the slide.
Applsci 14 04631 g003
Figure 4. Two-dimensional geometrical rock slide models: (a) Laxiwa slide, (b) Niedergallmigg slide, (c) Köfels slide, (d) Downie slide, (e) Beauregard slide, (f) Vajont Slide, (g) Little Chief slide, (h) planar slide (generic), and (i) compound slide (generic).
Applsci 14 04631 g004
Figure 5. Factor of safety versus the ratio of the impounded height (h) to the total height (h0) of the rock slides.
Applsci 14 04631 g005
Figure 6. Factor of safety versus the ratio of the impounded height (h) to the total height (h0) of the rock slides up to a ratio of 0.25.
Applsci 14 04631 g006
Table 1. Cartesian coordinates of the main corner points of the rock slide (see Figure 1 and Figure 2).
PointHorizontal Coordinate [m]Vertical Coordinate [m]
O0.01161.0
A909.4464.8
B987.5688.0
C1348.1215.0
D1417.8478.1
E1889.939.1
F1928.5282.8
G2163.70.0
H2146.5121.0
Table 2. Geometrical parameters of the rock slide profile (see Figure 1).
Block No.Block Area
[m2]
Shear Zone Dip [°]Shear Zone Length [m]Contact
Plane [m]
Block 1128,676α = 37.4OA = 1145.3AB = 236.5
Block 2122,635β = 29.7AC = 504.8CD = 272.2
Block 3143,402ε = 18.0CE = 569.6EF = 246.7
Block 445,915δ = 8.1EF = 276.6-
Table 3. Maximum vertical heights, back-calculated friction angles of the shear zones, and reduction i.e., change in the FoS at 10% and 20%, respectively, of total reservoir impounding.
Rock SlideVertical Height (h0)
[m]
Friction Angle
for FoS = 1 [°]
ΔFoS by 10%
Impounding
ΔFoS by 20% Impounding
Laxiwa Slide684.732.50.0070.025
Niedergallmigg Slide1161.024.30.0230.050
Köfels Slide1565.224.40.0120.041
Downie Slide891.016.60.0400.066
Beauregard Slide463.421.40.0380.071
Vajont Slide553.016.10.0410.081
Little Chief Slide1239.218.40.0560.106
Planar Slide1421.032.50.0250.037
Compound Slide1421.019.40.0580.092
Disclaimer/Publisher’s Note: The statements, opinions and data contained in all publications are solely those of the individual author(s) and contributor(s) and not of MDPI and/or the editor(s). MDPI and/or the editor(s) disclaim responsibility for any injury to people or property resulting from any ideas, methods, instructions or products referred to in the content.

