Abstract
In this study, a regression model of paddy soil properties using diffuse reflectance spectroscopy was developed to replace chemical soil analysis as a more efficient alternative. Soil samples were collected and analyzed from saltwater paddy fields located in Jeongnam-myeon, Hwaseong-si, Gyeonggi-do in the Republic of Korea, and the spectral data of wet and dry soil were collected. The regression models were compared and analyzed using partial least squares regression (PLSR) with Savitzky–Golay smoothing (SG smoothing) and Standard Normal Variate (SNV) preprocessing to predict the soil properties. Analysis showed that the predictive regression model of wet soil with SG smoothing and an SNV did not meet the evaluation criteria of a fair model. However, the regression model of dry soil with SG smoothing was fair for clay, pH, EC, and TN at RPD = 1.90, 1.87, 1.60, and 1.43 and R2 = 0.79, 0.81, 0.64, and 0.64, respectively, while the regression model of dry soil with an SNV was good for clay, pH, EC, and TN at RPD = 2.21, 1.96, 1.70, and 1.44 and R2 = 0.84, 0.81, 0.76, 0.69, respectively. When developing predictive regression models of soil properties, the accuracy for dry soil was higher than that for wet soil, and when applying a single round of preprocessing, the regression model with SNV preprocessing was more accurate than that with SG smoothing.
1. Introduction
In agriculture, soil is directly involved in the growth of crops, providing nutrients and moisture and a stable base for roots. Therefore, continuous soil management is essential for the production of high-quality agricultural products, including improved crop productivity. Soil property analysis is also important [1,2,3,4]. Soil property analysis is typically performed in a laboratory after the soil samples have been collected and utilizes a variety of chemical methods [5]. Although these methods are highly accurate in measuring soil properties, they are not efficient, as they consume large amounts of time, money, and labor. Therefore, for rapid soil property identification and testing, a technology that can quickly measure in the field is needed [6].
Diffuse reflectance spectroscopy (DRS) analyzes based on the interaction between incident light and the soil surface, mainly in the visible, near-infrared, and mid-infrared (VIS, NIR, and MIR) spectra at 400−700, 700−2500, and 2500−25,000 nm, respectively, with the VIS-NIR spectral region being suitable for measuring and predicting soil properties [7,8,9]. Using DRS, the reflected light depends on the physical and chemical properties of the soil, allowing for the simultaneous measurement of different soil properties [10]. In addition, Lee et al. (2009) [9] developed an effective estimation model of soil properties within the NIR wavelength range rather than the VIS-NIR wavelength range. The duration and cost of soil property analysis can be reduced by developing a soil property prediction model, and in the future, real-time field measurements could be made using this model. According to Rebecca et al. (2021) [11], soil properties can be predicted at a single level or multiple levels. However, studies using a single level are rare, and often, combined preprocessing techniques are conducted at multiple levels.
According to Veum et al. (2018) [12], the soil property predictive model depends on various factors, such as spectral preprocessing, calibration modeling, and data set size. Various analysis methods, such as machine learning (ML) algorithms, artificial neural networks (ANNs), support vector machines (SVMs), Cubist models, random forest (RF), and memory-based learning (MBL), could be used for the soil property predictive model. ML could be applied to complex nonlinear relationships between the predicted and response variables. An SVM as a kernel-based algorithm is transformed to maximize the distance of the nearest data points in the input classes into a high-dimensional space. The ANN algorithm learns through optimization until the differences between the observed and predicted values are minimized. The Cubist model is based on a classification and regression tree approach, where prediction is based on intermediate linear models formed at each tree node [13].
Xiaoshuai et al. (2019) [14] developed a soil property prediction model utilizing four analysis models, such as partial least squares regression (PLSR), neural network (NN), decision tree learning, and RF. Overall, they reported that the PLSR method could accurately estimate various physical and chemical soil properties. Haijun et al. (2017) [15] used PLSR and linear multitask learning (LMTL) analysis models to develop a prediction model of soil properties, such as nitrogen (N), phosphorus (P), potassium (K), pH, electrical conductivity (EC), organic matter (OM), and water content (WC). The PLSR model showed better results than the LTML model for most soil properties except P, pH, and WC. The PLSR analysis technique has shown good results in predicting various soil properties, but it is known that various factors, such as soil moisture content and soil properties, affect the model’s accuracy [7,8]. Factors such as soil moisture content and satellites, which affect the correlation between spectral reflectance and soil properties, can be improved using various forms of preprocessing [16]. Among the preprocessing techniques, Gholizadeh et al. (2014) [17] used SG smoothing to predict paddy soil properties, and the goodness of fit of the calibration model for VIS and NIR showed a coefficient of determination R2 > 0.78 for all the physical properties of soil.
The analysis utilizing DRS could substitute conventional methods of soil properties analysis which consume time and cost and proceed with rapid and accurate soil properties. Conforti et al. (2017) [18] predicted soil properties of total nitrogen (TN), pH, and soil texture using PLSR analysis and demonstrated the soil property prediction model using DRS. Miloš et al. (2022) [19] analyzed soil properties using various preprocessing methods and optimized the prediction model according to each preprocessing selection.
The purpose of this study is to analyze the soil properties of saltwater paddies in real time in Korean fields and develop soil property prediction regression models for wet soil and dry soil by applying Savitzky–Golay smoothing (SG smoothing) and Standard Normal Variate (SNV) preprocessing methods.
We collected 120 samples of saltwater hazelnut soil in Korea and analyzed the soil properties. The specific objectives were as follows:
- Collect spectral data of soil in a wet state (wet soil) and soil in a dry state (dry soil) and develop a predictive regression model using PLSR analysis;
- Perform comparative analysis between the soil property prediction regression models using the preprocessing techniques of SG smoothing and SNV.
2. Materials and Methods
2.1. Soil Property Analysis and Spectral Measurements
The soil samples were collected from 21 to 22 April 2023 from saltwater paddy fields in Jeongnam-myeon, Hwaseong-si, Gyeonggi-do in the Republic of Korea (Figure 1). The humidity and ambient air temperature were 36% and 16.7 °C, respectively, and the soil textures were silty clay loam and silty loam. A total of 120 soil samples were collected at a depth of 15 cm using a soil sampler (Edelman Auger, Eijkelkamp, The Netherlands) (Figure 2a), after removing 3 cm from the topsoil to discard debris. Five soil samples were collected with mixed soil properties to minimize the error in soil sample composition. Except for some soil samples for spectroscopic analysis, the remaining soil sample properties were analyzed at the Soil Verification Center of the Korea Agriculture Technology Promotion Agency. The soil properties pH, EC, soil organic matter (SOM), TN, total organic carbon (TOC), and clay were analyzed according to the soil chemical analysis manual of the Korea Agriculture Technology Promotion Agency [20].
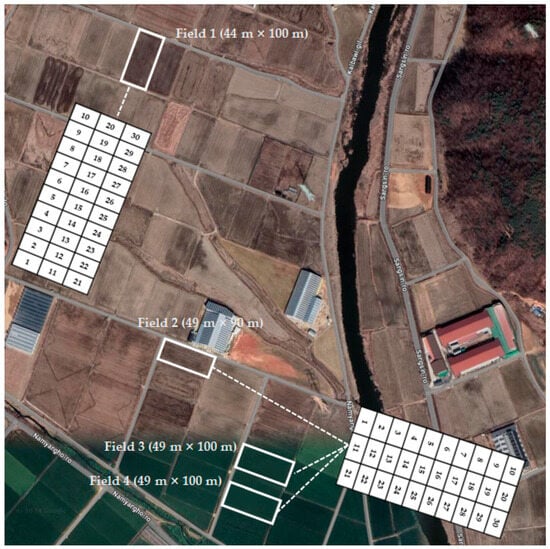
Figure 1.
Location of soil sampling point in Hwaseong-si, Gyeonggi-do, Republic of Korea. All fields were divided into 30 sections. Each number was a soil sampling number.

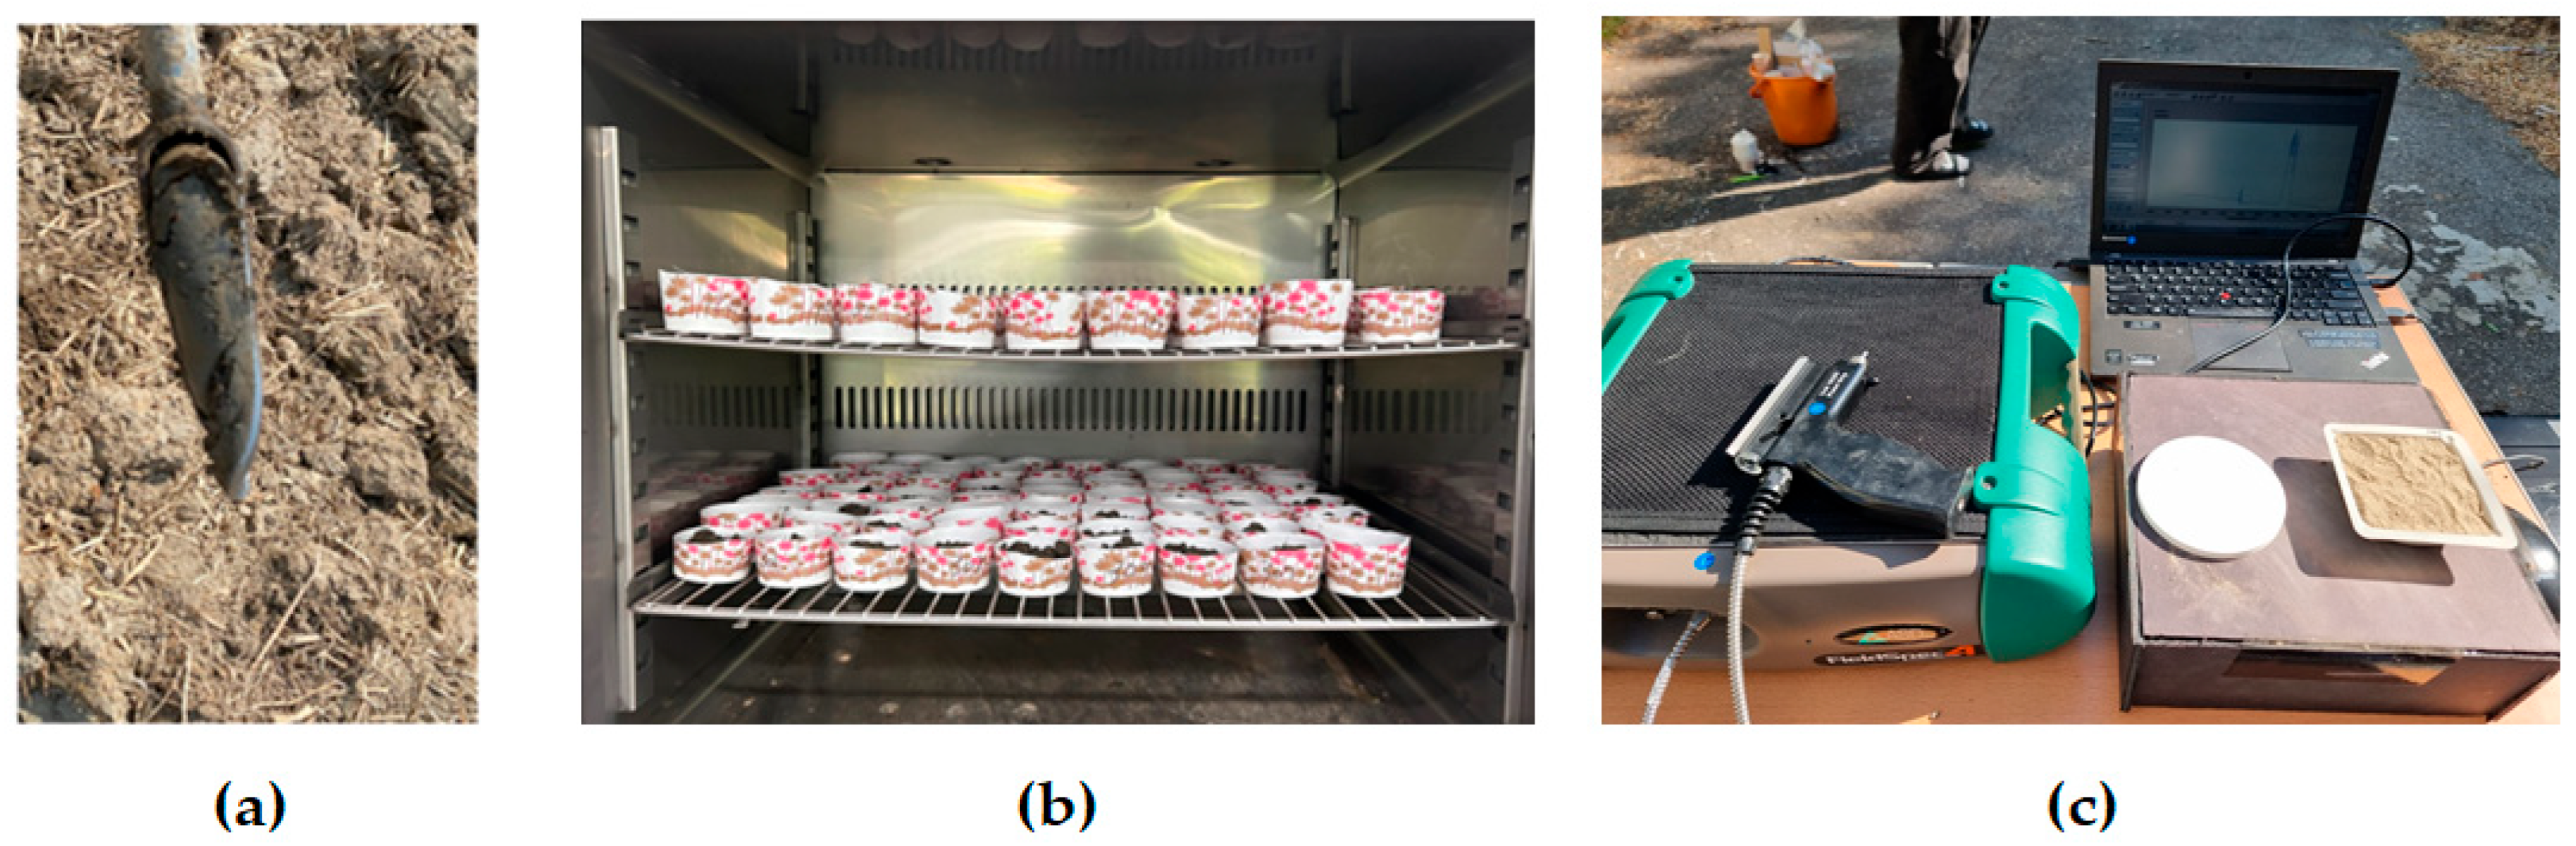
Figure 2.
Process for measuring the soil spectra: (a) sampling the soil by using a soil auger, (b) drying the soil samples, and (c) collecting the soil spectrum using an ASD-Field spec PRO4.
Table 1 represents the mean and standard error of the soil samples analyzed, which are as follows: pH = 7.48 ± 0.37; EC = 7.48 ± 0.37 dS/m; SOM = 32.09 ± 5.36 g/kg; TN = 0.13 ± 0.02 g/kg; TOC = 1.86 ± 0.31 g/kg; and clay = 30.66 ± 0.03%. Most of the soil properties showed less than 15% difference from the mean.

Table 1.
Mean and standard deviation (SD) of soil properties collected from fields.
Cho et al. (2018) [21] compared the estimation models of the moist and dry soil. Most of the models of dry soil provided better estimates of TOC and TN than those of moist soil. Within the VIS-NIR spectrum [17,22,23,24], the estimated soil moisture content was affected. Spectra were collected for each soil sample before drying (wet soil) and after drying (dry soil). The dry soil samples were dried in an oven desiccator at 103 °C for 24 h in accordance with ASAE Standard S358 2 (DEC93) [25], as shown in Figure 2b, and were sieved to 2 mm. Spectra for the pre-dried and post-dried soils were collected utilizing ASD Field Spec PRO4 spectrometry (ASD Inc., Boulder, CO, USA), as shown in Figure 2c. The spectra were collected on 8–9 May 2023, during the peak solar period from 1100 to 1500 h, when the ambient air temperature was 19.5 °C and the average solar radiation was 944.0 W/m2. A white, 100% reflective, standardized Spectralon® (Labsphere, North Sutton, NH, USA, 2013) reflector was used, which was calibrated and optimized to minimize the scattering and noise caused by sunlight. The spectra were collected at 1 nm intervals, and reflectance was measured in the 350–2500 nm range. Each spectrum was measured using 10 replicates per soil sample point to reduce error and then averaged [26].
2.2. Soil Spectrum Preprocessing
Rinnan et al. (2009) [27] reported that preprocessing can be utilized to remove physical phenomena from spectra to improve multivariate regression, classification models, etc. Different preprocessing methods have a significant impact on the outcome of data analysis and collecting spectra without preprocessing results in less accurate data due to the ambient environment in the field [26,28]. Gholizadeh et al. (2015) [29] reported that preprocessing is effective at removing noise from spectra and enhancing their characteristics and accuracy. Conforti et al. (2017) [18] applied SG and SNV preprocessing to predict soil properties such as soil organic carbon (SOC), TN, pH, and soil texture (sand, silt, and clay). As a result, the following R2 values were obtained for each property: 0.92, 0.85, 0.73, 0.84, 0.74, and 0.83, respectively.
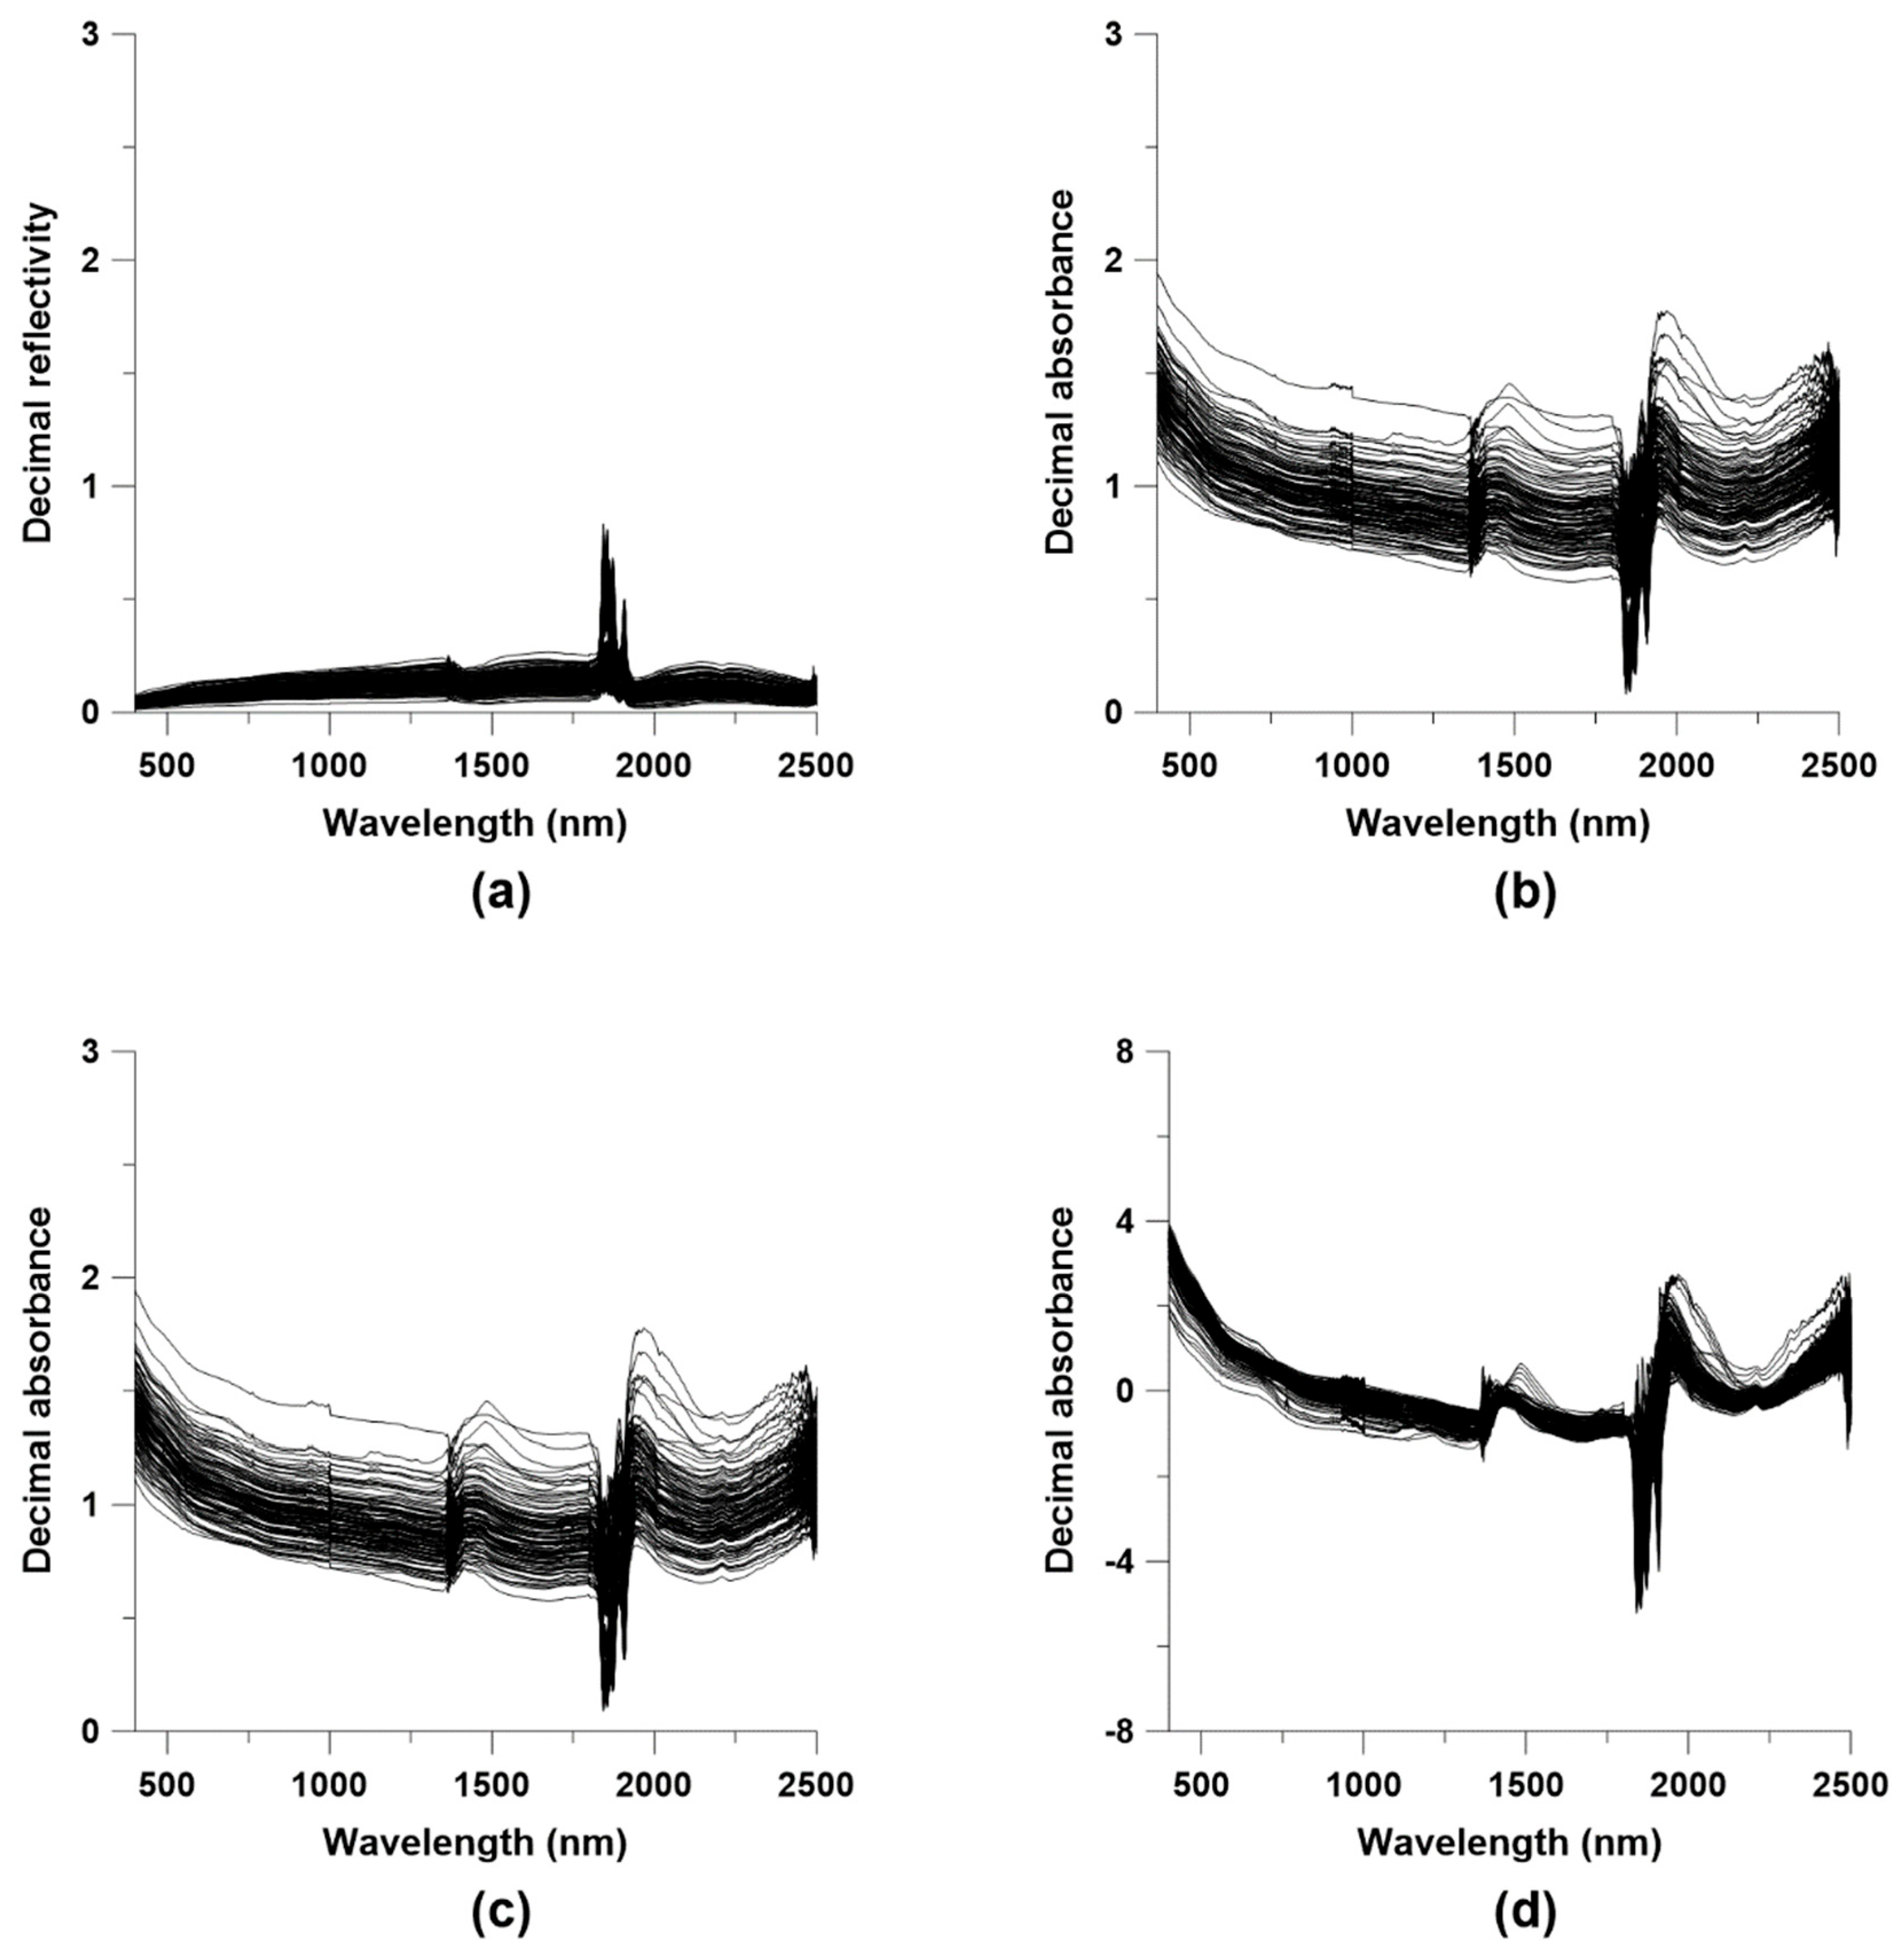
In this study, Savitzky–Golay smoothing (SG smoothing) and Standard Normal Variate (SNV) preprocessing were applied to develop the optimal soil property prediction regression model, and the preprocessing of the spectra was performed with Unscrambler (ver. 10.4, CAMO, Inc., Oslo, Norway). Spectral data in the 350–400 nm range were removed due to the low signal-to-noise ratio. The reflectance of the spectra for the pre-dried and post-dried soil samples collected in the fields was converted into absorbance (), and the spectra were analyzed by applying SNV and SG smoothing, as shown in Figure 3.

Figure 3.
Examples of preprocessing of wet soil spectrum: (a) original spectrum, (b) absorbance conversion, (c) absorbance using Savitzky–Golay smoothing, and (d) absorbance using the Standard Normal Variate.
Savitzky–Golay smoothing uses polynomial regression to correct the wavelength between two points, and this process is repeated to correct the entire spectrum Formula (1).
where represents the original spectrum data, denotes the filtering coefficient, and reflects the number of points in the moving window ().
This technique is used to smooth the spectrum by removing high-frequency noise, while allowing low-frequency signals to pass through, and because it benefits from a broader range of data compared to other preprocessing techniques, it is often used in spectroscopic analysis [30,31,32]. In this study, the second derivative with nine smoothing points was applied in the preprocessing of SG smoothing.
Standard Normal Variate preprocessing was reported by Barnes et al. (1989) [33]. This is a widely used preprocessing technique to reduce the multiplicative effects of scattering and grain size and to reduce the overall intensity differences in the signals; each spectrum is centered and then rescaled by dividing by its standard deviation Formula (2).
where represents the j spectrum of the i sample, denotes the average of spectrum , and reflects the number of samples.
2.3. Analysis and Validation Methods
Partial least squares regression (PLSR) was reported by Wold et al. (1985) [34] and has become a widely used modeling technique in soil physical and chemical composition prediction and highly collinear spectral analysis [35,36]. PLSR specifies the linear relationship between the independent (X) and dependent variables (Y) by extracting several linear combinations (T). The original spectrum matrix (X) could be computed as eigenvectors. After estimating the model parameters, the final predictive model is presented Formulas (3)–(5). PLSR analysis specifies the linear relationship between X and Y by reducing the data from the covariance matrix X to generate new components composed of linear combinations of the original covariates. Throughout this process, the aim is to capture the variability in predictor variables and maximize the covariance between all the linear combinations of the covariance matrix X and the response variable Y. PLSR allows for modeling multiple response variables by effectively handling the strongly correlated variables and noisy independent variables.
where represents the weights.
where represents the relationship between variables and , while denotes the residuals, indicating the noise and unrelated variability between and .
where represents the intercept, and represents the regression vector.
Unscrambler (ver. 10.4, CAMO, Inc., Oslo, Norway) was used to develop predictive regression models of the soil properties and spectra using PLSR. The collected spectra were divided into two spectral bands—(1) VIS at 400–700 nm, and (2) NIR at 700–2500 nm—and the chemical composition of the collected soil samples was analyzed using PLSR. A total of 120 samples were randomly selected and divided into data sets for regression and validation using the PLSR regression model at a ratio of 8:2. To increase the predictive capability and decrease the potential for overfitting, a cross-validation procedure was used to select the number of PLS factors to use for regression. To evaluate the performance of the soil property prediction regression model, we utilized the coefficient of determination (R2), root-mean-square error of prediction (RMSE), and relative reproducibility deviation (RPD), which is the ratio of the standard deviation to the RMSE [37]. Of these values, R2 is a measure of the goodness of fit of a regression equation, indicating how well the regression line estimated using the sample data fits the actual measured data; the RMSE represents the ratio between the means of the measured data, indicating the relative estimation error; and RPD denotes the ratio of the standard deviation of the entire data set to the RMSE [38]. RPD is calculated as the standard deviation of the measured value, divided by the RMSE of the validation data Formulas (6)–(8).
where represents the measured value, denotes the predicted value, reflects the average of the measured values, and n represents the number of measurements and predictions, where = 1 to .
where represents the standard deviation of the measured values.
where represents the root-mean-square error of the verification data.
Cho et al. (2017) [39] proposed the RPD as an alternative to the RMSE when comparing the results from highly variable data. Regression models based on higher values of RPD and lower values of RMSE are more stable [31]. Chang et al. (2001) [40] divided RPD into three categories and showed that for soil property prediction regression models, RPD ≥ 2.0 represents a good model, 1.4 < RPD < 2.0 denotes a fair model, while RPD ≤ 1.4 reflects a poor model. In this estimated model, input data were served by soil reflectance, and output data consisted of soil properties of pH, EC, SOM, TN, TOC, and clay content. The best-estimated model of soil properties was selected by the lowest RMSE and highest R2, as in Chang et al. (2001) [40].
3. Results and Discussion
3.1. PLSR by Preprocessing Using Savitzky–Golay Smoothing
Table 2 shows the results of PLSR analysis with SG smoothing applied to the dry and wet soil samples for the VIS and NIR spectral regions. In PLSR analysis, the number of factors affects the results, so the regression model of wet soil was developed with two factor counts: the number of appropriate factors and the same number of factors in the dry soil regression model. The evaluation of the regression model was performed based on the RPD value using the method created by Cho et al. (2017) [39].
Table 2.
PLSR analysis results using Savitzky–Golay smoothing.
The results of PLSR analysis with preprocessing SG smoothing for dry clay showed RPD values of pH, EC, SOM, TN, TOC, and clay of 1.43–1.87, 1.30–1.60, 1.17–1.38, 1.26–1.43, 1.16–1.39, and 1.67–1.90, respectively, and all the properties except clay were evaluated as the best in the VIS spectral region. In addition, pH, EC, TN, and clay met the evaluation criteria for a fair model.
The PLSR analysis of wet soil showed RPD values of pH, EC, SOM, TN, TOC, and clay of 1.09–1.16, 1.09–1.11, 1.05–1.06, 1.09–1.18, 1.01–1.03, and 1.12–1.15, respectively, which, with the exception of the SOM and clay, were the best values in the NIR region. With the right number of factors, the RPD values of pH, EC, SOM, TN, TOC, and clay were 1.13–1.26, 1.10–1.11, 1.06–1.07, 1.07–1.18, 1.03–1.07, and 1.15–1.23, respectively, while the predictive regression model for all the properties had the highest statistical value in the NIR region. However, both the regression models with the same number of factors as clay and the right number of factors were rated as poor models. The model with an appropriate number of factors showed increasing R2 and RPD values for the soil properties, which were compared to those of the model with the same number of factors as dry soil, for which the RPD values increased by at least 1% and up to 9%. However, in the case of TN, the RPD values decreased. Dry soils had a minimum of about 7% and a maximum of about 72% increase in the RPD values, which were compared to those of the wet soils.
3.2. PLSR by Preprocessing Using the Standard Normal Variate
Table 3 shows the results of PLSR analysis with SNVs applied to the dry and wet soil samples within the VIS and NIR spectral regions. To develop the regression model for wet soil, analysis was performed with two factor counts: the same number of factors fitted with SG smoothing and the same number of factors in the dry soil regression model.
Table 3.
PLSR analysis results using the Standard Normal Variate.
The results of PLSR analysis using preprocessing SNVs for dry clay showed RPD values for pH, EC, SOM, TN, TOC, and clay of 1.40–1.96, 1.31–1.70, 1.16–1.31, 1.20–1.44, 1.16–1.32, and 1.72–2.21, respectively, and all the properties were evaluated as the best in the VIS spectral region. In addition, clay met the evaluation criteria of a good model, while the pH, EC, and TN met the evaluation criteria of a fair model.
The PLSR analysis of wet soil showed the following RPD values for pH, EC, SOM, TN, TOC, and clay of 1.11–1.17, 1.02–1.13, 1.03–1.05, 1.11–1.14, 1.00–1.10, and 1.19, respectively. The results of RPD for pH, EC, SOM, TN, TOC, and clay were 1.13–1.19, 1.10–1.13, 1.04–1.08, 1.13–1.14, 1.01–1.10, and 1.21–1.24, respectively, when the model was set to the appropriate number of factors. The regression model analysis of wet soils showed the highest statistical values in the NIR region for all the soil properties except EC and TN, but both the regression model with the same number of factors as dry soils and the regression model with an appropriate number of factors were rated as poor models. The model with the right number of factors showed increasing R2 and RPD values for the soil properties, which were comparable to those of the model with the same number of factors as the dry soil model, with RPD values increasing by a minimum of 1% and a maximum of 8%. In addition, the RPD values for dry soil increased by a minimum of about 5% and a maximum of about 86%, which were comparable to those of the wet soil.
3.3. Comparison of Regression Models Predicting Soil Properties Using Preprocessing
The analysis of dry and wet soils showed that the regression model of soil property predictions with the SNV was statistically better than the regression model with SG smoothing, and the SNV was more favorable for PLSR analysis with a single round of preprocessing (Table 2 and Table 3).
The PSLR analysis of the model of dry soil with SG smoothing showed that pH and clay met the evaluation criteria of a fair model with RPD values of 1.43–1.87 and 1.67–1.90 in the VIS and NIR spectral regions, respectively, while EC and TN showed a fair model with RPD values of 1.60 and 1.43 in the VIS spectral region, respectively. The regression model of dry soil showed a minimum of 7% and a maximum of 72% increase in the RPD values, which were comparable to those of the wet soil.
The PSLR analysis of the model of clay with SNVs resulted in an RPD of 1.72–2.21 for clay, which met the evaluation criteria of a good model in the VIS spectral region and a fair model in the NIR spectral region. The pH RPD of 1.40–1.96 met the criteria for a fair model in both the VIS and NIR spectral regions, and the TN RPD of 1.44 met the criteria for a fair model in the VIS spectral region, but all the other soil property regression models were poor. The regression model of dry soil showed a statistical increase in the RPD values from a minimum of about 5% to a maximum of about 86%, which were comparable to those of the wet soil.
Overall, the PLSR analysis results of the wet soils showed low statistical values. The moisture content of soil is an important factor that has different effects on the spectra and reduces the prediction accuracy [35,36,37]. Therefore, the soil samples collected from the four fields had different soil moisture distributions, which may explain the lower PSLR analysis results for wet soils compared to those of the dry soils. When developing a regression model for predicting the properties of wet soils, the model with an appropriate number of factors showed increasing R2 and RPD values, which were comparable to the dry soil model with the same number of factors. However, for the model that underwent SG smoothing, the RPD values decreased in the NIR spectral region of TN; this trend is believed to be caused by the predictive value of the model being larger than the variability in the measured data.
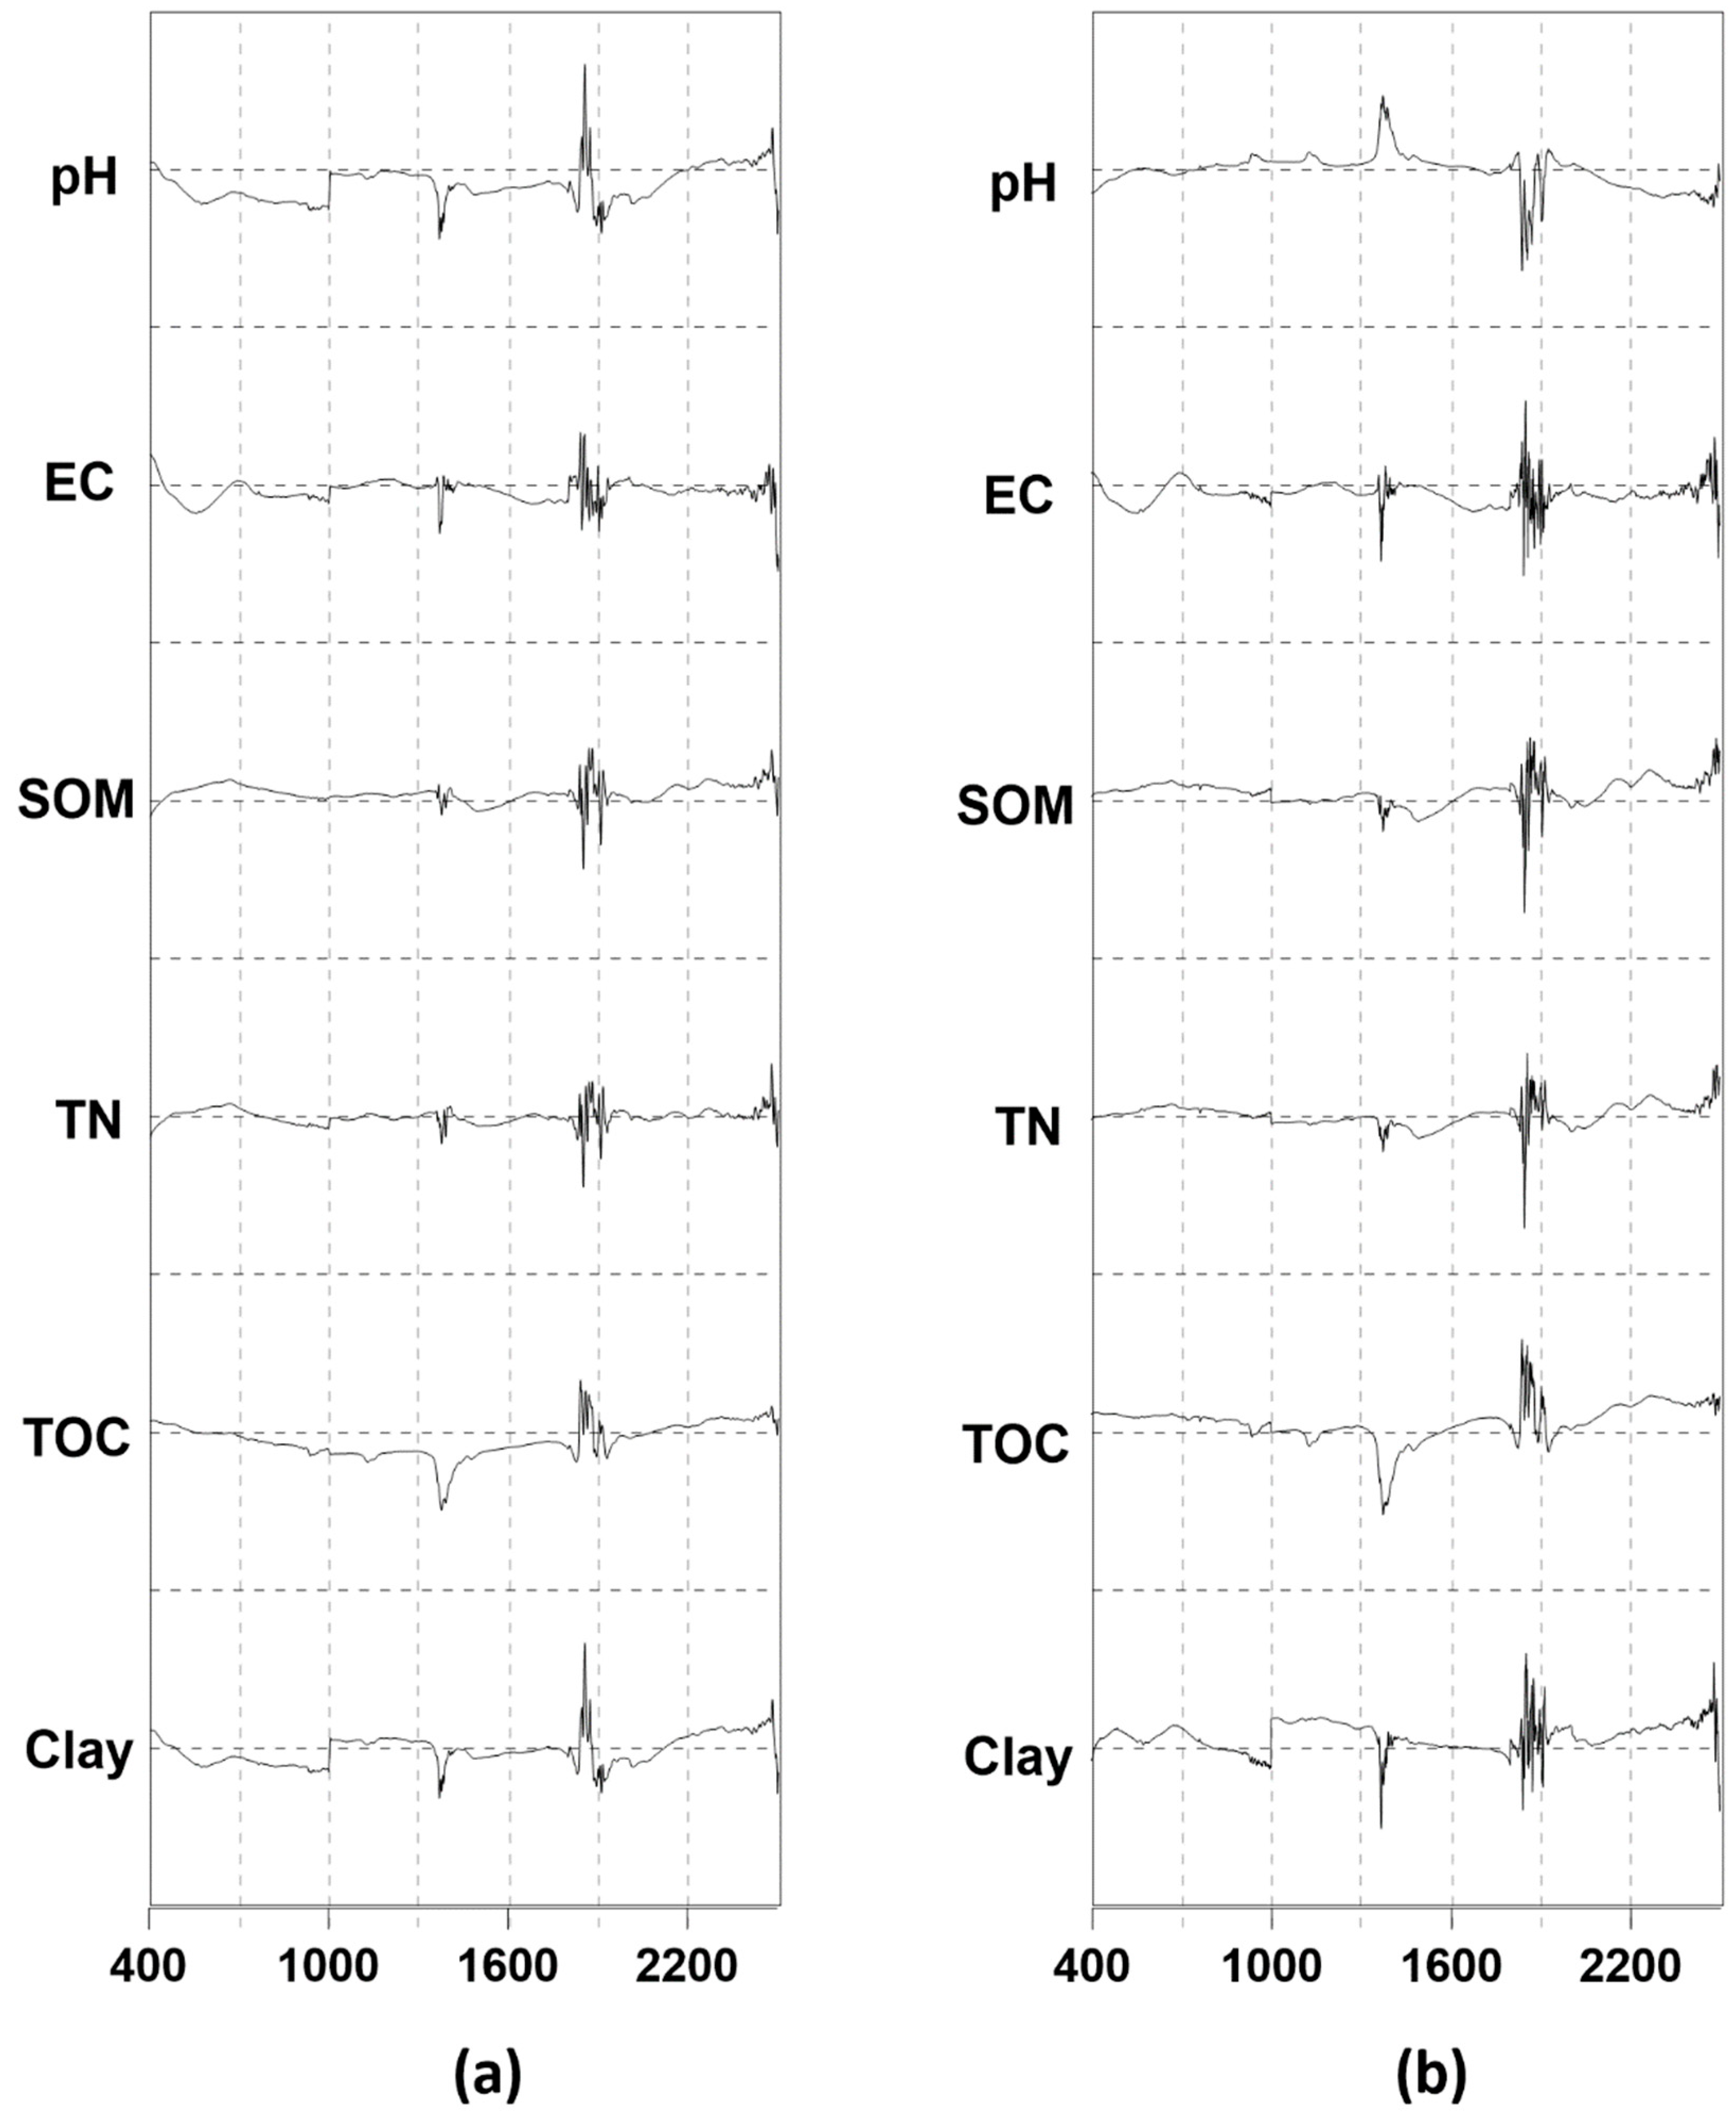
PLSR analysis generates a regression coefficient, the B–matrix coefficient (beta coefficient), which can be used to identify which wavelengths in the spectrum are most influential in the regression model. The B–matrix represents the strength of the latent variables that can directly or indirectly influence the dependent variable. Figure 4 shows the wavelengths of the B–matrix after applying SG smoothing and SNV preprocessing on clay soil. Overall, the B–matrix wavelengths of the dry clay showed similar trends in the bands with ranges of 1350–1450 nm and 1800–1950 nm, but only the pH and TOC properties with an SNV increased in the 1350–1450 nm region. In the 1800–1950 nm region, the wavelengths of all the soil properties with SG smoothing and SNV preprocessing showed similar trends, while the other soil properties decreased.

Figure 4.
PLS B–matrix wavelengths of dry soil using (a) SG smoothing and (b) SNV preprocessing.
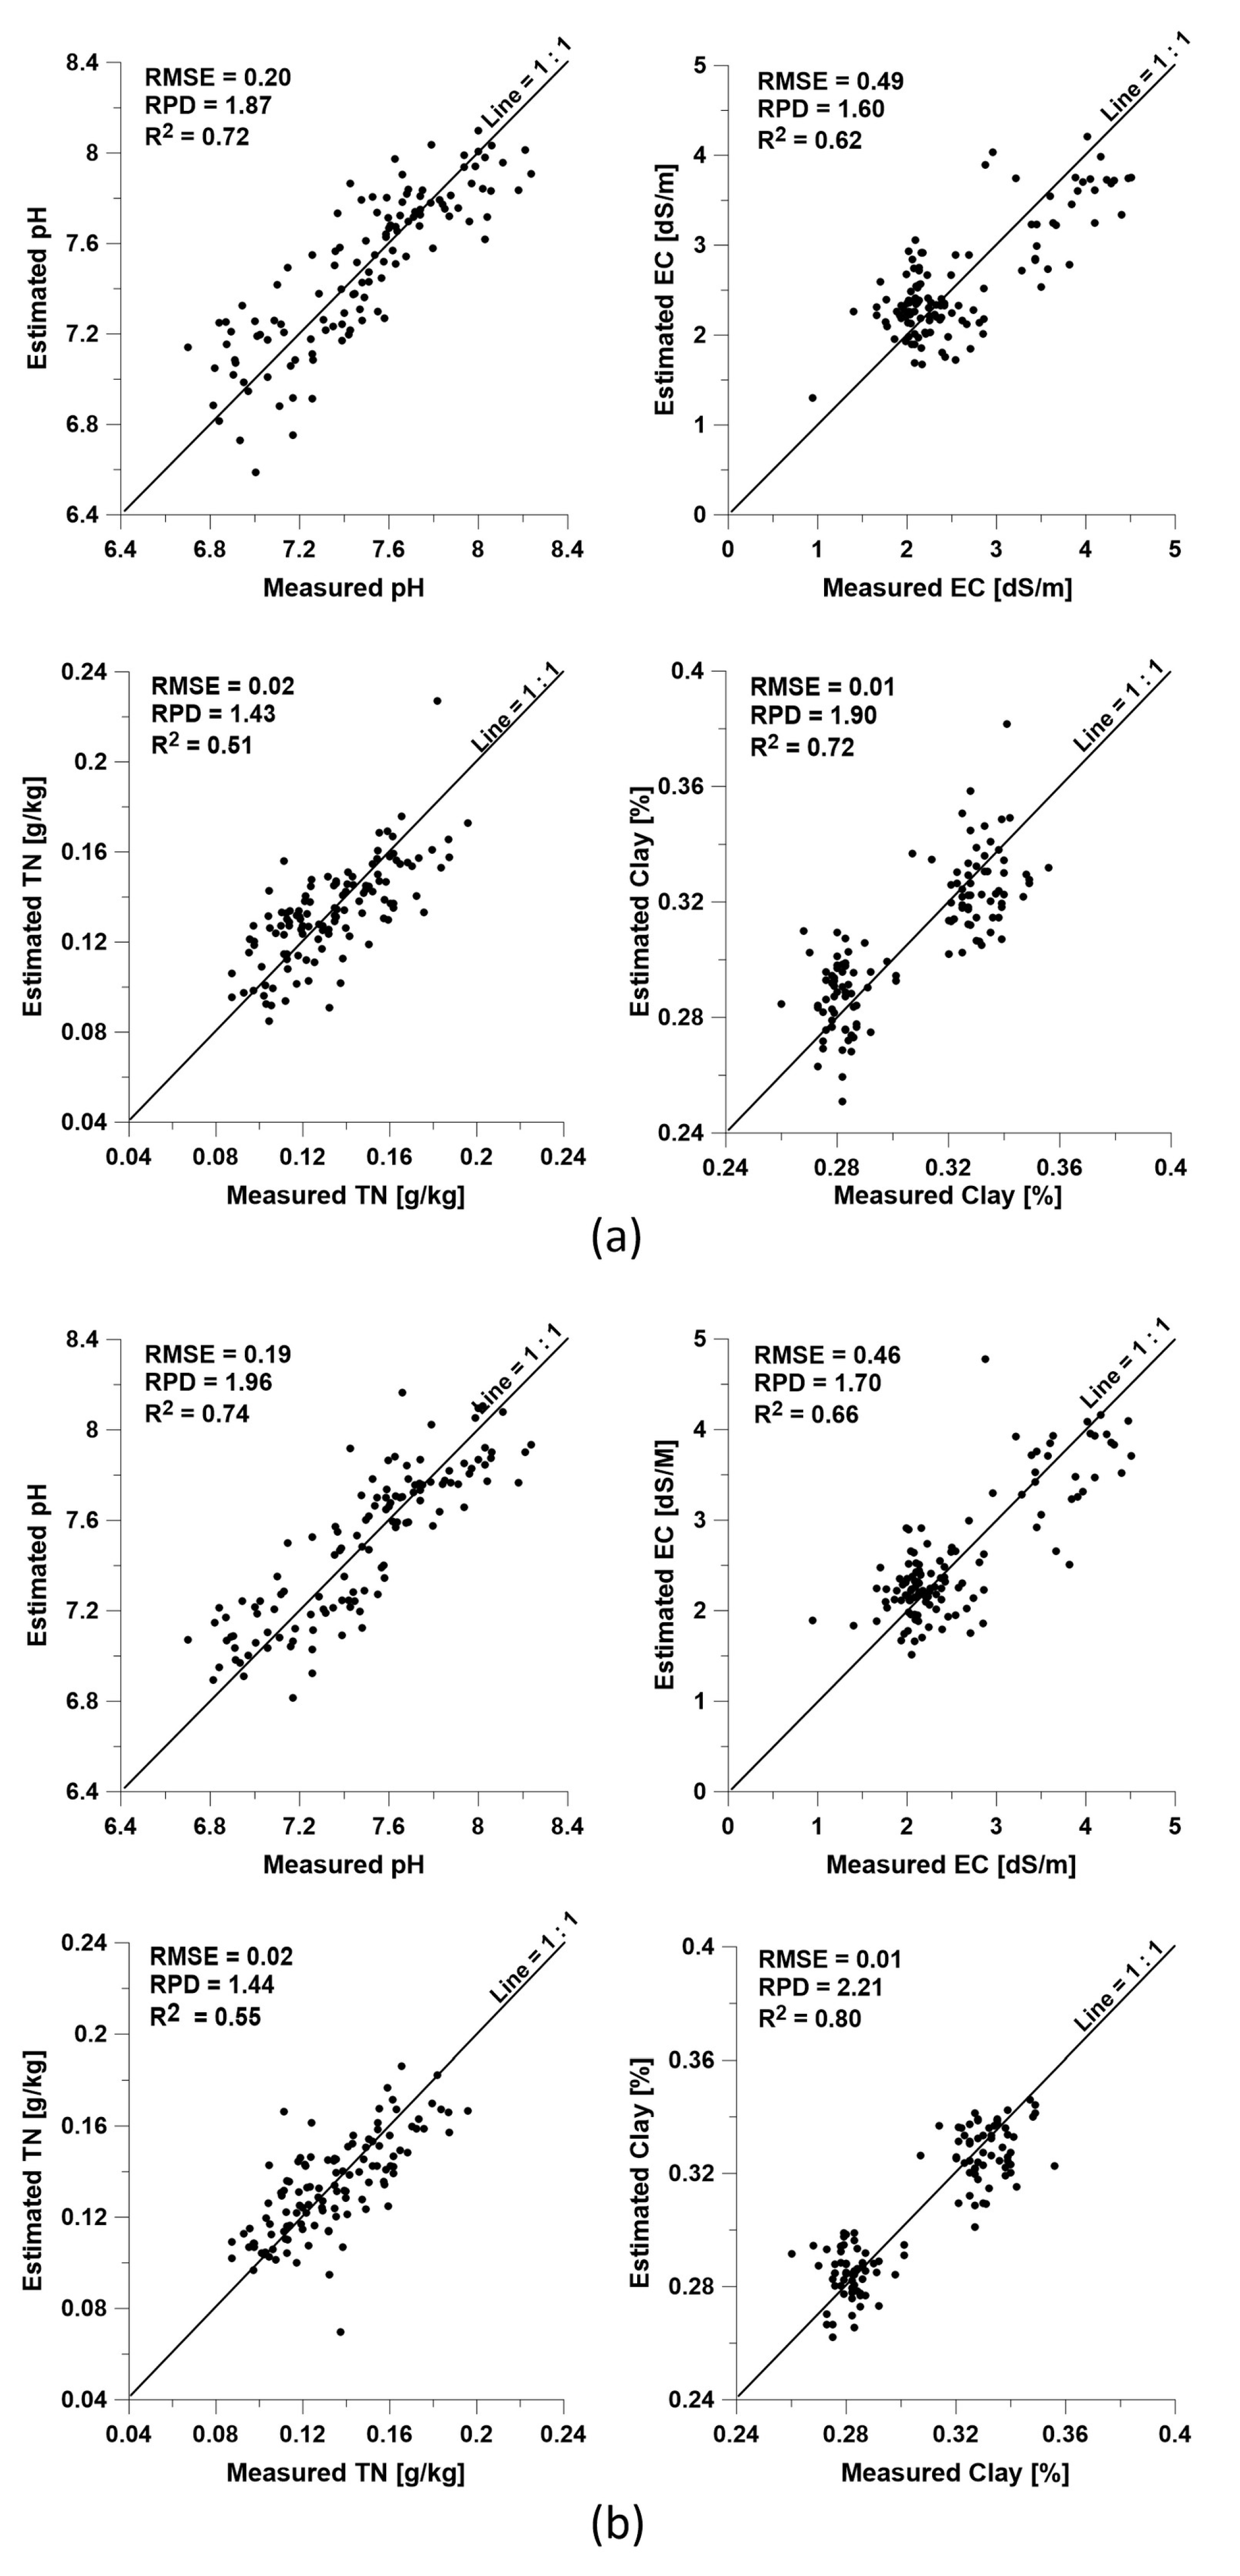
Figure 5 shows dotted line plots for the top four property regression models with SG smoothing and SNV preprocessing of dry clay, with the properties of pH, EC, TN, and clay having the best statistical values in both the regression models. Compared to the regression model that underwent SG smoothing, the regression model with SNVs showed generally better results. For TN, there was no significant difference between the results of SG smoothing (RPD = 1.43, R2 = 0.51) and SNV preprocessing (RPD = 1.44, R2 = 0.55), but for clay, the model with the SNV (RPD = 2.21, R2 = 0.80) had about a 16% higher RPD compared to that of the model that underwent SG smoothing (RPD = 1.90, R2 = 0.72).
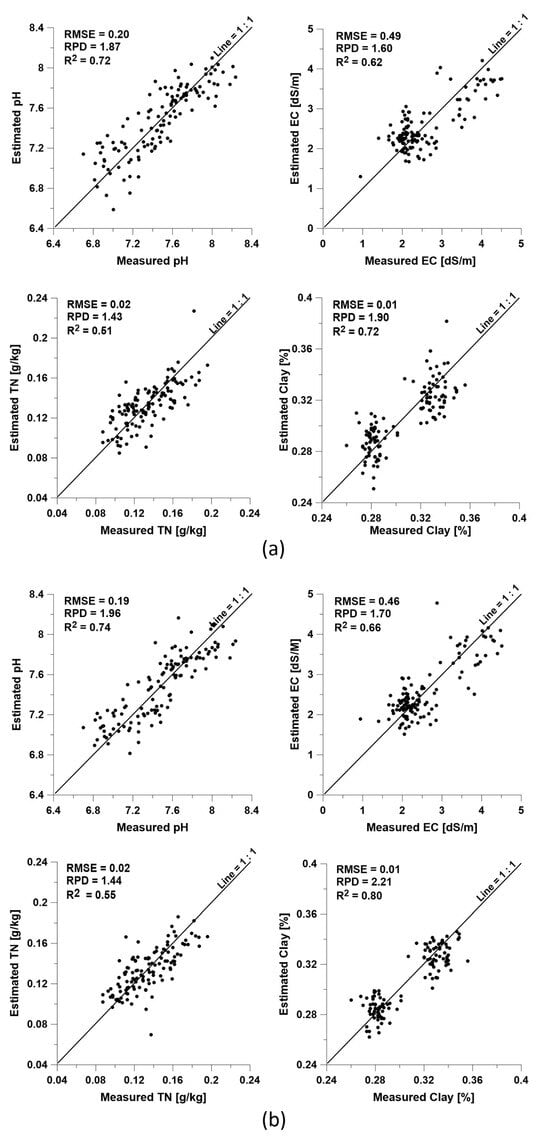
Figure 5.
Scatter plots of PLS-estimated vs. PLS-measured values for the pH, EC, TN, and clay content between (a) SG smoothing and (b) SNV preprocessing.
4. Conclusions
This study aimed to investigate the regression model of soil property prediction by using a DRS preprocessing method after collecting soil samples from saltwater paddy fields in Korea. A total of 120 soil samples from saltwater paddy fields were collected for property analysis, spectral data were collected for the dry and wet soils, and PLSR analysis was then performed by applying SG smoothing and SNV preprocessing methods.
For the soil property prediction models of the wet soil collected from the fields that underwent SG smoothing and SNV preprocessing, both resulted in a poor model. However, when SG smoothing was applied to the dry clay, pH, EC, and TN, they all met the criteria for a fair model in the VIS spectral region, while clay met the criteria for a fair model in the NIR spectral region. In addition, when SNV preprocessing was applied to the dry clay, clay met the criteria for a good model in the VIS spectral region, while pH, EC, and TN resulted in a fair model. For the B–matrix wavelengths of dry clay, only the pH and TOC properties with SNVs showed an increasing trend in the 1350–1450 nm region, while the other soil property values decreased. In addition, all the soil properties that underwent SG smoothing and SNV preprocessing showed similar wavelength trends in the 1800–1950 nm region.
The results of the analysis of dry and wet soils showed that the regression model for predicting soil properties that underwent SNV preprocessing was statistically better than the regression model that underwent SG smoothing, and that the SNV method was more favorable in PLSR analysis with a single round of preprocessing. Collecting data under various soil conditions and researching more preprocessing techniques are expected to improve the accuracy of the soil property predicting models. Additionally, compared to traditional soil analysis methods, this approach is considered more efficient in terms of time, labor, and cost, and it is expected to enhance the reliability and safety of real-time soil property measurements in the field. However, the research on utilizing DRS for soil property based on each preprocessing is not enough in South Korea. Further research is needed on the performance of various preprocessing, such as SNV, SG, and others, with additional data.
Author Contributions
Conceptualization, Y.C. and J.S.; methodology, W.-J.C.; software, M.Y.; validation, J.S., D.-C.K. and Y.C.; formal analysis, Y.C. and M.Y.; data curation, D.-C.K. and W.-J.C.; writing—original draft preparation, J.S. and Y.C.; writing—review and editing, Y.C. and M.Y.; project administration, Y.C. and D.-C.K. All authors have read and agreed to the published version of the manuscript.
Funding
This research was supported by the Rural Development Administration of Korea (RS-2022-RD010389) and the National Institute of Agriculture, Forestry, and Food Technology Planning and Evaluation (RS-2023-00236201). This research was supported by “Research Base Construction Fund Support Program” funded by Jeonbuk National University in 2024.
Institutional Review Board Statement
Not applicable.
Informed Consent Statement
Not applicable.
Data Availability Statement
The original contributions presented in the study are included in the article, further inquiries can be directed to the corresponding authors.
Conflicts of Interest
The authors declare no conflicts of interest.
References
- Heydari, L.; Bayat, H.; Castrignanò, A. Scale-dependent geostatistical modelling of crop-soil relationships in view of Precision Agriculture. Precis. Agric. 2023, 24, 1261–1287. [Google Scholar] [CrossRef]
- Kim, D. Development and Accuracy Evaluation of Field Soil Temperature Prediction Model by Depth Using Artificial Intelligence and Meteorological Parameters. Master’s Thesis, The Seoul National University, Seoul, Republic of Korea, 2002. [Google Scholar]
- Passioura, J. Soil conditions and plant growth. Plant Cell Environ. 2002, 25, 311–318. [Google Scholar] [CrossRef] [PubMed]
- Tahat, M.M.; Alananbeh, K.M.; Othman, Y.A.; Leskovar, D.I. Soil health and sustainable agriculture. Sustainability 2020, 12, 4859. [Google Scholar] [CrossRef]
- Yun, H.-W.; Choi, C.-H.; Kim, Y.-J.; Hong, S.-J. Development of real-time chemical properties analysis technique in paddy soil for precision farming. Korean J. Agric. Sci. 2014, 41, 59–63. [Google Scholar]
- Shin, K.-S.; Lim, W.-J.; Lee, S.E.; Lee, J.S.; Cha, G.S. Development of extracting solution for soil chemical analysis suitable to integrated ion-selective micro-electrodes. Korean J. Soil Sci. Fertil. 2009, 42, 513–521. [Google Scholar]
- Dalmolin, R.S.D.; Gonçalves, C.N.; Klamt, E.; Dick, D.P. Relationship between the soil constituents and its spectral behavior. Ciência Rural 2005, 35, 481–489. [Google Scholar] [CrossRef]
- Rossel, R.V.; Walvoort, D.; McBratney, A.; Janik, L.J.; Skjemstad, J. Visible, near infrared, mid infrared or combined diffuse reflectance spectroscopy for simultaneous assessment of various soil properties. Geoderma 2006, 131, 59–75. [Google Scholar] [CrossRef]
- Lee, K.; Lee, D.; Sudduth, K.; Chung, S.; Kitchen, N.; Drummond, S. Wavelength identification and diffuse reflectance estimation for surface and profile soil properties. Trans. ASABE 2009, 52, 683–695. [Google Scholar] [CrossRef]
- Mouazen, A.M.; De Baerdemaeker, J.; Ramon, H. Towards development of on-line soil moisture content sensor using a fibre-type NIR spectrophotometer. Soil Tillage Res. 2005, 80, 171–183. [Google Scholar] [CrossRef]
- Vestergaard, R.-J.; Vasava, H.B.; Aspinall, D.; Chen, S.; Gillespie, A.; Adamchuk, V.; Biswas, A. Evaluation of optimized preprocessing and modelling algorithms for prediction of soil properties using vis-NIR spectroscopy. Sensors 2021, 20, 6745. [Google Scholar] [CrossRef]
- Veum, K.S.; Parker, P.A.; Sudduth, K.A.; Holan, S.H. Predicting Profile Soil Properties with Reflectance Spectra via Bayesian Covariate-Assisted External Parameter Orthogonalization. Sensors 2018, 18, 3869. [Google Scholar] [CrossRef] [PubMed]
- Dangal, S.R.S.; Sanderman, J.; Wills, S.; Ramirez-Lopez, L. Accurate and precise prediction of soil properties from a large mid-infrared spectral library. Soil Syst. 2019, 3, 11. [Google Scholar] [CrossRef]
- Pei, X.; Sudduth, K.; Veum, K.; Li, M. Improving In-Situ Estimation of Soil Profile Properties Using a Multi-Sensor Probe. Sensors 2019, 19, 1011. [Google Scholar] [CrossRef] [PubMed]
- Qi, H.J.; Paz-Kagan, T.; Karnieli, A.; Li, S.W. Linear multi-task learning for predicting soil properties using field spectroscopy. Remote Sens. 2017, 9, 1099. [Google Scholar] [CrossRef]
- Dotto, A.C.; Dalmolin, R.S.D.; Grunwald, S.; ten Caten, A.; Pereira Filho, W. Two preprocessing techniques to reduce model covariables in soil property predictions by Vis-NIR spectroscopy. Soil Tillage Res. 2017, 172, 59–68. [Google Scholar] [CrossRef]
- Gholizadeh, A.; Amin, M.S.M.; Borůvka, L.; Saberioon, M.M. Models for estimating the physical properties of paddy soil using visible and near infrared reflectance spectroscopy. J. Appl. Spectrosc. 2014, 81, 534–540. [Google Scholar] [CrossRef]
- Conforti, M.; Matteucci, G.; Buttafuoco, G. Using laboratory Vis-NIR spectroscopy for monitoring some forest soil properties. J. Soils Sediments 2017, 18, 1009–1019. [Google Scholar] [CrossRef]
- Miloš, B.; Bensa, A.; Japundžić-Palenkić, B. Evaluation of Vis-NIR preprocessing combined with PLS regression for estimation soil organic carbon, cation exchange capacity and clay from eastern Croatia. Geoderma Reg. 2022, 30, e00558. [Google Scholar] [CrossRef]
- NAAS. Manual of Analysis Procedures for Comprehensive Test Lab; National Academy of Agricultural Science, Rural Development Administration: Suwon-si, Republic of Korea, 2017. [Google Scholar]
- Cho, Y.; Sheridan, A.H.; Sudduth, K.A.; Veum, K.S. Comparison of field and laboratory VNIR spectroscopy for profile soil property estimation. Trans. ASABE 2017, 60, 1503–1510. [Google Scholar] [CrossRef]
- Mouazen, A.M.; Karoui, R.; De Baerdemaeker, J.; Ramon, H. Characterization of soil water content using measured visible and near infrared spectra. Soil Sci. Soc. Am. J. 2006, 70, 1295–1302. [Google Scholar] [CrossRef]
- Bogrekci, I.; Lee, W. Effects of soil moisture content on absorbance spectra of sandy soils in sensing phosphorus concentrations using UV-VIS-NIR spectroscopy. Trans. ASABE 2006, 49, 1175–1180. [Google Scholar] [CrossRef]
- Weidong, L.; Baret, F.; Xingfa, G.; Qingxi, T.; Lanfen, Z.; Bing, Z. Relating soil surface moisture to reflectance. Remote Sens. Environ. 2002, 81, 238–246. [Google Scholar] [CrossRef]
- ASAE Standard S358 2(DEC93); Moisture Measurement—Forages. ASAE: Washington, DC, USA, 2012.
- Joo, H. Prediction of Soil Properties in Paddy Soil Using Sensor Fusion Data. Master’s Thesis, The Jeonbuk National University, Jeonju, Republic of Korea, 2023. [Google Scholar]
- Rinnan, Å.; Van Den Berg, F.; Engelsen, S.B. Review of the most common pre-processing techniques for near-infrared spectra. TrAC Trends Anal. Chem. 2009, 28, 1201–1222. [Google Scholar] [CrossRef]
- Mishra, P.; Biancolillo, A.; Roger, J.M.; Marini, F.; Rutledge, D.N. New data preprocessing trends based on ensemble of multiple preprocessing techniques. TrAC Trends Anal. Chem. 2020, 132, 116045. [Google Scholar] [CrossRef]
- Gholizadeh, A.; Borůvka, L.; Saberioon, M.M.; Kozák, J.; Vašát, R.; Němeček, K. Comparing different data preprocessing methods for monitoring soil heavy metals based on soil spectral features. Soil Water Res. 2015, 10, 218–227. [Google Scholar] [CrossRef]
- Savitzky, A.; Golay, M.J. Smoothing and differentiation of data by simplified least squares procedures. Anal. Chem. 1964, 36, 1627–1639. [Google Scholar] [CrossRef]
- Vibhute, A.D.; Kale, K.V.; Mehrotra, S.C.; Dhumal, R.K.; Nagne, A.D. Determination of soil physicochemical attributes in farming sites through visible, near-infrared diffuse reflectance spectroscopy and PLSR modeling. Ecol. Process. 2018, 7, 1–12. [Google Scholar] [CrossRef]
- Shi, X.; Yao, L.; Pan, T. Visible and near-infrared spectroscopy with multi-parameters optimization of Savitzky-Golay smoothing applied to rapid analysis of soil cr content of pearl river delta. J. Geosci. Environ. Prot. 2021, 9, 75. [Google Scholar] [CrossRef]
- Barnes, R.; Dhanoa, M.S.; Lister, S.J. Standard normal variate transformation and de-trending of near-infrared diffuse reflectance spectra. Appl. Spectrosc. 1989, 43, 772–777. [Google Scholar] [CrossRef]
- Wold, H. Systems Analysis by Partial Least Squares. In Measuring the Unmeasurable; Nijkamp, P., Leitner, H., Wrigley, N., Eds.; Martinus Nijhoff Publishers: Dordrecht, The Netherlands, 1985; pp. 221–251. [Google Scholar]
- Cozzolino, D.; Moron, A. The potential of near-infrared reflectance spectroscopy to analyse soil chemical and physical characteristics. J. Agric. Sci. 2003, 140, 65–71. [Google Scholar] [CrossRef]
- P Leone, A.; A Viscarra-Rossel, R.; Amenta, P.; Buondonno, A. Prediction of soil properties with PLSR and vis-NIR spectroscopy: Application to mediterranean soils from Southern Italy. Curr. Anal. Chem. 2012, 8, 283–299. [Google Scholar] [CrossRef]
- Nawar, S.; Buddenbaum, H.; Hill, J. Digital mapping of soil properties using multivariate statistical analysis and ASTER data in an arid region. Remote Sens. 2015, 7, 1181–1205. [Google Scholar] [CrossRef]
- Gomez, C.; Lagacherie, P.; Coulouma, G. Regional predictions of eight common soil properties and their spatial structures from hyperspectral Vis–NIR data. Geoderma 2012, 189, 176–185. [Google Scholar] [CrossRef]
- Cho, Y.; Sudduth, K.A.; Drummond, S.T. Profile soil property estimation using a VIS-NIR-EC-force probe. Trans. ASABE 2017, 60, 683–692. [Google Scholar] [CrossRef]
- Chang, C.-W.; Laird, D.A.; Mausbach, M.J.; Hurburgh, C.R. Near-infrared reflectance spectroscopy–principal components regression analyses of soil properties. Soil Sci. Soc. Am. J. 2001, 65, 480–490. [Google Scholar] [CrossRef]

Disclaimer/Publisher’s Note: The statements, opinions and data contained in all publications are solely those of the individual author(s) and contributor(s) and not of MDPI and/or the editor(s). MDPI and/or the editor(s) disclaim responsibility for any injury to people or property resulting from any ideas, methods, instructions or products referred to in the content. |
© 2024 by the authors. Licensee MDPI, Basel, Switzerland. This article is an open access article distributed under the terms and conditions of the Creative Commons Attribution (CC BY) license (https://creativecommons.org/licenses/by/4.0/).