
Numerical and Analytical Estimation of the Wind Speed Causing Overturning of the Fast-Erecting Crane—Part II

Abstract
:Featured Application
Abstract
1. Introduction
2. Materials and Methods
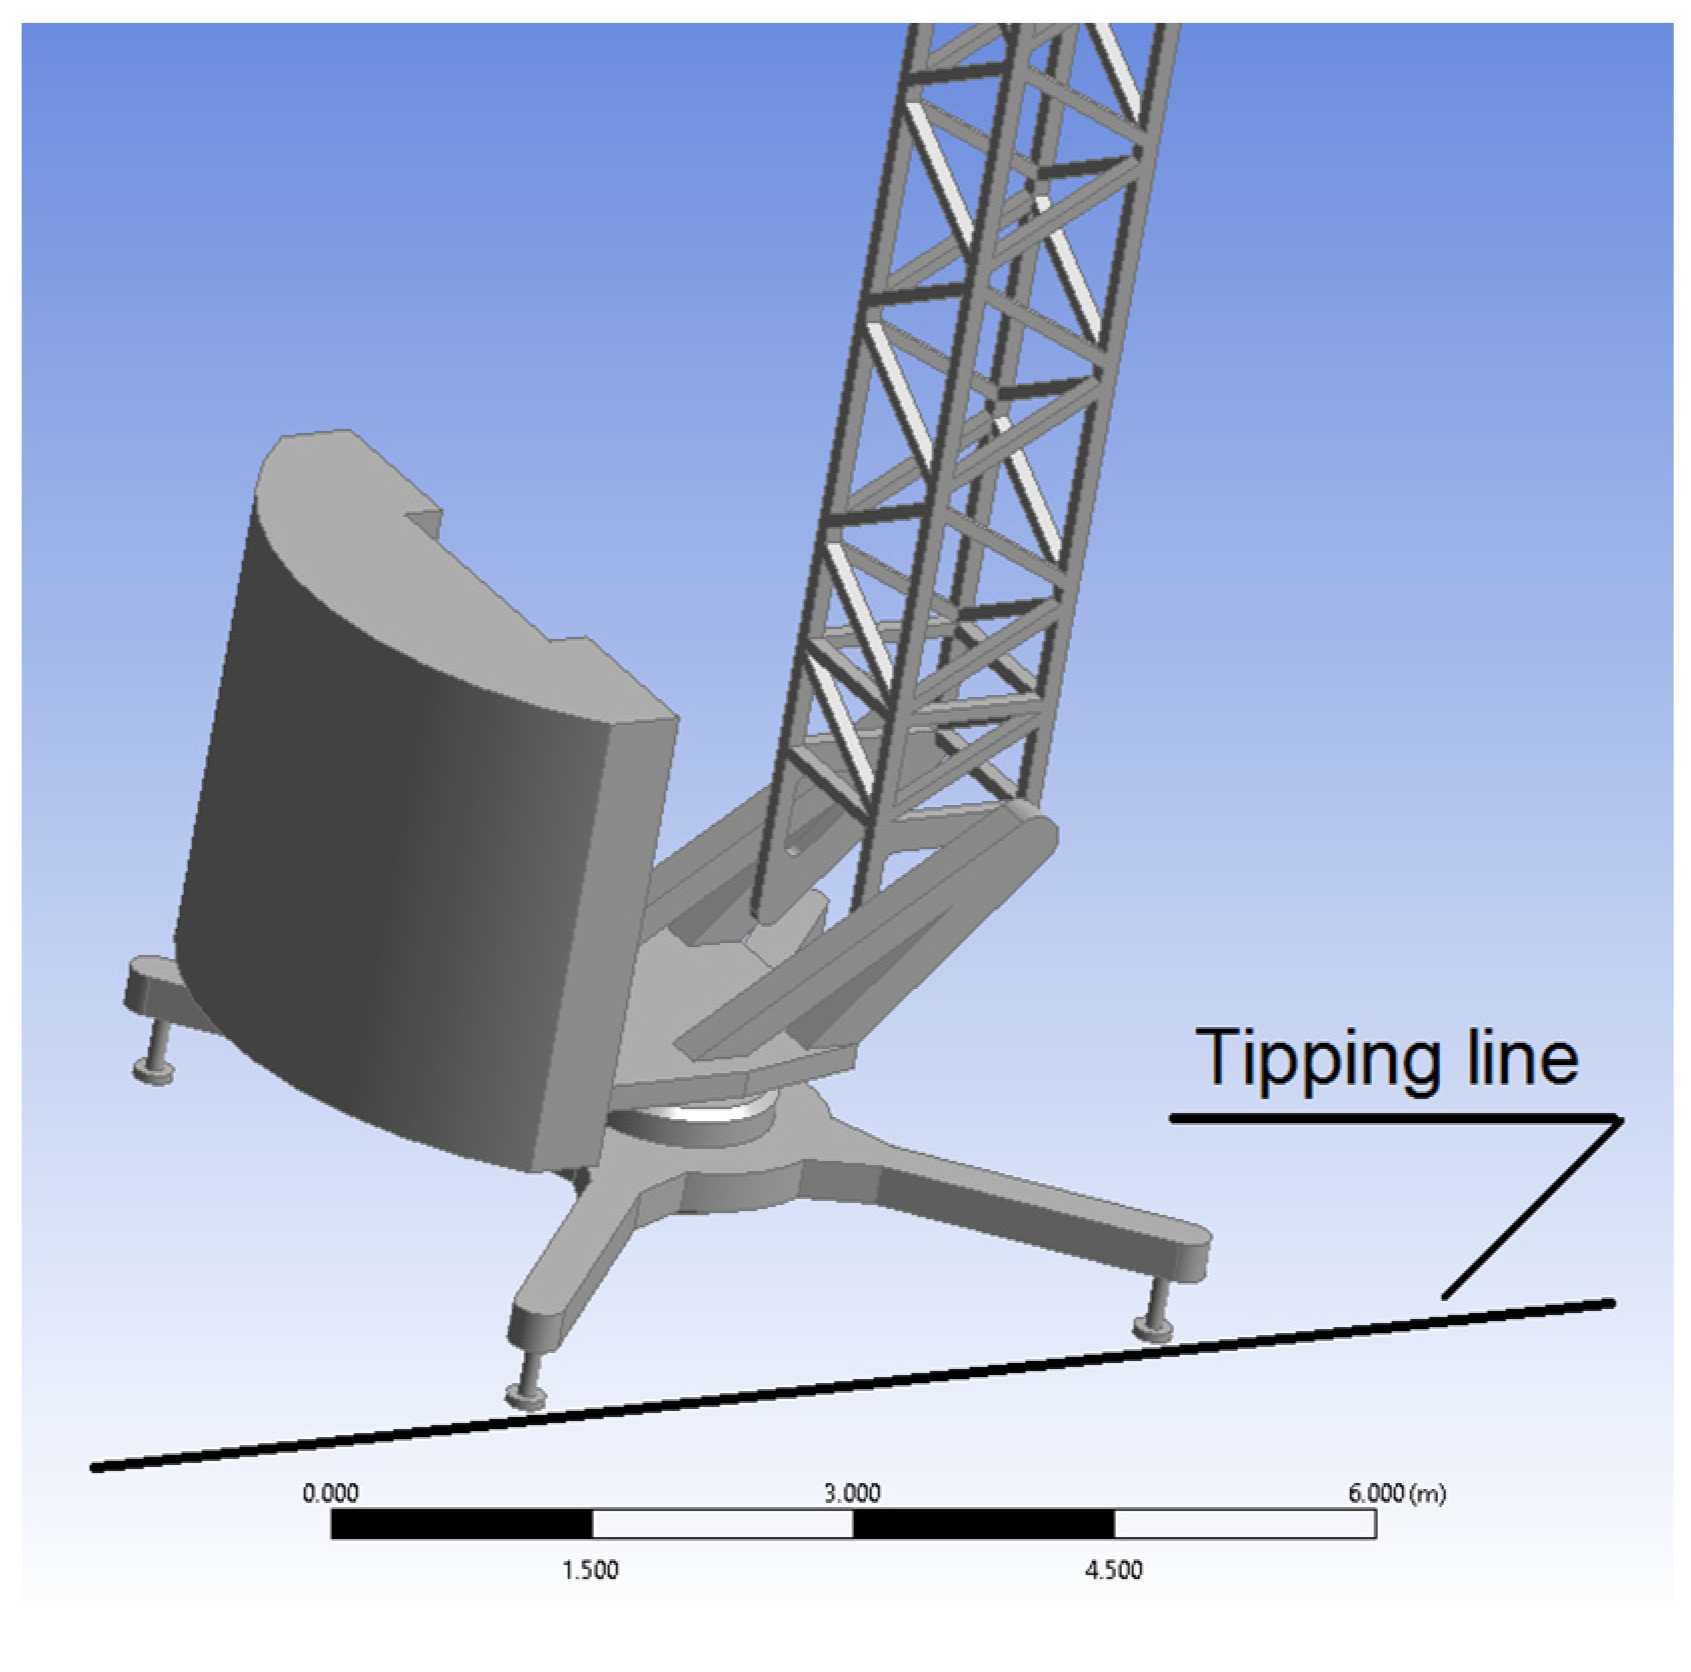
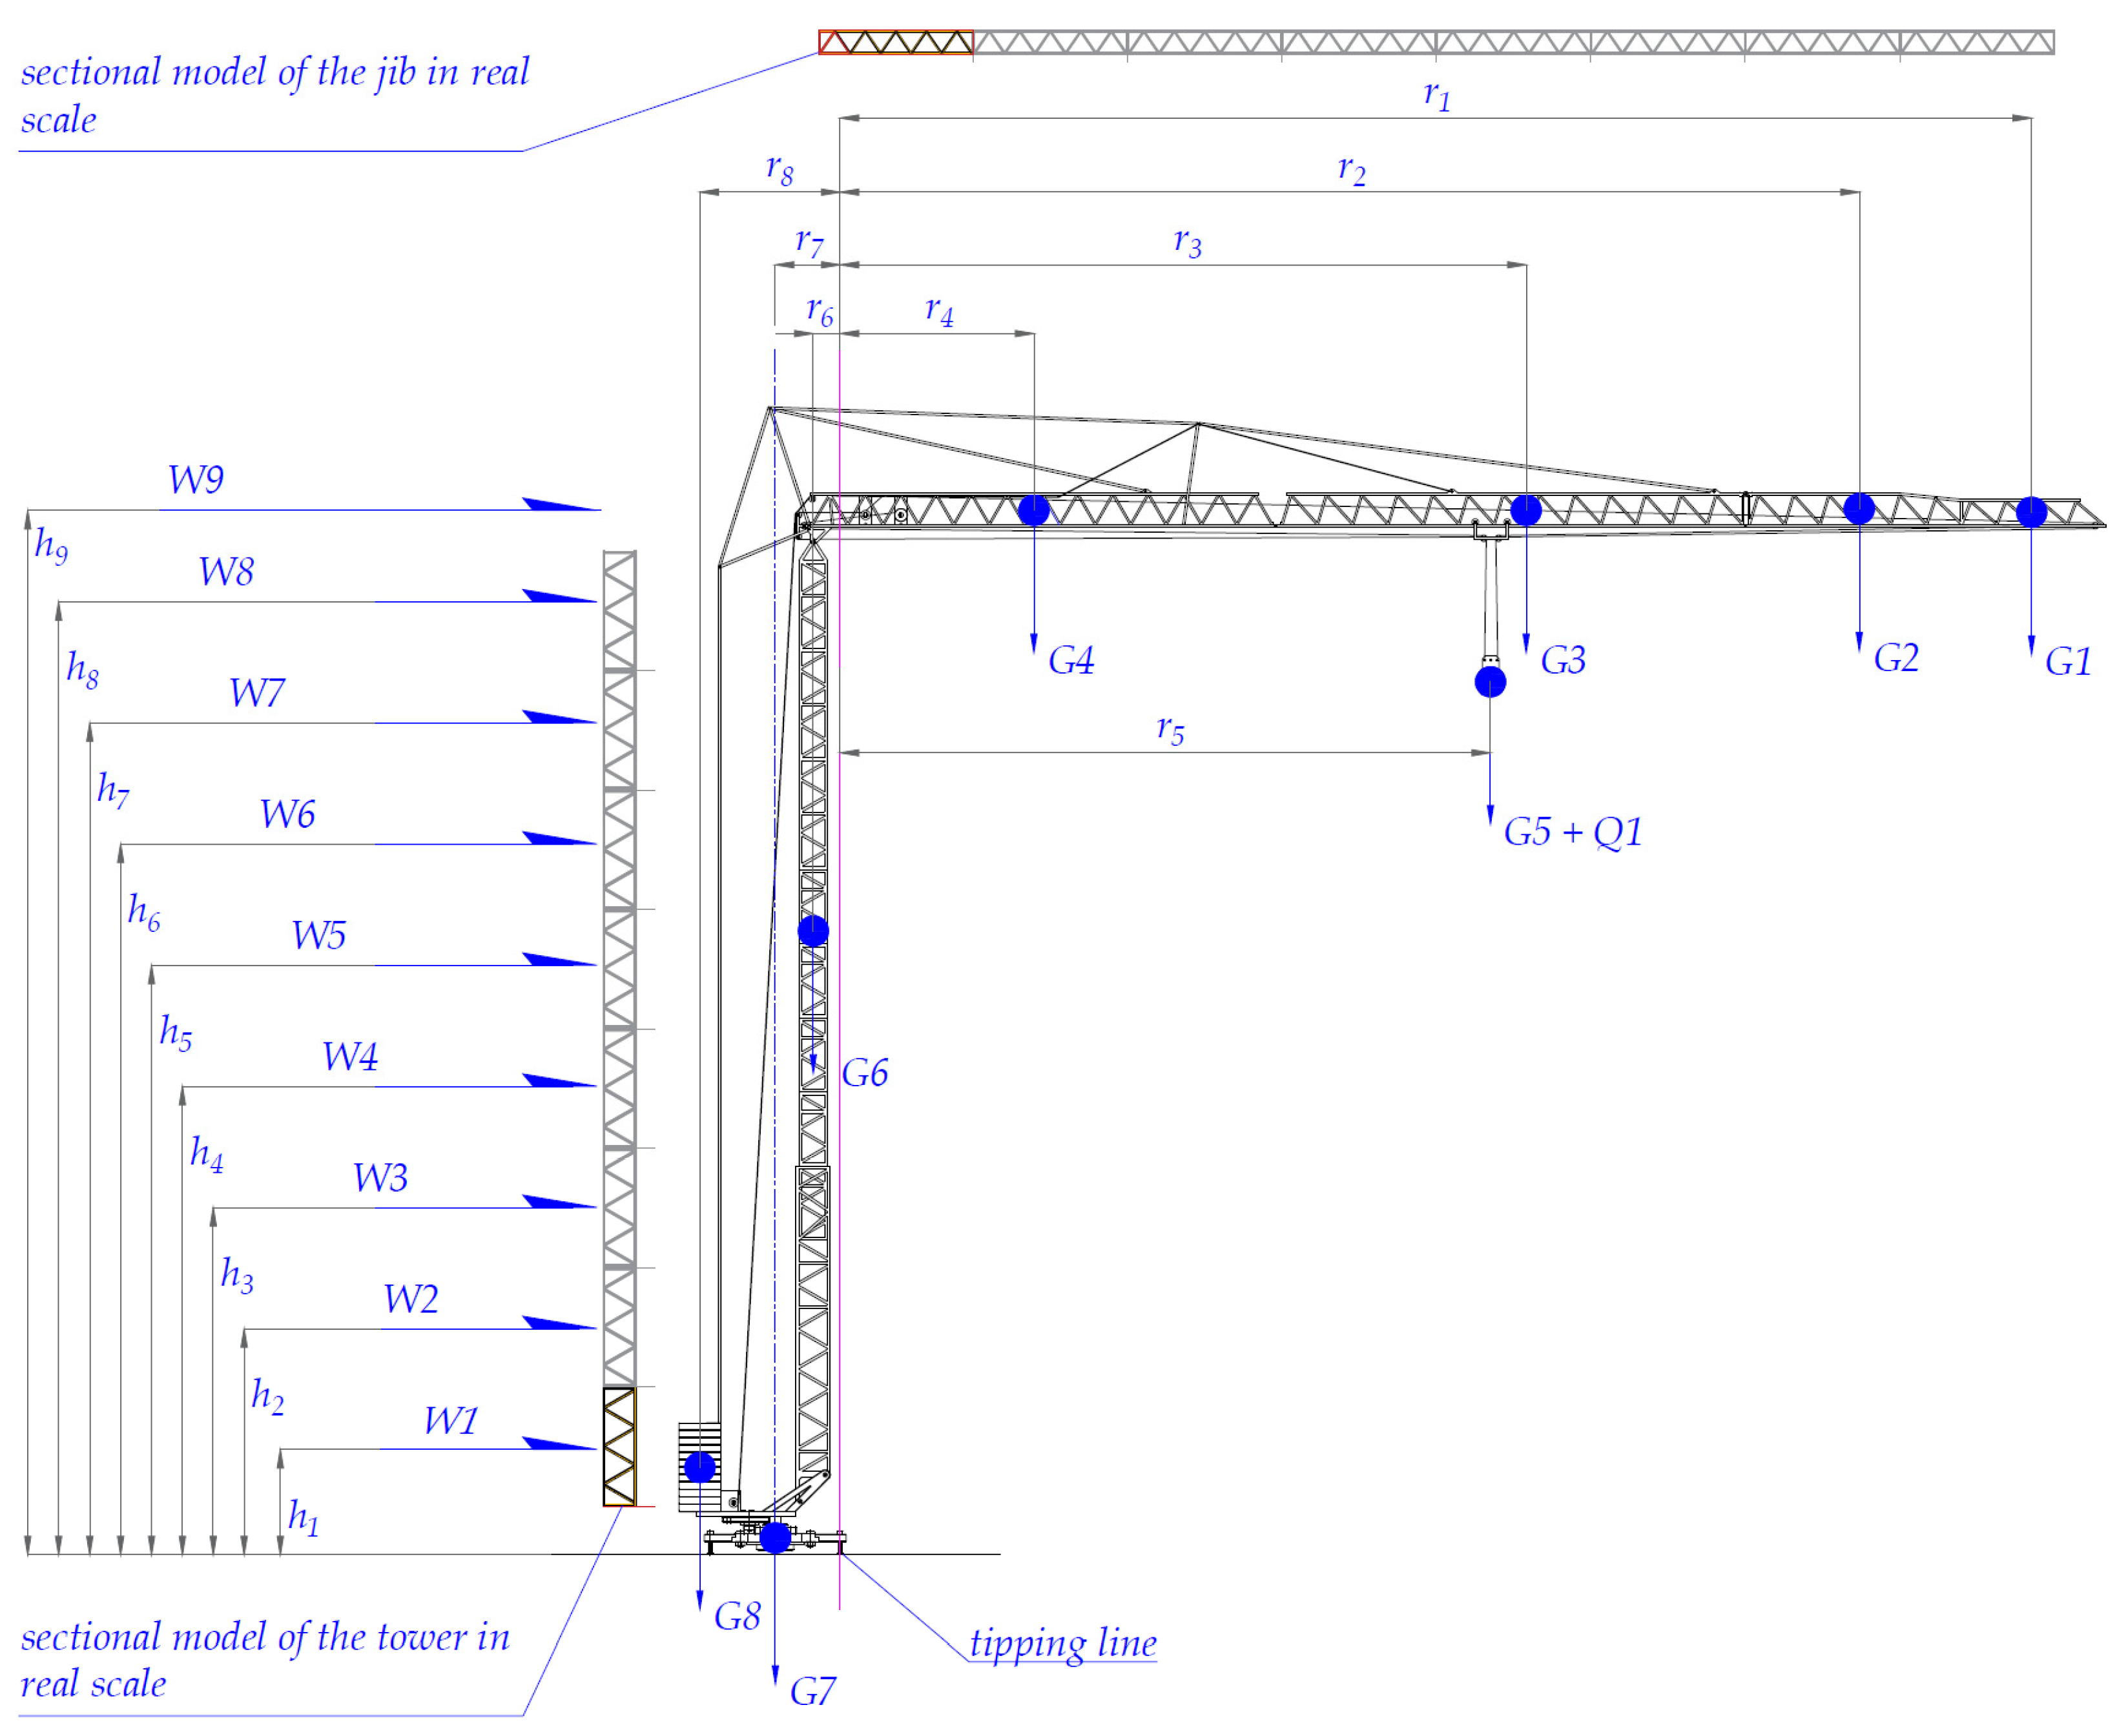
2.1. Object of Study
- The CAD model does not contain: rope immobilizing the horizontal jib, rear lashing, guy support I, crane jib—lashing rope II, crane jib—lashing rope III, crane jib—lashing rope I, jib—assembly rope, guy support II—head, lifting rope with hook.
- The jib extension at the end of the jib is made of the same lattice as other parts of the horizontal part of the crane.
- The wider and narrower parts of the crane tower truss are connected directly. These parts do not overlap each other like in the real structure.
- The dimensions of the transverse sections of some elements of the lattice are slightly changed to avoid problems and errors during automatic mesh generation.
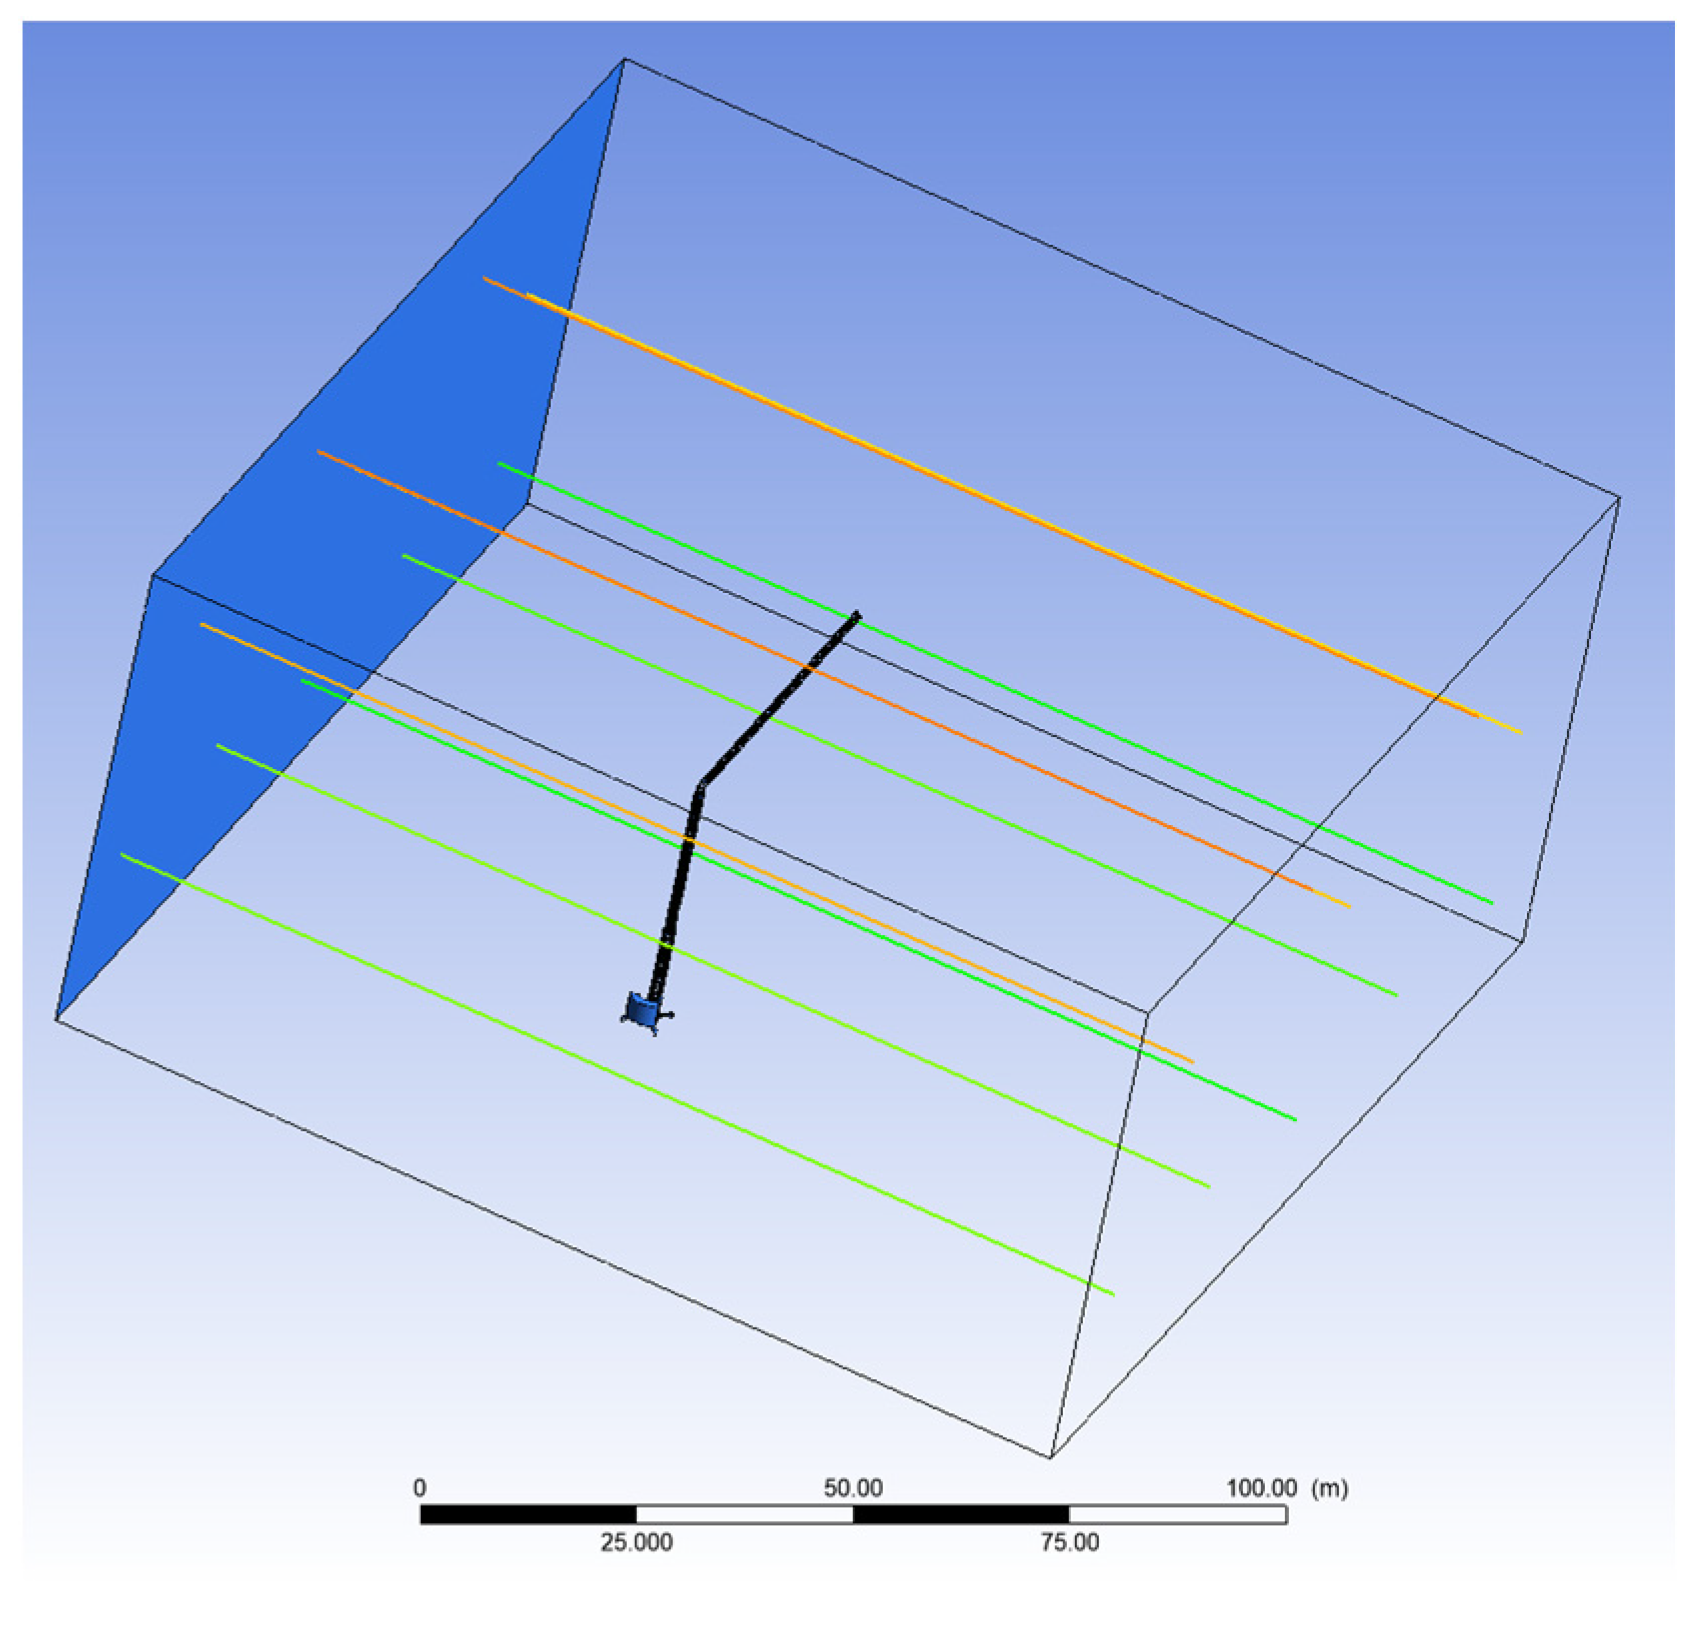
2.2. CFD Simulation
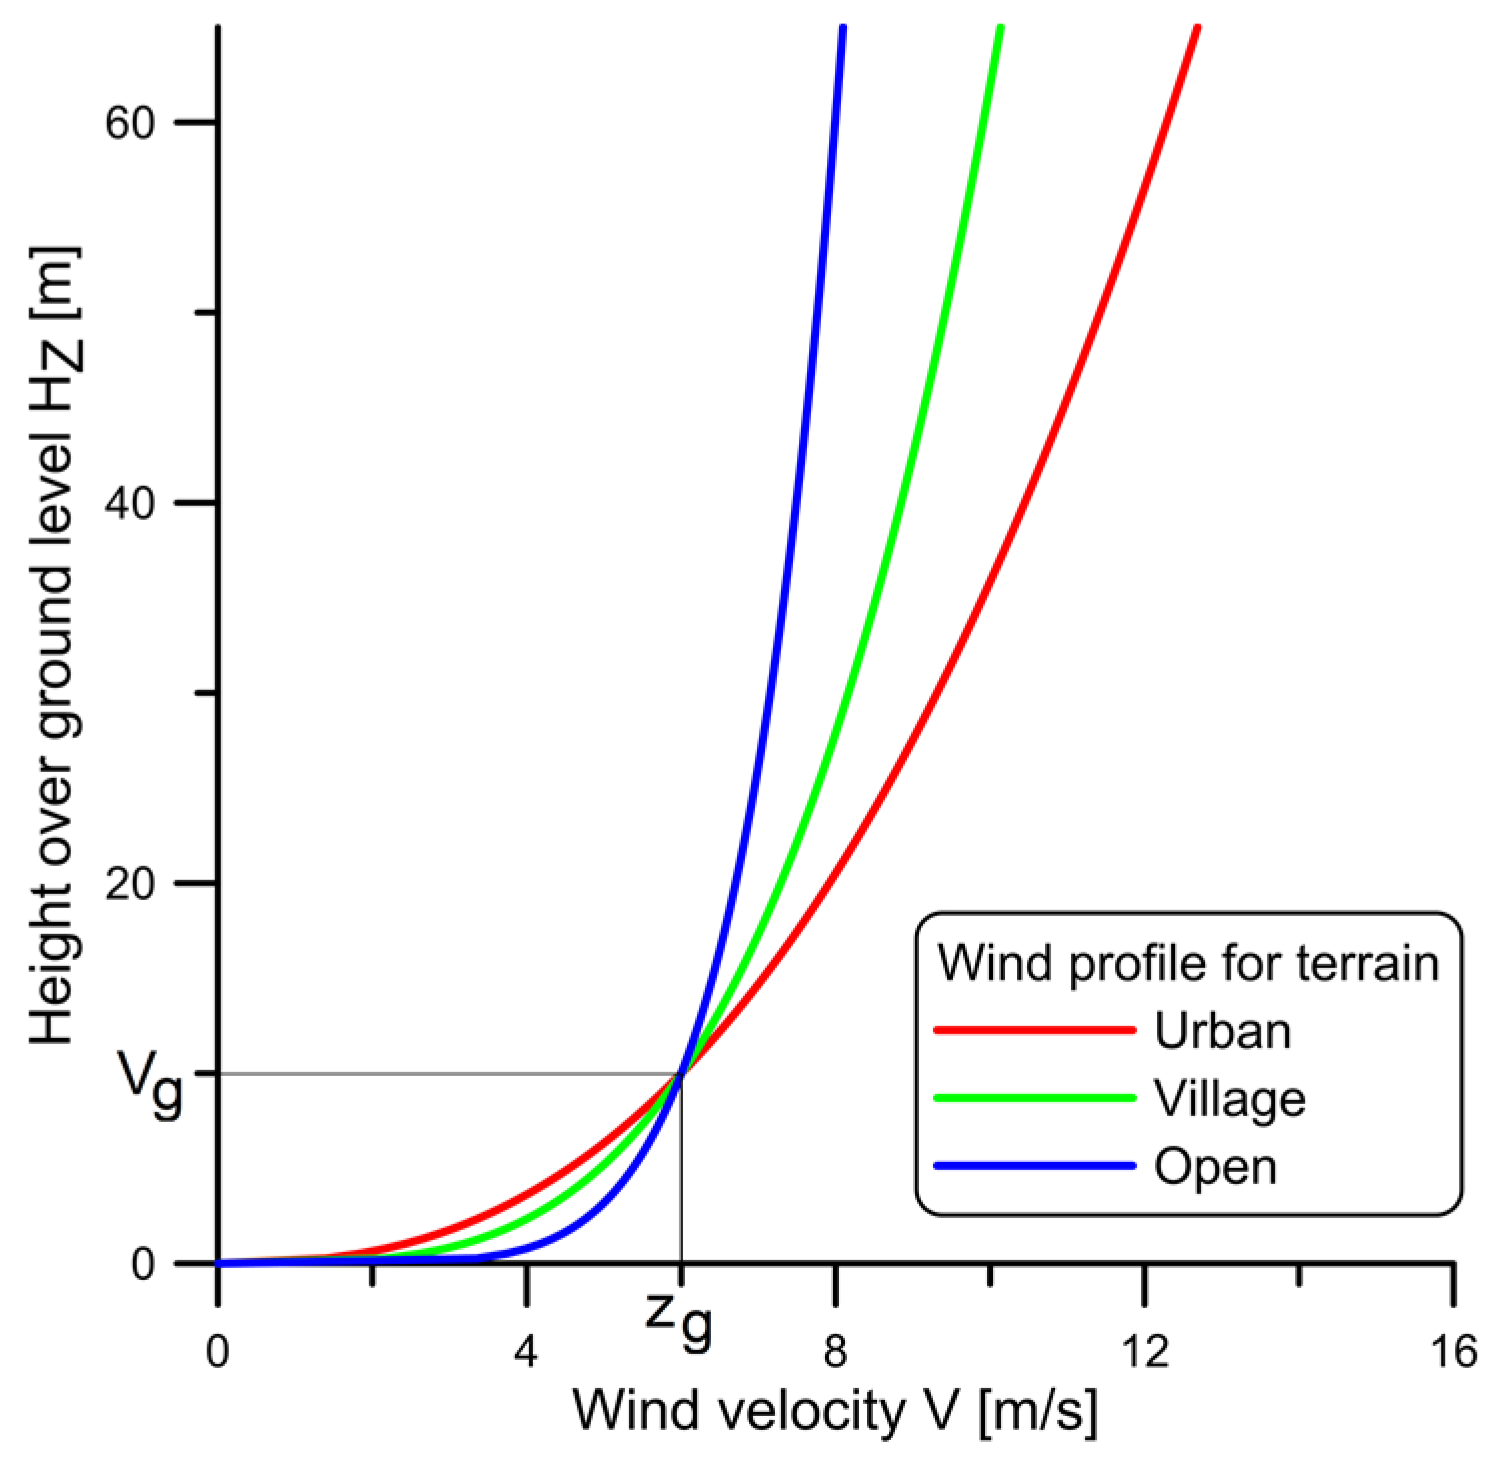
2.2.1. Wind Profile
2.2.2. Finite Cell Mesh
3. Results of CFD Simulation
3.1. Validation of Numerical Results Obtained from CFD Simulation with Experimental Results for Sectional Models
3.2. The Wind Force Estimation According to the Standard
3.3. The Wind Force Estimation Based on the Experiment
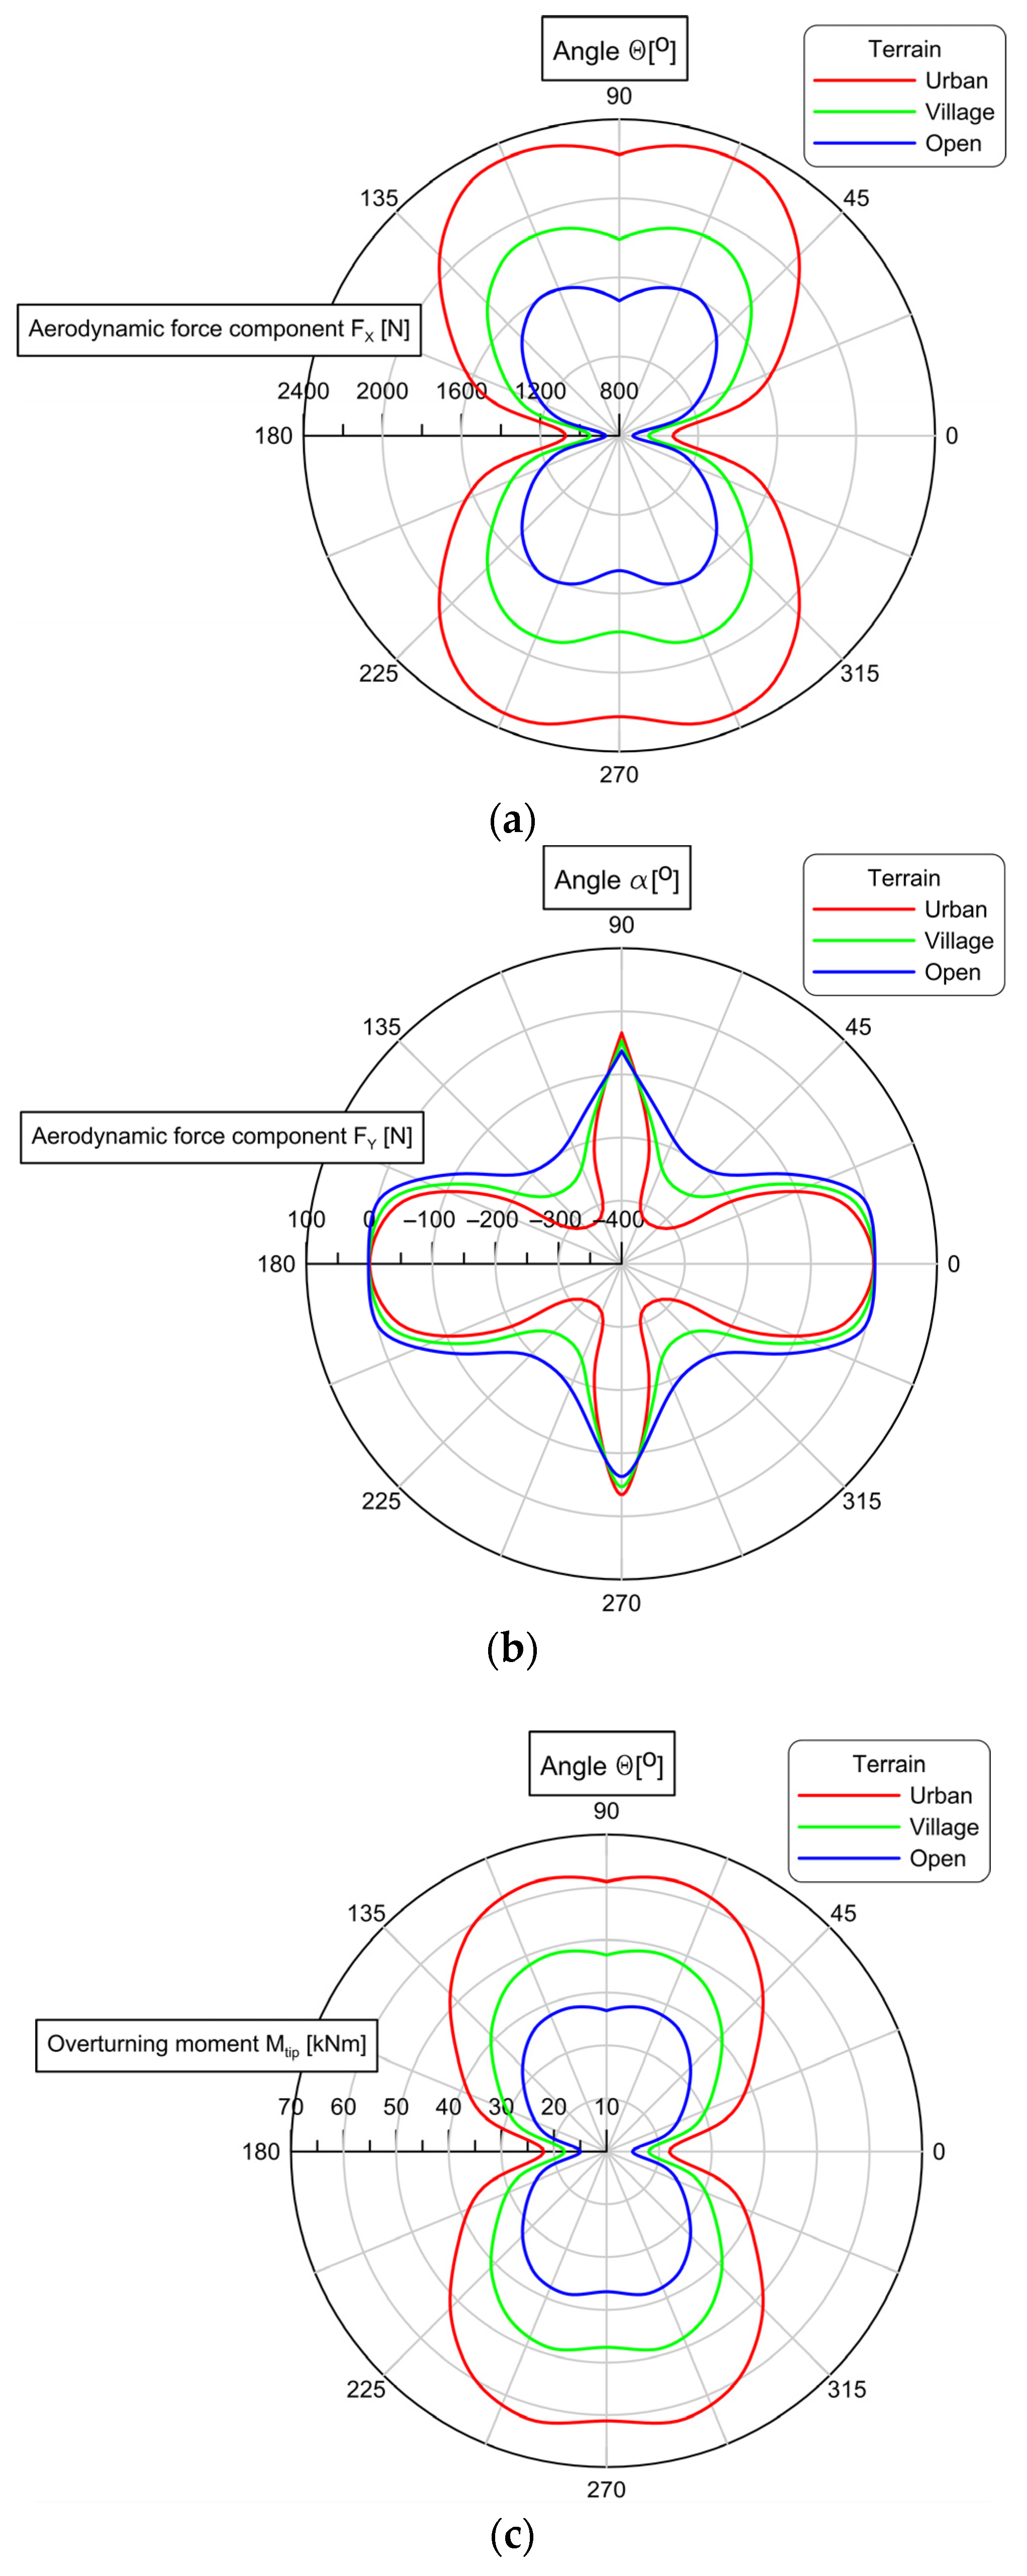
3.4. The Wind Force Estimation According to the CFD
4. Discussion
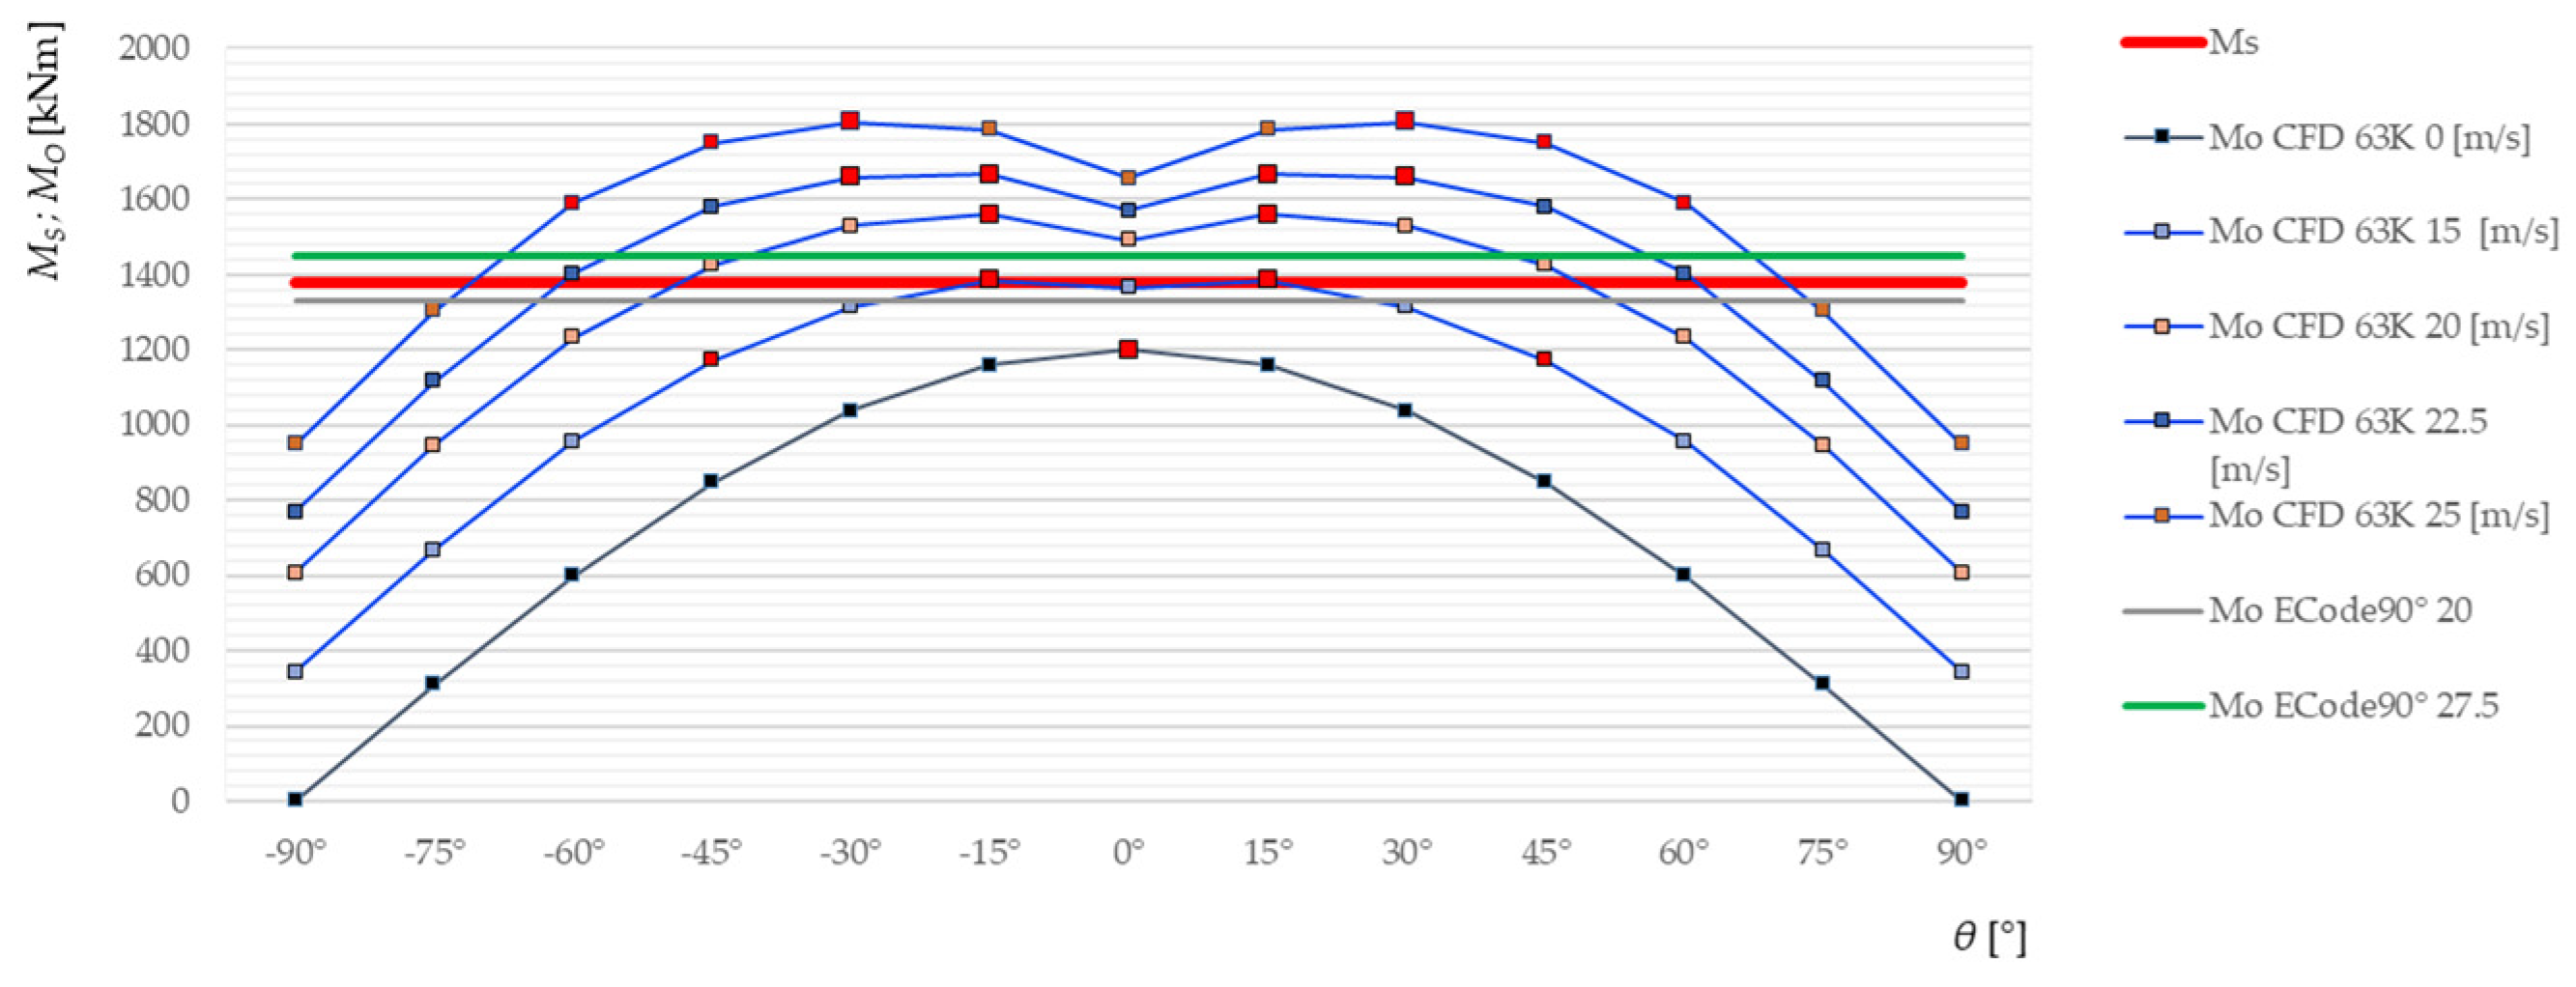
4.1. The Maximum Wind Force
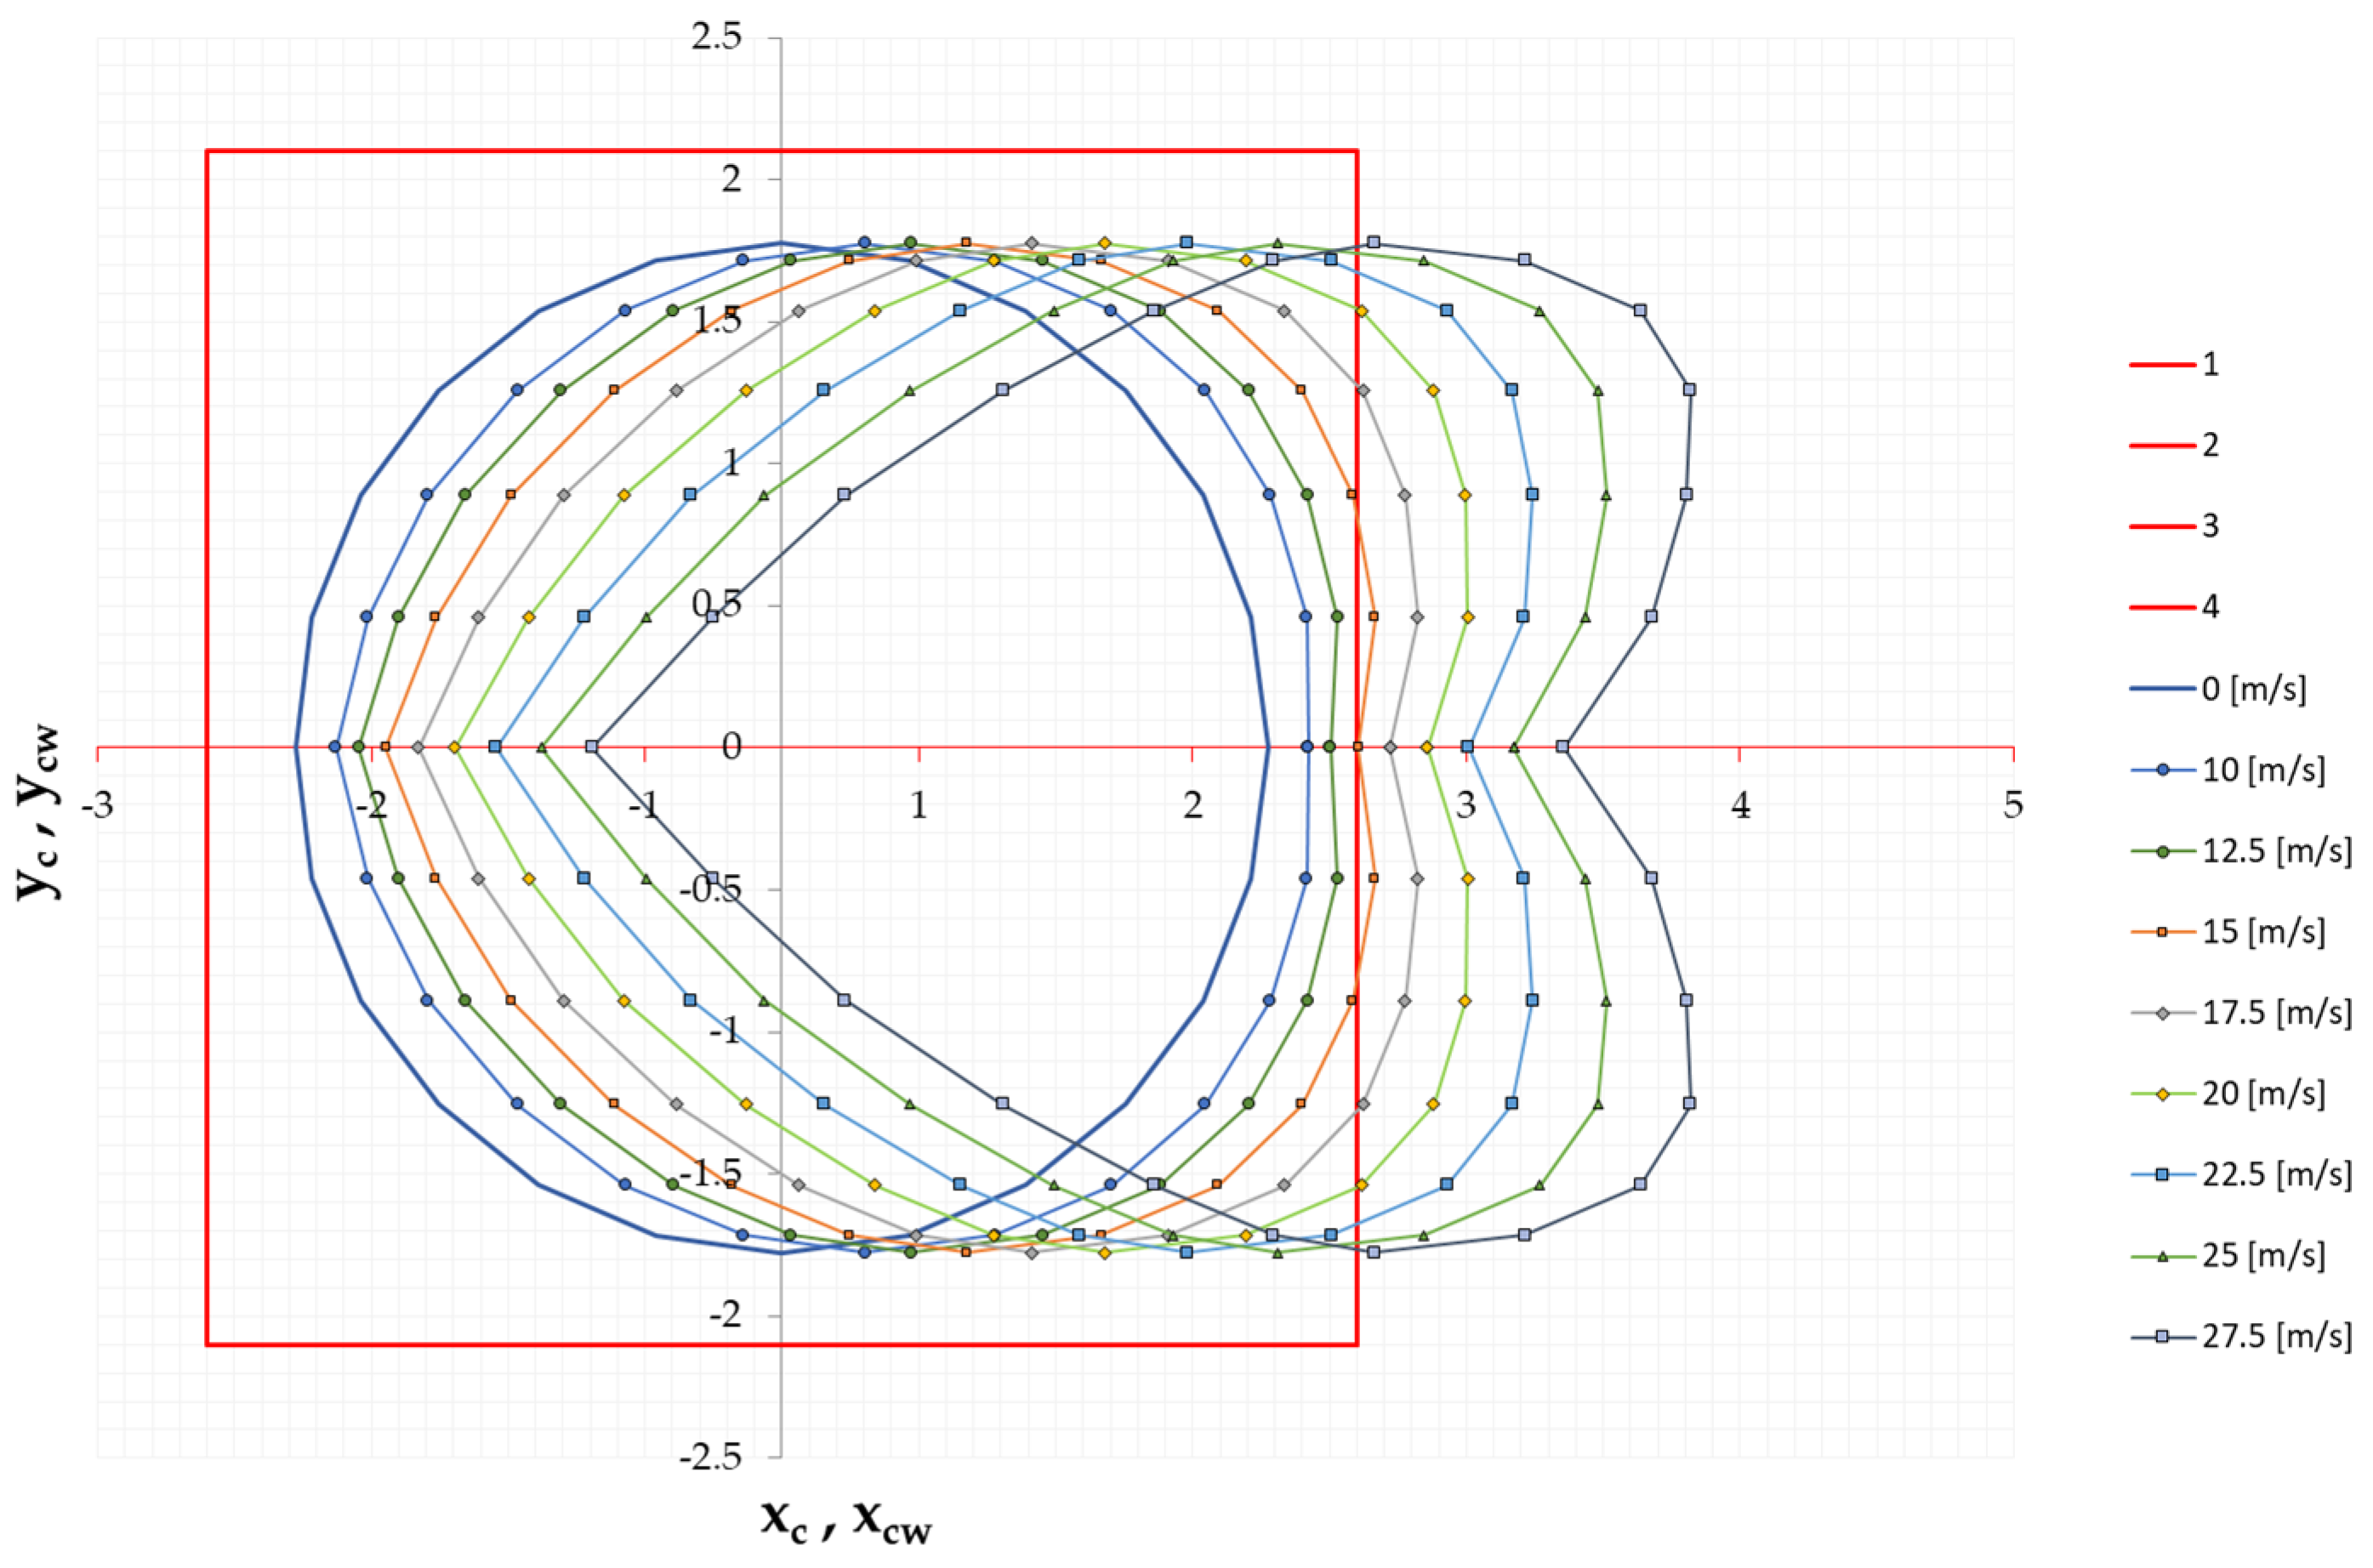
4.2. Trace of the Center of Gravity
5. Conclusions
Author Contributions
Funding
Institutional Review Board Statement
Informed Consent Statement
Data Availability Statement
Conflicts of Interest
References
- Wiosło, M.; Grochot, A. The Gale Overturned a Crane in Krakow. Two People Are Dead, RMF24. 2022. Available online: https://www.rmf24.pl/regiony/krakow/news-wichura-przewrocila-dzwig-w-krakowie-dwie-osoby-nie-zyja-fil,nId,5838306#crp_state=1 (accessed on 27 February 2024). (In Polish).
- Release from the Press Office of the Institute of Meteorology and Water Management, Warsaw, 16 February 2022. Available online: https://danepubliczne.imgw.pl/data/arch/ost_meteo/2022/ (accessed on 27 February 2024). (In Polish).
- Ciryt, B. Fatal Accident at the Construction Site of the Court in Wieliczka. The Crane Fell onto an Employee’s Container, and One Person Died. Watch the Video, Wieliczka Nasze Miasto. 2023. Available online: https://wieliczka.naszemiasto.pl/smiertelny-wypadek-na-budowie-sadu-w-wieliczce-dzwig/ar/c1-9511255 (accessed on 27 February 2024). (In Polish).
- König, G.; Zilch, K.; Lappas, G. Wind Loading of Shipyard Gantry Cranes—A Comparison of Full-Scale Measurement, Wind Tunnel Test and Gust Factor Approach, Wind Engineering. In Proceedings of the Fifth International Conference, Fort Collins, CO, USA, 8–13 July 1979; Volume 2, pp. 911–923. [Google Scholar]
- Klinger, C. Failures of cranes due to wind induced vibrations. Eng. Fail. Anal. 2014, 43, 198–220. [Google Scholar] [CrossRef]
- Jiang, H.; Li, S. The Wind-Induced Vibration Response for Tower Crane Based on Virtual Excitation Method. Open Mech. Eng. J. 2014, 8, 201–205. [Google Scholar] [CrossRef]
- Jiang, H.; Li, Y. Dynamic Reliability Analysis of Tower Crane with Wind Loading. IOP Conf. Ser. Mater. Sci. Eng. 2019, 677, 052031. [Google Scholar] [CrossRef]
- Chen, W.; Qin, X.R.; Yang, Z.; Zhan, P. Wind-induced tower crane vibration and safety evaluation. J. Low Freq. Noise Vib. Act. Control. 2020, 39, 297–312. [Google Scholar] [CrossRef]
- Hechmi El Ouni, M.; Ben Kahla, N.; Islam, S.; Jameel, M. A Smart Tower Crane to Mitigate Turbulent Wind Loads. Struct. Eng. Int. 2021, 31, 18–29. [Google Scholar] [CrossRef]
- Oliveira, S.C.; Correia, P.M.B. Comparison of the seismic and wind analyses of two tower cranes. J. Vibroeng. 2021, 23, 956–975. [Google Scholar] [CrossRef]
- Lu, Y.; Gao, M.; Liang, T.; He, Z.; Feng, F.; Pan, F. Wind-induced vibration assessment of tower cranes attached to high-rise buildings under construction. Automat. Constr. 2022, 135, 104132. [Google Scholar] [CrossRef]
- Lu, Y.; Zhang, L.; He, Z.; Feng, F.; Pan, F. Wind-induced vibration fragility of outer-attached tower crane to super-tall buildings: A case study. Wind. Struct. 2021, 32, 405–421. [Google Scholar]
- Skelton, I.; Demian, P.; Glass, J.; Bouchlaghem, D.; Anumba, C. Lifting Wing in Constructing Tall Buildings—Aerodynamic Testing. Buildings 2014, 4, 245–265. [Google Scholar] [CrossRef]
- Monteiro, F.A.; Moreira, R.M. A CFD Analysis of Wind Effects on Lifted Loads. Int. J. Adv. Eng. Res. Sci. 2019, 6, 365–371. [Google Scholar] [CrossRef]
- Cekus, D.; Gnatowska, R.; Kwiatoń, P. Impact of Wind on the Movement of the Load Carried by Rotary Crane. Appl. Sci. 2019, 9, 3842. [Google Scholar] [CrossRef]
- Cekus, D.; Kwiatoń, P.; Geisler, T. The dynamic analysis of load motion during the interaction of wind pressure. Meccanica 2021, 56, 785–796. [Google Scholar] [CrossRef]
- Jin, L.; Liu, H.; Zheng, X.; Chen, S. Exploring the Impact of Wind Loads on Tower Crane Operation. Hindawi Math. Probl. Eng. 2020, 2020, 2807438. [Google Scholar] [CrossRef]
- Nguyen, T.K. Combination of feedback control and spring-dumper to reduce the vibration of crane payload. Arch. Mech. Eng. 2021, 68, 165–181. [Google Scholar] [CrossRef]
- Lee, S.W.; Shim, J.J.; Han, D.S.; Han, G.J.; Lee, K.S. An Experimental Analysis of the Effect of Wind Load on the Stability of a Container Crane. J. Mech. Sci. Technol. 2007, 21, 448–454. [Google Scholar] [CrossRef]
- Frendo, F. Gantry crane derailment and collapse induced by wind load. Eng. Fail. Anal. 2016, 66, 479–488. [Google Scholar] [CrossRef]
- Su, J.-C.; Li, L.; Chan, P.W.; Zhou, Q.-J.; Yang, H.-L. Numerical simulation research on the overturning of gantry crane by downbursts. Heliyon 2023, 9, e18641. [Google Scholar] [CrossRef] [PubMed]
- Augustyn, M.; Barski, M. Estimation of the Wind Load Required to Cause the Overturning of a Gantry Crane, Comparing Different Structures of the Main Horizontal Girder. Appl. Sci. 2024, 14, 1092. [Google Scholar] [CrossRef]
- Augustyn, M.; Barski, M.; Chwał, M.; Stawiarski, A. Numerical and Experimental Determination of the Wind Speed Value Causing Catastrophe of the Scissor Lift. Appl. Sci. 2023, 13, 3528. [Google Scholar] [CrossRef]
- Wu, X.; Sun, Y.; Wu, Y.; Su, N.; Peng, S. The Interference Effects of Wind Load and Wind-Induced Dynamic Response of Quayside Container Cranes. Appl. Sci. 2022, 12, 10969. [Google Scholar] [CrossRef]
- Holmes, J.D.; Banks, R.W.; Roberts, G. Drag and aerodynamic interference on Microwave dish antennas and their supporting towers. J. Wind. Eng. Ind. Aerod. 1993, 50, 263–270. [Google Scholar] [CrossRef]
- Martín, P.; Elena, V.; Loredo-Souz, A.M.; Camaño, E.B. Experimental study of the effects of dish antennas on the wind loading of telecommunication towers. J. Wind. Eng. Ind. Aerod. 2016, 149, 40–47. [Google Scholar] [CrossRef]
- Carril, C.F., Jr.; Isyumov, N.; Brasil, R.M.L.R.F. Experimental study of the wind forces on rectangular latticed communication towers with antennas. J. Wind. Eng. Ind. Aerod. 2003, 91, 1007–1022. [Google Scholar] [CrossRef]
- Feng, W.; Tamura, Y.; Yoshida, A. Interference effects of a neighboring building on wind loads on scaffolding. J. Wind. Eng. Ind. Aerod. 2014, 125, 1–12. [Google Scholar]
- Holmes, J.D. Wind pressure on tropical housing. J. Wind. Eng. Ind. Aerod. 1994, 53, 105–123. [Google Scholar] [CrossRef]
- Li, G.; Gan, S.; Li, Y.X.; Wang, L. Wind-induced interference effects on low-rise buildings with gable roof. J. Wind. Eng. Ind. Aerod. 2017, 170, 94–106. [Google Scholar] [CrossRef]
- Quan, Y.; Gu, M.; Yukio, T.; Huang, P. Aerodynamic interference of wind loads on roofs of low-rise buildings. J. Tongji Univ. Nat. Sci. 2009, 37, 1576–1580. [Google Scholar]
- Pindado, S.; Meseguer, J.; Franchini, S. Influence of an upstream building on the wind-induced mean suction on the flat roof of a low-rise building. J. Wind. Eng. Ind. Aerod. 2011, 99, 889–893. [Google Scholar] [CrossRef]
- Kareem, A.; Kijewski, T.; Lu, P.C. Investigation of interference effects for a group of finite cylinders. J. Wind. Eng. Ind. Aerod. 1998, 77–78, 503–520. [Google Scholar] [CrossRef]
- Li, G.; Cao, W.B. Structural analysis and optimization of large cooling tower subjected to wind loads based on the iteration of pressure. Struct. Eng. Mech. 2013, 46, 735–753. [Google Scholar] [CrossRef]
- Ke, S.T.; Wang, H.; Ge, Y.J. Interference effect and the working mechanism of wind loads in super-large cooling towers under typical four-tower arrangements. J. Wind. Eng. Ind. Aerod. 2017, 170, 197–213. [Google Scholar] [CrossRef]
- Augustyn, M.; Barski, M.; Chwał, M.; Stawiarski, A. Experimental and Numerical Estimation of the Aerodynamic Forces Induced by the Wind Acting on a Fast-Erecting Crane. Appl. Sci. 2023, 13, 10826. [Google Scholar] [CrossRef]
- Cranes, Hoists & Material Handlers: Tower Cranes, Technical Data Tower Crane LIEBHERR Turmdrehkran 63K. Liebherr-Werk Biberach GMBH, Postfach 1663, D-7950 Biberach an der Riss 1, Germany.
- Zan, Y.F.; Guo, R.N.; Bai, X.; Ma, Y.; Yuan, L.H.; Huasng, F.X. Wind and current loads on a pipelaying crane vessel. IOP Conf. Ser. Earth Environ. Sci. 2020, 612, 012059. [Google Scholar] [CrossRef]
- Yeon, S.M.; Kwon, C.S.; Kim, Y.C.; Kim, K.S. Study of the lift effect on wind load estimation for a semi-submersible rig using the maritime atmospheric boundary layer model. Int. J. Nav. Arch. Ocean 2022, 14, 100419. [Google Scholar] [CrossRef]
- He, Z.; Gao, M.; Liang, T.; Lu, Y.; Lai, X.; Pan, F. Tornado-affected safety assessment of tower cranes outer-attached to super high-rise buildings in construction. J. Build. Eng. 2022, 51, 104320. [Google Scholar] [CrossRef]
- ISO 4302:2016 EN; Cranes-Wind Load Assessment. ISO Copyright Office: Geneva, Switzerland, 2016.
- JIS B 8830-2001; Cranes-Wind Assessment. Japanese Industrial Standards Committee: Tokyo, Japan, 2001.
- BS 2573-1; British Standard. Rules for the Design of Cranes Part 1: Specifications for Classification, Stress Calculations, and Design Criteria for Structures (4th Revision). BSI: San Jose, CA, USA, 1983.
- GB/T 3811-2008; Design Rules for Cranes. General Administration of Quality Supervision. Inspection and Quarantine of the People’s Republic of China: Beijing, China, 2008.
- ASCE. Minimum Design Loads and Associated Criteria for Buildings and Other Structures; ASCE 7: Reston, VA, USA, 2016. [Google Scholar]
- ISO 8686-1:2012; Cranes. Design principles for loads and load combinations. Part 1: General. ISO Copyright Office: Geneva, Switzerland, 2012.


| Cell Size [m] | Faces 1 | Nodes | Cells |
|---|---|---|---|
| 0.030 | 750,922 | 2,290,762 | 12,676,871 |
| 0.028 | 852,216 | 2,593,299 | 14,342,502 |
| 0.020 | 1,705,888 | 4,813,382 | 26,393,269 |
| Cell Size [m] | FX [N] | FY [N] | Mtip [Nm] | Number of Iter. |
|---|---|---|---|---|
| 0.030 | 2227.649 | −43.411 | 61,278.525 | 91 |
| 0.028 | 2221.892 | −34.000 | 61,043.122 | 87 |
| 0.020 | 2196.509 | −31.652 | 60,187.756 | 51 |
| Urban Terrain vref = 7.03210 [m/s] | Village Terrain vref = 6.62928 [m/s] | Open Terrain vref = 6.340482 [m/s] | |||||||
|---|---|---|---|---|---|---|---|---|---|
| Angle α [°] | CX | CY | CM | CX | CY | CM | CX | CY | CM |
| 0 | 1.517 | 0.000 | 0.900 | 1.511 | 0.002 | 0.831 | 1.530 | 0.03 | 0.762 |
| 15 | 2.077 | −0.049 | 1.370 | 1.990 | −0.029 | 1.229 | 1.939 | −0.005 | 1.095 |
| 30 | 2.520 | −0.295 | 1.733 | 2.395 | −0.246 | 1.551 | 2.319 | −0.202 | 1.385 |
| 45 | 2.956 | −0.452 | 2.136 | 2.780 | −0.393 | 1.896 | 2.636 | −0.343 | 1.664 |
| 60 | 3.247 | −0.458 | 2.463 | 3.007 | −0.398 | 2.161 | 2.827 | −0.352 | 1.888 |
| 75 | 3.272 | −0.341 | 2.580 | 3.004 | −0.308 | 2.252 | 2.774 | −0.281 | 1.944 |
| 90 | 3.147 | −0.048 | 2.506 | 2.856 | −0.074 | 2.178 | 2.613 | −0.111 | 1.870 |
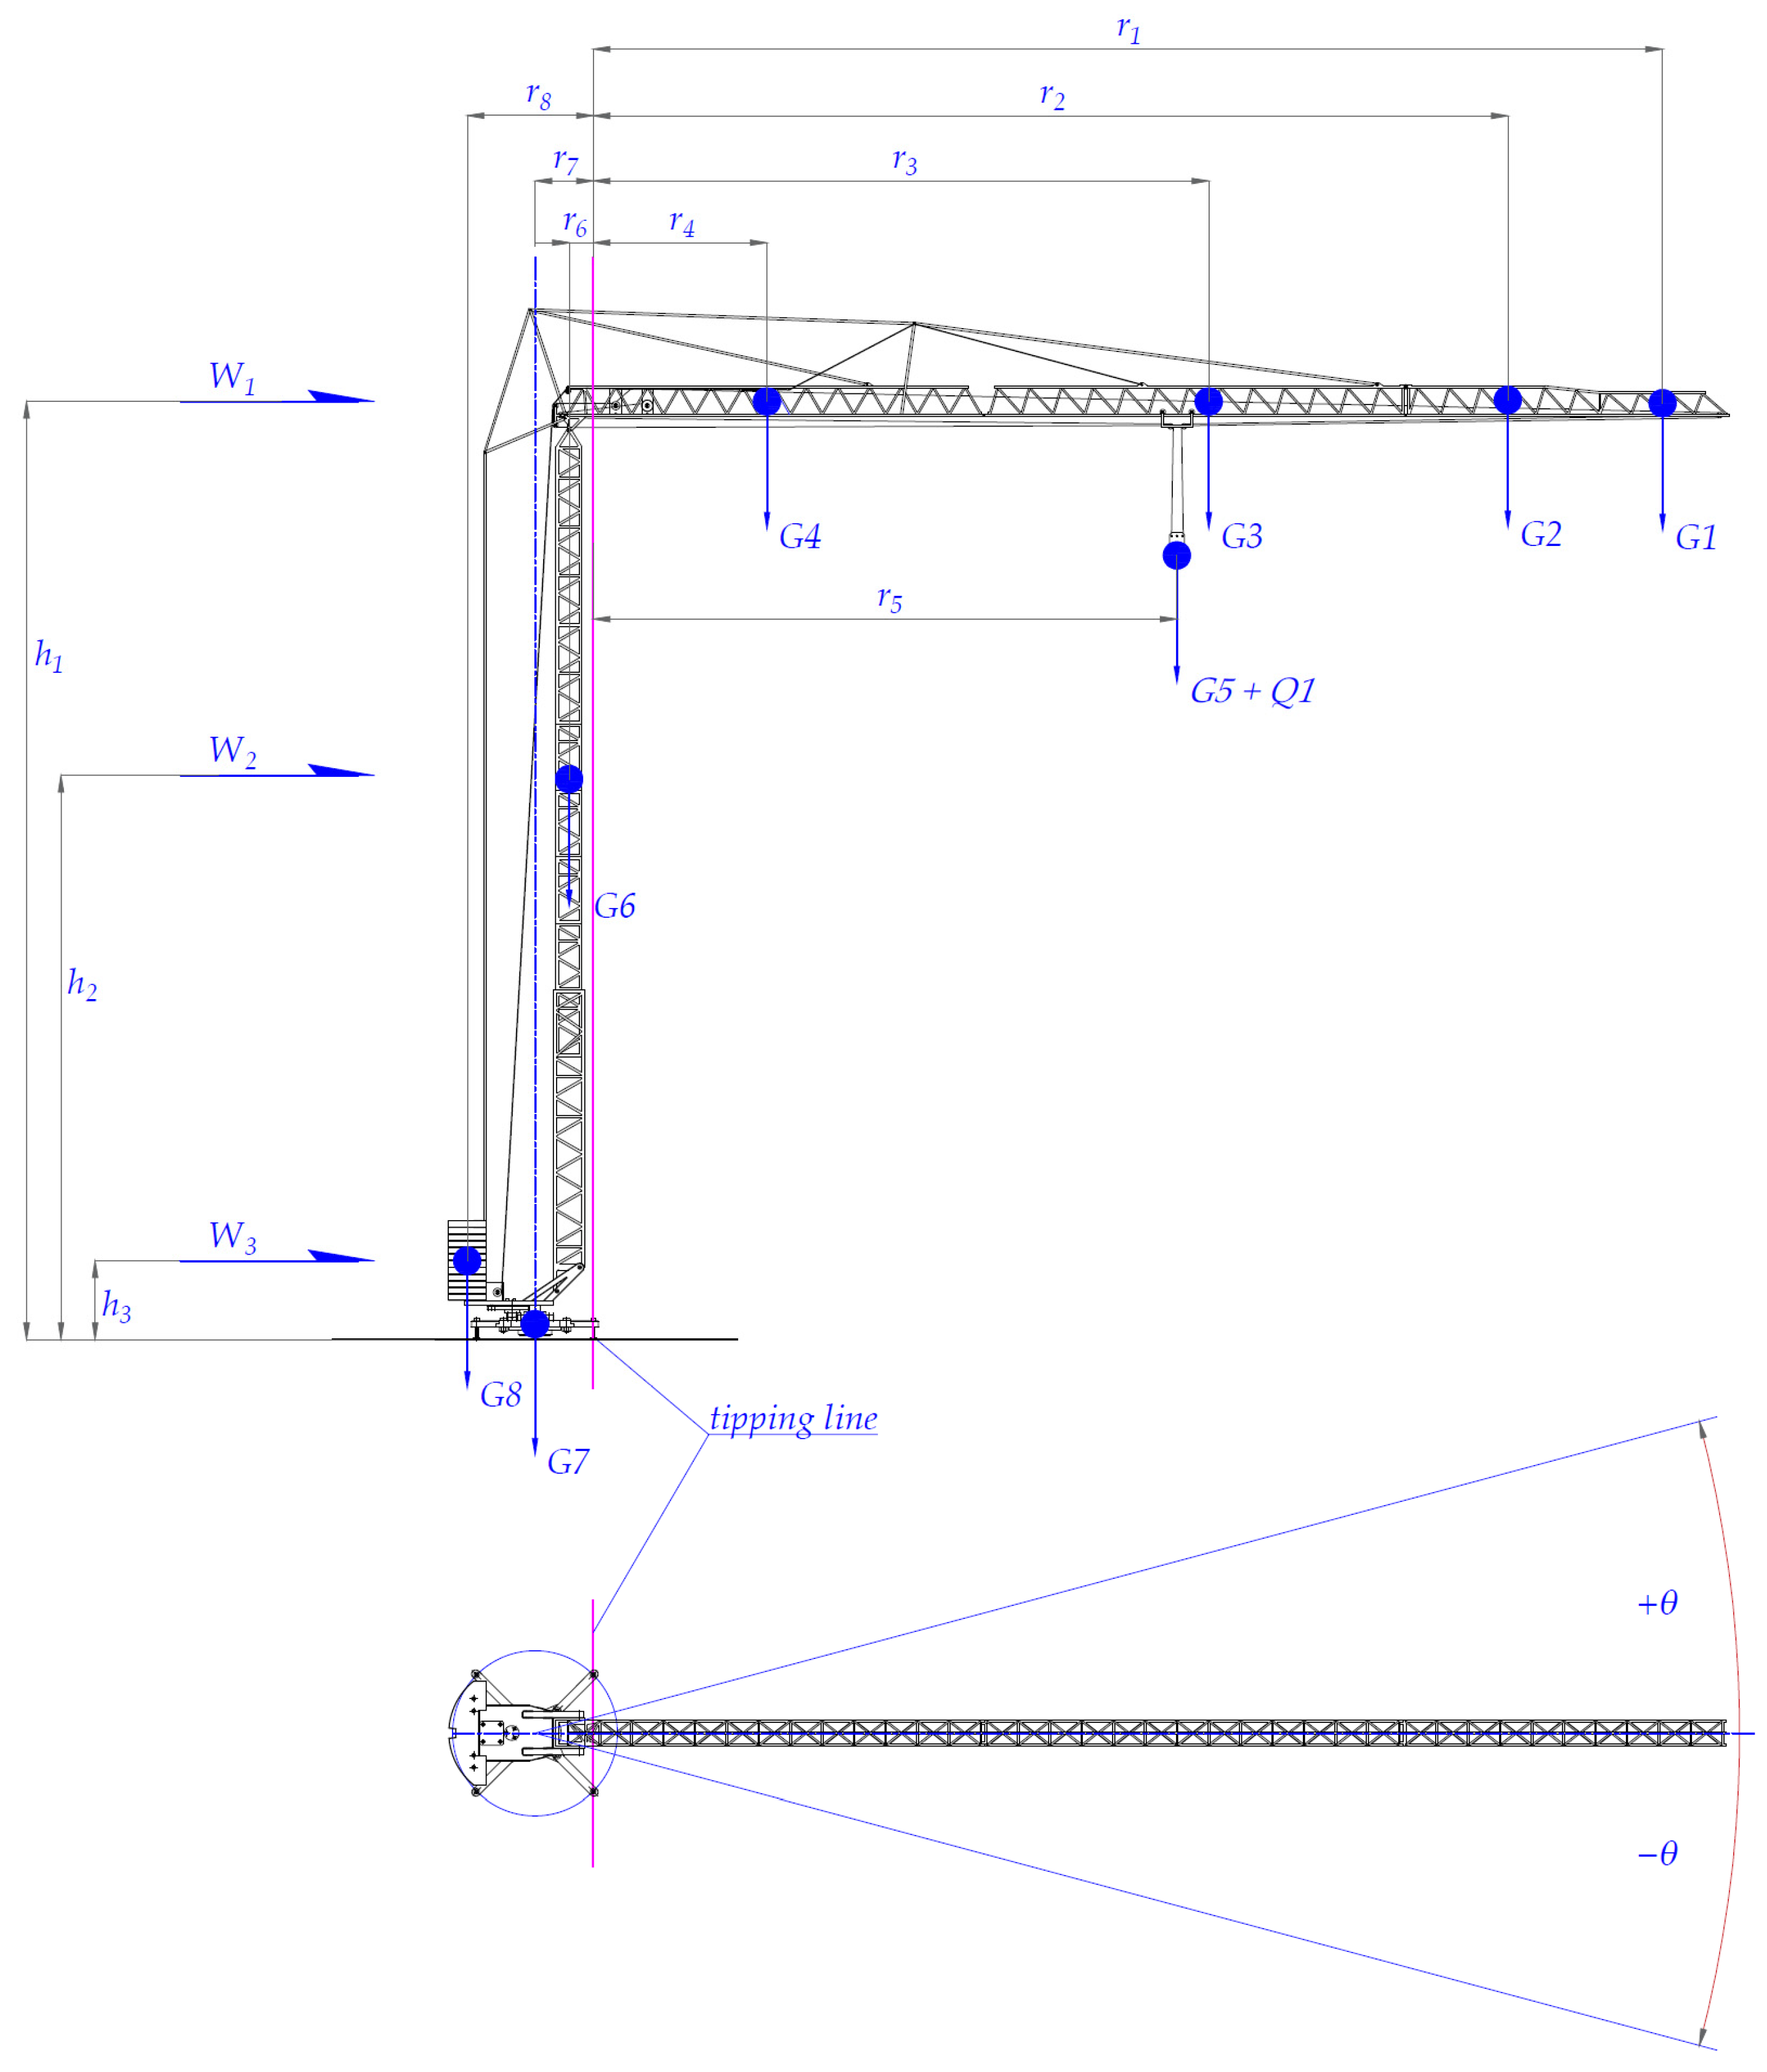
| Overturning Moments from Crane Weights Only ΣMO = 1228.90 kNm | Stability Moments from Crane Weights Only ΣMS = 1380.85 kNm | ||||||||
|---|---|---|---|---|---|---|---|---|---|
| Jib | Max Load | Tower | Support Base of Tower | Counterweight | |||||
| load | |||||||||
| G1 | G2 | G3 | G4 | G5 | Q1 | G6 | G7 | G8 | |
| 130 | 330 | 1440 | 1440 | 200 | 3050 | kg | 7600 | 7660 | 26,000 |
| 1275 | 3237 | 14,126 | 14,126 | 1962 | 29,921 | N | 74,556 | 75,145 | 255,060 |
| distance from the tipping line | |||||||||
| r1 | r2 | r3 | r4 | r5 | rQ5 | r6 | r7 | r8 | |
| 39 | 33 | 22 | 6 | 21 | 21 | m | 0.87 | 2.10 | 4.54 |
| moments | |||||||||
| M1 | M2 | M3 | M4 | M5 | MQ5 | M6 | M7 | M8 | |
| 49.17 | 106.75 | 313.54 | 88.52 | 41.29 | 629.63 | kNm | 64.67 | 157.80 | 1158.38 |
| i | v(i) [m/s] | h(i) [m] | Aref [m2] | J Jib/ T Tower | WCx0(i) | MWCx0(hi) | WCx90(i) | MWCx90(hi) |
|---|---|---|---|---|---|---|---|---|
| 9 | 9.77 | 33.81 | 8.08 | J | 0 | 0 | 907.01 | 30,664.68 |
| ΣMWJ | 0 | ΣMWJ | 30,664.68 | |||||
| - | CxT90 = 1.92 | |||||||
| 8 | 9.42 | 30.85 | 10.20 | T | 1579.08 | 48,717.11 | 1534.82 | 47,351.64 |
| 7 | 8.92 | 26.93 | T | 1416.42 | 38,146.37 | 1376.72 | 37,077.18 | |
| 6 | 8.37 | 23.01 | T | 1248.94 | 28,739.89 | 1213.93 | 27,934.35 | |
| 5 | 7.77 | 19.09 | T | 1075.61 | 20,535.08 | 1045.47 | 19,959.51 | |
| 4 | 7.09 | 15.18 | T | 895.25 | 13,587.66 | 870.16 | 13,206.82 | |
| 3 | 6.29 | 11.25 | T | 704.62 | 7927.99 | 684.87 | 7705.78 | |
| 2 | 5.30 | 7.33 | T | 500.19 | 3667.17 | 486.17 | 3564.39 | |
| 1 | 3.90 | 3.41 | T | 271.23 | 925.31 | 263.63 | 899.37 | |
| vref* | 7.13 | ΣMWT | 162,246.57 | ΣMWT | 157,699.04 | |||
| CxT0 = 2.85 | CxT90 = 2.77 |
| i | v(i) [m/s] | h(i) [m] | Aref [m2] | J Jib/ T Tower | WCx0(i) | MWCx0(hi) | WCx90(i) | MWCx90(hi) |
|---|---|---|---|---|---|---|---|---|
| 9 | 9.77 | 33.81 | 8.08 | J | 0 | 0 | 628.32 | 21,242.64 |
| ΣMWJ | 0 | ΣMWJ | 21,242.64 | |||||
| - | CxT90 = 1.31 | |||||||
| 8 | 9.42 | 30.85 | 10.20 | T | 1141.37 | 35,212.87 | 1169.12 | 36,069.18 |
| 7 | 8.92 | 26.93 | T | 1023.79 | 27,572.30 | 1048.69 | 28,242.81 | |
| 6 | 8.37 | 23.01 | T | 902.73 | 20,773.27 | 924.69 | 21,278.44 | |
| 5 | 7.77 | 19.09 | T | 777.46 | 14,842.81 | 796.36 | 15,203.76 | |
| 4 | 7.09 | 15.18 | T | 647.09 | 9821.20 | 662.83 | 10,060.03 | |
| 3 | 6.29 | 11.25 | T | 509.30 | 5730.37 | 521.68 | 5869.72 | |
| 2 | 5.30 | 7.33 | T | 361.54 | 2650.64 | 370.33 | 2715.10 | |
| 1 | 3.90 | 3.41 | T | 196.05 | 668.81 | 200.81 | 685.08 | |
| vref* | 7.13 | ΣMWT | 117,272.28 | ΣMWT | 120,124.12 | |||
| CxT0 = 2.06 | CxT90 = 2.11 |
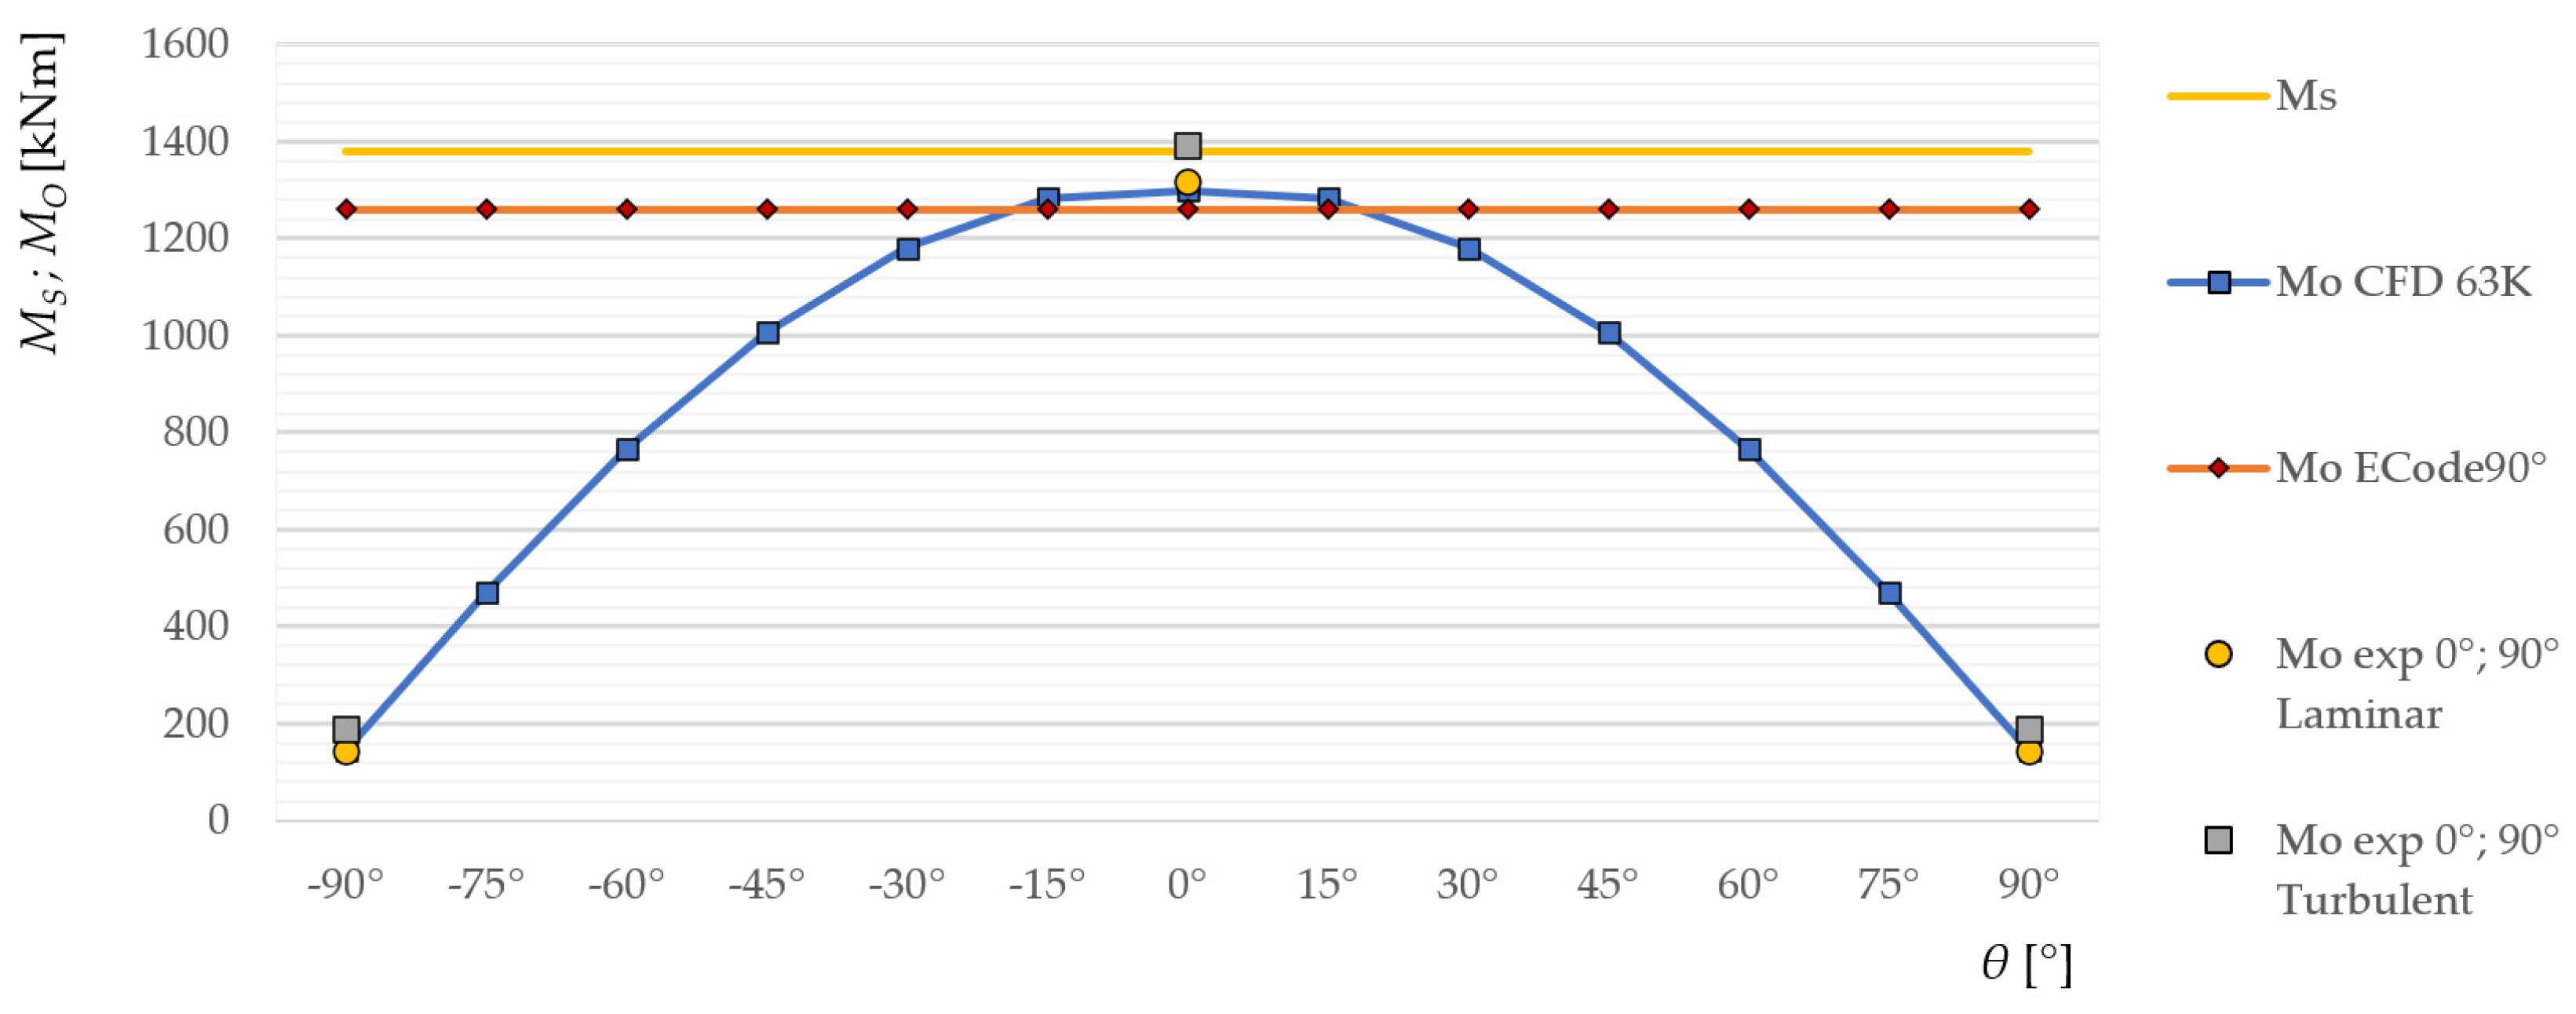
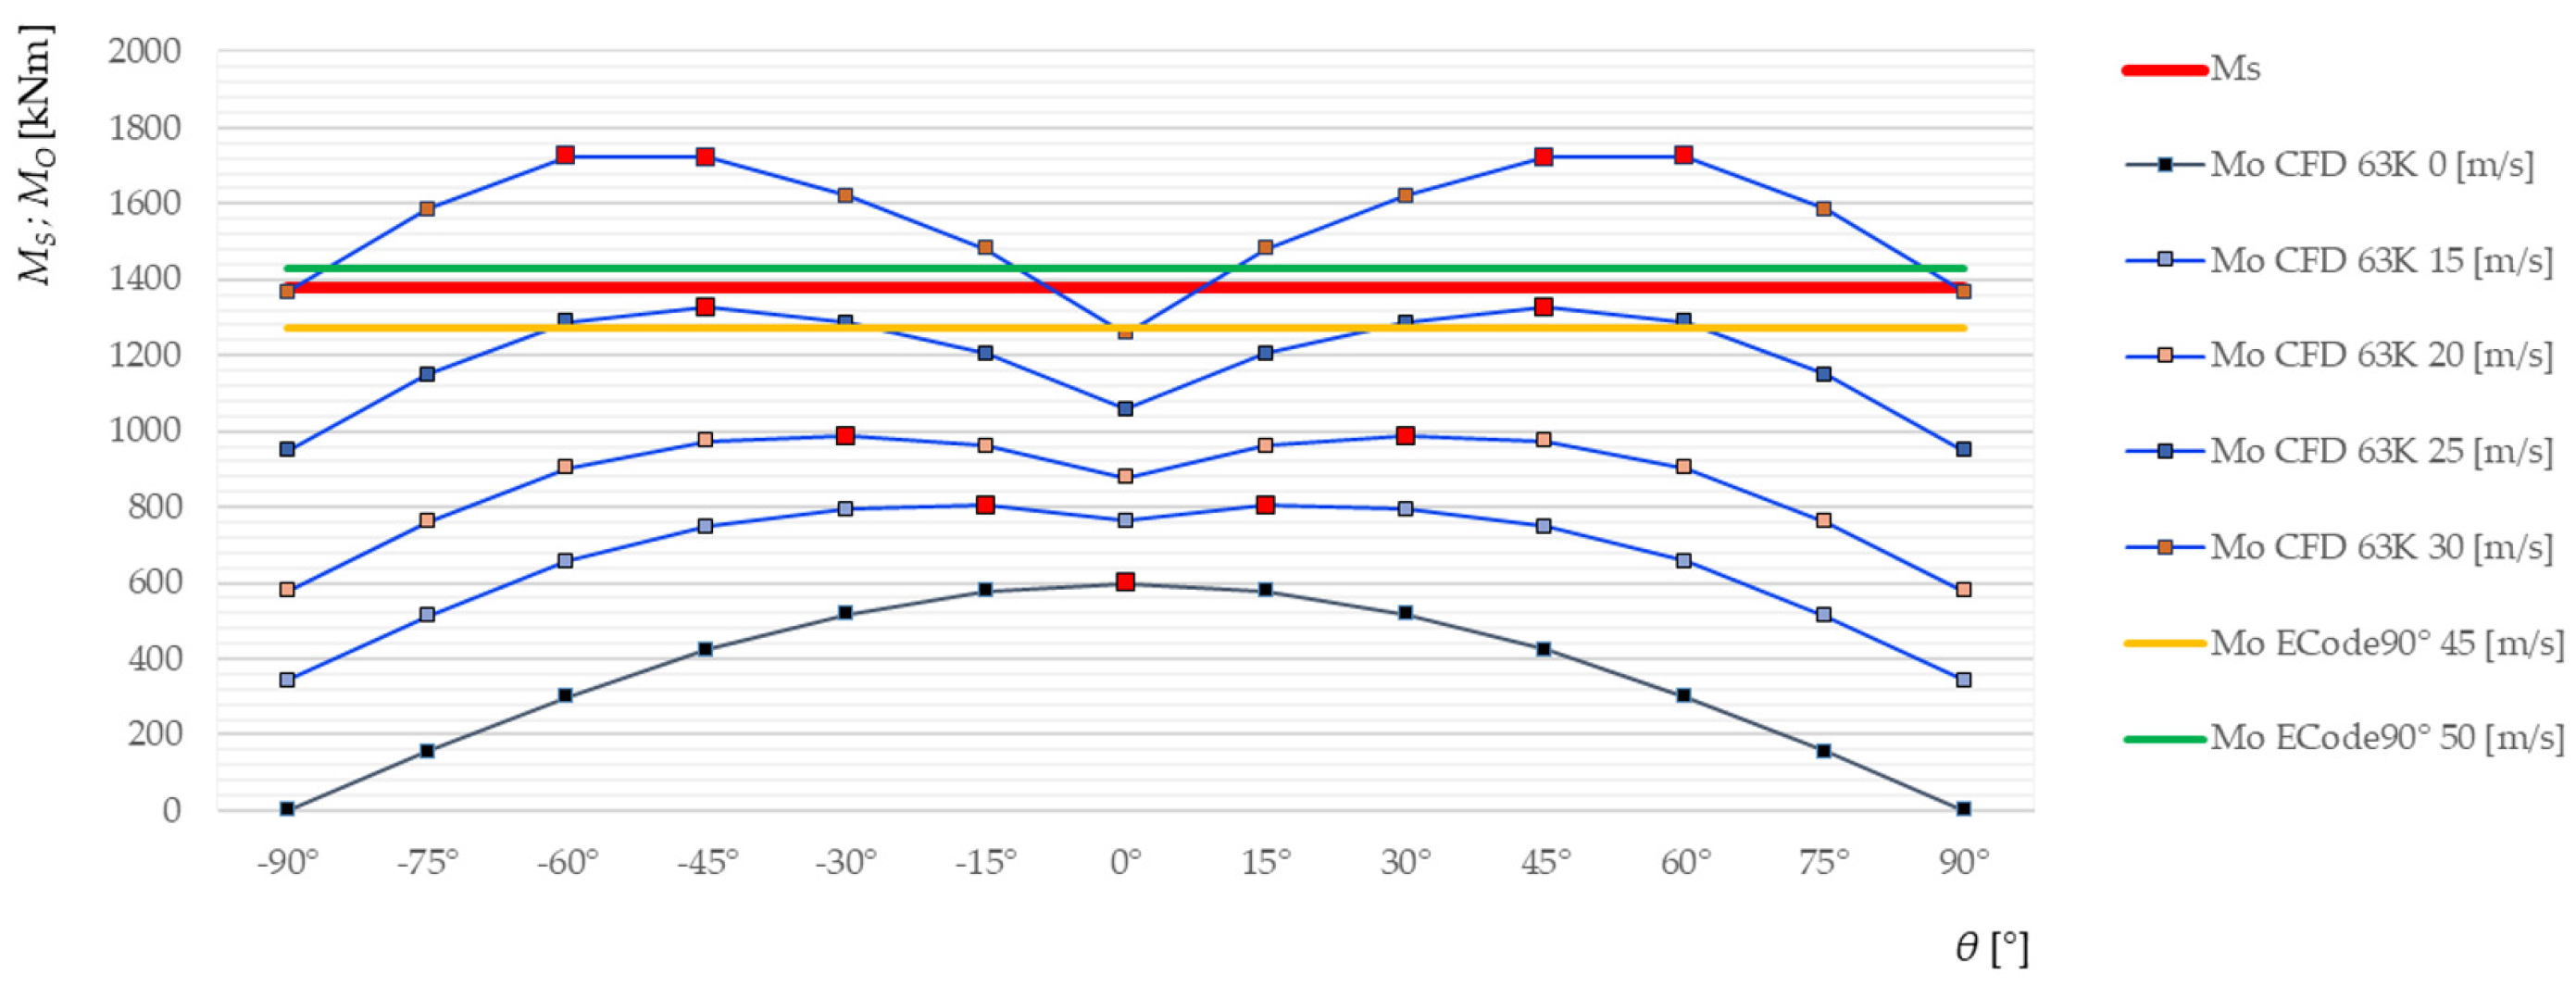
| v [m/s] | With Max Load on jib [kNm] | v [m/s] | Without Max Load on jib [kNm] | ||
|---|---|---|---|---|---|
| h1 = 33.8 m | MO ECode 90° | MO CFD 63K +/−15° | h1 = 33.8 m | MO ECode 90° | MO CFD 63K +/−45° |
| 14.88 | - | 1380.67 | 28.28 | - | 1380.81 |
| 23.39 | 1380.67 | - | 48.57 | 1380.52 | - |
Disclaimer/Publisher’s Note: The statements, opinions and data contained in all publications are solely those of the individual author(s) and contributor(s) and not of MDPI and/or the editor(s). MDPI and/or the editor(s) disclaim responsibility for any injury to people or property resulting from any ideas, methods, instructions or products referred to in the content. |
© 2024 by the authors. Licensee MDPI, Basel, Switzerland. This article is an open access article distributed under the terms and conditions of the Creative Commons Attribution (CC BY) license (https://creativecommons.org/licenses/by/4.0/).
Share and Cite
Augustyn, M.; Barski, M. Numerical and Analytical Estimation of the Wind Speed Causing Overturning of the Fast-Erecting Crane—Part II. Appl. Sci. 2024, 14, 4694. https://doi.org/10.3390/app14114694
Augustyn M, Barski M. Numerical and Analytical Estimation of the Wind Speed Causing Overturning of the Fast-Erecting Crane—Part II. Applied Sciences. 2024; 14(11):4694. https://doi.org/10.3390/app14114694
Chicago/Turabian StyleAugustyn, Marcin, and Marek Barski. 2024. "Numerical and Analytical Estimation of the Wind Speed Causing Overturning of the Fast-Erecting Crane—Part II" Applied Sciences 14, no. 11: 4694. https://doi.org/10.3390/app14114694