Abstract
The prefabricated recyclable supporting structure (PRSS) is an innovative support system that integrates a steel skeleton with polymer waterproof technology. Earth berms are extensively adopted to support the PRSS, but there is limited understanding on the factors influencing their behavior in circular excavations. In this paper, a numerical model is first validated with a case history in Henan, China. Afterwards, the geometric parameters of the earth berms, including the height (H), the top width (B1), and the bottom width (B2), on the behavior of the PRSS, are investigated. It is shown that, by increasing the height, top width and bottom width of earth berms, the lateral deflections, and bending moments of supporting piles, as well as the ground surface settlements, tend to decrease. However, the reduction effect of these parameters diminishes as well. Moreover, the raised effective formation level considering the effect of the earth berms on stability and deformation analyses is discussed. The factor of the safety of the excavation is almost doubled when axisymmetric conditions are considered compared to plane strain conditions. In deformation analysis, the raised effective formation level increases with the height of the earth berms until a steady value is reached.
1. Introduction
Recently, to meet the demands of food security and urban development, the underground grain silos have received more and more attention due to their advantages of low energy consumption and safety compared to the traditional aboveground grain silos [1,2,3,4]. Therefore, the PRSS is proposed for the excavations of the underground grain silos, which consists of supporting piles, walings, steel plates, and flexible waterproof polymers, and is characterized by high construction efficiency and reusability [5,6,7]. The underground grain silo is generally designed to have a cylindrical body and conical bottom for the purposes of convenience of grain transportation and excellent load bearing capacity [8,9,10], which is different from other underground structures [11,12,13]. As a result, it is common to find the PRSS being supported by earth berms in the circular excavations for the underground grain silos.
Utilizing earth berms is a cost-effective and efficient method of stabilizing embedded retaining walls and minimizing their displacement [14,15,16,17]. Studies by Daly and Powrie [18,19] have showed that enlarging the size of the berm had a more significant impact on improving short-term wall stability compared to deepening the embedment of a wall supported by a smaller berm. For a wall with specific embedment in particular soil conditions, the extent of support provided by a berm is related to the bench width, the slope, and the height [20,21,22]. The maximum slope is determined by the soil and groundwater conditions, whereas the height and bench width are constrained by factors such as space availability, accessibility, and the characteristics of the underground structure. Current research on earth berms has mainly been conducted under plane strain conditions, assuming that the earth berms were uniform along the perimeter of the retaining wall. The stability and deformations of retaining walls have been investigated using the 2D finite element method to examine the effects of changes in berm geometry and soil properties [23,24,25,26,27,28,29]. In terms of theoretical studies, earth berms are considered in limit equilibrium analyses in the following ways: as an equivalent surcharge [30,31,32], by means of raised effective formation level in drained [33] or undrained [29,34] conditions, and by performing a single [35,36] or multiple [18] Coulomb wedge analysis. However, Powrie and Daly’s [19] plane stain centrifuge model tests showed that these approaches were to some extent conservative. The main reason is the berm’s lateral resistance being either disregarded or dealt with empirically and/or incorrectly [33]. Another reason is that these methods only considered plane strain conditions, assuming that the berm remained intact along the entire length of the wall during the period of excavation or installation.
Notably, in many practical excavations stabilized with earth berms, the assumption of plane strain may not accurately represent field conditions. For instance, it is often necessary to remove berms in sections to install permanent support systems, such as in the case of road cuttings or formation level props. In such cases, the berms are discontinuous along the longitudinal length of the wall, requiring a comprehensive consideration of the three-dimensional (3D) effects [37,38]. Moreover, owing to the soil arching effect that causes the soil to be compressed in the tangential direction [39,40], earth berms placed in a circular excavation are more appropriately analyzed as an axisymmetric problem rather than plane strain [41]. Furthermore, discontinuous supporting structures (e.g., row piles wall and the PRSS) are usually simplified to continuous supporting structures and analyzed by equivalence, but such a simplification is insufficient for understanding the actual behavior of the supporting structures, especially in the case of berms. However, there is a lack of information about the effect of earth berms on the behavior of a circular excavation supported by a PRSS under axisymmetric condition.
This paper presents the results of 3D numerical models of a circular excavation supported by a PRSS for an underground grain silo. These models have been validated with field data, which aim to demonstrate the effect of earth berms on the behavior of the PRSS and the surrounding soil considering axisymmetric conditions. The impact of the geometric parameters of earth berms, such as height, top width and bottom width, on the performance of the PRSS is investigated. In addition, the raised effective formation level used to take into account the effect of the earth berms in stability and deformation analyses is also discussed.
2. Case Description
2.1. PRSS-Supported Excavation
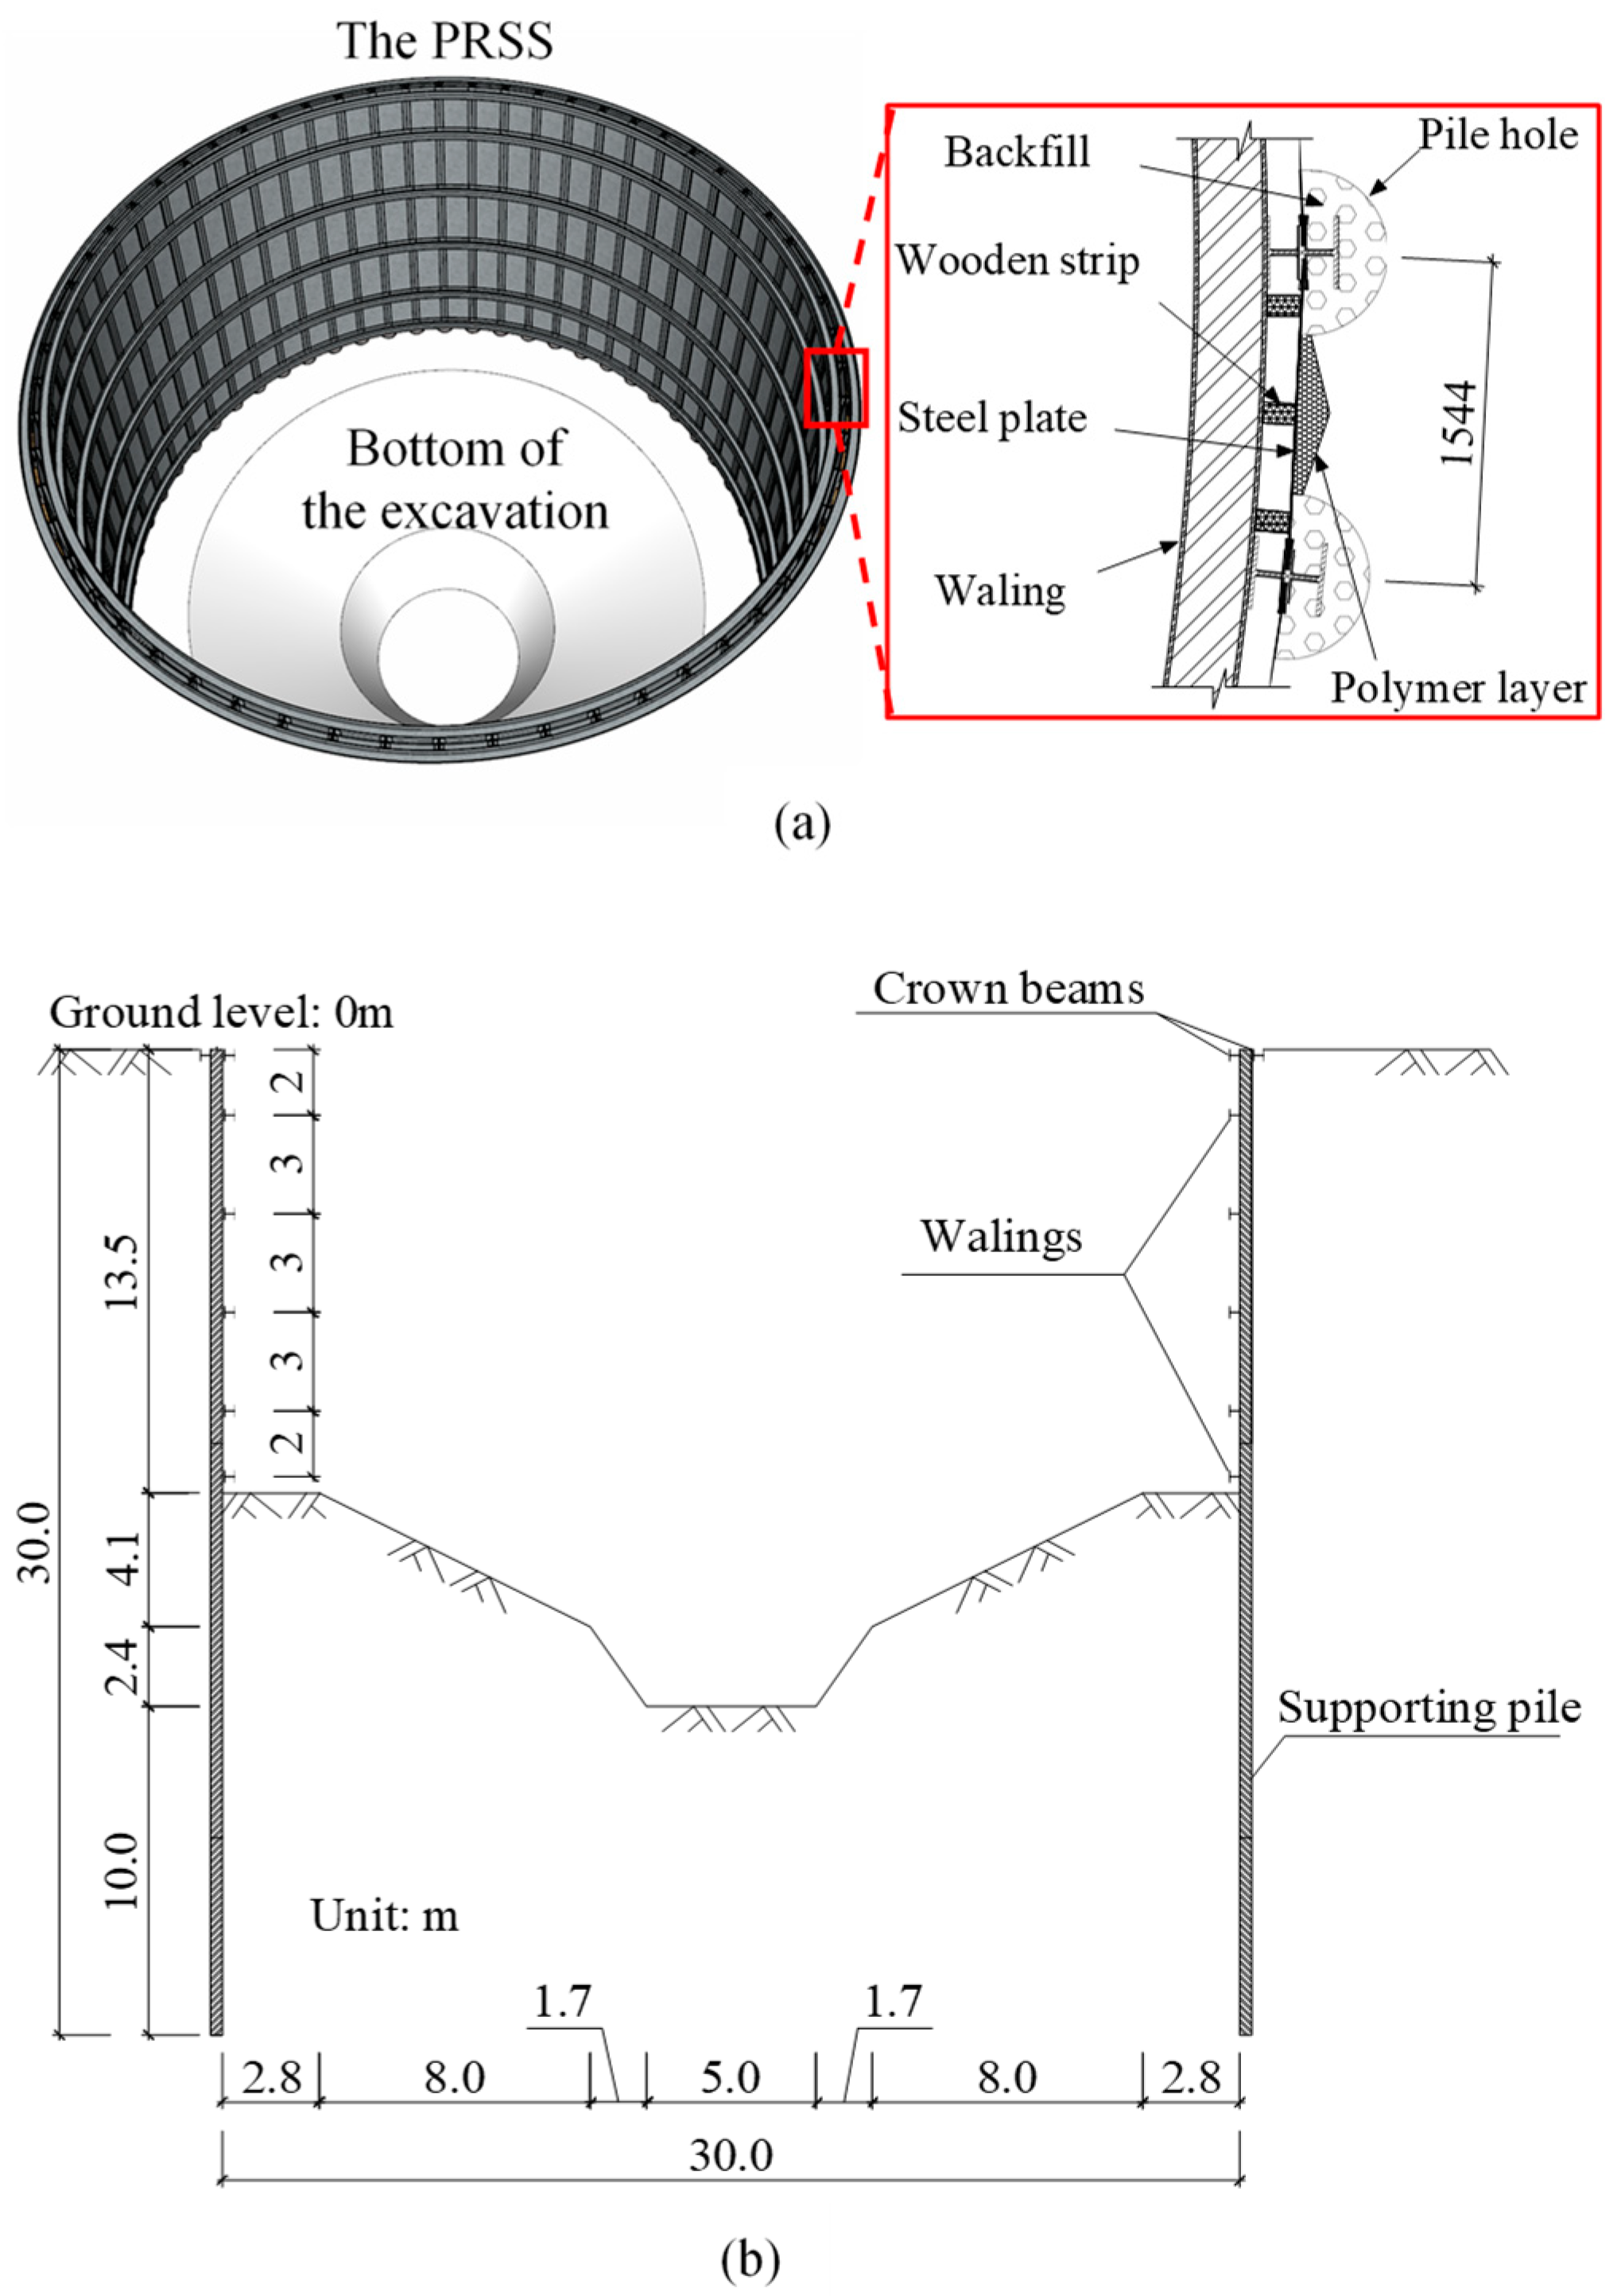
This study refers to an underground grain silo excavation project, located in Pingyu County, Zhumadian, China. As shown in Figure 1, the excavation for the underground grain silo is a cylinder with a diameter of 30 m, a basin-shaped bottom and a maximum excavation depth of 20 m. The excavation is supported by the PRSS, which comprises the supporting piles, steel plates, walings, and complementary polymer layers behind the steel plates. The supporting piles are assembled using L250 × 250 and HW350 × 350 profile steels. The distance between two adjacent supporting piles is 1544 mm. The crown beams and walings are also made of HW350 × 350. The thickness, width, and length of the steel plates are 8 mm, 1400 mm, and 15,000 mm, respectively. By grouting expansive polyurethane behind the steel plates, the void space is filled and the soil is reinforced. Wooden strips are inserted between the walings and the steel plates to prevent the plates from deforming into the excavation due to the earth pressure. Six levels of walings are used in this excavation.
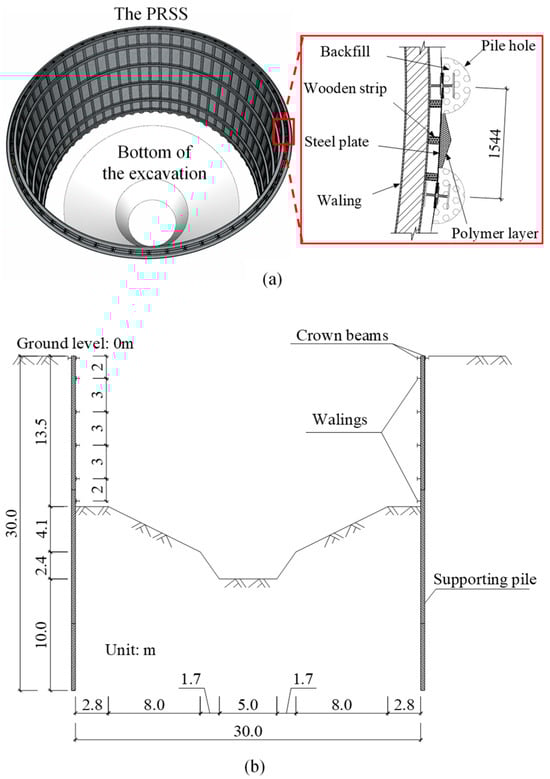
Figure 1.
Schematic diagram of the PRSS: (a) aerial view; (b) cross section view.
2.2. Geological Conditions
Field investigation and laboratory tests were conducted to determine the principal geotechnical properties of the soil layers, as presented in Figure 2. At the project site, there are seven soil layers located above a depth of 50 m. The effective shear strength indexes (c′, φ′) were obtained through the use of direct shear tests. One-dimensional consolidation compression tests were carried out to measure the compressive modulus of these soil layers, which range from 7.76 to 9.79 MPa. The compressive modulus varies with depth and is almost identical to the SPT numbers. The groundwater table is 4.5 m below the surface.
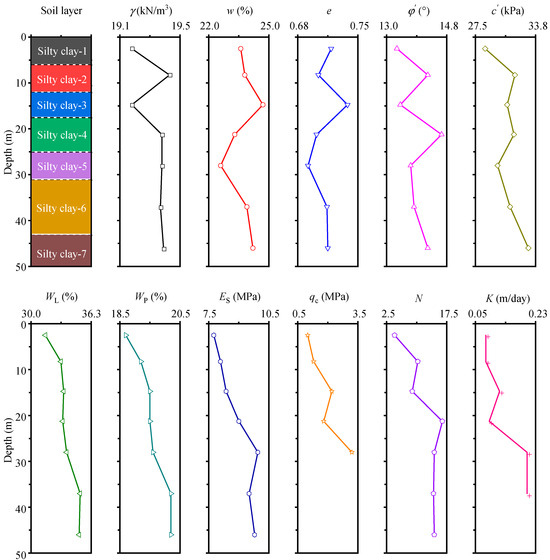
Figure 2.
Typical soil profile and geotechnical properties. Note: γ represents unit weight, w represents water content, e represents the void ratio, φ′ represents effective internal friction angle, c′ represents effective cohesion, WP represents plasticity limit, WL represents liquidity limit, Es represents compression modulus, qc represents cone resistance in CPT, N represents the blow count of SPT, and Κ represents permeability coefficient.
2.3. Construction Processes
Figure 3 presents the construction processes of the PRSS. Firstly, the supporting piles, the walings and the steel plates are manufactured in the factory in a standardized manner (Figure 3a). After boring holes at their designed locations (Figure 3b), the supporting piles are lifted into the boreholes, which are backfilled with sand (Figure 3c). When all the supporting piles are installed, the crown beams are subsequently assembled to connect all the supporting piles into an integral structure. Then, a slot is cut between two supporting piles, and the steel plates are inserted into the soil along the slot (Figure 3d). Thus, a supporting structure is formed by the supporting piles, crown beams and steel plates. Then, the excavation can be carried out (Figure 3e). However, before the earth excavation, the underground water level is lowered to 2 m below the excavation depth using the dewatering wells outside the excavation. After the soil is excavated to the designed elevation, the walings are installed to connect the supporting piles, followed by the insertion of wooden strips between the walings and the steel plates (Figure 3f). Next, expanded polyurethane is grouted behind the steel plates (Figure 3g). The above steps are repeated (i.e., dewatering, excavation, installing walings, and grouting) until the excavation reaches the final designed elevation of the UGS base.
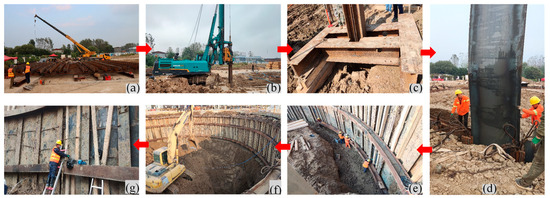
Figure 3.
Construction processes of PRSS: (a) fabrication of the supporting piles; (b) bore holes for the supporting piles; (c) installation of supporting piles, and backfilling of pile holes; (d) installation of steel plates; (e) excavation of soil layers; (f) installation of walings; (g) grouting polymer behind the steel plates.
3. Numerical Modeling and Validation
3.1. Finite-Element Model and Boundary Conditions
To simulate the circular excavation supported by the PRSS, the finite element software Plaxis 3D version 2023.1 was adopted. In the simulation, the soil and piles were represented using 10-noded tetrahedral volume elements. The steel plates were modeled using six-noded triangular plate elements, while the crown beams and walings were modeled using beam elements. In the model, the lateral displacement along the vertical boundaries was constrained (roller support), whereas both the lateral and vertical displacements were constrained at the bottom boundary (pin support). The vertical model boundaries of the YZ-plane and XZ-plane corresponded to the plane of symmetry along the centerline of the excavation. As presented in Figure 4, only one-quarter of the excavation geometry was modeled, taking advantage of the symmetry to perform analysis more efficiently without compromising accuracy. To minimize the boundary effects, the dimensions of the model were selected as 75 m in length, 75 m in width, and 60 m in height. The soil mesh surrounding the PRSS was refined near the excavation and coarsened further away, based on a sensitivity study that determined an optimized mesh size with negligible differences in computed results after further refinement.
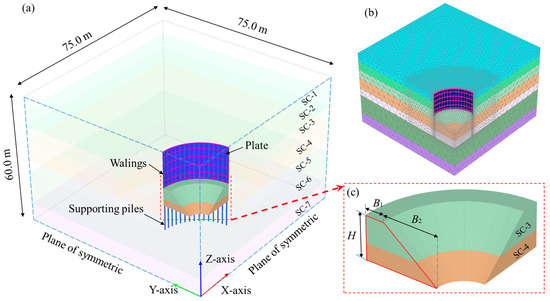
Figure 4.
Finite element model of the excavation: (a) geometry; (b) mesh and (c) earth berm.
3.2. Soil Constitutive Model, Model Parameters, and Modeling Procedure
Many researchers have emphasized the significance of accounting for the small strain behavior of soil in geotechnical engineering problems [42,43,44,45]. Neglecting the small strain stiffness of the soil may lead to overestimations of the deformation of retaining walls and ground surface settlement. The hardening soil with the small strain model (HSS), initially formulated by Schanz [46,47] and further developed by Benz [48] to consider small strains, incorporates Mohr–Coulomb failure criterion, is one of the most advanced constitutive models for soils, and has been widely applied to deep excavations [49,50,51]. Hence, the HSS model was used to simulate the small strain behavior of the soil layers. Table 1 summarizes the soil parameters of the HSS model. The relationship of the stiffness parameters () is used in this paper [52,53,54]. The shear modulus at very small strains () is estimated using the relationship proposed by Hardin and Black [55] (Equation (1)), while the threshold shear strain () is determined using the formula presented by Benz [48] (Equation (2)).

Table 1.
Soil parameters for the HSS model.
In the simulation, the supporting piles, steel plates, and walings were assumed to have linear elastic behaviour. Detailed information on their characteristics and parameters is given in Table 2. The supporting piles assembled by HW350 and L125 are simplified as solid piles with a cross-section of a 350 × 350 square considering the equivalent of bending stiffness (EI).
Table 2.
Characteristics of the structural elements.
In addition, zero-thickness interface elements were generated to replicate the interaction between the structure and the soil, which followed the Mohr–Coulomb criterion. The strength reduction factor (Rinter) was set to be 0.65 according to the coefficient of skin friction between soil and steel proposed by Potyondy [56].
Based on the construction process, 13 simulation steps were established and aligned with the actual construction sequences, as listed in Table 3. Dewatering was carried out synchronized with the excavation process. The analysis was conducted assuming drained conditions on the basis that the permeability of soil layers was high (ranging from 0.08 to 0.15 m/day, referring Figure 2) [57]. In the last stage, i.e., excavation to the final depth, the safety analysis was carried out. In Plaxis, the safety analysis is performed using the phi/c reduction method. Due to this (‘artificial’) strength reduction, out-of-balance forces will be introduced into the model. This out-of-balance will be solved by the calculation kernel, which will result in deformations. These additional displacements that are generated do not have a physical meaning, but the incremental displacements in the final step (once a stable solution for the total multiplier is reached) give an indication of the likely failure mechanism [58].
Table 3.
Numerical simulation process related to construction workflow.
3.3. Validation
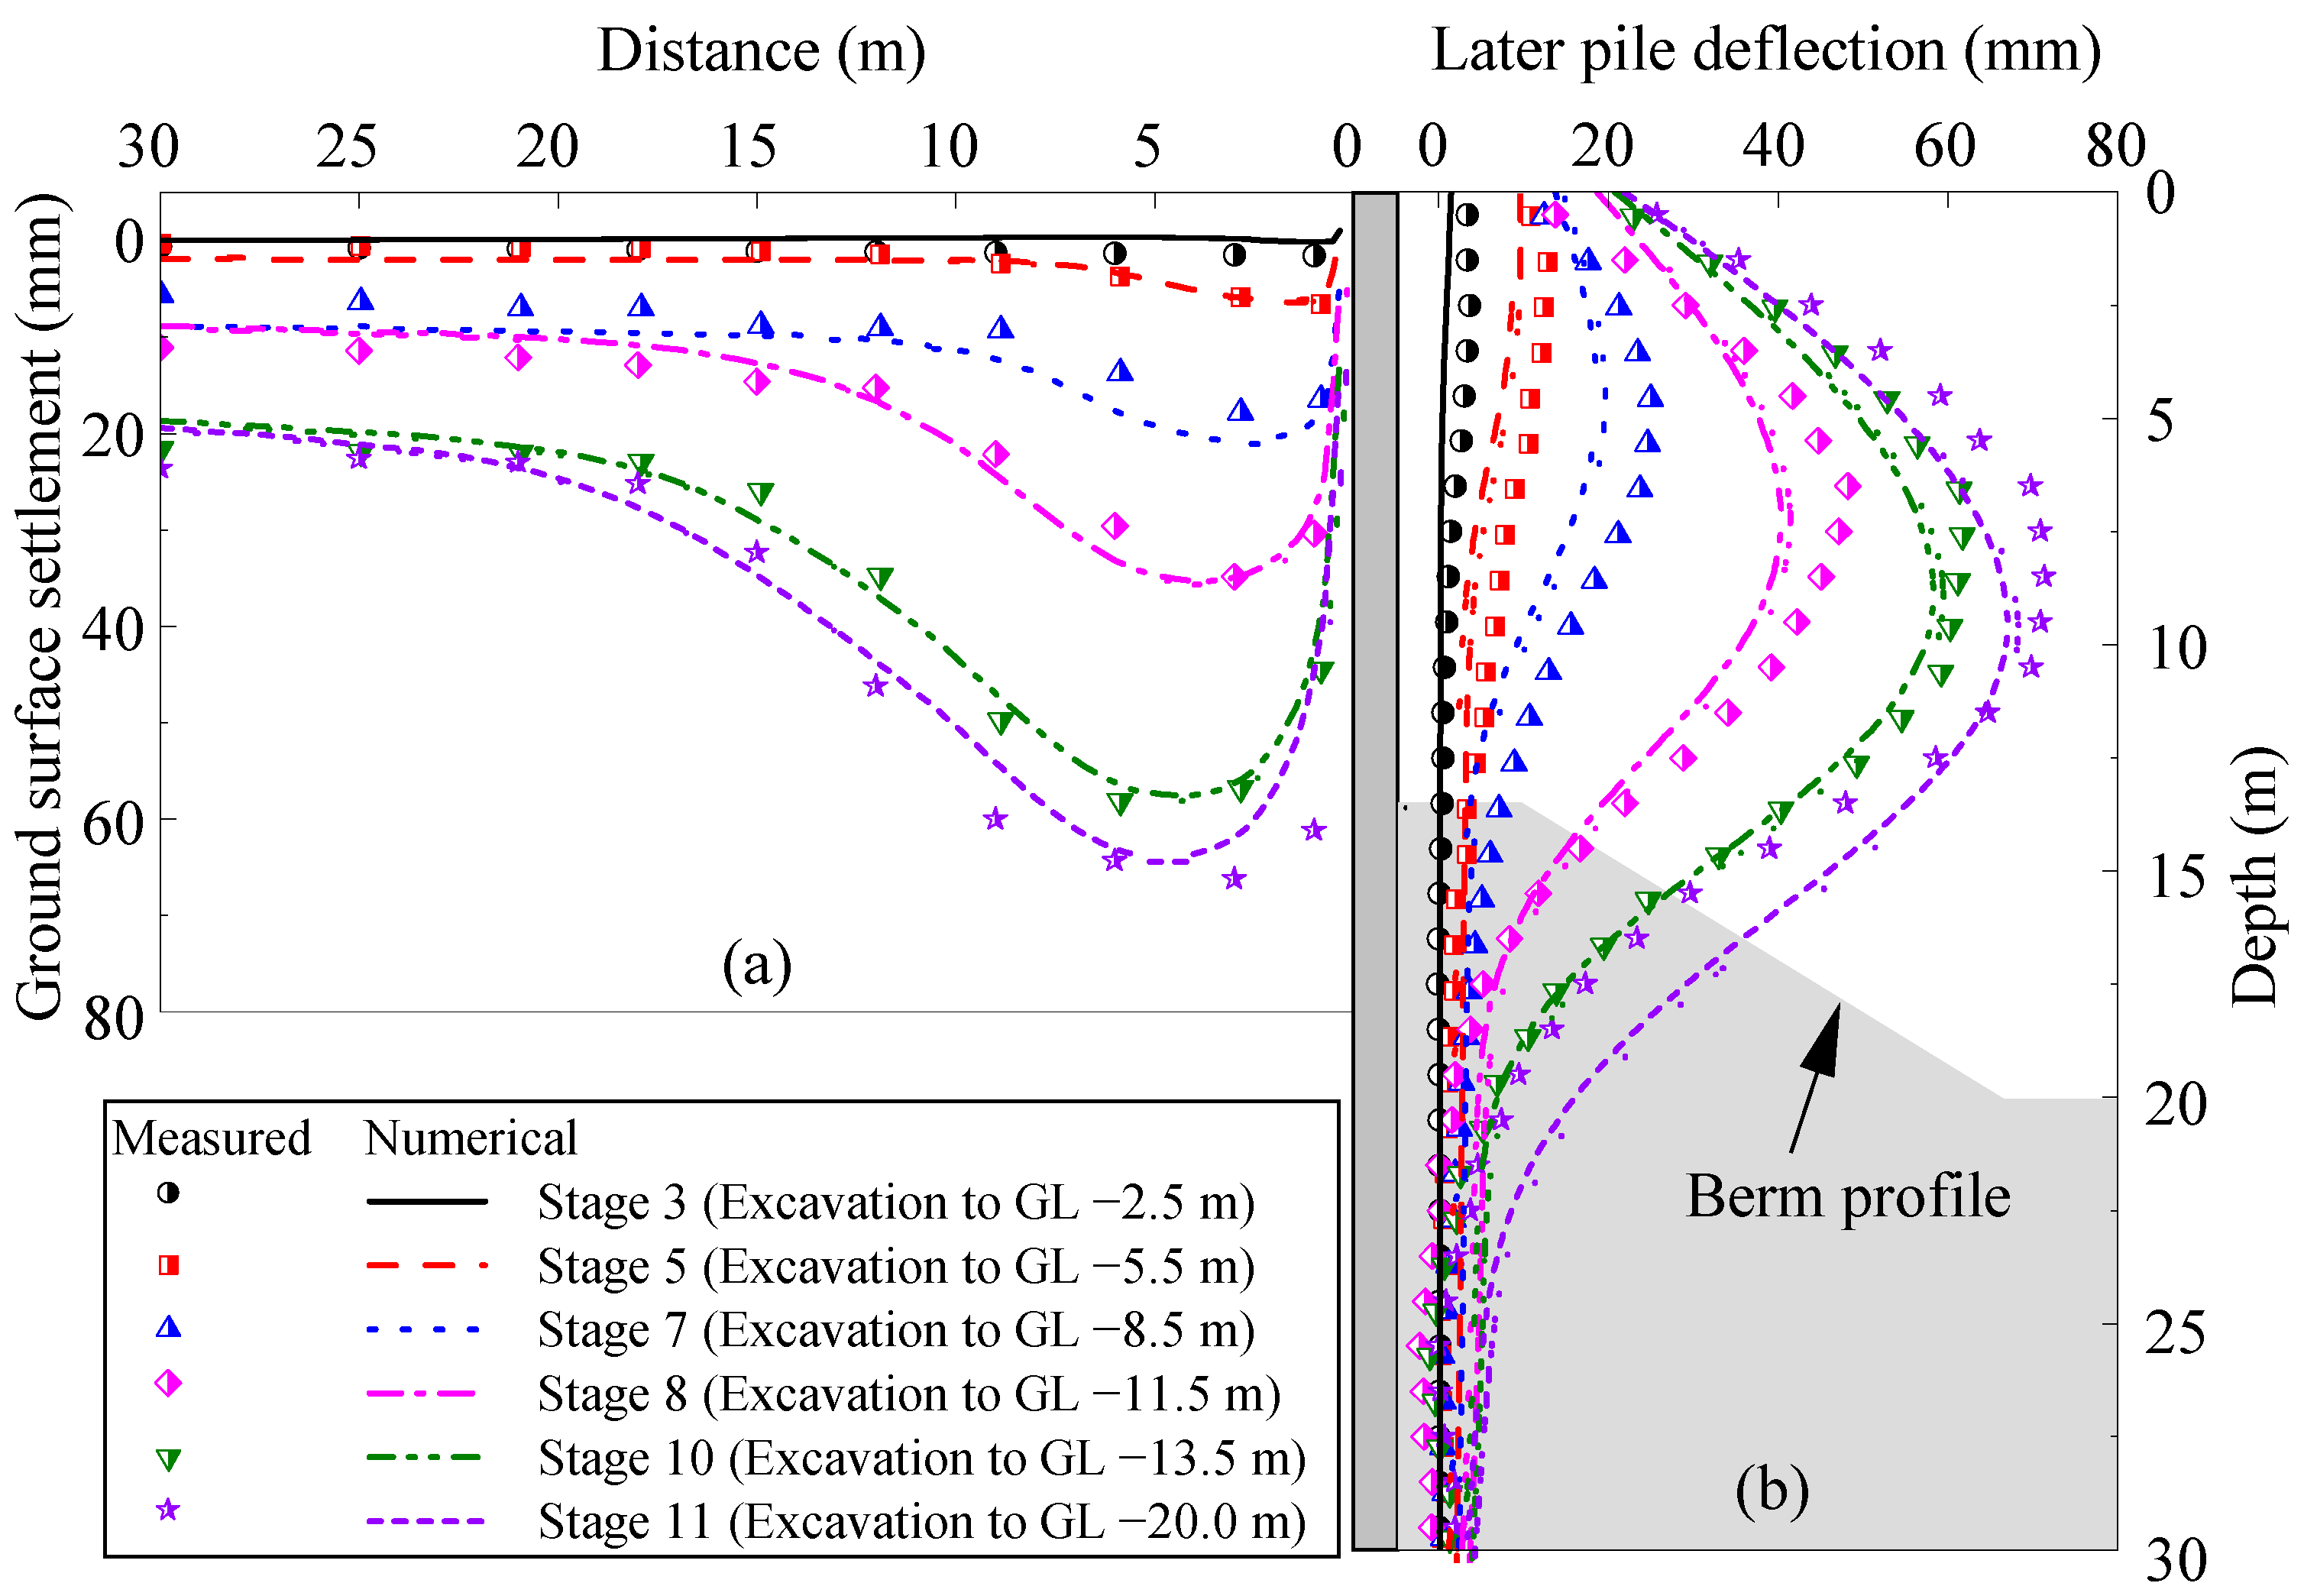
In order to assess the reliability of 3D finite element models in predicting the response of the PRSS, a comparison and discussion of the results from numerical simulations and field measurements are conducted. The numerical analysis, as shown in Figure 5, demonstrates a reasonable agreement with the field data in terms of capturing the lateral pile deflections and ground surface settlements. However, there are some discrepancies. For example, in all but the last stage, the difference in lateral pile deflections between the calculated and measured values is larger above the excavation level than below it. The observed discrepancies can be attributed to the inherent limitations of the finite element method in geotechnical problems (e.g., inevitable simplifications of the actual behavior of soils and their interaction with structures under complex field conditions), without a more sophisticated simulation of the entire construction process (e.g., neglecting the PRSS installation process before excavation, and the segmental assembly process of the walings). Nevertheless, it can generally be stated that the finite element model furnishes a reasonable refection of the observed behavior of an excavation supported by the PRSS. Consequently, it is feasible to perform a subsequent parametric analysis using this model to investigate the effect of the earth berms on the PRSS.
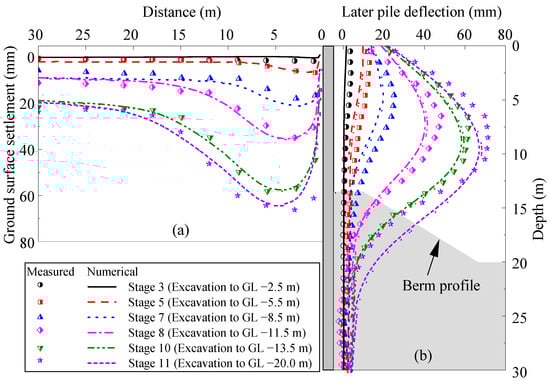
Figure 5.
Comparison between the numerical results and the measured results: (a) ground surface settlement; (b) lateral pile deflection of supporting pile.
Parametric analyses are carried out to analyze the impact of various geometric parameters of the earth berm on the behavior of the PRSS. The parameters used to characterize the geometry of the earth berm in the study of Powrie and Daly [19] included height (H), top width (B1), and slope (S), as depicted in Figure 6. However, in order to facilitate the qualitative comparison of the effect of each parameter on the PRSS, the bottom width (B2) is used in this paper instead of the slope (S) to characterize the geometry of the earth berm. A series of numerical models are performed to analyze the effect of the earth berms on the PRSS, as listed in Table 4. It is noteworthy that the final excavation depth (h) remains constant at 20 m for all the analyses. In groups No. 1, 2, and 3, the height, top width, and bottom width are varied from 0.1 h to 0.35 h, 0 to 0.75 h, and 0.15 h to 0.65 h, respectively, to examine the effect of the berm’s geometric parameters on the performance of the PRSS, such as the lateral deflections and bending moments of the supporting piles and the ground surface settlements. The parameter analysis is performed based on the final working conditions, where the ground water level is consistently maintained at 2 m below the excavation depth, indicating that the effects of earth berms are not influenced by the ground water.
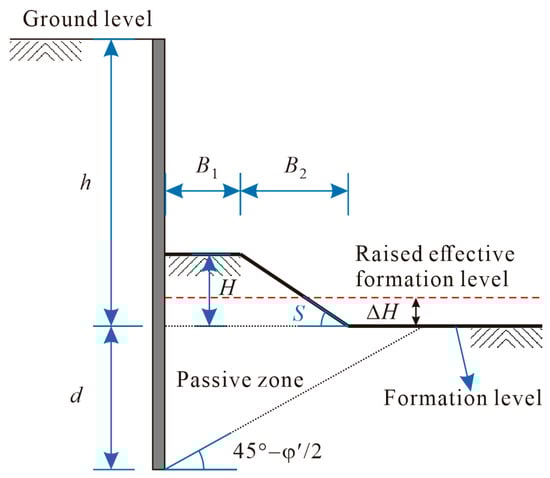
Figure 6.
Geometry of the earth berms.
Table 4.
Geometry parameters of berm groups in parametric studies.
4. Results and Discussion
4.1. The Effect of Berm Geometry on the Lateral Pile Deflection
Figure 7 illustrates the influence of the earth berm’s geometric parameters (height, top width, and bottom width) on the lateral deformation of the supporting piles. As presented in Figure 7a, the lateral deflection of the supporting pile decreases significantly with the increasing height of the berm. Such an effect occurs mainly in the middle of the pile and gradually diminishes along the top and bottom of the pile. Moreover, the reduction in lateral pile deflection decreases as the berm height increases, indicating a non-linear relationship between the two of them. A similar relationship exists between the lateral pile displacement and the top width of the earth berm (see Figure 7b). However, it appears that for soil types and retaining walls analyzed in this research, a top berm width of approximately 0.3 h is equivalent to reducing the excavation depth to the height of berm. That is to say, berm top widths greater than 0.3 h have little effect on pile deflection reduction. Figure 7c illustrates the correlation between the lateral pile deflection and the bottom width of the earth berm. The bottom width of the earth berm exhibits a similar impact on the lateral pile deflection as the top width and height of the berm. The lateral pile deflection increases with the width of the bottom width of the berm. Moreover, as the bottom width of the berm exceeds 0.55 h, its increase has little effect on the lateral pile deflection. It closely approximates the passive zone, which is given by the intersection with the excavation level of a line drawn from the bottom of the supporting pile at an angle of () to the horizon, as depicted in Figure 6.
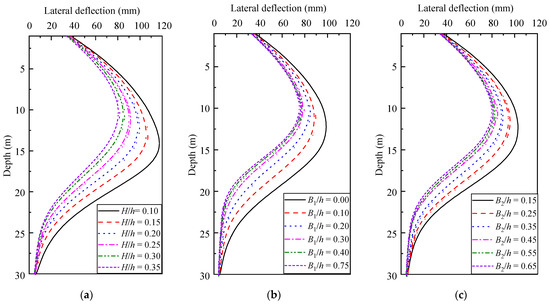
Figure 7.
Effect of different berm geometric parameters on lateral pile deflection: (a) height; (b) top width; (c) bottom width.
Figure 8 presents the relationship between various geometric parameters of the earth berm and the maximum lateral pile deflections, as well as their corresponding locations. In terms of the height, top width, and bottom width of the berm, their increase results in a non-linear decrease in the maximum lateral deflection and an upward shift in the location of the maximum lateral deflection. Over the same range, the height of the berm has a more pronounced effect on the reduction in the maximum lateral deflections compared to the top and bottom widths of the berm. As the top and bottom widths of the berm reach the critical values of 0.3 h and 0.45 h, respectively, meaning that the total width of the berm extends beyond the passive zone, their increase has an essentially negligible effect on the reduction in the maximum lateral deflection and its positional change. It implies that the earth berm’s impact on the retaining wall arises from both its lateral resistance and the vertical pressure it exerts on the passive zone. As the height of the berm decreases from 0.35 h to 0.15 h, the location of the maximum lateral pile deflection shifts downward from 0.45 h to 0.70 h. Additionally, with a decrease in the top width of the berm from 0.00 h to 0.30 h, the location of the maximum lateral pile deflection moves downward from 0.50 h to 0.61 h. Similarly, a decrease in the top width of the berm from 0.15 h to 0.45 h results in the location of the maximum lateral pile deflection shifting downward from 0.52 h to 0.61 h. Furthermore, when the top and bottom widths of the berm exceed 0.30 h and 0.45 h, respectively, the locations of the maximum lateral pile deflections do not change significantly with their variations.
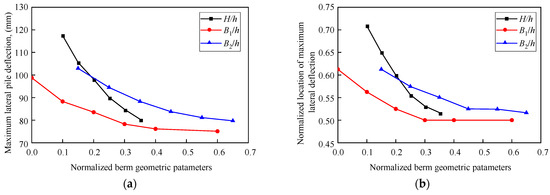
Figure 8.
Maximum lateral pile deflections (a) and their locations (b) with different berm geometric parameters.
4.2. The Effect of Berm Geometry on the Bending Moment of Pile
Figure 9 shows the bending moments of piles computed with various geometric parameters of the earth berm. Positive and negative bending moments are utilized to indicate their respective directions. The geometric parameters of the berm primarily affect the bending moment of the pile below the lowest waling, with less significant effects observed above this point. As the height of the berm increases, the bending moment in the lower part of the supporting piles, which are supported by the berm, tends to decrease, while the upper part supported by the walings tends to increase. When the berm height reaches the level of the lowest waling (H = 0.30 h), the maximum bending moment of the supporting piles reaches a stabilized value, which is clearly displayed in Figure 10a. Meanwhile, the location of the maximum bending moment shifts from below the lowest waling to above it, as presented in Figure 10b. According to Figure 9b,c, the change in the top width of the berm has a more significant effect on the bending moment of the pile at the part supported by the berm than the bottom width of the berm.
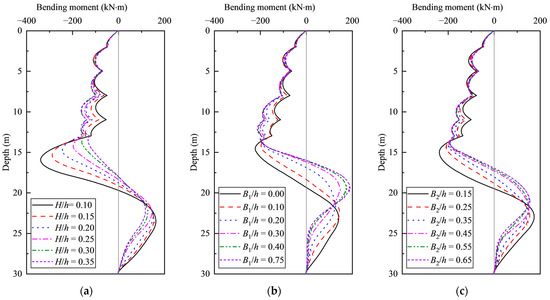
Figure 9.
Effect of different berm geometric parameters on bending moment of the pile: (a) height; (b) top width; (c) bottom width.
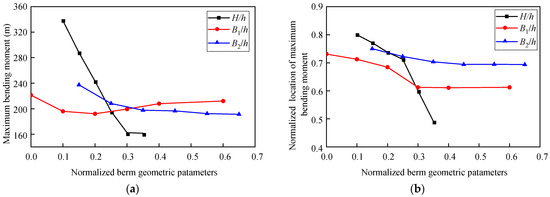
Figure 10.
Maximum bending moments (a) and their locations (b) with different berm geometric parameters.
As illustrated in Figure 10a, when the top width of the earth berm is less than 0.2 h, the maximum bending moment of the pile decreases as the top width of the earth berm increases. However, when the top width of the earth berm is greater than 0.2 h, the maximum bending moment of the pile increases slightly as the earth berm top width increases until it reaches 0.4 h. Beyond this value, the maximum bending moment of the supporting pile does not change significantly with further increases in the earth berm width. Likewise, regarding the impact of the height of the berm, an increase in the top width also causes a shift in the location of the maximum bending moment from below the lowest waling to above it, as shown in Figure 10b. Moreover, similar to the influence of the bottom width of the berm on the maximum lateral pile deflection, the effect of the bottom width on the maximum bending moment of the pile and its location also tends to diminish with a rise in the bottom width, as presented in Figure 10a,b.
4.3. The Effect of Berm Geometry on the Ground Surface Settlement
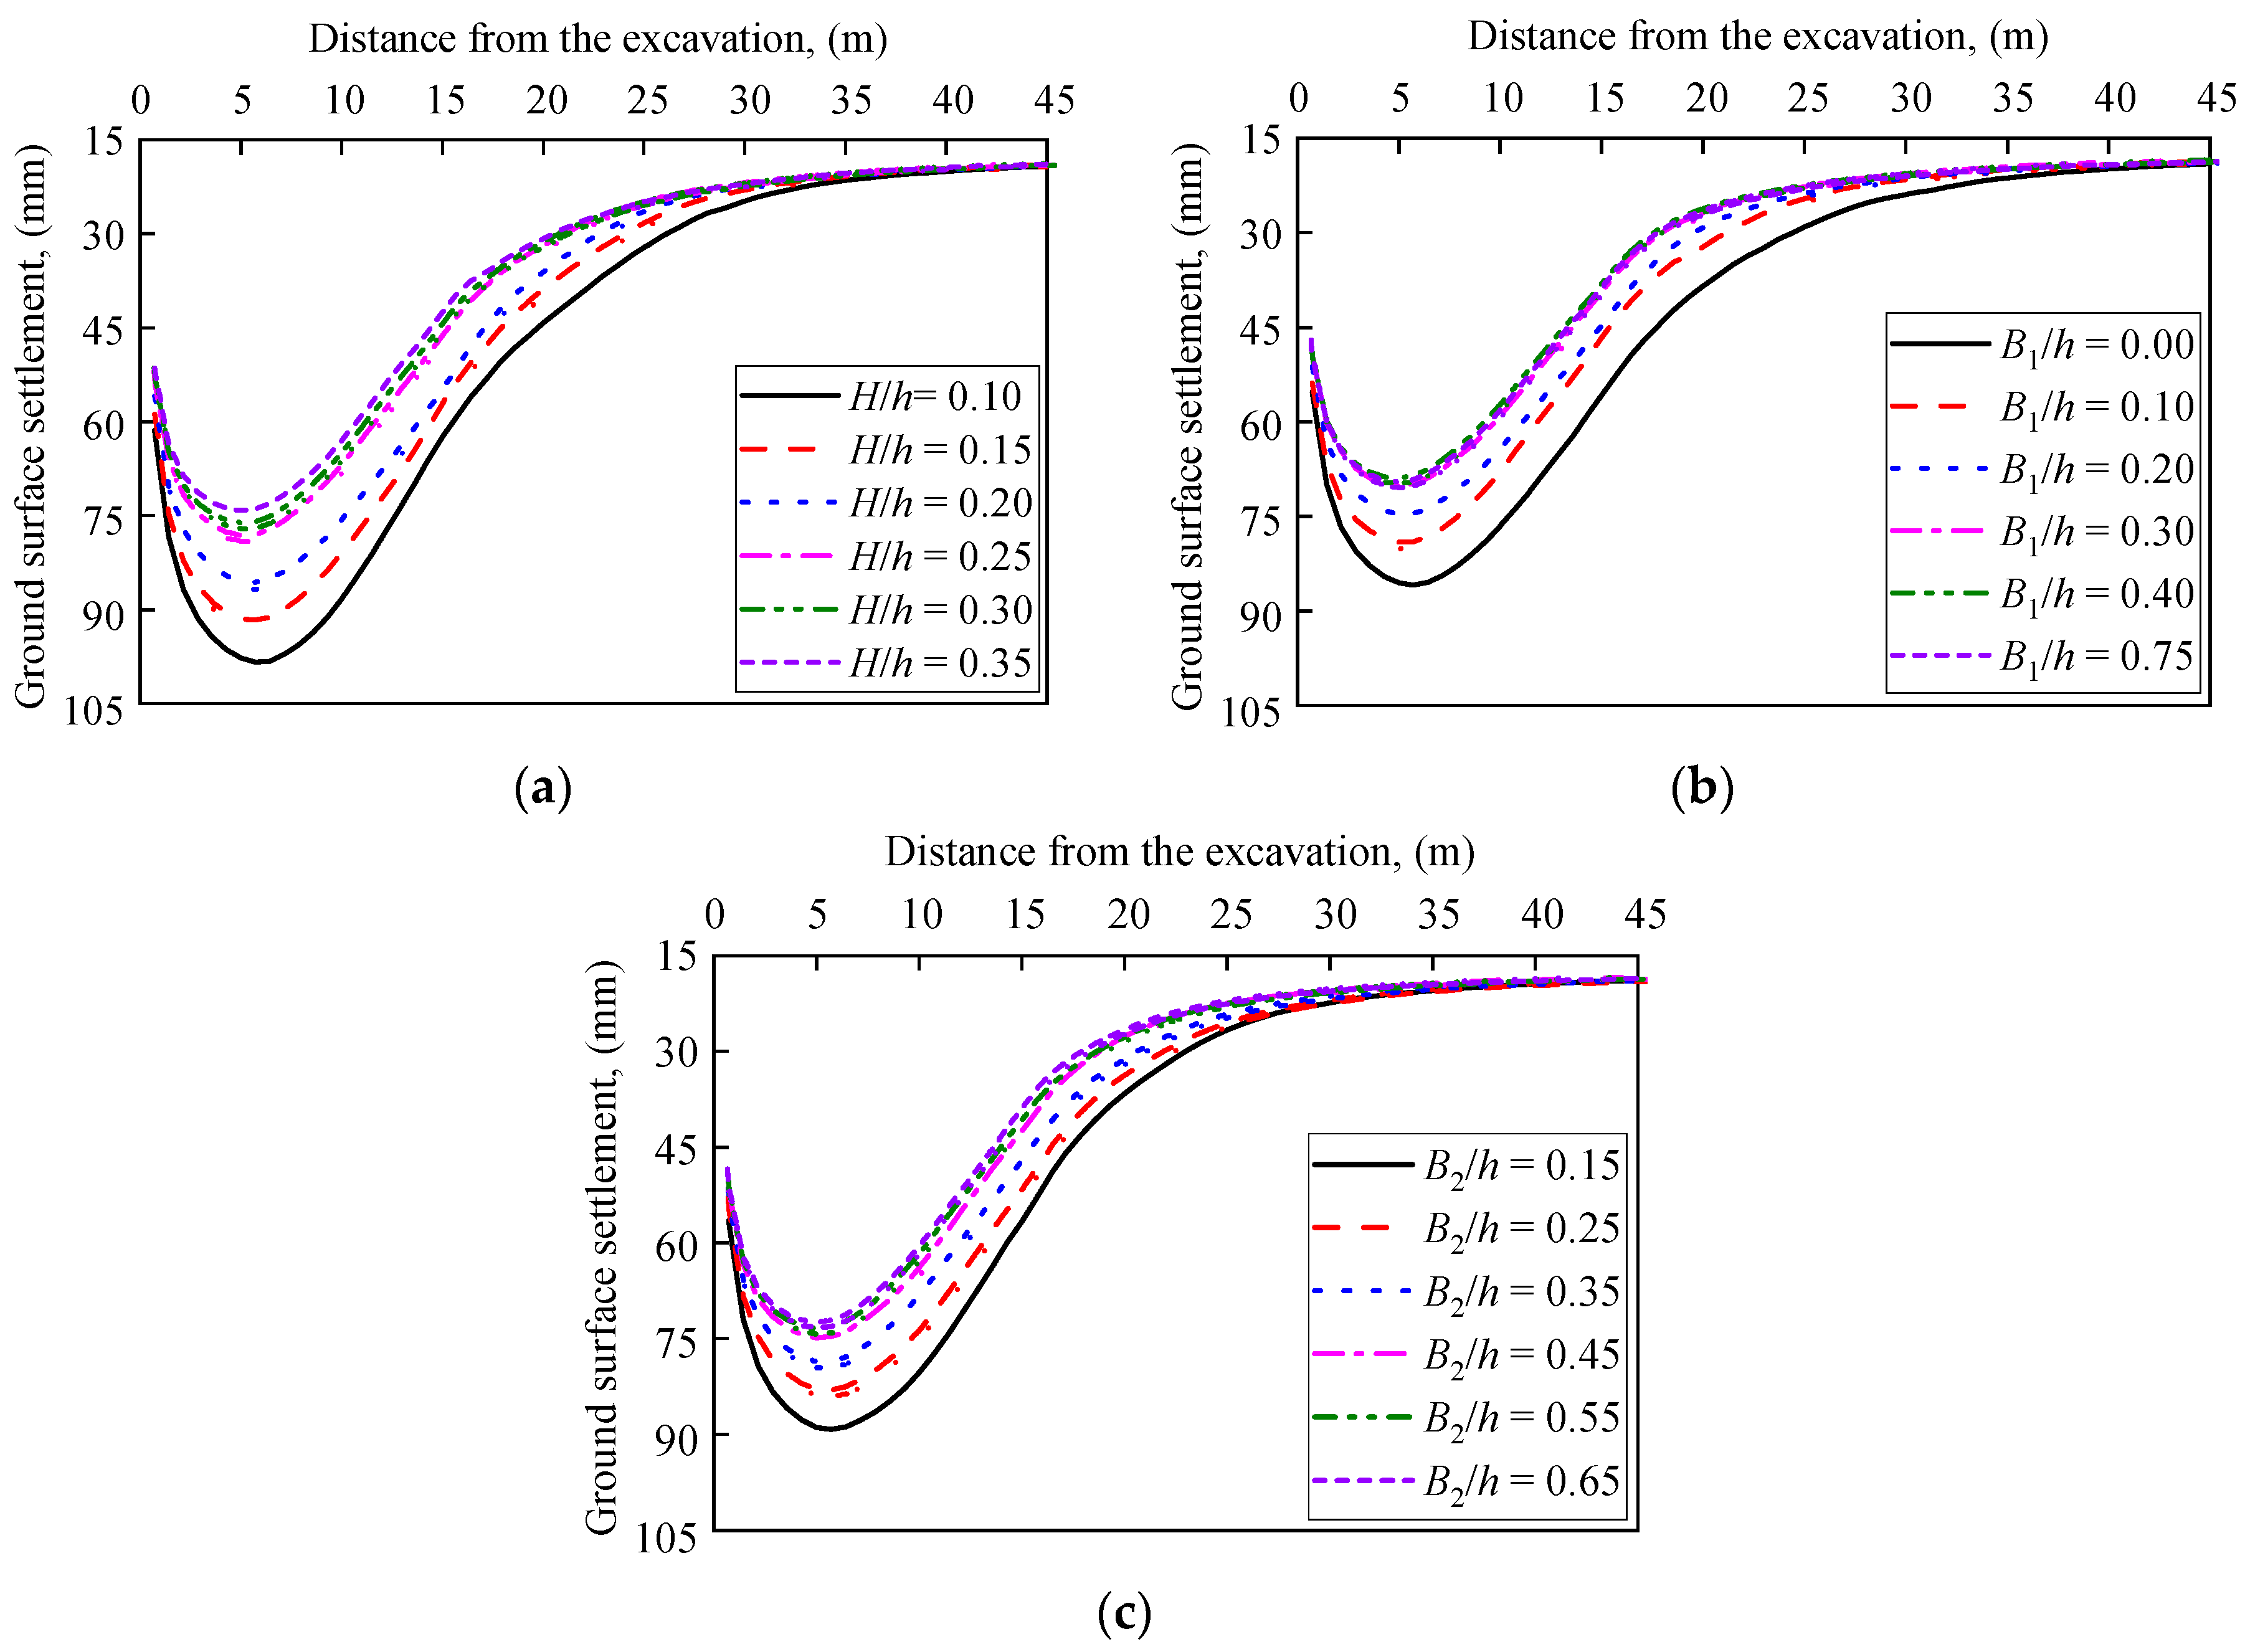
Figure 11 presents the effect of different berm geometric parameters on the ground surface settlement. According to extensive studies on excavation-induced ground movements reported in CIRIA C760 [16], the settlements behind the wall could be related to the horizontal movements of the wall considering the ground loss. Therefore, the effect of the geometric parameters of the earth berm on the ground surface settlement presented in Figure 11 is similar to its effect on the lateral pile deflection presented in Figure 7. With increasing the height, top width, and bottom width of the earth berm, the ground surface settlements tend to decrease, and their contribution to the reduction in ground surface settlement diminishes as well. Once the top and bottom widths of the earth berm reach 0.30 h and 0.45 h, respectively, their impact on reducing surface settlement becomes essentially negligible. Therefore, although a relatively large-sized earth embankment can be effective in reducing surface settlement, there exists a critical value beyond which it is ineffective to increase the size of the earth berm.
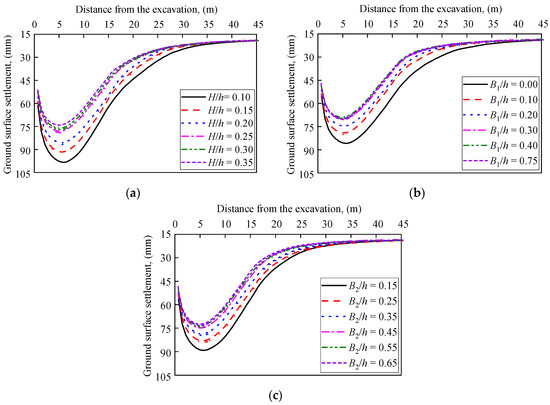
Figure 11.
Effect of different geometric parameters of berm on ground surface settlement: (a) height; (b) top width; (c) bottom width.
Maximum ground surface settlement is commonly associated with the safety evaluation of the excavation. The relationships between different berm’s geometric parameters and the maximum ground surface settlements and their locations are shown in Figure 12. The maximum ground surface settlement decreases non-linearly with increasing normalized geometric parameters of the berm. A comparison of Figure 8 and Figure 12 indicates that the influence of the berm’s geometric parameters on the maximum ground surface settlement closely resembles their effect on maximum lateral pile deflection. However, the range of positional variations where the maximum ground surface settlement occurs is not as large as that for the maximum lateral pile deflection. For maximum ground surface settlement, the range is 0.25 h to 0.28 h, whereas for maximum lateral pile deflection, the range is 0.50 h to 0.70 h.
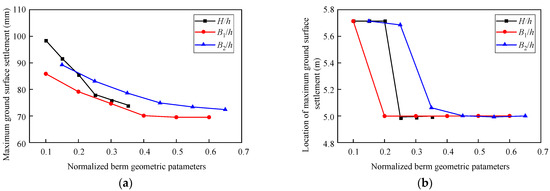
Figure 12.
Maximum ground surface settlements (a) and their locations (b) with different berm geometric parameters.
4.4. The Raised Effective Formation Level
The raised effective formation level (REFL) method is a practical and straightforward approach for incorporating an earth berm into calculations that involve soil–structure interaction or limit equilibrium analysis [27]. As demonstrated above, although the different geometric parameters of the earth berm have similar effects on the PRSS, the height of the earth berm is the most significant of them. Therefore, the height of the earth berm is chosen as a representative parameter to study the raised effective formation level considering the effect of the berm. The height of the earth berms is taken as 1.5 m, 2.5 m, 3.5 m, 4.5 m, 5.5 m, and 6.5 m, while the total width and slope of the earth berm are 8 m and 45°, respectively.
4.4.1. The Raised Effective Formation Level for Stability Analysis
To consider the effect of earth berms on the stability of the embedded walls, Smethurst [27] proposed a modified raised effective formation level approach for use in effective stress analysis, with the raised effective formation level () given as follows:
where
W is the total weight of the berm;
d is the wall embedment below the formation level;
φ′ is the effective angle of shearing resistance;
γ is the unit weight of the soil from which the berm is made.
A series of numerical models were conducted to investigate the raised effective formation level proposed by Smethurst for stability analysis under both axisymmetric and plane strain conditions.
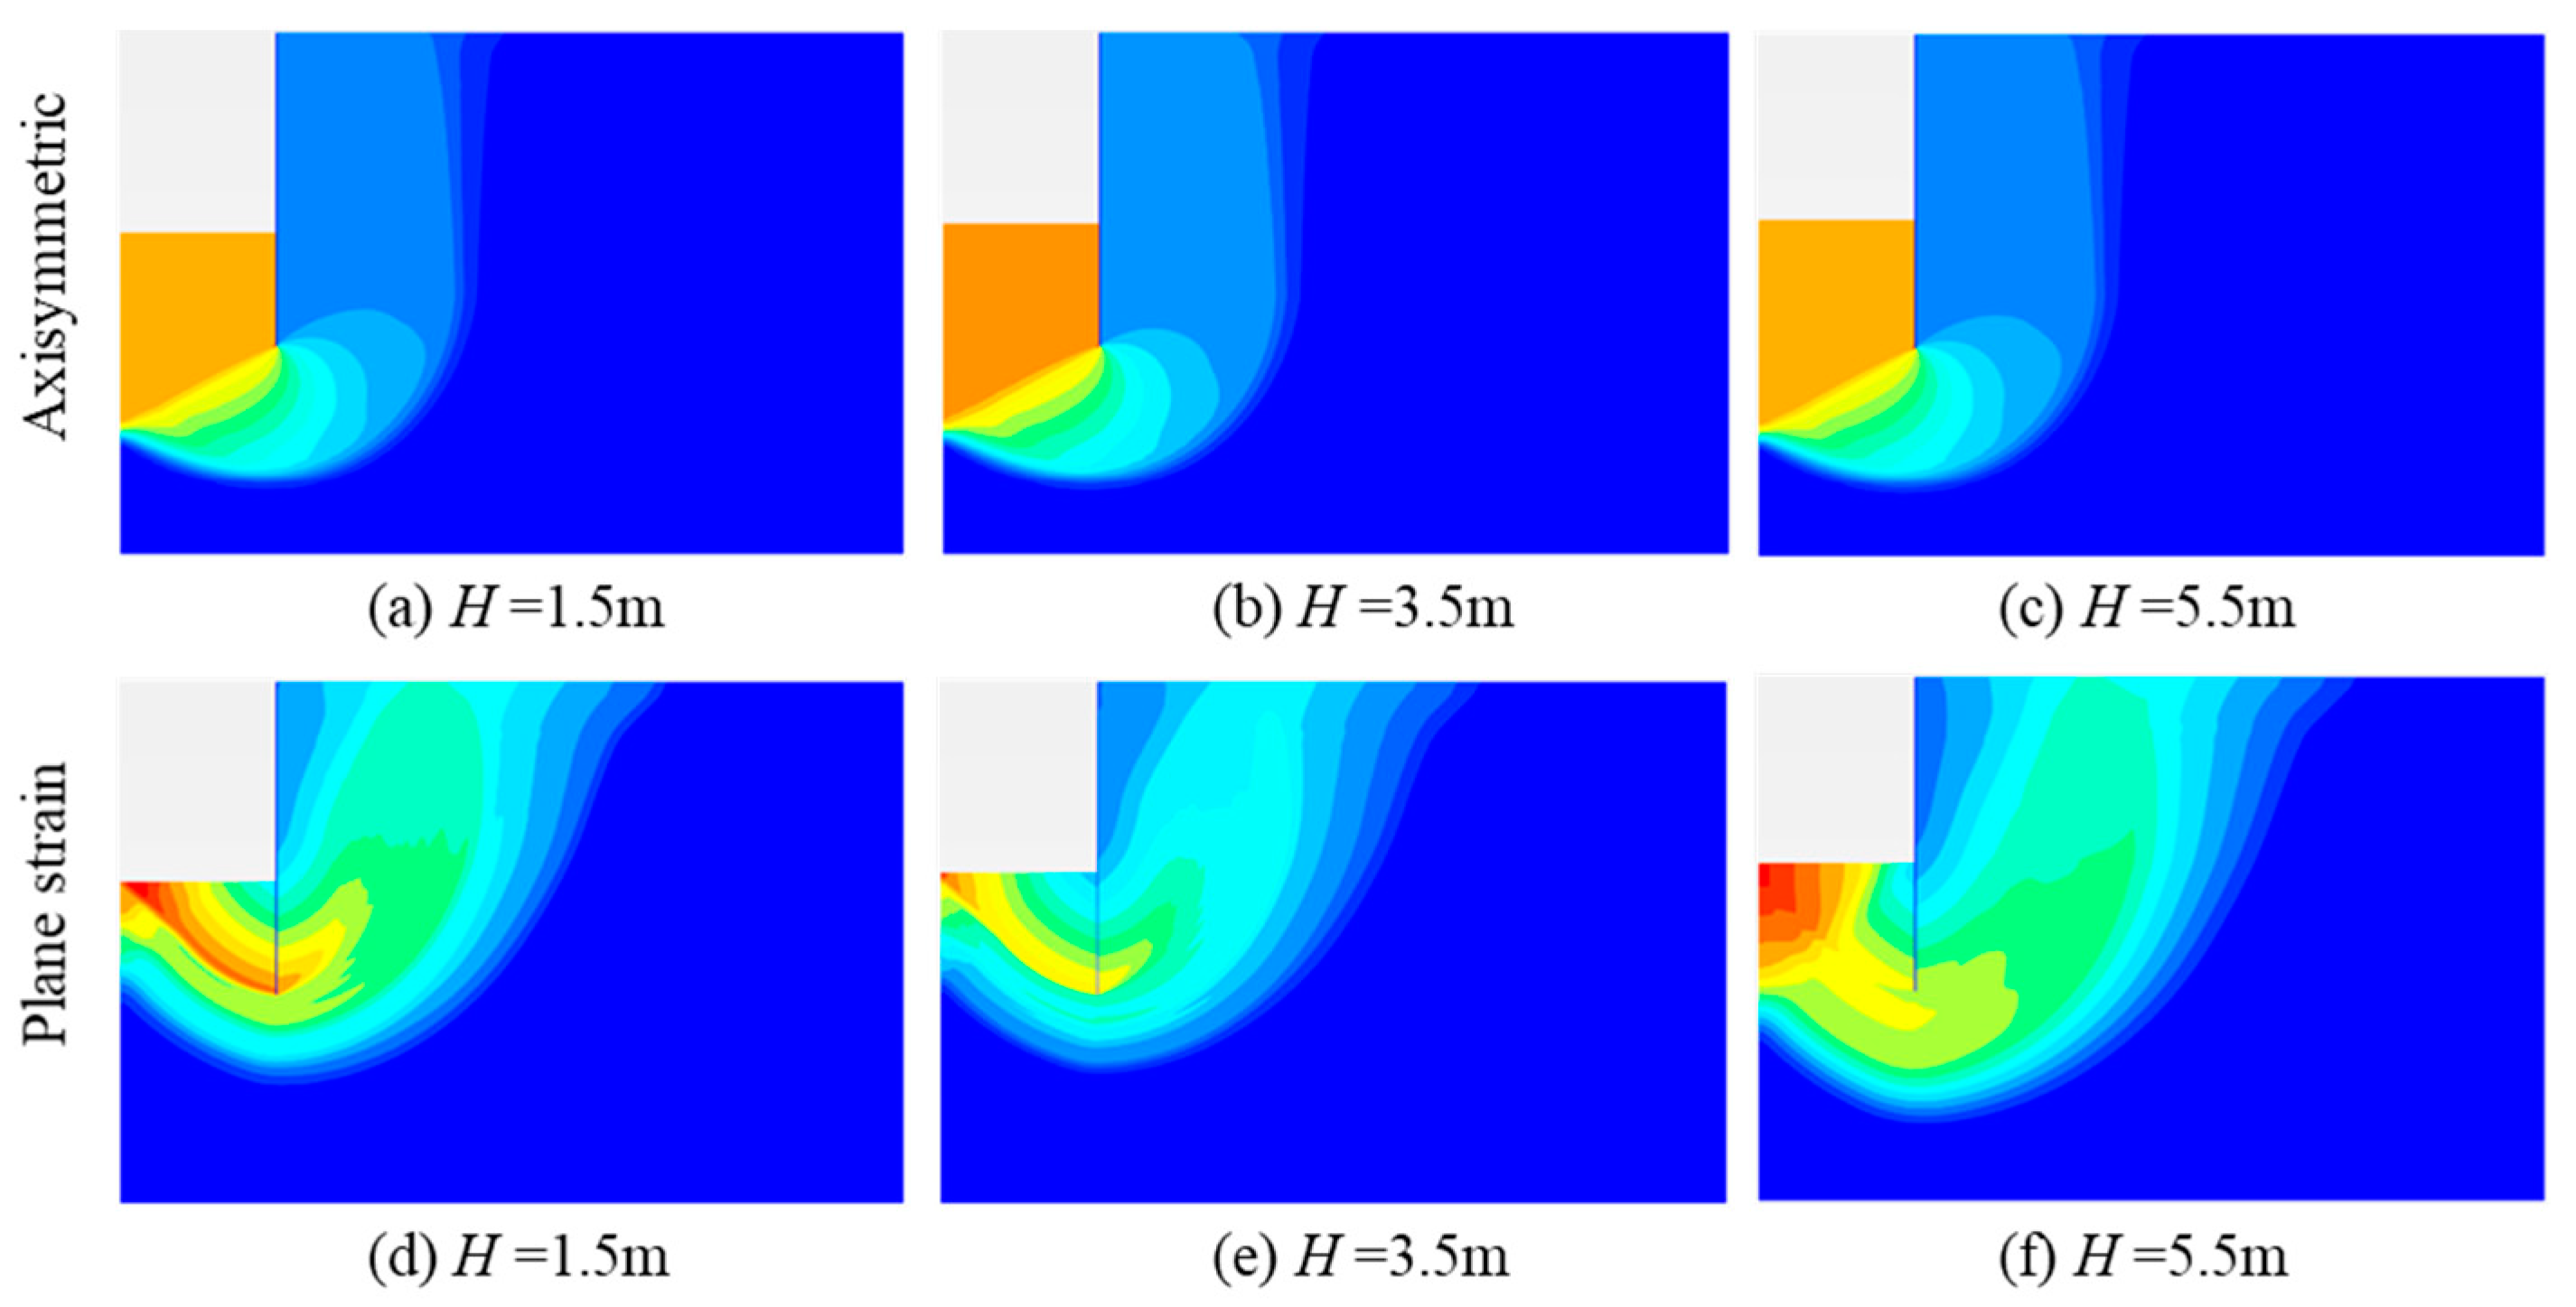
Figure 13 illustrates the changes observed in the factor of safety of the PRSS concerning various berm heights and REFL under both axisymmetric and plane strain conditions. Under axisymmetric conditions, the factor of safety initially increases with the increase in berm height, showing a basal heave instability failure mode (as seen in Figure 14a,b). However, when the berm height reaches a certain threshold, the factor of safety decreases, indicating the localized instability of the berm (as seen in Figure 14c). Under plane strain conditions, the factor of safety remains relatively constant, approximately half of that observed under axisymmetric conditions. The dominant mode of failure is overall instability (as seen in Figure 14d–f). Under axisymmetric conditions and using Smethurst’s approach to consider the effect of an earth berm on the stability of support structures, the factor of safety increases with the increase in earth berm height, and the failure mode is basal heave instability failure mode (as seen in Figure 15a–c). When the earth berm height is low, the difference in the factor of safety between equivalent and non-equivalent cases is small. However, as the earth berm height increases, the difference between the two cases also increases. This is because the non-equivalent case ignores the possibility of localized instability due to the absence of an earth berm. The factor of safety for the localized stability of the berm decreases with the increase in earth berm height. Under plane strain conditions and using Smethurst’s approach to consider the effect of an earth berm on the stability of support structures, the factor of safety increases with the increase in earth berm height, but it is about 20% higher than the actual situation. It shows a failure pattern that combines overall instability and basal heave instability (as seen in Figure 15d–f). It is noted that under axisymmetric conditions, Smethurst’s approach can better consider the effect of an earth berm on the stability of support structures. However, when the height of the earth berm is high, the stability of the earth berm needs to be considered separately. Under plane strain conditions, Smethurst’s method tends to be dangerous. In circular excavations, axisymmetric conditions should be used to analyze the stability of supporting structures. The use of plane strain conditions will result in overly conservative results.
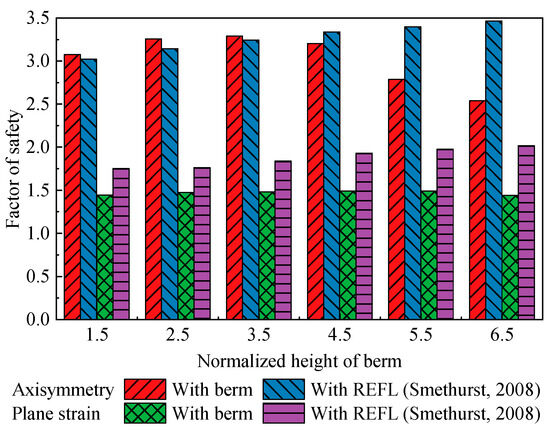
Figure 13.
Variation in the factor of safety of the PRSS with different berm heights and REFL under axisymmetric and plane strain conditions [33].
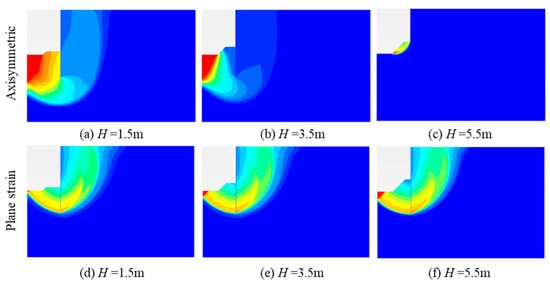
Figure 14.
Typical shape of the failure surface with berm: (a–c) under axisymmetric conditions; (d–f) under plane strain conditions.
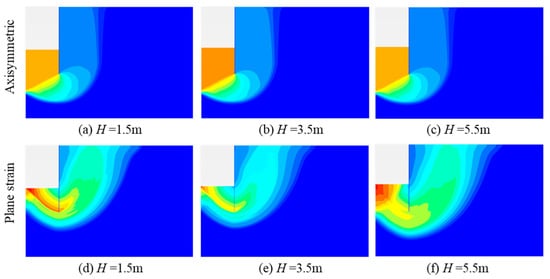
Figure 15.
Typical shape of the failure surface condition with raised effective formation level: (a–c) under axisymmetric conditions; (d–f) under plane strain conditions.
4.4.2. The Raised Effective Formation Level for Deformation Analysis
Based on finite element analysis, Easton et al. [59] developed a correlation between the height of the earth berm and the effective uniform rise in formation level ahead of the cantilever embedded wall, giving an equivalent maximum wall movement [16,19]. A series of numerical models are conducted to investigate the raised effective formation level for deformation analysis under both axisymmetric and plane strain conditions.
Figure 16 illustrates the relationship between the raised effective formation level and the height of the earth berm in the deformation analysis. Additionally, the results of the studies by Easton et al. [59] are included for comparison. It can be observed that under plane strain conditions, the relationship between the raised effective formation level and the height of the earth berm is similar to the findings in Easton’s study. Initially, when the height of the earth berm is relatively low, the raised effective formation level increases linearly with the height of the earth berm. However, as the height of the earth berm increases, the raised effective formation level gradually approaches a constant value of 2.5 m. This implies that, under a given slope gradient and bottom width, there is a certain threshold height for the earth berm beyond which further increases have diminishing effects on reducing the horizontal displacement of the support structure. Moreover, it is noteworthy that Easton’s method provides a reasonable estimation of the raised effective formation level for an earth berm without considering axisymmetric conditions. Compared to plane strain conditions, the relationship between the equivalent excavation depth and the height of the earth berm under axisymmetric conditions shows a similar trend of development. However, when the height of the earth berm exceeds 4.5 m, the equivalent excavation depth does not tend to reach a constant value but continues to increase gradually. Only when the height of the earth berm exceeds 6.0 m does the raised effective formation level approach a larger constant value of 3.6 m. This indicates that under axisymmetric conditions, the earth berm can be better utilized to reduce the lateral displacements of the supporting piles.
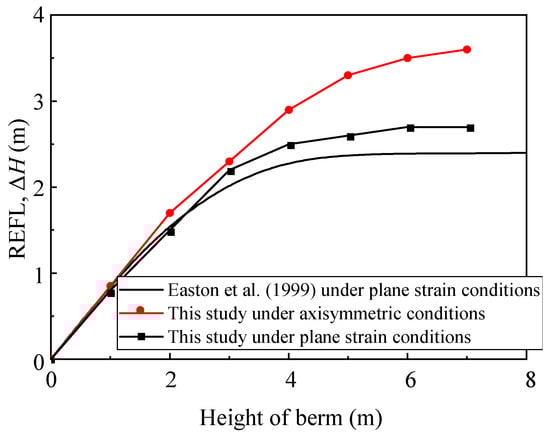
Figure 16.
Relationship between berm height and REFL [59].
Despite the importance and effect of the clay sensitivity in stability analysis [60,61,62], this concern due to the thickness of overburden is not considered. On the other hand, the challenges of converting the 1D to 3D spatial CPT-based spatial stratigraphic mapping of the classified subsurface soil types [63,64,65,66] was not considered due to the scale of the model and study area. Moreover, the impact of the ground water was not taken into account in the numerical simulation, due to the fact that the effects of earth berms are not influenced by the ground water in the case history. The strength, stiffness, and constitutive model of the components in the PRSS may have an impact on the uncertainty of its behavior and therefore needs to be further investigated.
5. Conclusions
This paper presents a series of numerical analyses performed using Plaxis 3D. Parametric studies are conducted to investigate the effects of earth berms on the PRSS in circular excavations. Additionally, the effective formation level considering the effects of earth berms under plane strain and axisymmetric conditions has been examined. The key findings are summarized as follows:
- (1)
- Increasing the dimensions of the earth berms, such as height, top width, and bottom width, reduces lateral deflections of supporting piles significantly. The effect is more pronounced in the middle part of the piles, while it is less significant towards the top and bottom parts. Once the top and bottom widths of earth berms reach critical values of 0.3 h and 0.45 h, respectively, further widening of the earth berms has little impact on the deformations of the supporting piles.
- (2)
- The earth berm’s height has a significant effect on the bending moments of the supporting piles below the lowest waling, while its effect is less pronounced above this point. The top width of the earth berms has a greater influence on the bending moments of the supporting piles than the bottom width. When the top width is less than 0.2 h, the maximum bending moment of the supporting piles decreases with an increase in top width. However, when the top and bottom widths exceed 0.2 h but remain below 0.4 h, the maximum bending moment of the retaining piles slightly increases as the top width increases. As the bottom width increases, its impact on the maximum bending moment of the supporting pile tends to decrease.
- (3)
- The effect of earth berm on the ground surface settlement is similar to its effect on the lateral pile deflection. As the height, top width, and bottom width of the earth berm increase, the ground surface settlements tend to decrease. However, the reduction in ground surface settlement gradually diminishes as these geometric parameters continue to increase. Once the top and bottom widths of the earth berm reach 0.30 h and 0.45 h, respectively, their impact on reducing surface settlement becomes essentially negligible. However, the range of positional variations for the maximum ground surface settlement is not as extensive as that of the maximum lateral pile deflection.
- (4)
- Smethurst’s approach is effective in considering the impact of an earth berm on the stability of the PRSS under axisymmetric conditions. In addition, the stability of the earth berm needs to be considered when its height is high. In circular excavations, it is recommended to analyze the stability of PRSS based on axisymmetric conditions. This is because it leads to excessively conservative results under plane strain conditions.
- (5)
- Under plane strain conditions, the raised effective formation level in deformation analysis increases as the berm height increases and eventually stabilizes at a constant value of 2.5 m. On the other hand, under axisymmetric conditions, the raised effective formation level in the deformation analysis also increases with increasing berm height, but it converges to a constant value of 3.6 m.
Author Contributions
Conceptualization, C.G. and L.C.; methodology, L.C.; software, L.C.; validation, L.C.; formal analysis, L.C.; investigation, L.C.; resources, C.G.; data curation, L.C.; writing—original draft preparation, L.C.; writing—review and editing, C.G., D.C. and L.C.; visualization, L.C.; supervision, C.G.; project administration, C.G.; funding acquisition, C.G. All authors have read and agreed to the published version of the manuscript.
Funding
This research was funded by the National Key Research and Development Program of China, grant number 2021YFC3100803; Science and Technology Research and Development Program of China State Railway Group Co., Ltd., grant number N2021G056.
Institutional Review Board Statement
Not applicable.
Informed Consent Statement
Not applicable.
Data Availability Statement
The data presented in this study are available on request from the corresponding author due to restrictions on privacy.
Conflicts of Interest
The authors declare that this study received funding from the Science and Technology Research and Development Program of China State Railway Group Co., Ltd., grant number N2021G056. The funder had the following involvement with the study: the construction and monitoring of the PRSS.
References
- Dunkel, F.V. Applying current technologies to large-scale, underground grain storage. Tunn. Undergr. Space Technol. 1995, 10, 477–496. [Google Scholar] [CrossRef]
- Muleta, O.D.; Tola, Y.B.; Hofacker, W.C. Assessment of storage losses and comparison of underground and aboveground storage for better stability and quality of maize (Zea mays L.) and sorghum (Sorghum bicolor L.) grains in selected districts of jimma zone, Ethiopia. J. Stored Prod. Res. 2021, 93, 101847. [Google Scholar] [CrossRef]
- Zhang, H.; Wang, H.; Yang, J.; Wang, F. A novel vertical waterproofing joint with trapezoidal steel plate connections for steel–concrete underground silos: Bending test and numerical simulation. Tunn. Undergr. Space Technol. 2023, 137, 105150. [Google Scholar] [CrossRef]
- Zhang, Z.; Li, P.; Li, Z.; Zhang, M.; Xiong, H. A Prefabricated Underground Cylindrical Garage and a Corresponding Stiffness Analysis. Int. J. Steel Struct. 2020, 20, 954–968. [Google Scholar] [CrossRef]
- Pan, Y.; Fang, H.; Li, B.; Wang, F. Stability analysis and full-scale test of a new recyclable supporting structure for underground ecological granaries. Eng. Struct. 2019, 192, 205–219. [Google Scholar] [CrossRef]
- Guo, C.; Ye, J.; Zhao, C.; Wang, F. Mechanical and deformation characteristics of composite assembled supporting structure. Geotech. Res. 2020, 7, 230–243. [Google Scholar] [CrossRef]
- Wang, F.; Shi, G.; Zhai, W.; Li, B.; Zhang, C.; Fang, H. Internal Force on and Deformation of Steel Assembled Supporting Structure of Foundation Pit under Thermal Stress. Appl. Sci. 2021, 11, 2225. [Google Scholar] [CrossRef]
- Brown, C.J.; Nielsen, J. Silos: Fundamentals of Theory, Behaviour and Design; CRC Press: New York, NY, USA, 1998. [Google Scholar]
- Yang, S.; Hsiau, S. The simulation and experimental study of granular materials discharged from a silo with the placement of inserts. Powder Technol. 2001, 120, 244–255. [Google Scholar] [CrossRef]
- Sun, W.; Feng, J.; Mao, F. Pressure distribution of central cone silos during filling and discharge: Multi-scale experimental study. Structures 2021, 34, 42–50. [Google Scholar] [CrossRef]
- Li, G.; Li, Q.; Wang, J.; Dong, J.; Sun, Q. The Deformation Characteristics of a 40-m-Deep Excavation Supported by a Suspended Diaphragm Wall in Rock and Soil Composite Ground. KSCE J. Civ. Eng. 2022, 26, 1040–1050. [Google Scholar] [CrossRef]
- Liu, N.; Pan, J.; Li, M.; Li, Y. Deformation characteristics of an ultra-deep and small-scale rectangular excavation in Hangzhou soft clay. Tunn. Undergr. Space Technol. 2023, 137, 105117. [Google Scholar] [CrossRef]
- Zhou, H.; Zheng, G.; He, X.; Wang, E.; Guo, Z.; Nie, D.; Ma, S. Numerical modelling of retaining structure displacements in multi-bench retained excavations. Acta Geotech. 2020, 15, 2691–2703. [Google Scholar] [CrossRef]
- Clough, G.W.; Denby, G.M. Stabilizing Berm Design for Temporary Walls in Clay. J. Geotech. Eng. Div. 1977, 103, 75–90. [Google Scholar] [CrossRef]
- Dong, Y.; Burd, H.J.; Houlsby, G.T. Finite element study of deep excavation construction processes. Soils Found. 2017, 57, 965–979. [Google Scholar] [CrossRef]
- Gaba, A.; Hardy, S.; Doughty, L.; Powrie, W.; Selemetas, D. Guidance on Embedded Retaining Wall Design; Ciria: London, UK, 2017. [Google Scholar]
- Qin, H.; Zhou, Y.; Huang, M.; Zhou, T. Passive earth pressure analysis of berm-retained excavation by upper bound method. Chin. J. Geotech. Eng. 2020, 42, 1101–1107. (In Chinese) [Google Scholar] [CrossRef]
- Daly, M.P.; Powrie, W. Undrained analysis of earth berms as temporary supports for embedded retaining walls. Proc. Inst. Civ. Eng.-Geotech. Eng. 2001, 149, 237–248. [Google Scholar] [CrossRef]
- Powrie, W.; Daly, M.P. Centrifuge model tests on embedded retaining walls supported by earth berms. Géotechnique 2002, 52, 89–106. [Google Scholar] [CrossRef]
- Simpson, B.; Powrie, W. Embedded retatining walls: Theory, practice and understanding. In Proceedings of the International Conference on Soil Mechanics and Geotechnical Engineering, Istanbul, Turkey, 27–31 August 2002. [Google Scholar]
- Muñoz, M.Á.M.; Carrizosa, D.M.; García, A.C. Numerical analysis of discontinuous berm-supported shallow excavations for building construction. IOP Conf. Ser. Earth Environ. Sci. 2023, 1189, 012019. [Google Scholar] [CrossRef]
- Jiang, H.; Zhou, X.; Xiao, Z. Stability of Extended Earth Berm for High Landfill. Appl. Sci. 2020, 10, 6281. [Google Scholar] [CrossRef]
- Georgiadis, M.; Anagnostopoulos, C. Effect of berms on sheet-pile wall behaviour. Géotechnique 1998, 48, 569–574. [Google Scholar] [CrossRef]
- Powrie, W.; Chandler, R.J. The influence of a stabilizing platform on the performance of an embedded retaining wall: A finite element study. Géotechnique 1998, 48, 403–409. [Google Scholar] [CrossRef]
- Easton, M.R.; Darley, P. Case History Studies of Soil Berms Used as Temporary Support to Embedded Retaining Walls; Transport Research Laboratory: Crowthorne, UK, 1999. [Google Scholar]
- Morsi, Y.G.Y. Berms for Stablizing Earth Retaining Structures. Master’s Thesis, Cairo University, Fayoum, Egypt, 2003. [Google Scholar]
- Lee, M.; Kim, T. Parametric Study on Displacement of Earth Retaining Wall by the Bermed Excavation Using Back Analysis. J. Korean Geosynth. Soc. 2015, 14, 23–33. [Google Scholar] [CrossRef]
- Valverde, J.G.N. Influence of the Berm on the Behavior of Cantilever Wall Excavations. Master’s Dissertation, PGECIV/UERJ, Rio de Janeiro, Brasil, 2018. [Google Scholar]
- Qin, H.; Zhou, Y.; Zhou, T.; Li, D. Retaining traits of berm-retained excavations by FEM. Chin. J. Geotech. Eng. 2019, 41, 9–12. (In Chinese) [Google Scholar] [CrossRef]
- Fleming, K.; Weltman, A.; Randolph, M.; Elson, K. Piling Engineering, 3rd ed.; CRC Press: New York, NY, USA, 2008. [Google Scholar]
- Padfield, C.J.; Mair, R.J. Design of retaining walls embedded in stiff clay. In CIRIA Report 104; Construction Industry Research & Information Association: London, UK, 1984. [Google Scholar]
- Shan, L.; Ni, P.; Yang, Y.; Wang, R.; Dong, H. Deformation Characteristics of Bored Pile for Super-Large Circular Bermed excavation. Chin. J. Undergr. Space Eng. 2023, 19, 1299–1307. (In Chinese) [Google Scholar]
- Smethurst, J.A.; Powrie, W. Effective-stress analysis of berm-supported retaining walls. Proc. Inst. Civ. Eng.-Geotech. Eng. 2008, 161, 39–48. [Google Scholar] [CrossRef]
- Zhang, X.; Xu, M.; Song, E.; Wang, Y.; Sun, J.; Chen, Y. Stability analysis of cantilever retaining wall supported by earth berm under undrained conditions. Eng. Mech. 2023. [Google Scholar] [CrossRef]
- Navfac. Design Manual 7.02: Foundations and Earth Structures; US Naval Facilities Engineering Command: Alexandria, VA, USA, 1986. [Google Scholar]
- So, A.K. Performance of the Jet Grouted Sloping Berm as a Support to the Diaphragm Wall in an Excavation. In Proceedings of the 6th GeoChina International Conference on Civil & Transportation Infrastructures, Nanchang, China, 19–21 July 2021. [Google Scholar]
- Gourvenec, S.M.; Powrie, W. Three-dimensional finite element analyses of embedded retaining walls supported by discontinuous earth berms. Can. Geotech. J. 2000, 37, 1062–1077. [Google Scholar] [CrossRef]
- El-Sherbiny, M.M.; El-Sherbiny, R.M.; El-Mamlouk, H. Three Dimensional Effect of Grouted Discontinuous Berms for Passive Support of Diaphragm Walls. Grouting 2017, 2017, 571–583. [Google Scholar]
- Guojun, X.; Jianhua, W. A rigorous characteristic line theory for axisymmetric problems and its application in circular excavations. Acta Geotech. 2020, 15, 439–453. [Google Scholar] [CrossRef]
- Keshavarz, A.; Ebrahimi, M. Axisymmetric passive lateral earth pressure of retaining walls. KSCE J. Civ. Eng. 2017, 21, 1706–1716. [Google Scholar] [CrossRef]
- Tangjarusritaratorn, T.; Miyazaki, Y.; Sawamura, Y.; Kishida, K.; Kimura, M. Numerical investigation on arching effect surrounding deep cylindrical shaft during excavation process. Undergr. Space 2022, 7, 944–965. [Google Scholar] [CrossRef]
- Burland, J.B. Ninth Laurits Bjerrum Memorial Lecture: “Small is beautiful”—The stiffness of soils at small strains. Can. Geotech. J. 1989, 26, 499–516. [Google Scholar] [CrossRef]
- Jardine, R.J.; Potts, D.M.; Fourie, A.B.; Burland, J.B. Studies of the influence of non-linear stress–strain characteristics in soil–structure interaction. Géotechnique 1986, 36, 377–396. [Google Scholar] [CrossRef]
- Simpson, B. Retaining structures: Displacement and design. Géotechnique 1992, 42, 541–576. [Google Scholar] [CrossRef]
- Castellón, J.; Ledesma, A. Small Strains in Soil Constitutive Modeling. Arch. Comput. Method Eng. 2022, 29, 3223–3280. [Google Scholar] [CrossRef]
- Schanz, T. Zur Modellierung des Mechanischen Verhaltens von Reibungsmaterialien; CRC Press: Boca Raton, FL, USA, 1998. [Google Scholar]
- Schanz, T. Formulation and verification of the Hardening-Soil Model. In Beyond 2000 in Computational Geotechnics; CRC Press: Amsterdam, The Netherlands, 1999; pp. 281–290. [Google Scholar]
- Benz, T. Small-Strain Stiffness of Soils and Its Numerical Consequences. Ph.D. Thesis, University of Sturrgart, Stuttgart, Germany, 2007. [Google Scholar]
- Zhang, W.; Goh, A.T.C.; Xuan, F. A simple prediction model for wall deflection caused by braced excavation in clays. Comput. Geotech. 2015, 63, 67–72. [Google Scholar] [CrossRef]
- Hsiung, B.B.; Likitlersuang, S.; Phan, K.H.; Pisitsopon, P. Impacts of the plane strain ratio on excavations in soft alluvium deposits. Acta Geotech. 2021, 16, 1923–1938. [Google Scholar] [CrossRef]
- Nejjar, K.; Dias, D.; Cuira, F.; Chapron, G.; Le Bissonnais, H. Numerical modelling of a 32 m deep excavation in the suburbs of Paris. Eng. Struct. 2022, 268, 114727. [Google Scholar] [CrossRef]
- Liao, S.; Wei, S.; Shen, S. Structural Responses of Existing Metro Stations to Adjacent Deep Excavations in Suzhou, China. J. Perform. Constr. Facil. 2016, 30, 04015089. [Google Scholar] [CrossRef]
- Di Mariano, A.; Amoroso, S.; Arroyo, M.; Monaco, P.; Gens, A. SDMT-Based Numerical Analyses of Deep Excavation in Soft Soil. J. Geotech. Geoenviron. Eng. 2019, 145, 04018102. [Google Scholar] [CrossRef]
- Brinkgreve, R.B. Selection of soil models and parameters for geotechnical engineering application. In Soil Constitutive Models: Evaluation, Selection, and Calibration; American Society of Civil Engineers: Austin, TX, USA, 2005; pp. 69–98. [Google Scholar]
- Hardin, B.O.; Black, W.L. Closure to “Vibration modulus of normally consolidated clay”. J. Soil Mech. Found. Div. 1969, 95, 1531–1537. [Google Scholar] [CrossRef]
- Potyondy, J.G. Skin friction between various soils and construction materials. Géotechnique 1961, 11, 339–353. [Google Scholar] [CrossRef]
- Duncan, J.M.; Wright, S.G.; Brandon, T.L. Soil Strength and Slope Stability, 2nd ed.; John Wiley & Sons: Hoboken, NJ, USA, 2014. [Google Scholar]
- Brinkgreve, R.; Kumarswamy, S.; Swolfs, W.M. Plaxis 3D Reference Manual Anniversary Edition; Plaxis BV: Delft, The Netherlands, 2015. [Google Scholar]
- Easton, M.R.; Carder, D.R.; Darley, P. Design guidance on soil berms as temporary support for embedded retaining walls. In TRL Report 398; Transport Research Laboratory: Crowthorne, UK, 1999. [Google Scholar]
- Zhang, X.; Sloan, S.W.; Oñate, E. Dynamic modelling of retrogressive landslides with emphasis on the role of clay sensitivity. Int. J. Numer. Anal. Methods Geomech. 2018, 42, 1806–1822. [Google Scholar] [CrossRef]
- Ghaderi, A.; Abbaszadeh Shahri, A.; Larsson, S. A visualized hybrid intelligent model to delineate Swedish fine-grained soil layers using clay sensitivity. Catena 2022, 214, 106289. [Google Scholar] [CrossRef]
- Feng, H.; Liu, X.; Cai, G.; Duan, W. Applicability and improvement of soil classification methods in Delta regions based on the CPTU database. Mar. Geores. Geotechnol. 2023, 41, 1265–1274. [Google Scholar] [CrossRef]
- Nguyen, T.D.; Khin, P.S.; Pham, Q.N.; Vu, A.T. A comparative study on CPTu-based soil classification methods: Case studies. In Cone Penetration Testing 2022; CRC Press: Boca Raton, FL, USA, 2022; pp. 610–616. [Google Scholar]
- Ghaderi, A.; Abbaszadeh Shahri, A.; Larsson, S. An artificial neural network based model to predict spatial soil type distribution using piezocone penetration test data (CPTu). Bull. Eng. Geol. Environ. 2019, 78, 4579–4588. [Google Scholar] [CrossRef]
- Van Hoesen, J. A Geographic Information Systems (GIS)-Based Approach to Derivative Map Production and Visualizing Bedrock Topography within the Town of Rutland, Vermont, USA. ISPRS Int. J. Geo-Inf. 2014, 3, 130–142. [Google Scholar] [CrossRef]
- Abbaszadeh Shahri, A.; Kheiri, A.; Hamzeh, A. Subsurface Topographic Modeling Using Geospatial and Data Driven Algorithm. ISPRS Int. J. Geo-Inf. 2021, 10, 341. [Google Scholar] [CrossRef]


Disclaimer/Publisher’s Note: The statements, opinions and data contained in all publications are solely those of the individual author(s) and contributor(s) and not of MDPI and/or the editor(s). MDPI and/or the editor(s) disclaim responsibility for any injury to people or property resulting from any ideas, methods, instructions or products referred to in the content. |
© 2024 by the authors. Licensee MDPI, Basel, Switzerland. This article is an open access article distributed under the terms and conditions of the Creative Commons Attribution (CC BY) license (https://creativecommons.org/licenses/by/4.0/).