Article

Study on the Effect of the Undercut Area on the Movement Law of Overburden Rock Layers in the Block Caving Method

by
Xiushan Qin
1,2,
Xiaocong Yang
2,
Zhonghao Liang
1,
Hui Cao
1,* and
Liu Xu
1
1
School of Civil & Environment Engineering, University of Science and Technology Beijing, Beijing 100083, China
2
BGRIMM Technology Group, Beijing 100160, China
*
Author to whom correspondence should be addressed.
Appl. Sci. 2024, 14(11), 4704; https://doi.org/10.3390/app14114704
Submission received: 9 May 2024 / Revised: 20 May 2024 / Accepted: 20 May 2024 / Published: 30 May 2024

Abstract

:
We chose to study the bottom structure stress evolution law in the process of undercut area advancement via the block caving method, reveal the influence law of the undercut rate on the effect of the ore body caving process, and assess the floor stress evolution law in the process of the undercut area with a different undercut rate in order to guide the production of a natural disintegration method under horizontal ground stress and also provide some reference value for rock damage assessment. According to the actual engineering and physical parameters of the mine, a numerical simulation model was created by using finite discrete element software GPI-3D-FDEM, and the Neo–Hookean hyperelastic constitutive model was adopted for calculation purposes. The simulation process follows a backward bottoming approach and monitors and analyses the stress state of the substructure after each bottoming step. The indoor physical model is employed to conduct similar two–dimensional simulation experiments on similar materials, investigating the motion laws of overlying rock layers. The research findings indicate that as bottom blasting progresses, a gradual concentration of compressive stress occurs in the foundation structure ahead of the advancing line. If this stress surpasses the rock mass’s shear failure limit, ground pressure failure may ensue. During mineral extraction from the bottom, internal stress within the fractured fault zone significantly diminishes compared to adjacent rock and ore deposits.

1. Introduction

The economic growth of any nation is underpinned by the availability of metal mineral resources, which play a pivotal role in sectors such as construction, manufacturing, transportation, aerospace, and electricity [1,2]. Projections indicate that the global demand for key mineral resources like iron, copper, and aluminum will continue to surge in the next 10–15 years, specifically from 2030 to 2035 [3]. Despite China ranking third in the world in terms of total mineral resources, accounting for approximately 12% of the global share, the per capita possession of these resources stands at only 58% of the global average, placing the country at 53rd globally. Notably, the lower grades of crucial minerals like copper and iron ore have increased China’s reliance on these resources [4], making the secure supply of mineral resources a direct determinant of the country’s economic progress.
The block caving method, renowned in the industry as the “Underground Rock Factory” [1], offers economic benefits comparable to open–pit mining [5,6]. For deposits with low grades and large reserves, block caving is the preferred method of extraction [7]. Under suitable conditions, this approach can significantly reduce mining costs and activate mineral resources that are uneconomical and untapped due to their low grades [8,9,10]. This holds significant importance for reducing dependence on foreign mineral resources and ensuring the reliability of resource supply [11,12]. Rock masses refer to geological bodies composed of blocks of different lithologies and structural planes of various scales and types. Due to the constraints of metallogenic conditions, the distribution of the natural metal ore body is often irregular, enriched with a large number of primary structural planes such as joints, fissures, and faults during tectonic evolution. Under the disturbance of blasting bottom pulling [13], on one hand, existing structural planes within the ore body extend and connect, forming macroscopic fracture planes. On the other hand, due to stress redistribution, the internal stress of the ore–bearing rocks near the free face exceeds its own strength, further crushing the ore body. The crushed ores will further squeeze, slide, and rotate each other, and the unsupported and collapsed ore body collapses under its own weight. This complex mechanical behavior of the ore body during undercut caving mining is difficult to describe through theoretical analysis [14]. Scholars, both domestically and internationally, have investigated the theoretical methods concerning the stability and ground pressure manifestation of the bottom structure in natural collapse methods and the stress evolution of the overlying rock layer. Truemar et al. [15,16,17] examined the influence of the bottom pulling method, tectonic stress, bottom structure height, and other factors on the bottom structure in natural collapse methods, proposing control measures. Ding Yimin [18] analyzed the characteristics of stress changes in the bottom structure during natural chipping mining by monitoring stress during bottom pulling and chipping in the Copper Mine Valley mine. When studying and analyzing it, it is necessary to start from existing natural geological conditions, gradually progressing from macroscopic analysis to microscopic research, considering the impact of engineering activities. Various research methods are used to accurately predict the deformation of engineering rock masses and evaluate their stability [19,20].
Currently, research into engineering problems related to rock bodies primarily relies on numerical simulation and physical experimentation alongside other methodologies. Among these, numerical simulation offers an intuitive simulation of crack expansion and rock damage processes. It effectively models the mechanical responses of rock bodies to environmental changes and engineering activities, being particularly suited to scrutinizing rock mechanics from a microstructural perspective [21]. Traditional finite element (FEM) and finite difference (FDM) methods fall short in capturing rock crack propagation, as well as the movement and rotation of fragmented rock masses, thus hindering the simulation of ore body collapse processes [22]. Moreover, discrete element simulations often inadequately represent fissures within surrounding rocks. Computational constraints necessitate the use of large mesh sizes, failing to reflect the diffuse damage and rupture mechanics of rock bodies. Additionally, most discrete element simulations employ planar strain models, lacking three–dimensional fidelity [23]. Fan et al. [17,24] employed three–dimensional numerical difference simulations to investigate the stability of bottom structures in natural chipping mining processes, specifically under pre–excavation conditions, offering pertinent support recommendations. Lu et al. [25] observed stress concentration in bottom structure areas, such as roadway intersections, as mining progressed, potentially leading to roadway damage. Xia et al. [26,27] employed FLAC3D simulation software to establish numerical models combined with the pressure arch theory, exploring the evolution of pressure arches during the bottom collapse process in block caving methods. However, the finite element–discrete element coupling method (FDEM), combining the advantages of continuum and discontinuum methods, seamlessly transitions from continuous to discontinuous mediums through deformation, fracture, and fragmentation, thereby simulating the damage and fracture processes of rocks [28,29]; meanwhile, its numerical models directly correlate with the microscopic mechanical parameters of rocks [30]. Su et al. [31,32] consider physical simulation experiments on engineering rock masses to be an important method for studying rock engineering problems, with the selection of materials for physical models being crucial for the success of experiments. Wang et al. [33], based on similarity simulation experiments, investigated the influence of newly constructed coal bins on the movement of underlying rock layers and the strain characteristics of surrounding rocks. Dong et al. [34], through similarity material simulation tests on the block caving method in lean ore deposits, obtained the collapsibility, collapse mechanism, and collapse rate during the bottom extraction process, providing necessary theoretical basis for the design and construction of the block caving method in lean ore deposits in Jinchuan. Li et al. [35,36,37] found that after the stable structure formation of side–by–side accumulations, under the influence of overlying rock movement, the movement of overlying rock may lead to phenomena such as the squeezing of side–by–side accumulations into roadways.
In the actual production of natural collapse method mines, the advancement of bottom pulling blasting under horizontal geostress has resulted in the evolution of bottom structure ground pressure disasters, characterized by repeated pressure. However, previous research has not fully revealed the evolution, characteristics, and mechanisms of bottom structure ground pressure disasters in natural collapse methods. This study utilized GPI-3D-FDEM (Enhanced 3D Finite Element–Discrete Element Coupling Analysis Method Based on GPU Parallel Computing) to simulate the collapse characteristics of the No. II ore body in Tong Shan Mine under various bottom excavation conditions. After reviewing the current research landscape regarding the use of similar materials in physical simulations of engineering rock formations, we applied the principle of similarity to conduct simulation tests on the chipping phenomenon. Our analysis comprehensively examines stress and displacement variations throughout the entire avalanche process, aiding in establishing a rational bottom pulling scheme and sequence. This investigation also identifies the initial area of avalanches and areas of sustained avalanches. Additionally, our study elucidates the impact of bottom pulling rates on ore body avalanche characteristics, the evolution of bottom plate stress under different pulling rates, and the effect of natural avalanche mining on ground surface settlement within the study area. These findings are crucial for guiding avalanche mining practices, not only for Tongshan Mine No. II but also for other ore bodies employing the chipping method.

2. Three–Dimensional Numerical Simulation Analysis

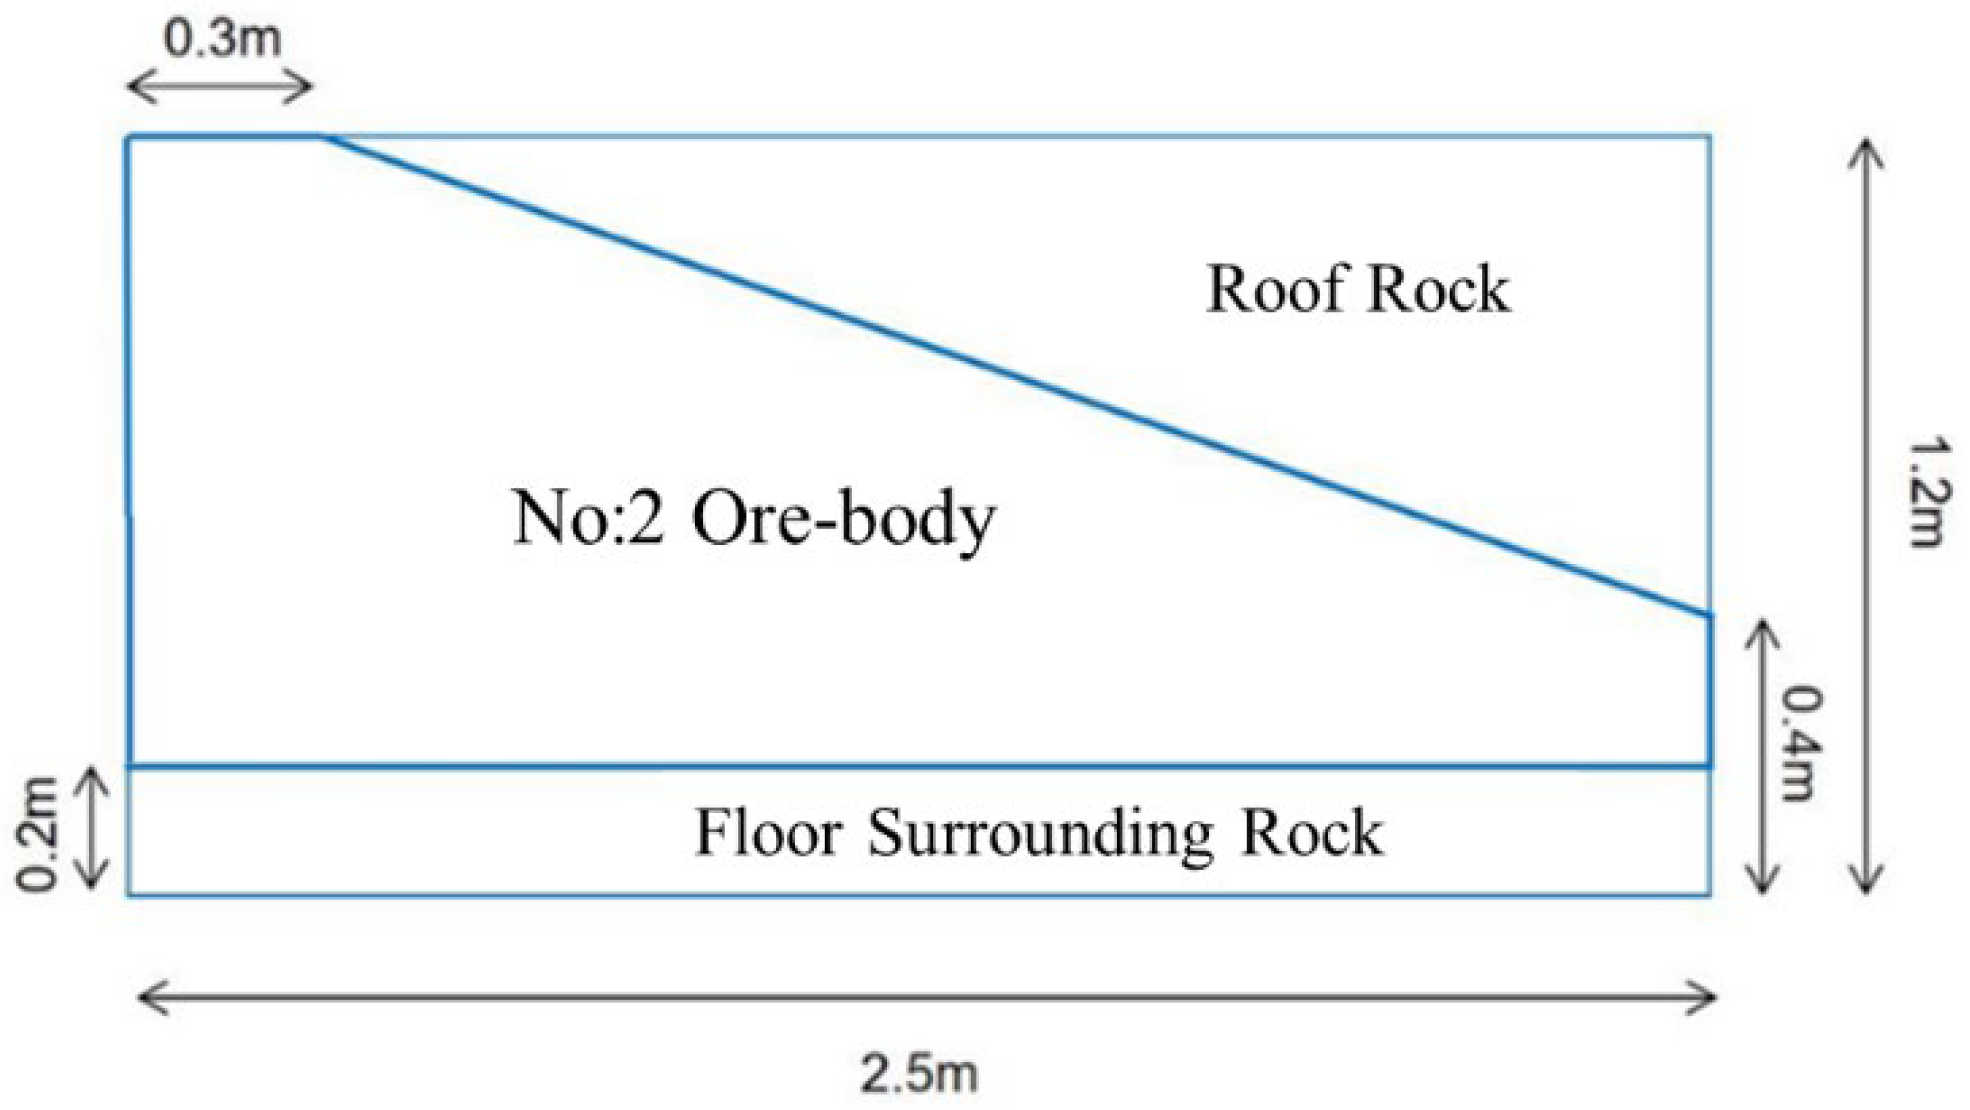
2.1. Engineering Overview

Heilongjiang Duobaoshan Mining Co., Ltd., Duobaoshan Town, Nenjiang County, Heihe City, Heilongjiang Province, China. hosts a large–scale copper deposit characterized by porphyry–type, shallow–formation, medium–temperature hydrothermal processes. Its No. II body represents a concealed ore deposit dominated by sulfide ores. Situated within the first lithological unit of the Duobaoshan Formation on the upper plate of the Copper Mountain Fault, this deposit consists of chlorite–sericite–altered andesite or andesitic volcanic debris, spanning elevations from 513.8 to −285.2 m. The No. II ore body is characterized by a long strip, in plate and lens form, with a control length of 2000 m and a maximum horizontal thickness of 174.6 m. The No. II ore body Cu grade 0.2% or more is 5991.06 × 104 t, the Cu metal is 309,293.49 t, and the Cu average grade is 0.52%. Its orientation tends towards 210°, with dip angles ranging from 30° to 70°, occasionally reaching a maximum of 79°. Figure 1 depicts the study area of the Tongshan Mine No. 2 ore body, illustrating both the plan view and a simplified characteristic profile.
The majority of the ore body in Tongshan Mine No. 2 exhibits an overall block structure characterized by excellent stability. However, the combined effects of weathering and tectonic activity have resulted in the formation of distinct geological features within certain regions of the deposit. These include loose rock zones within the fourth geological system, extensive weathering zones within the bedrock, fractured areas along fault lines, and densely populated zones of joints and fissures. This geological profile categorizes the deposit as having moderate engineering geological conditions of the block rock type, with straightforward hydrogeological conditions characterized by fissure aquifers filled with water.

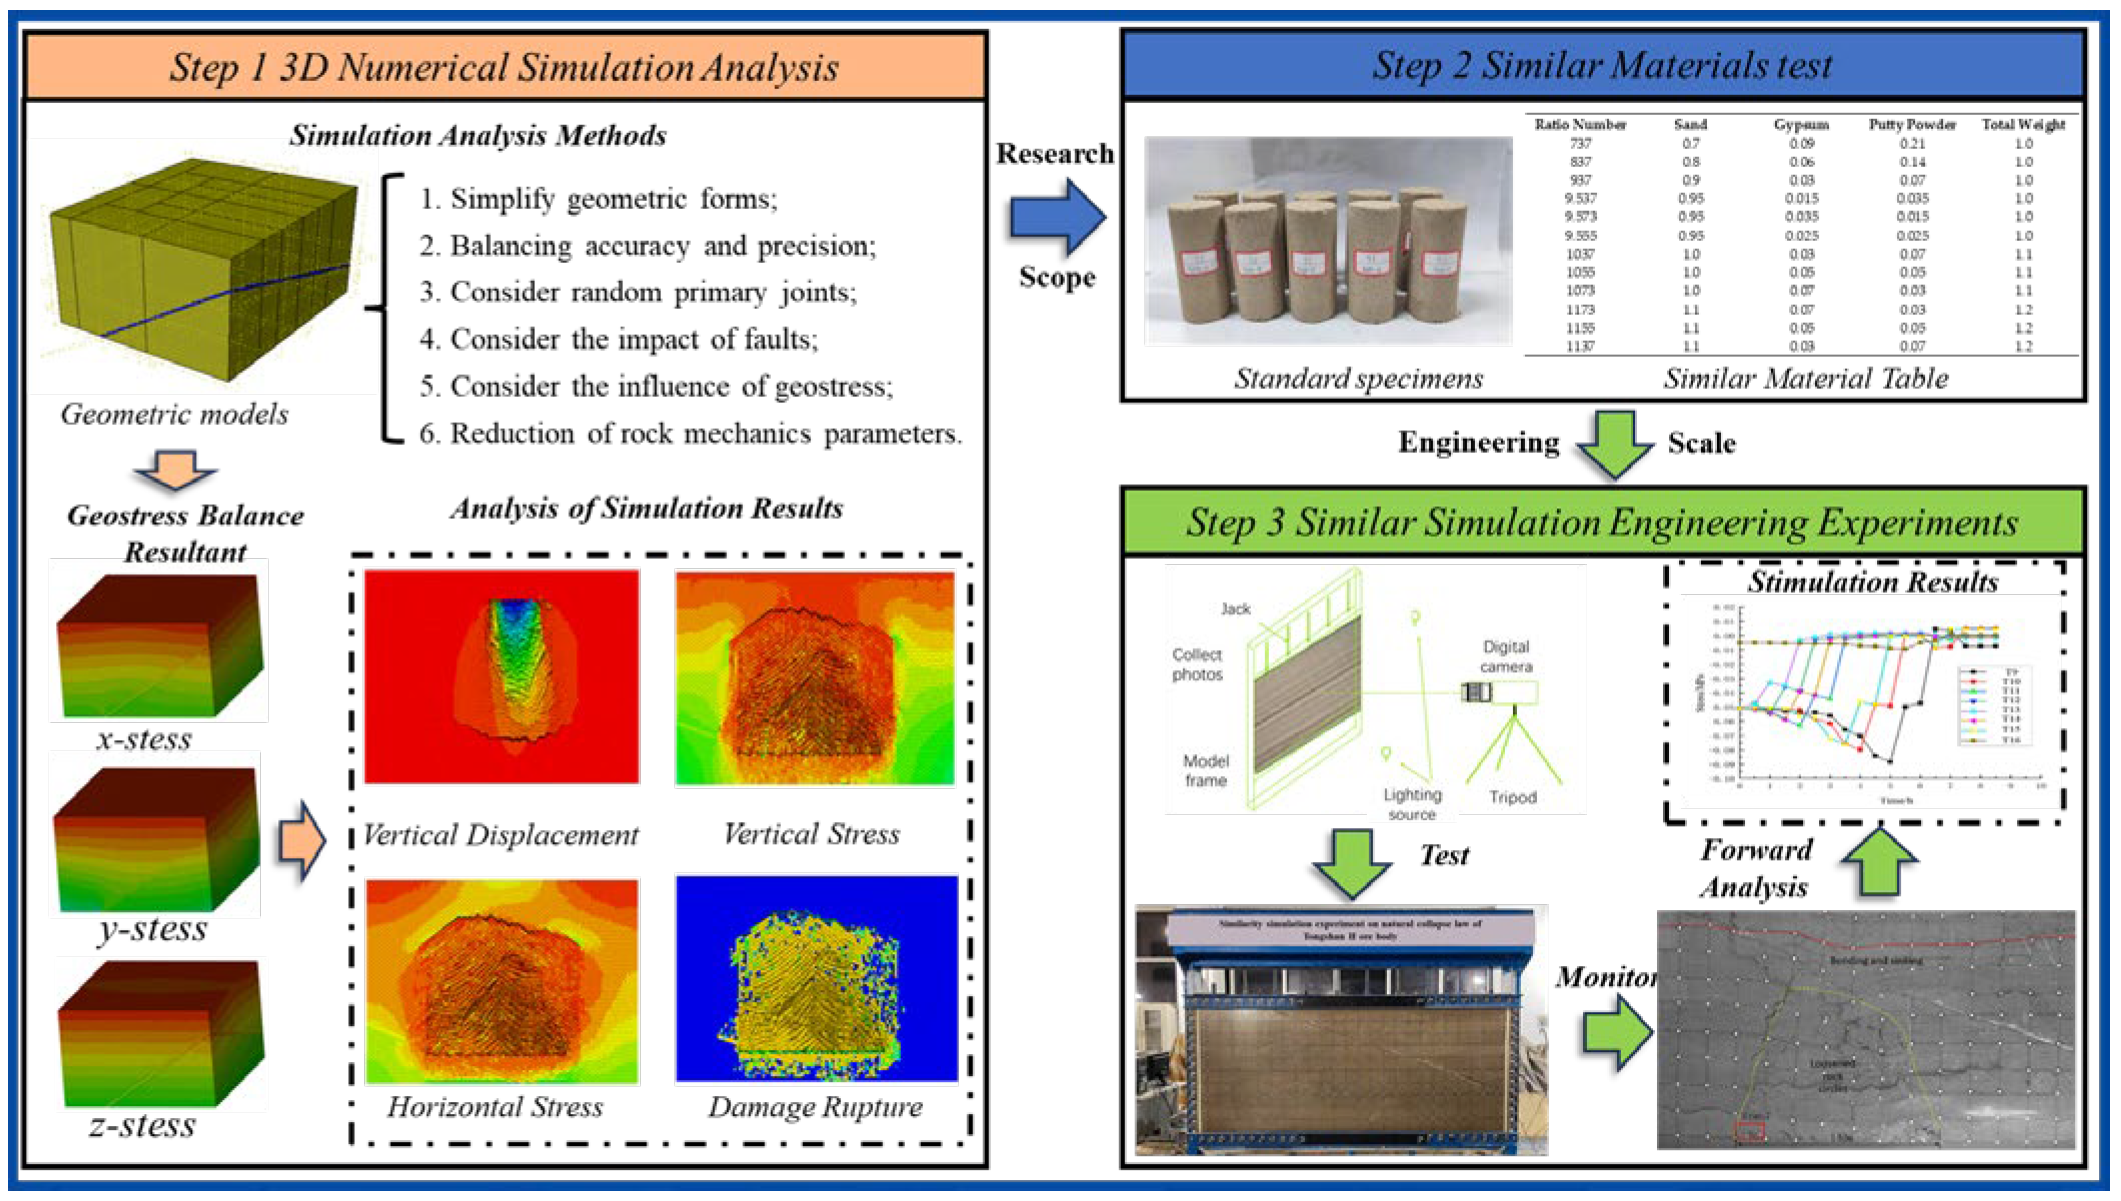
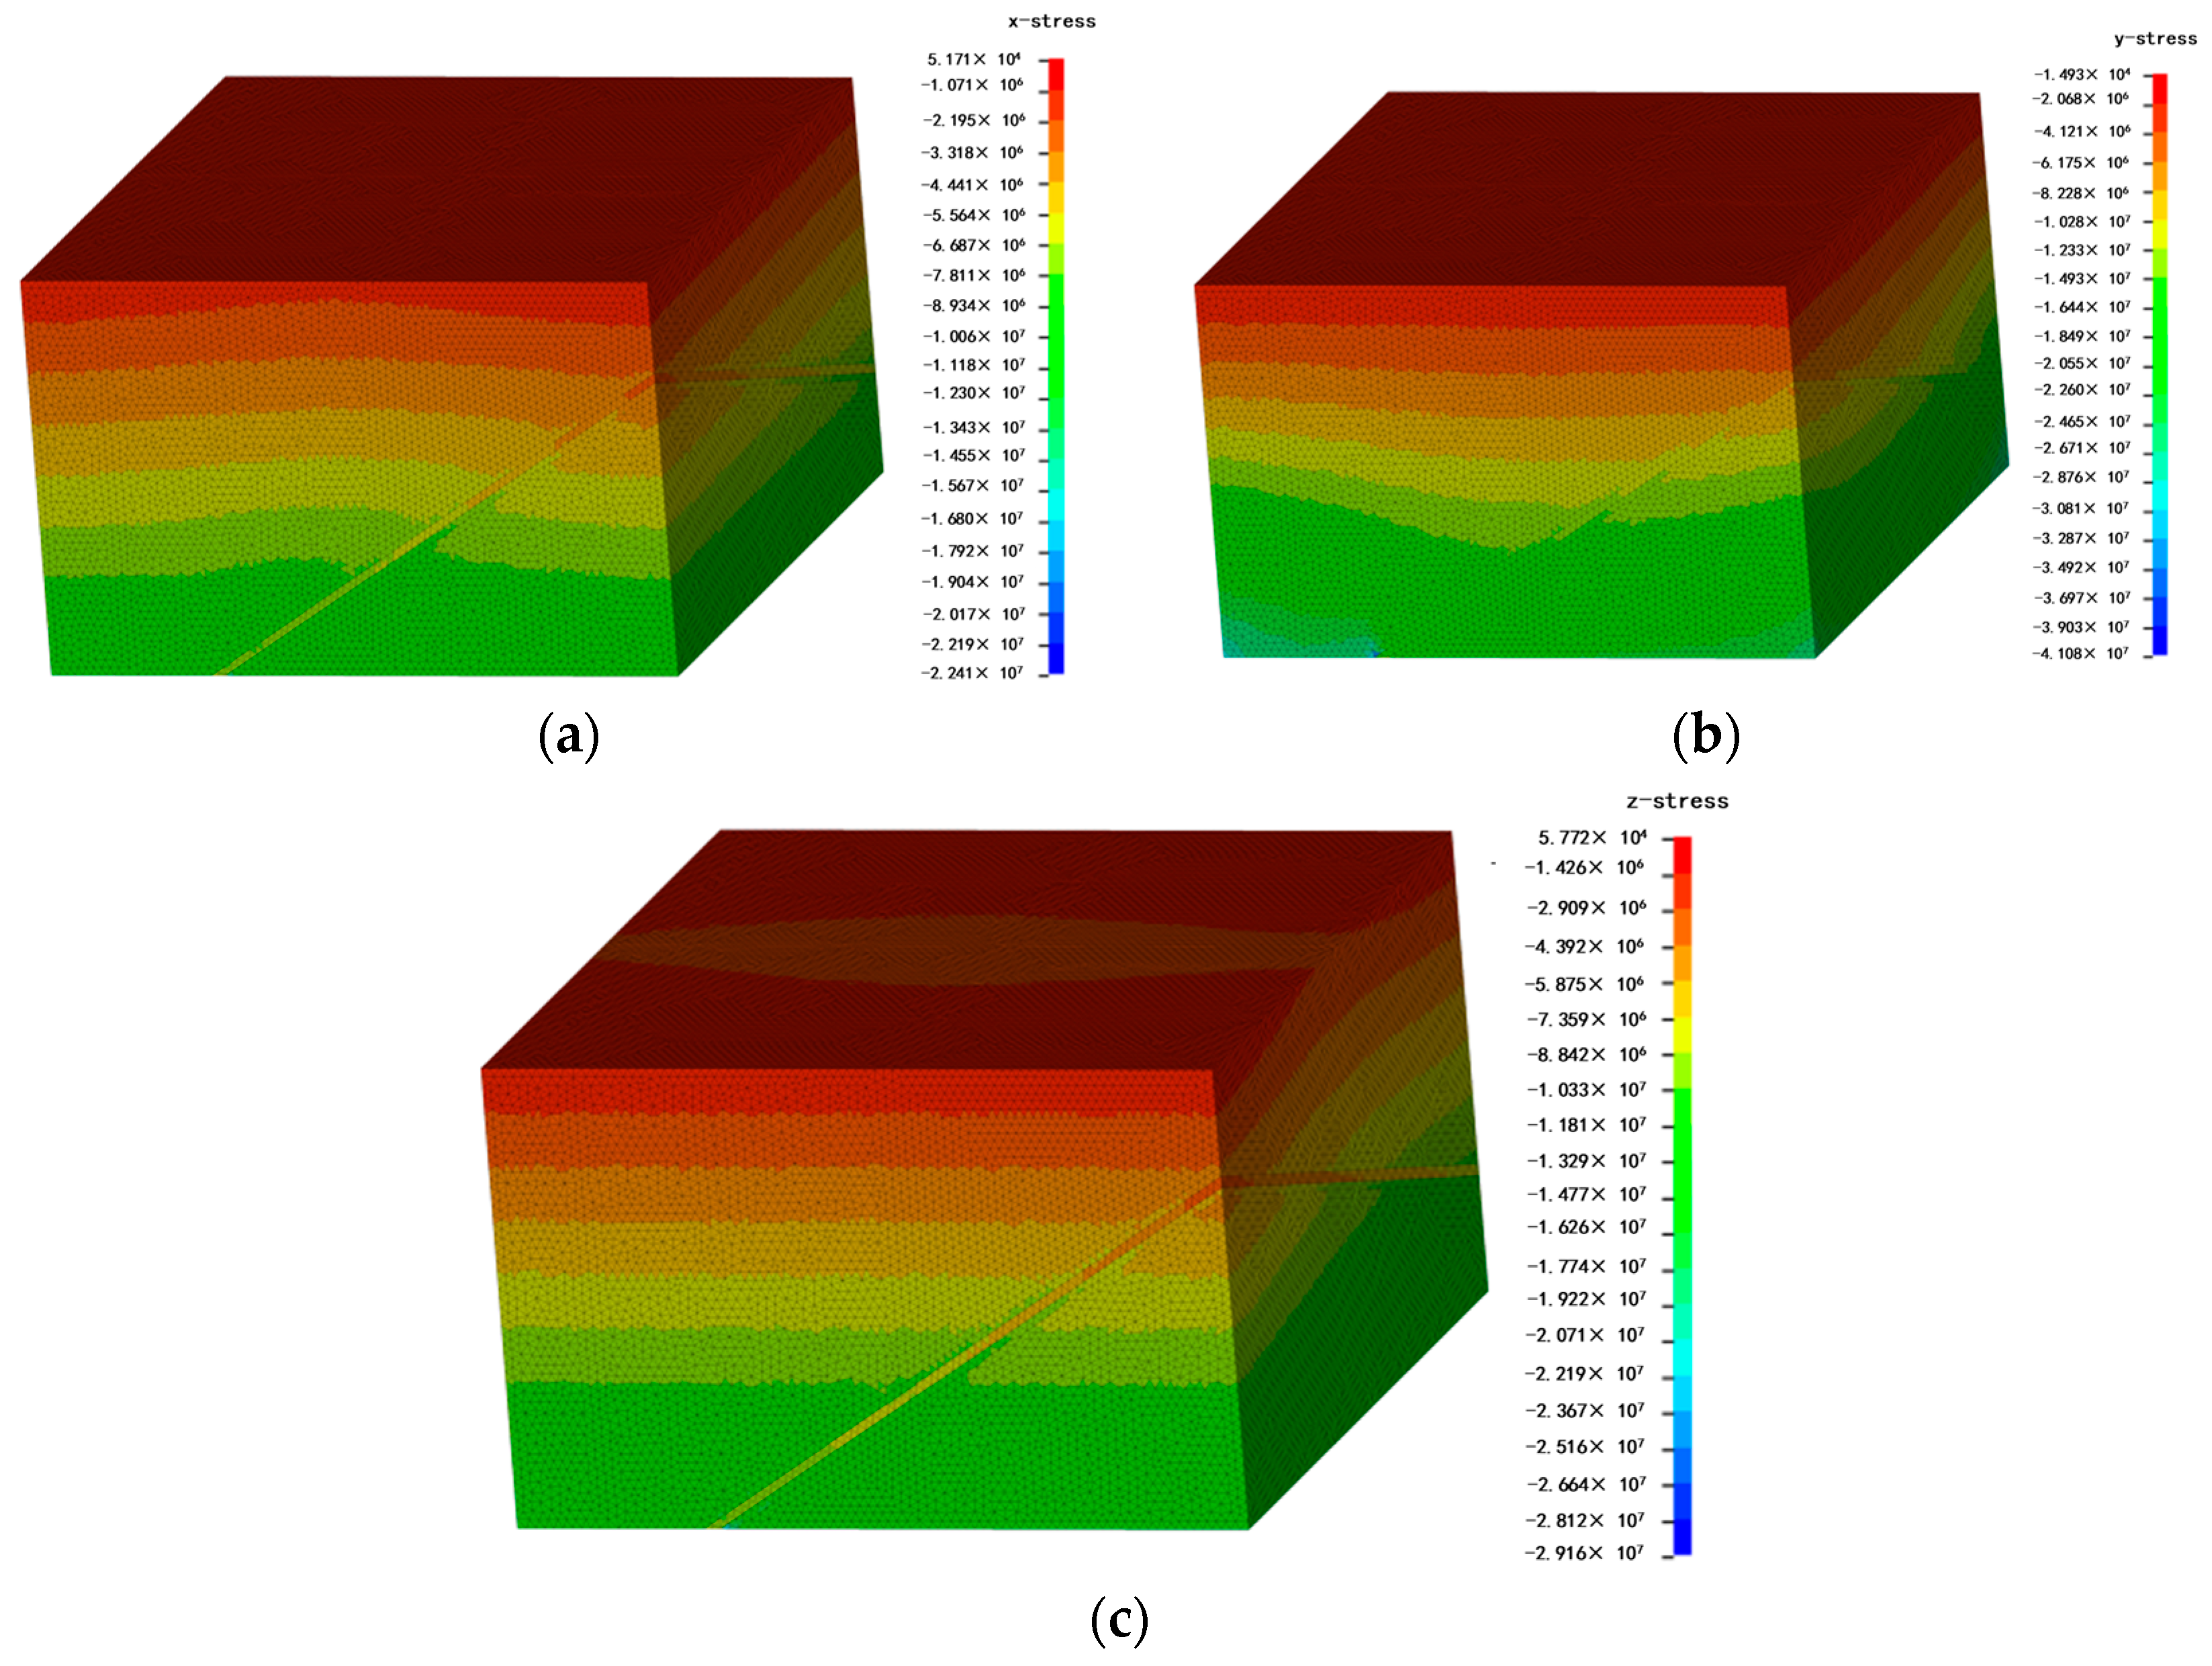
2.2. Simulation Scheme

The preliminary geological investigation data, in conjunction with the study area’s pull–down plan, indicate that the pull–down profile is situated at a vertical elevation of 70 m. Consequently, the area above elevation 0 is considered the study object in the actual modeling, and no air–mining zone exists in the area. The No. II ore body, located between elevations of −100 and +300 m and exploration lines of 1076 and 1098, is employed as the collapsed object to construct a three–dimensional numerical model. To ensure both simulation accuracy and computational efficiency, a balanced approach is taken in constructing the computational model. Commencing from the central plane of the ore body, bottom extraction is initiated, proceeding in a progressively expanding square pattern. At each stage of bottom extraction, considerations extend to the ore discharge’s influence. This study delineates the initial avalanche area and subsequent areas of avalanche progression until the entirety of the ore body’s horizontal extent is subjected to bottom extraction. Examination encompasses stress concentration patterns on the bottom plate and the resulting damage morphology within the fallout area. The flow chart of the proposed method is shown in Figure 2.

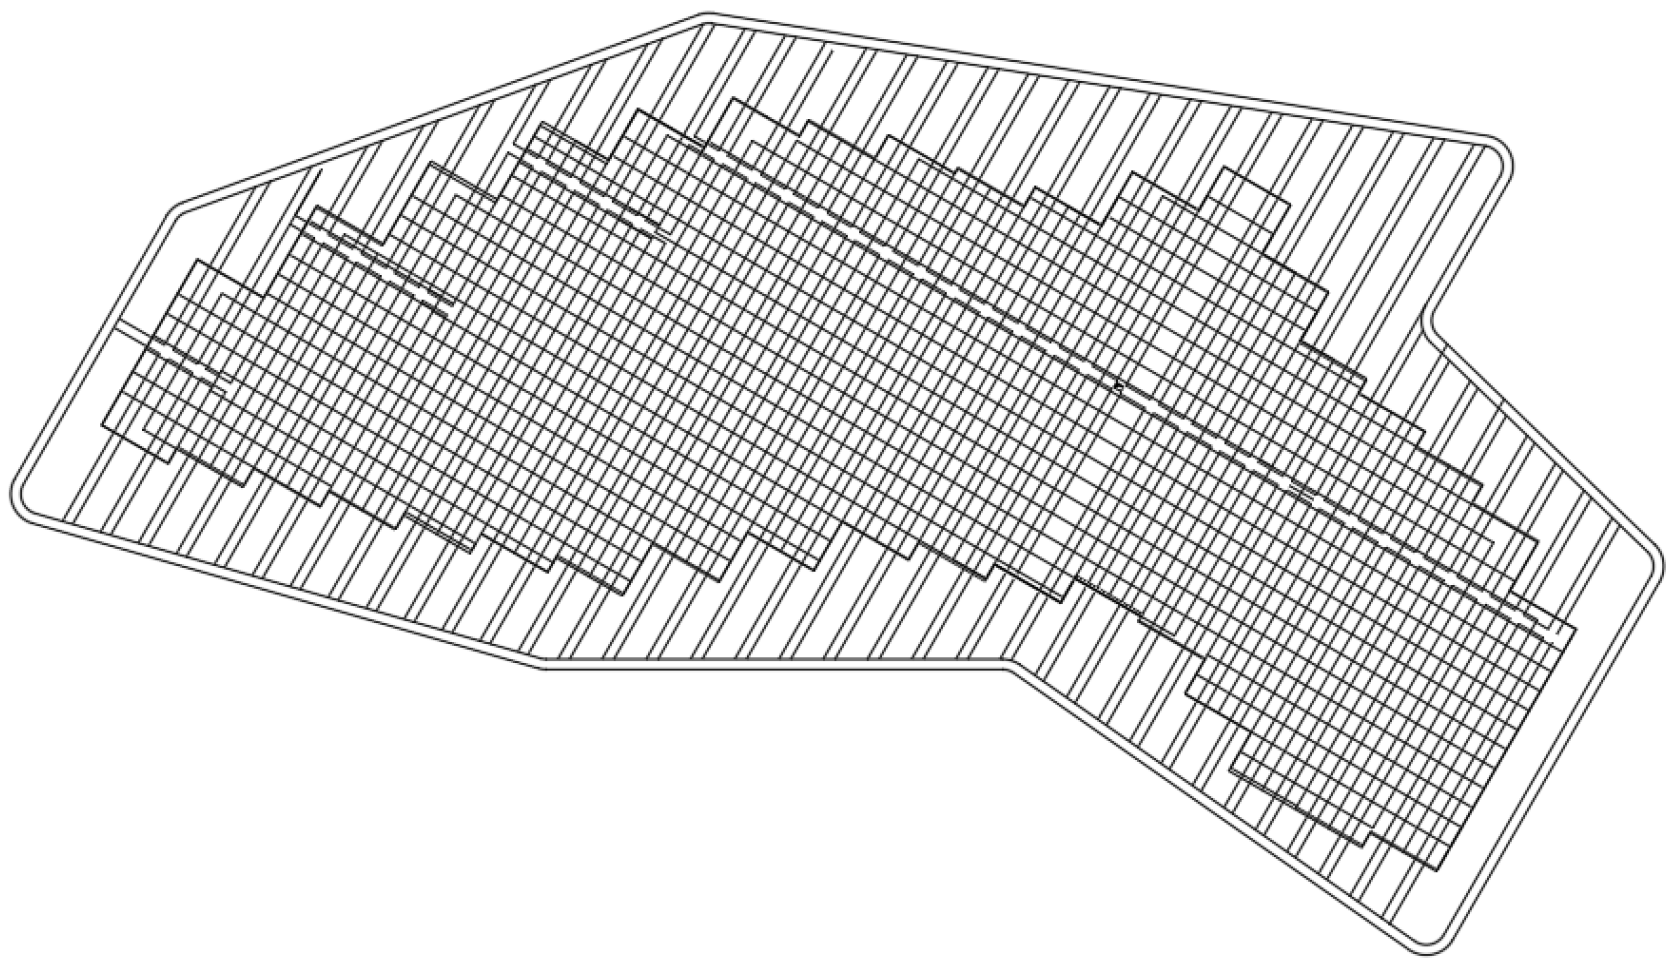
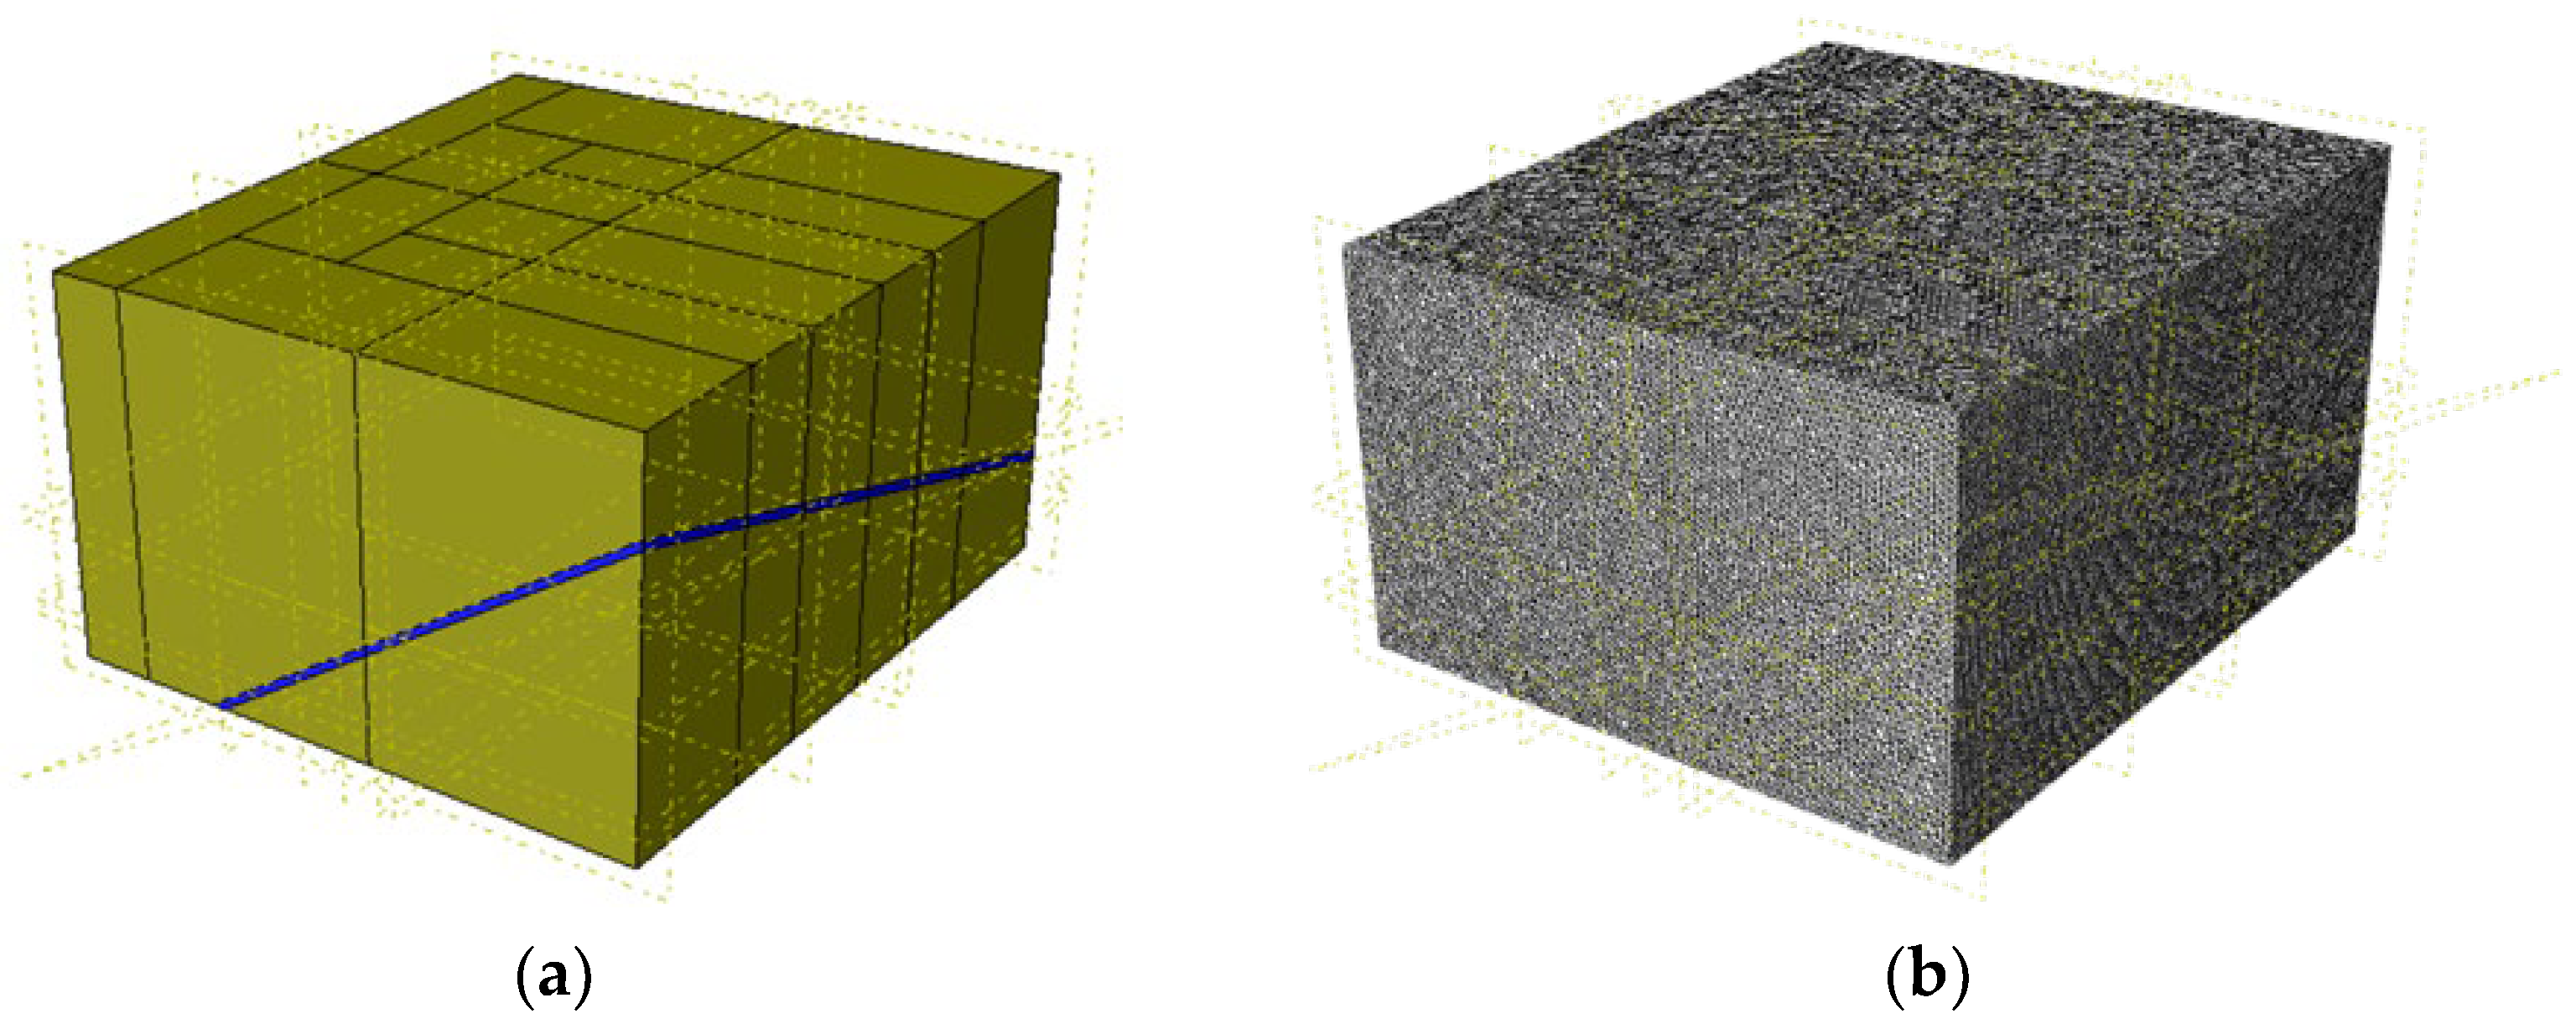
2.3. Three–Dimensional FDEM Numerical Modeling

The software uses the Chinese Academy of Sciences Wuhan geotechnical preparation and development of limited-discrete analysis software, copper mountain mine II ore body natural avalanche mining three-dimensional simulation using numerical model based on GPI-3D-FDEM, the model mainly contains the rock body, ore body, direction of stochastic primary joints, the interface between the rock body and the ore body in the three-dimensional FDEM model, as well as the method of geo-stress equilibrium, the way of bottoming pulling, the rate of bottoming pulling, the way of releasing ore, releasing rate and unit size selection and so on. The model mainly contains the characterisation of the interface between the rock body and the ore body in the 3D FDEM model, as well as the method of stress balance, the bottom pulling method, the bottom pulling rate, the ore release method, the ore release rate, and the selection of unit size. To observe the morphological changes in the fallout arch during the bottoming process of the entire Copper Hill Mine II ore body, the overall model geometry and grid model are illustrated in Figure 3a and Figure 3b, respectively. These Figures encompass both the ore body and surrounding rock formations. In the geometric model (Figure 3a), the short black line represents the intersection line between the random jointing surface and the model boundary. The yellow entity represents the overall structure of the geometric model, while the blue entity represents the fractured zone of the rock mass. The grid model is shown in Figure 2b, and the overall structure is black. And the grid model dimensions are 910 m × 798 m × 500 m, with a cell size of 10 m. The model comprises 3,180,899 tetrahedral solid cells, totaling 9,606,325 cells.
In this study, the mechanical parameters of the engineering rock body, obtained from previous studies and analyses, indicate that the surrounding rock consists of two types: the andesite group and the tuff group, whose lithological mechanical properties are very similar. Additionally, the Copper Hill Mine II is a new mine, and no airspace exists in the study area. For the simulation of the engineering surrounding rock, it is regarded as a single lithology. The mechanical properties of the rock body are considered to be the average values of the mechanical properties of the andesite group and the tuff group. The joint spacing in this simulation model is larger than the actual rock joint spacing. Therefore, based on the model’s joint spacing, the rock mechanical parameter analysis method is used to determine the input parameters for the model, as outlined in Table 1.
The geostress equilibrium method utilized determines the distribution law of geostress, as depicted in the 3D numerical model in Figure 4. Due to a 30° angle between the previous project’s exploration profile and the horizontal direction, as indicated by geostress measurements from drill holes ZK10781 and ZK11121 in previous exploration data, the horizontal principal stress direction in the mining area is oriented North–South (NS) and West–East (WE). Therefore, it is imperative to incorporate geostress boundary conditions into the numerical model by rotating the coordinates appropriately. The resulting geostress equilibrium, depicted in Figure 4, aligns with theoretical expectations, with the y–direction representing the vertical orientation.
The simulation approach employs a fixed concentric square expansion rate for bottoming. This study details a simulation method that directly controls the removal of ore body units within the bottoming area within the program, as opposed to pre–cutting the bottoming area for each step in the model. Once stability is achieved after the previous step’s bottoming, the program orchestrates the concentric expansion of the bottoming area in the previous step based on the square’s concentric expansion. Bottoming progresses step by step within the defined range until the entire ore body has been bottomed. The principle guiding the bottoming process is centered on the shape’s center falling within the bottoming range. If it lies outside this range, it is excluded from consideration. To optimize computation, a bottoming rate of 12 m per step is utilized, with the center of the square bottoming area serving as the origin. The ore body’s length exceeds 500 m, while its width is under 150 m. Consequently, during simulation, bottoming is confined to the ore body’s interior. If the bottoming area surpasses the ore body’s width, bottoming proceeds only along the ore body’s length. Each bottoming step includes two ore releases, with the process advancing to the next step once equilibrium is attained.

2.4. Analysis of Simulation Results

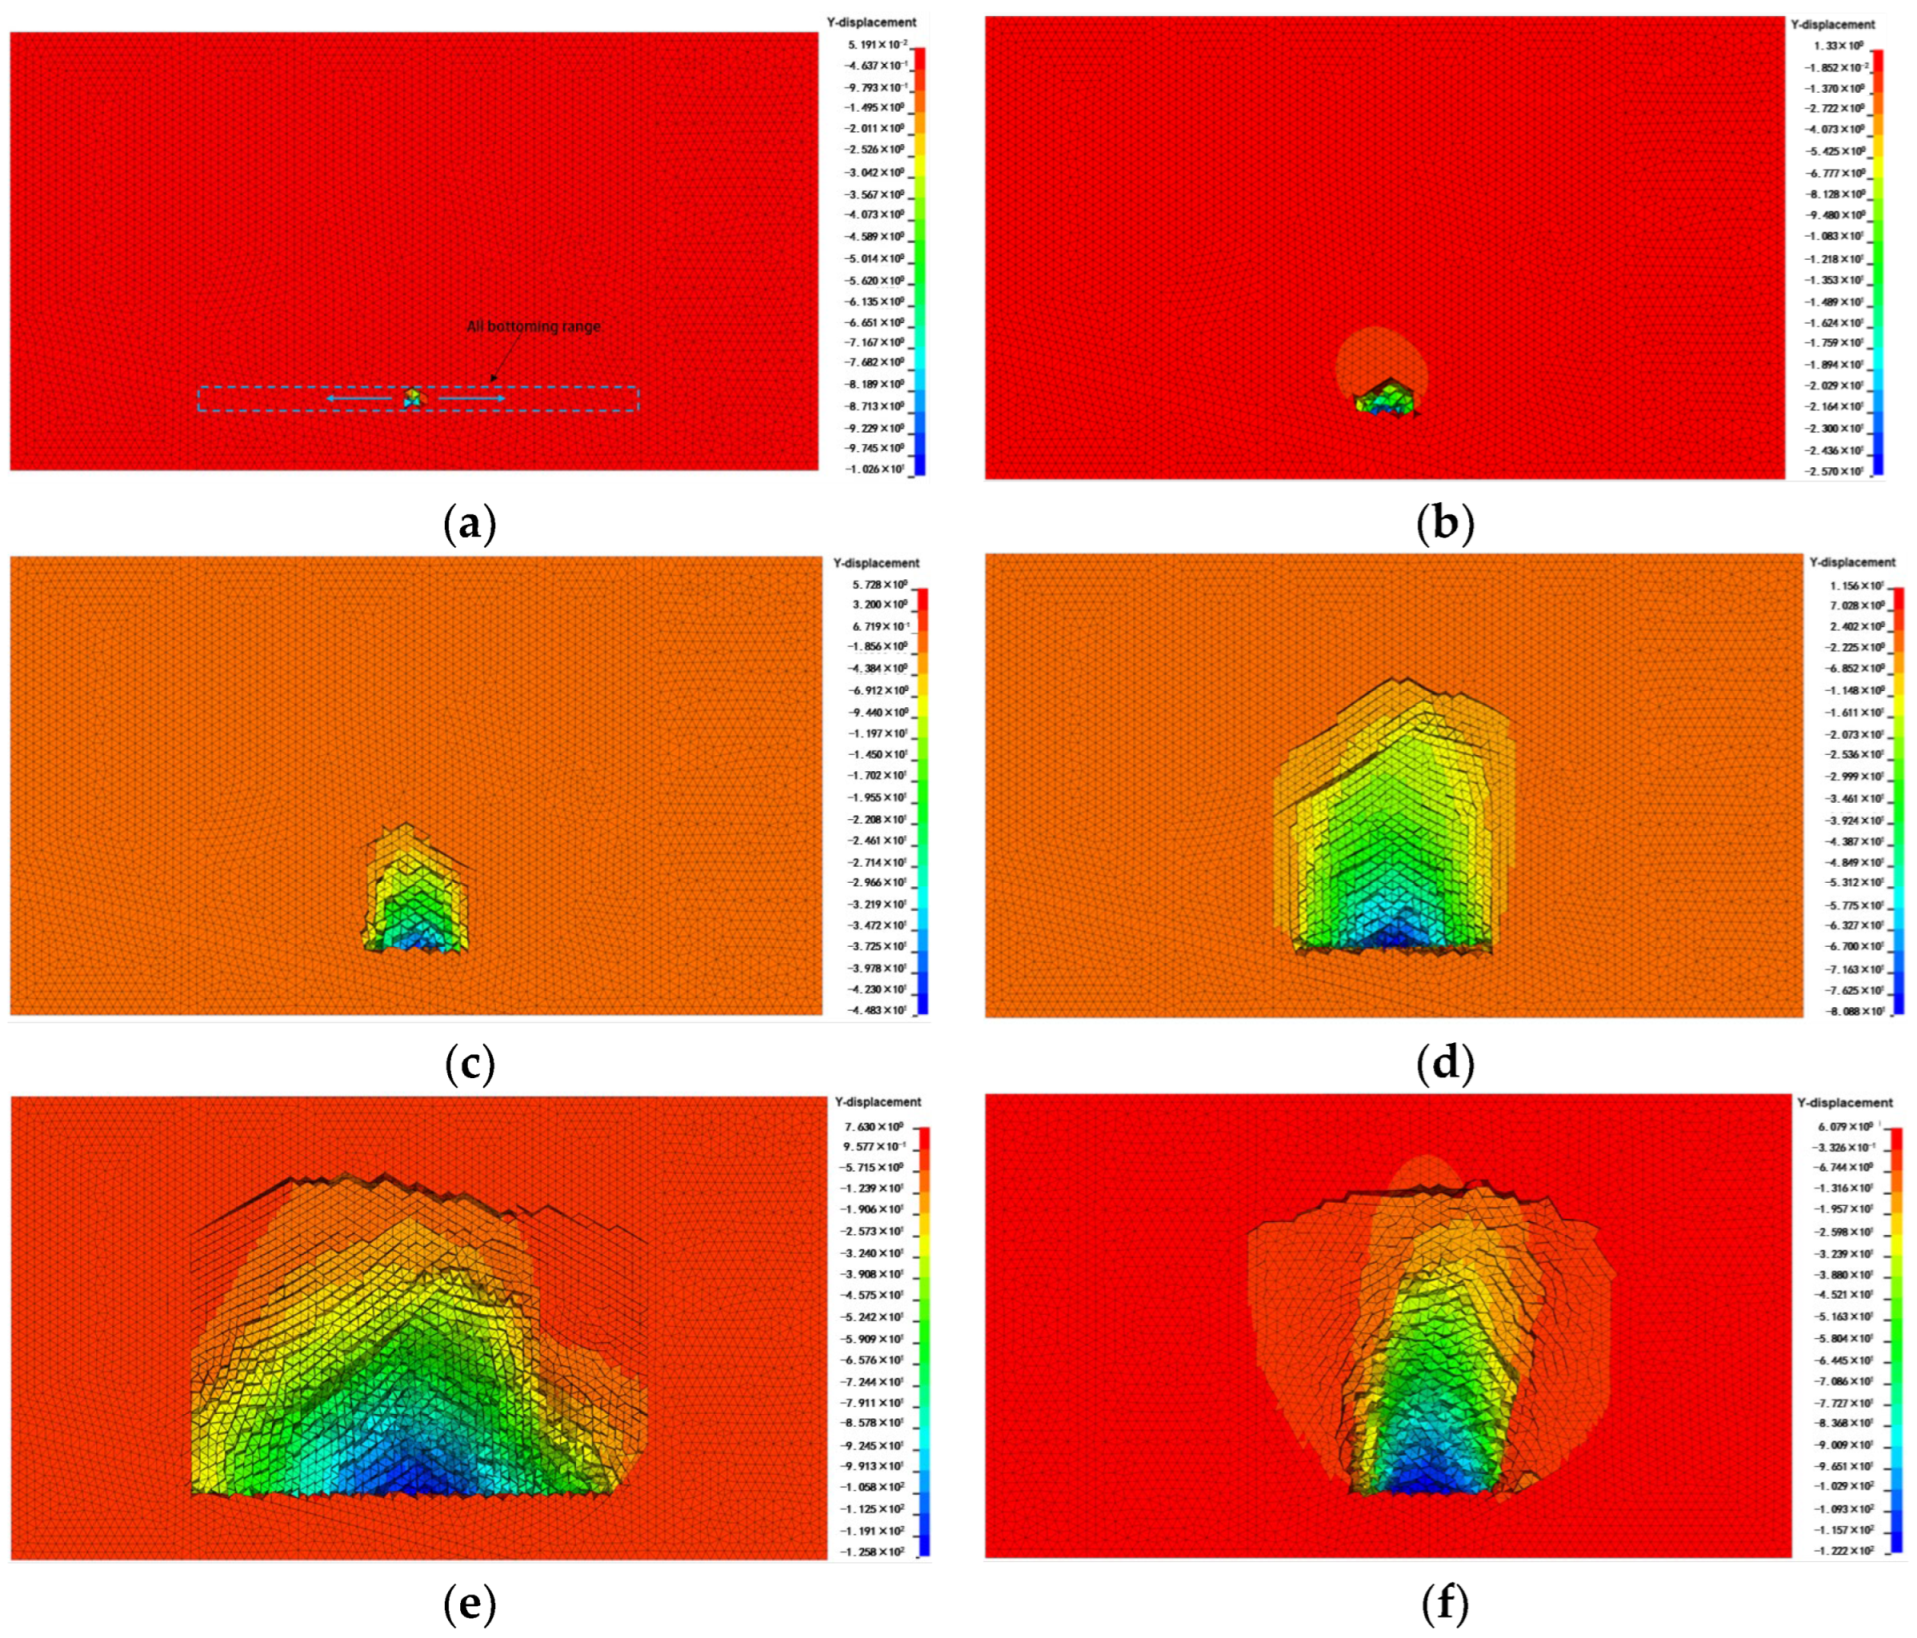
2.4.1. Vertical Displacement Evolution Law

The provided diagrams illustrate the collapse effect of the first five bottoming steps relative to the entire ore body. Both the initial collapse area and the continuous collapse area are relatively small. Vertical displacement cloud diagrams are employed to clearly delineate the collapse range. Figure 5a–d demonstrate that the initial stage of bottom pulling primarily involves collapsing the crushed ore body within the 20 m undercut area, with insignificant rupture of the top plate. Local rupture of the top plate occurs during the third step of bottom pulling. Following the collapse of part of the ore body, the top plate stabilizes, indicating the attainment of the initial crumbling state. The initial crumbling area measures approximately 5184 m2. As ore continues to be released from the bottom pull, the rupture of the top plate expands but remains stable. The range of the top plate rupture continues to expand with ongoing bottom pulling and ore release, yet it remains stable. After the second release of bottom pulling in the fifth step, the height of the top plate rupture exceeds 120 m. The accumulation body’s height is much greater than the bottom pulling height (20 m). Moreover, the gap between the accumulation body and the falling vault is indistinct, indicating the onset of continuous collapse. The area of continuous collapse spans approximately 14,400 m2. Figure 5d–f reveal that when the undercut area is small, the upper crushed ore body is squeezed by the two gangs of ore body due to initial ground stress, resulting in the minimal vertical displacement of the crushed ore body and no obvious formation of an ore pile–roof plate separation phenomenon. As the bottom pulling range expands, the squeezing force between the broken ore body cannot support its weight, leading to collapse. Consequently, the area of the fallen ore body gradually expands. Subsequent bottom pulling and ore release further increase the area of the broken ore body. By the 15th step, bottom pulling is complete, causing the complete destruction of the ore body above the bottom pulling area, extending the rupture area to the rock body above. With the completion of bottom pulling, the entire ore body is sufficiently crushed, resulting in the large–scale collapse of the rock body above it, forming a distinct fall arch. The upper rock body does not continuously fall to the surface because ore release ceases after bottom pulling is completed. The collapsed accumulation body supports the fall arch, thereby limiting the collapse of the upper rock body. Continuous collapse would occur if ore release were initiated.

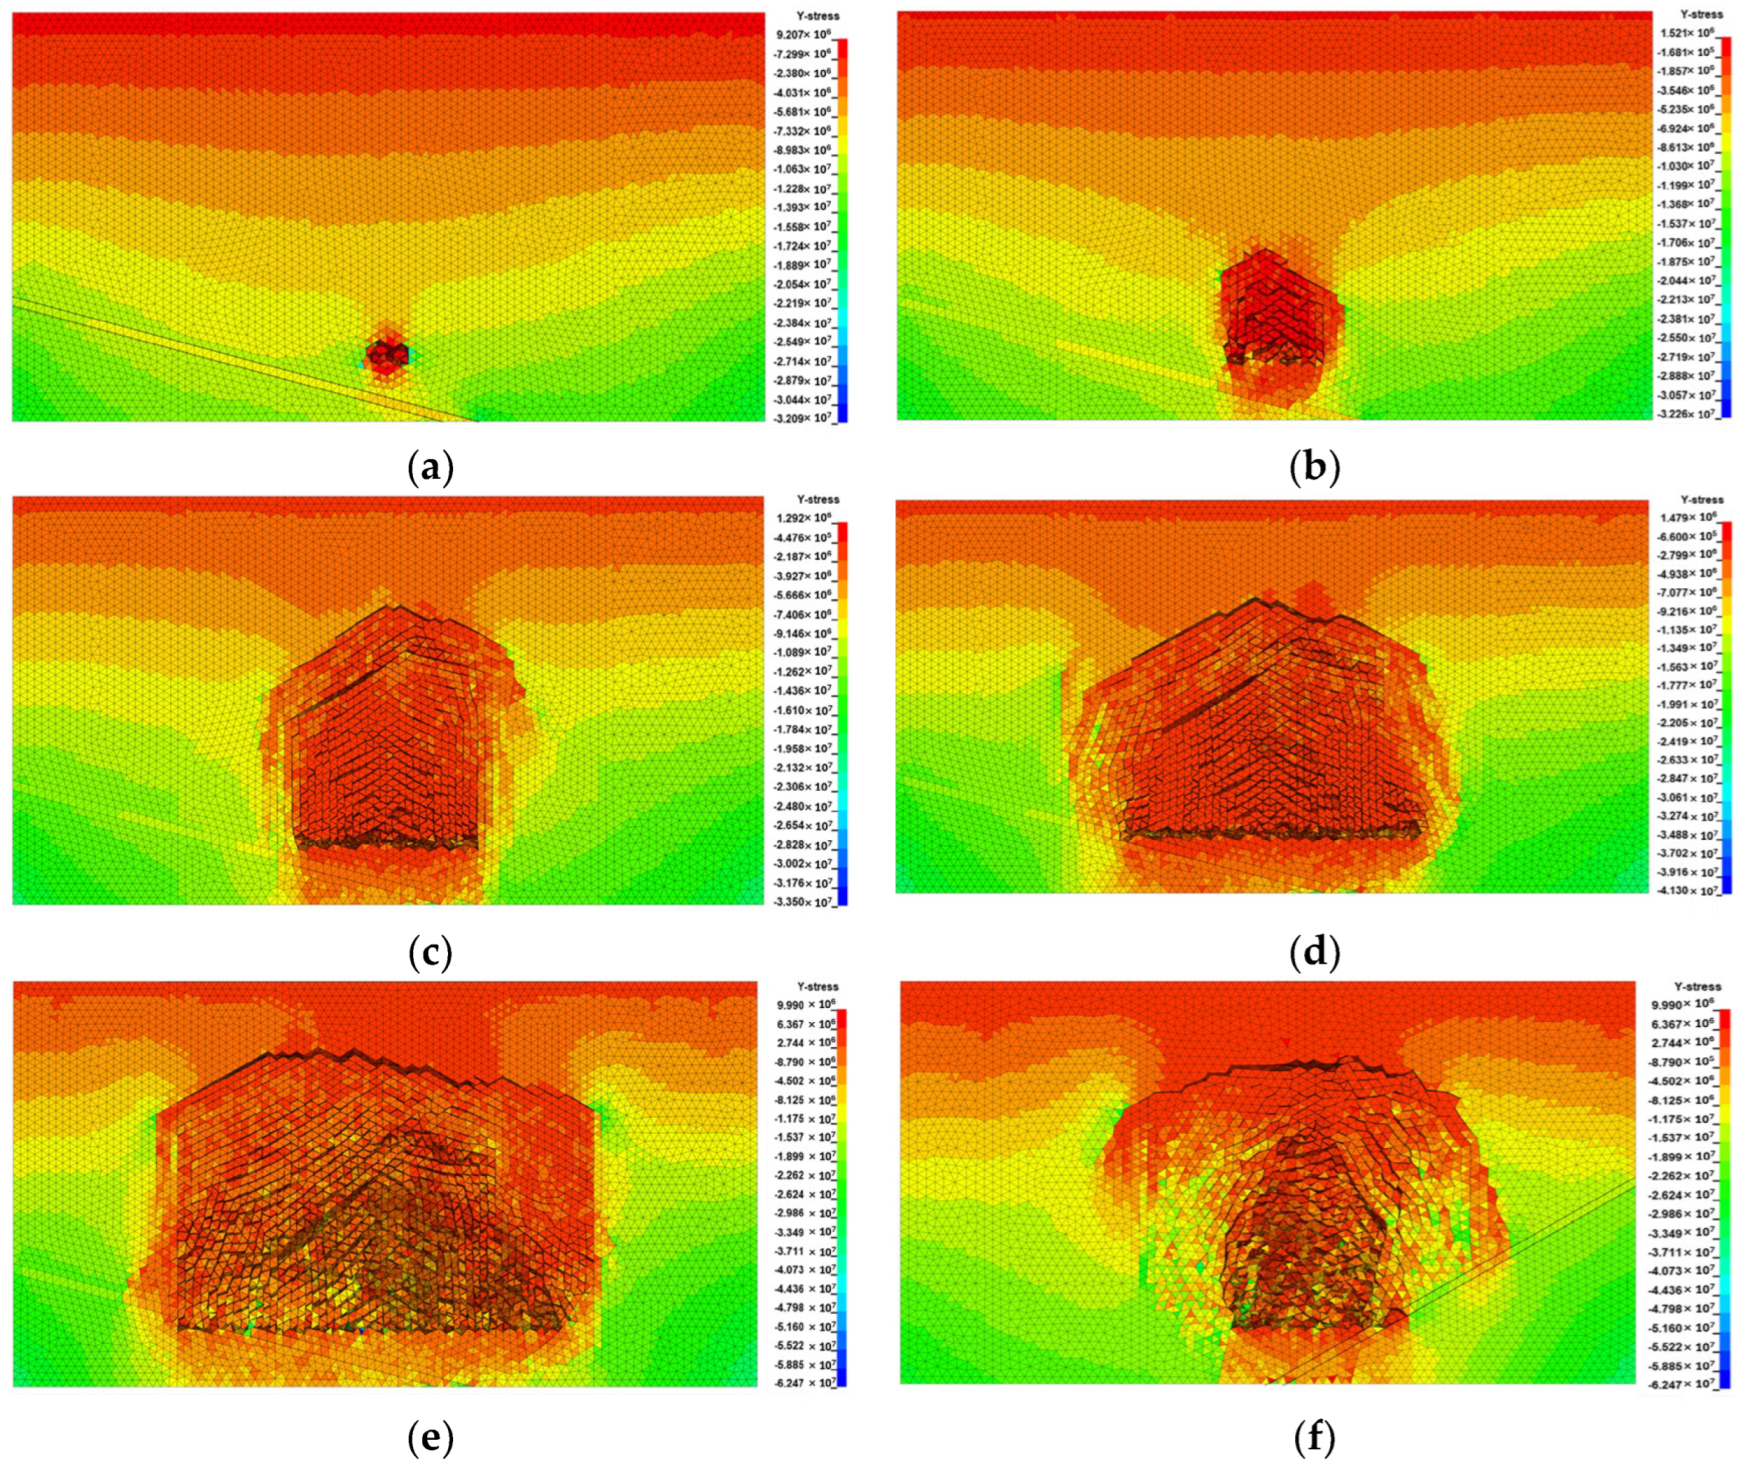
2.4.2. Vertical Stress Evolution Law

Figure 6 depicts the redistribution of vertical stress resulting from bottom pulling disturbance, leading to a noticeable low–stress unloading area around the undercut area. Moreover, significant unloading is observed within the fault fracture zone, marked by the black line area in the lower left corner of Figure 6a–e and in the lower right corner of Figure 6f. As the bottom pulling range expands, gradual collapse occurs due to damage to the top plate from pulling, intensifying stress redistribution and forming an unloading funnel (see Figure 6a,b). However, stress concentration is evident in the local area surrounding the fall arch, restricting the deformation of the top and bottom plates (see Figure 6c). The vertical stress unloading area deflects towards the side of the fault crushing zone. During the second ore release, Figure 6d depicts the top plate ruptured from the rock body above the pull–down area, resulting in a collapse to a height of 260 m (measured from the bottom surface of the pull–down area to the top of the fallout arch). This rupture leads to further stress release on the top plate, although a significant increase in localized stress concentration around the fallout arch is observed, exceeding 40 MPa at its maximum, with the highest concentration located internally within the model. Upon the completion of the bottom pullout, Figure 6e,f depicts the maximum vertical stress approached 60 MPa, with the highest concentration still located internally within the model.

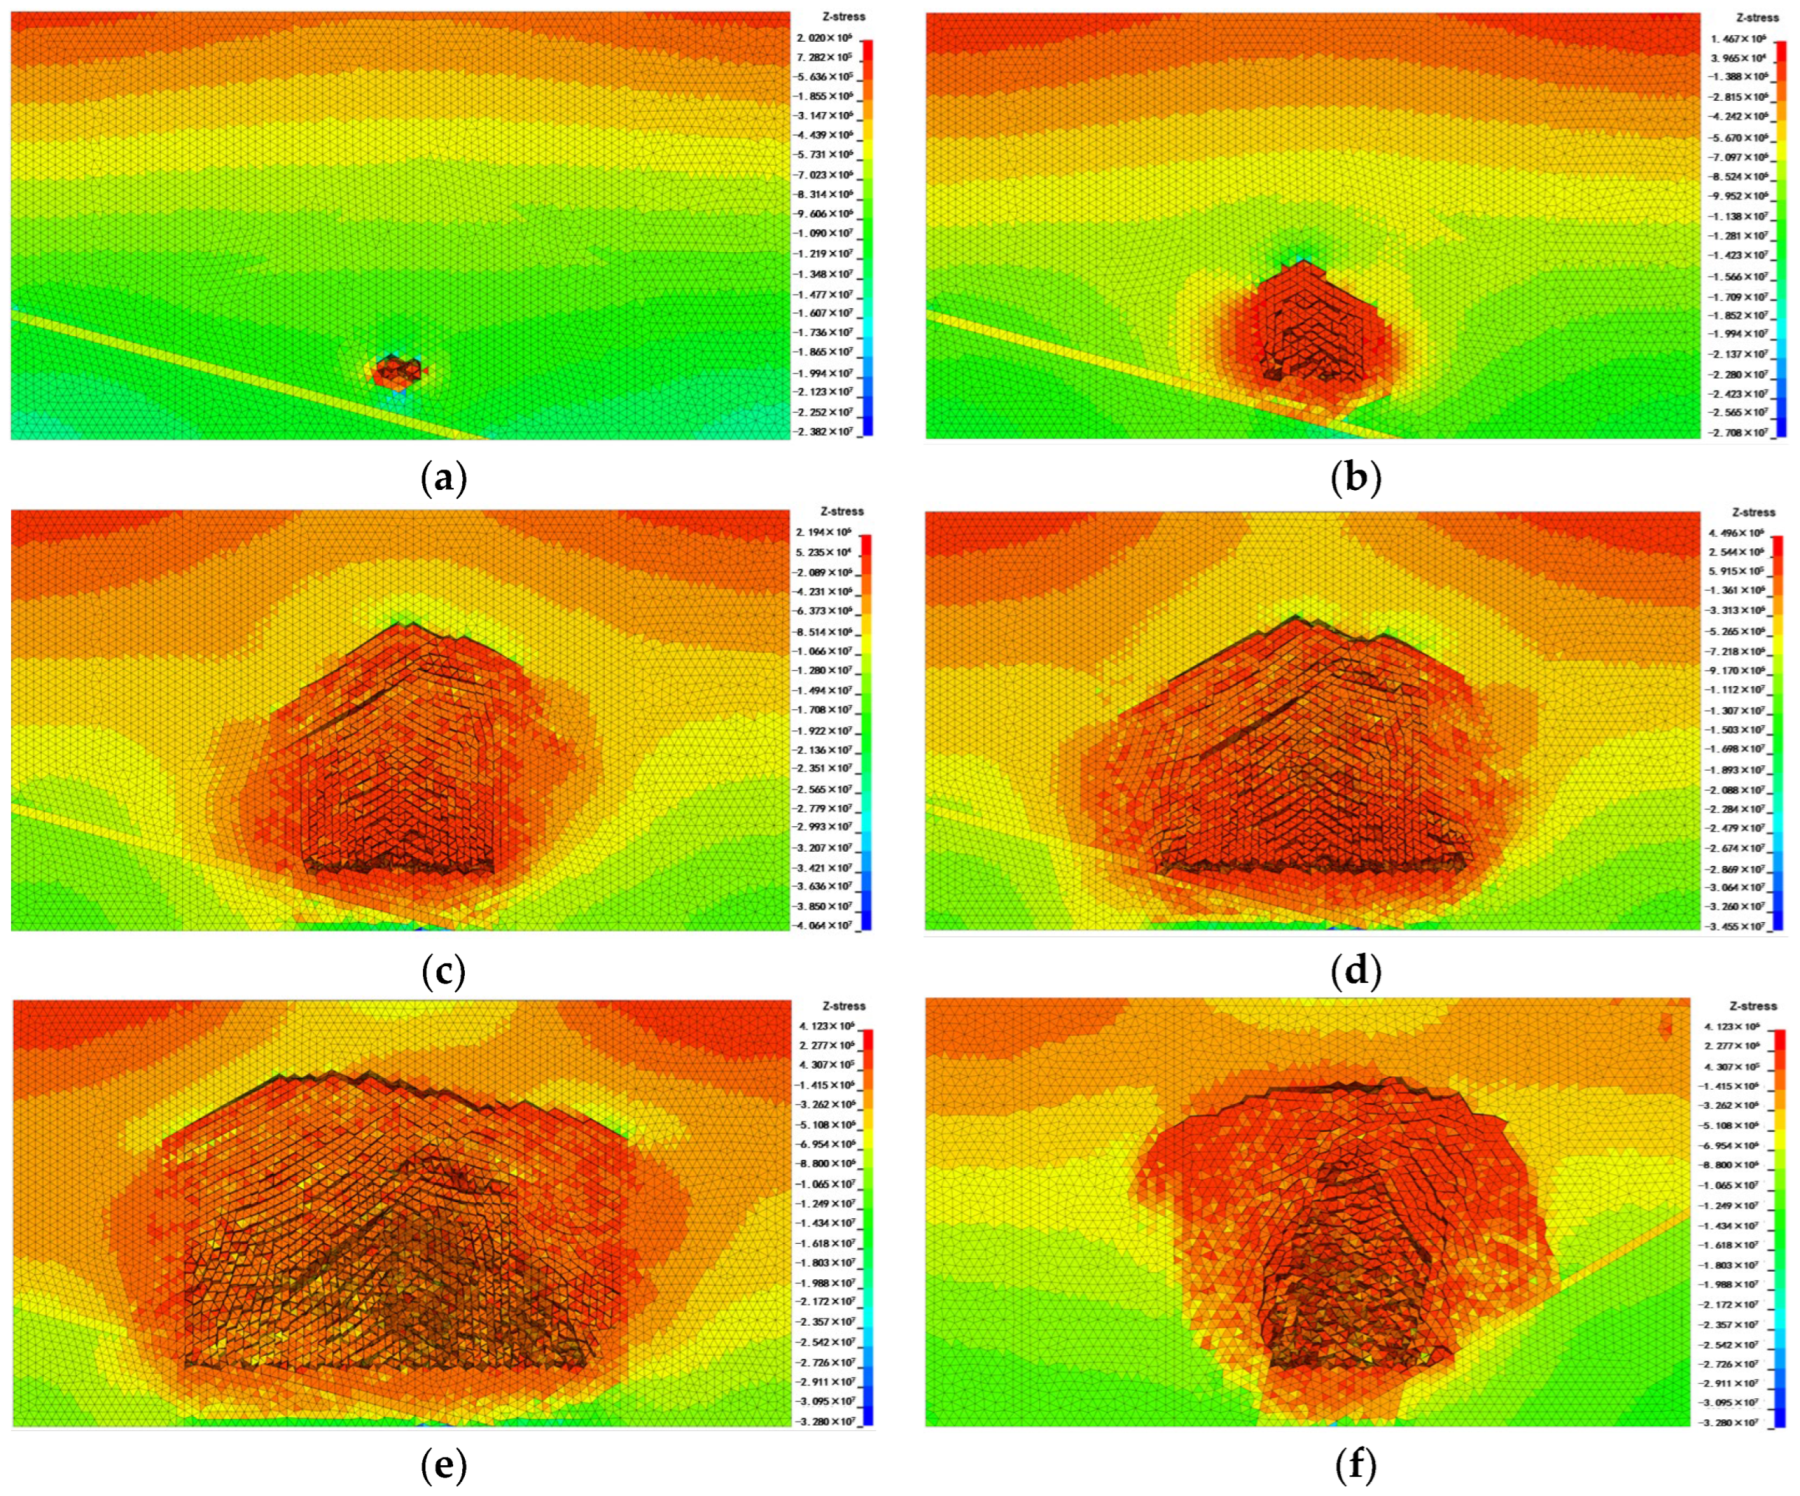
2.4.3. Horizontal Stress Evolution Law

In order to further reflect the change in the stress around the bottoming region during the bottoming process, the cloud diagram of the horizontal stress at each bottoming step is given in Figure 7. From the Figure, it can be seen that when the range of the drawdown region is small, the horizontal stress release in the crushed zone around the drawdown region is small, but it does not have much effect on the stress field of the whole model; with the increase in the drawdown step, the horizontal stress release in two gangs of the drawdown region is obvious and the horizontal stress release in the interior of the fault crushed zone is obvious, the horizontal stress release area is deflected to the side of the fault crushed zone, and the formation of an obvious stress concentration over the arch in the drawdown region occurs (Figure 7c); when the bottoming step reaches 15 steps, because the rupture area has been extended to the rock body above the bottoming area, the horizontal stress distribution gradually loses symmetry; when the bottoming step is completed, the rupture area is more than the whole ore body, and the horizontal stress distribution is asymmetric. For the horizontal concentrated stress around the drawdown area, its amplitude shows the trend of increasing first (Figure 7a–c) and then decreasing gradually (Figure 7c–f), and the maximum horizontal concentrated stress is 40 MPa.

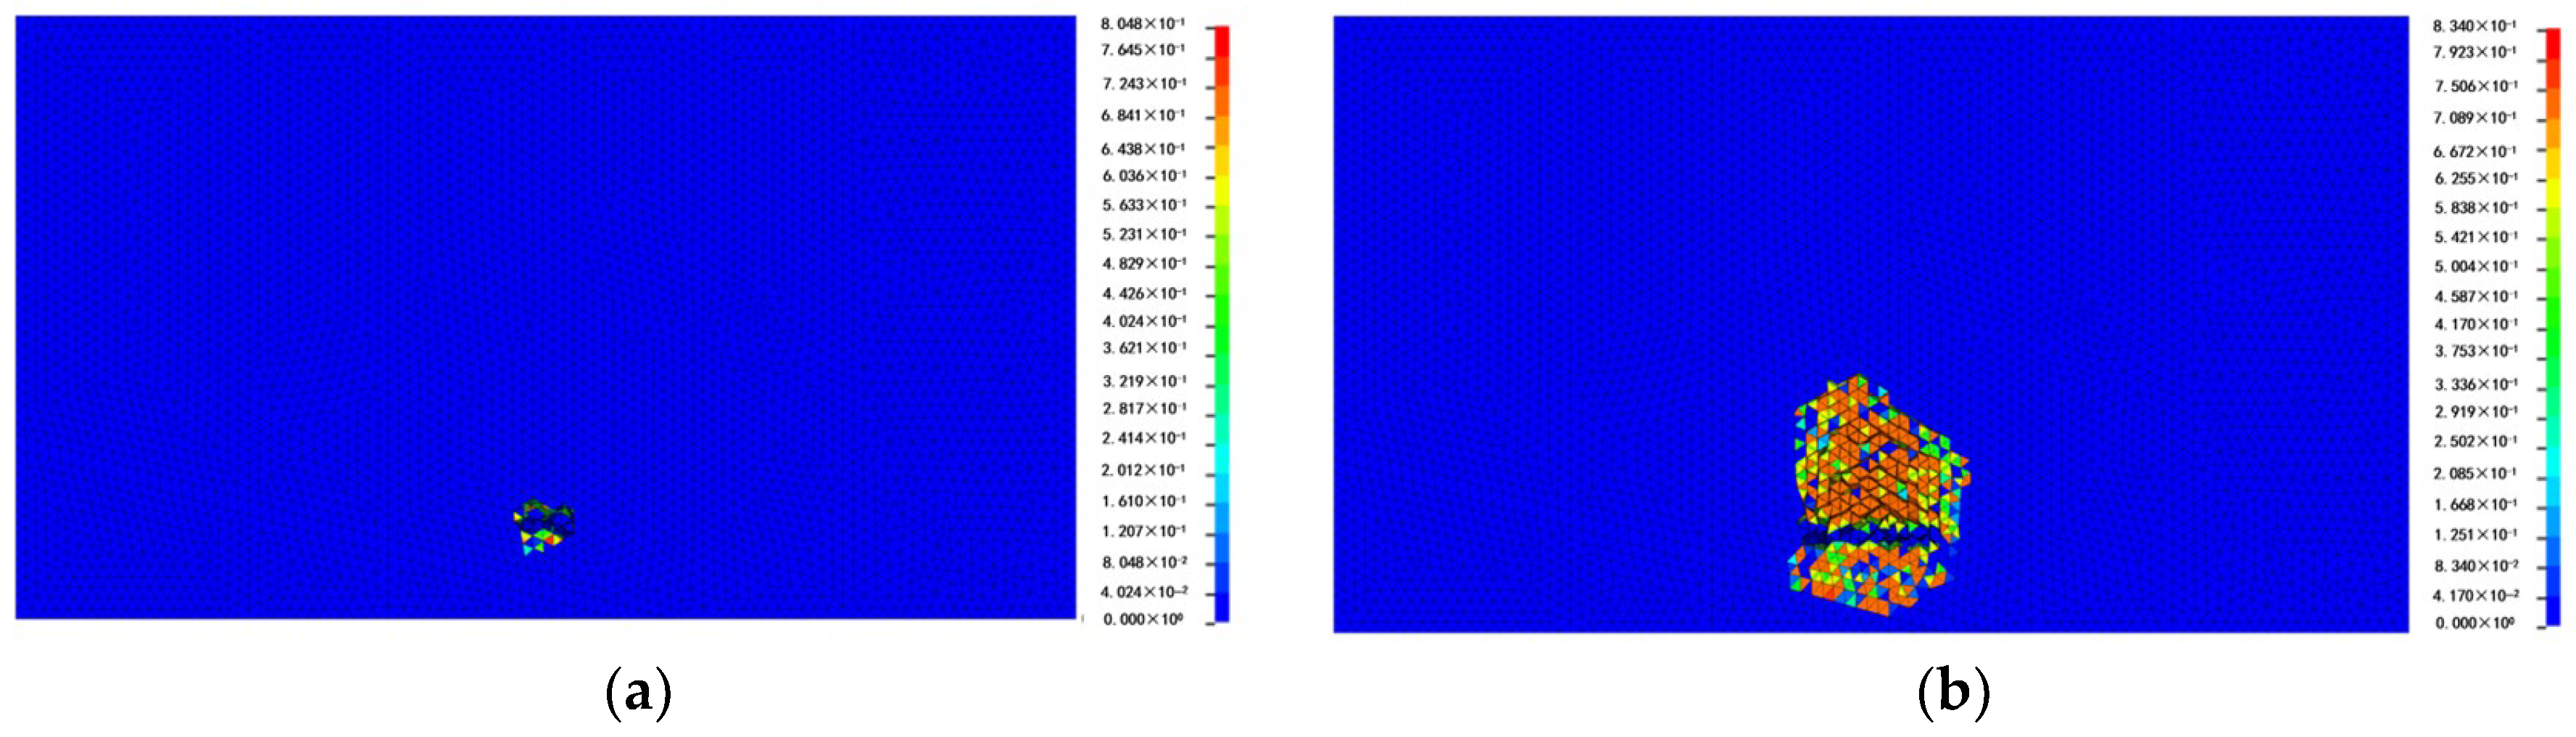
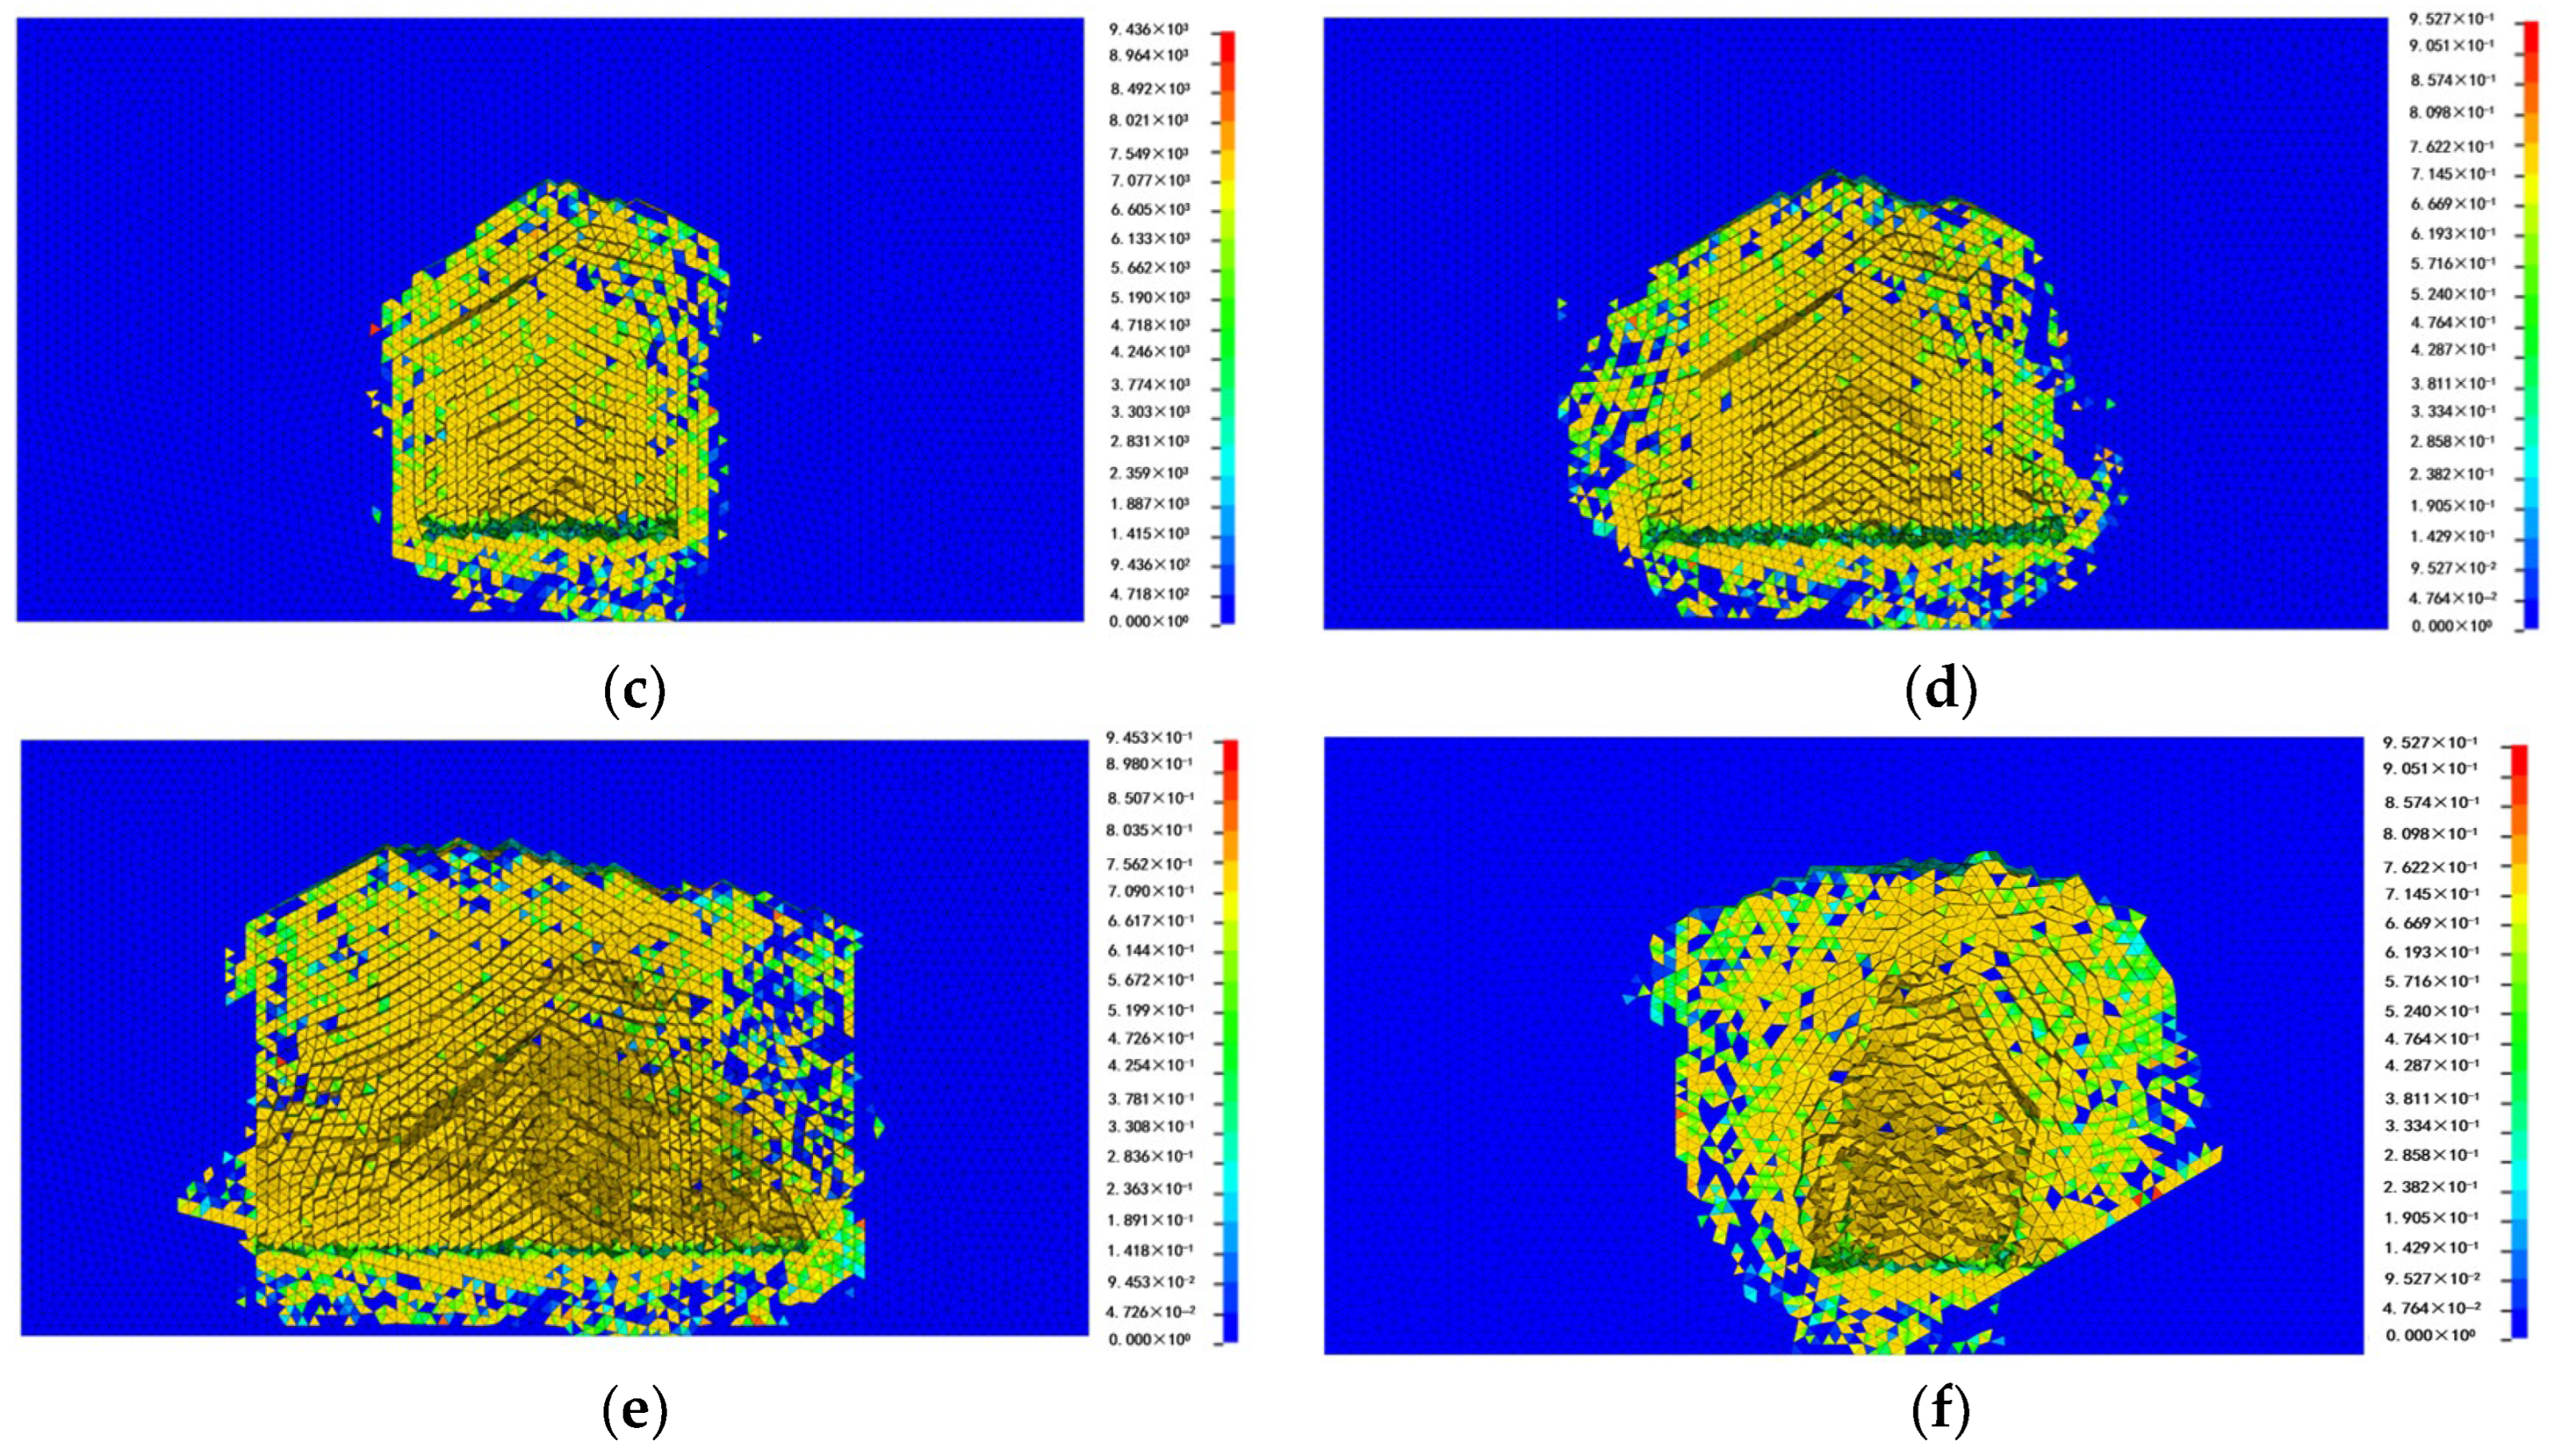
2.4.4. Damage Rupture Evolution Law

Figure 8 illustrates the progressive extension of damage rupture in the ore body surrounding the pull–down area at each step. Damage rupture is not depicted within the pull−down region as it exists solely in the zero–thickness cohesive unit. Figure 8 demonstrates that as the bottoming area enlarges, the range of damage rupture around it also gradually increases. Furthermore, the rate of expansion of the damage rupture above the bottoming area surpasses that of the bottom plate. Upon the completion of the drilling process, the extent of damage and rupture exceeds the entire ore body area. This phenomenon results from the rock body’s higher strength compared to the ore body, preventing further ore release. However, the damage and rupture area do not extend to the surface.
Figure 5, Figure 6, Figure 7 and Figure 8 demonstrate that internal stresses in the fault zone dissipate earlier during the bottoming process. Specifically, within the same bottoming step, these stresses are notably lower than those in the adjacent rock and ore bodies. As the drawdown step area increases, both vertical and horizontal stress release zones shift towards the fault zone’s side (refer to Figure 6b and Figure 7b). Figure 5d–f demonstrate that the vertical displacements of the rock body above the fault zone are greater than those on the side away from the fault zone. This indicates that the fault zone weakens the support provided by the fractured body phase embedded in the fracture zone. Figure 6f and Figure 7f demonstrate that the fault zone not only facilitates the convergence of the vertical and horizontal stress release zones to the fault zone but also limits the stress release zone. This is evidenced by the significant stress release above the fault zone and the reduced range of the stress release zone below the fault zone. The fault fracture zone not only aids the convergence of stress release zones towards it but also restricts their expansion. Significant stress release occurs above the fault fracture zone, while the range of stress release below it diminishes noticeably. This phenomenon is illustrated in Figure 8f, showing how the fault fracture zone promotes the convergence of damage rupture and inhibits its extension.

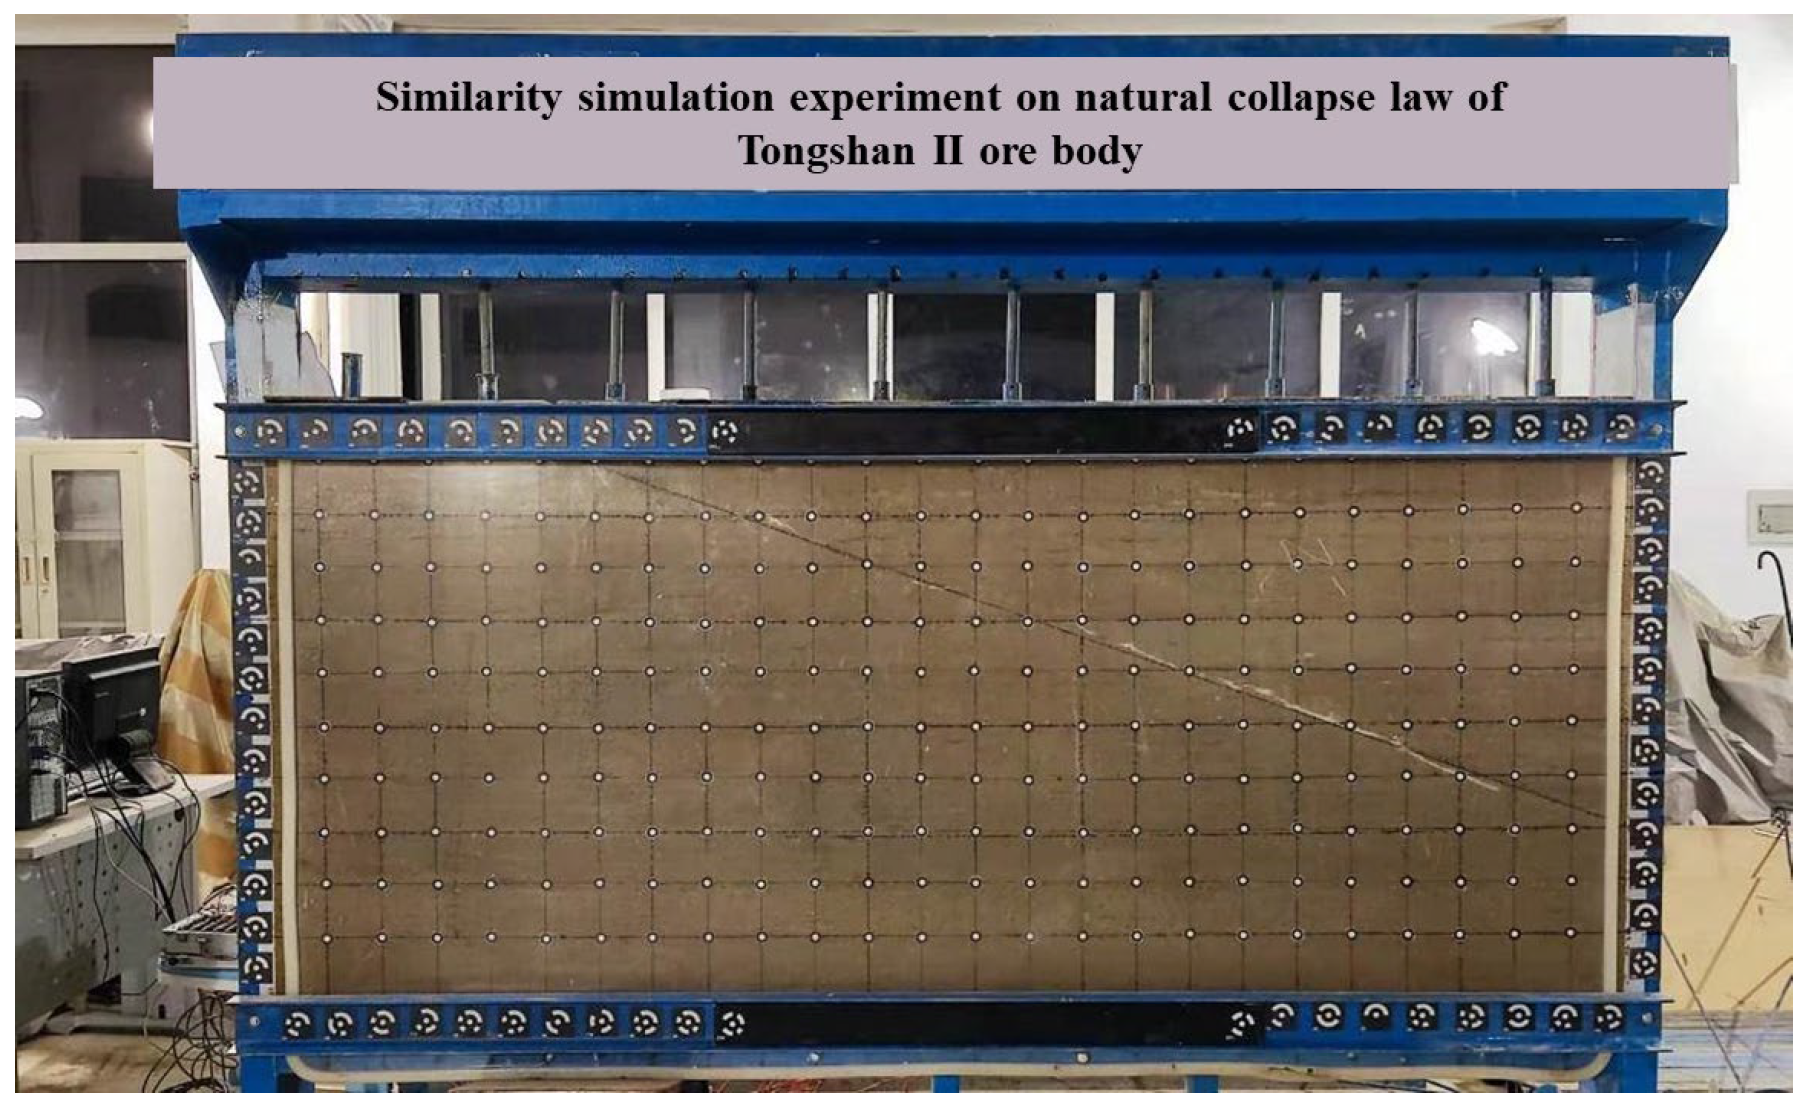
3. Similar Simulation Test Analysis

3.1. Model Similarity Condition

The rock mechanical parameters of the No. II mine at Tongshan mine, along with the results of three–dimensional numerical simulation experiments on the collapse law, have been used to establish a two–dimensional similar material model based on similarity theory [26]. This model has been constructed to reflect the actual geological conditions, using similar materials selected in specific ratios to simulate the properties of the rock layer [28]. The shrinkage of the pavement within the experimental model has been simulated according to a specific proportion. By simulating the failure of the overlying rock during the excavation of the working face, the stress evolution law of the bottom structure during the natural collapse and bottoming process is analyzed. In this study, the simulated rock body measure 500 m in length and 240 m in height, while the model dimensions are 2.5 m in length and 1.2 m in height, with a geometric similarity ratio (Cl) of 1:200. The ore body’s density is 2.76 g/cm3, whereas the model’s density is 1.84 g/cm3, resulting in a similarity ratio for density Cγ of 1.5. For practical on–site simulation, each hour of testing equates to 12.5 h of actual mining. Under the aforementioned conditions, the strength similarity ratio Cσ is 1:300, and the remaining rock layer’s weight matches the model’s loaded weight. The model’s load encompasses self–gravity stress, determined by the depth at which the overburden rock is situated. The self–gravity pressurization value is computed based on an average overburden thickness of 300 m and converted to a specific test pressurization value. Moreover, to maintain similar overall deformation between the prototype and the model, it is often necessary to reduce the frequency of discontinuous surfaces in the model, adjusting block size to meet deformation modulus requirements. In this simulation test, only the effects of self–weight stresses and the resultant horizontal stresses were considered, as limitations in model size and loading conditions precluded the direct application of lateral stresses.

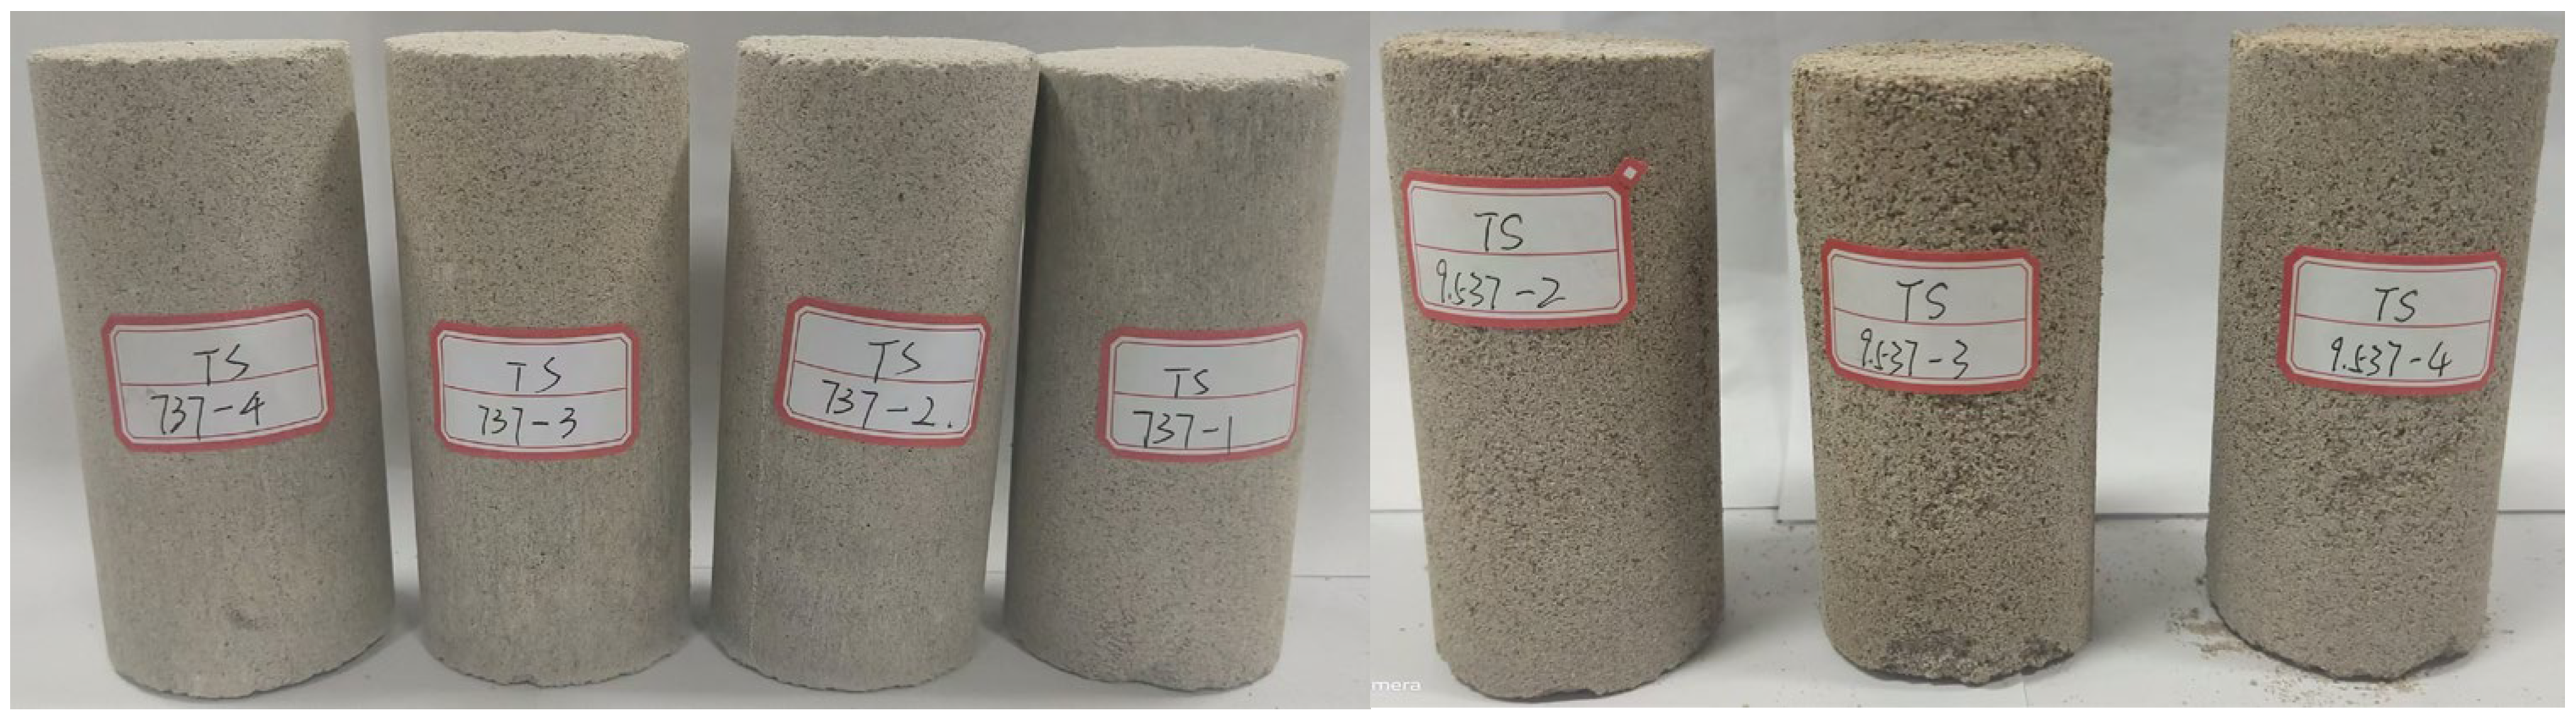
3.2. Comparative Experiments with Simulated Materials

Similar material proportioning experiments were conducted in the laboratory based on the physical and mechanical parameters of the rock. The experimental materials included river sand as the aggregate, gypsum as the cementing material, and putty powder as the auxiliary material. The proportioning design scheme is detailed in Table 2.
A mining pressure laboratory YA–600–type press was used to complete these experiments, with each group of proportioning numbers used to produce four standard test blocks for experiments, with test block molds made via homemade processing; this time, a total of 12 groups of proportioning numbers of test blocks were made, with a total of 48 standard test blocks, as shown in Figure 9.
Table 3 displays the uniaxial compressive strengths of specimen blocks made of similar materials with different ratio numbers. As shown in the table, specimen blocks with ratios of 737, 837, and 937 have higher compressive strengths due to the higher proportion of cementitious materials. This finding does not align with the required strength for the experiment. The table data show that as the gypsum content increases, the corresponding strength of the test block also increases. Additionally, the compressive strength of the specimen decreases as the sand content increases. The table indicates that the 1137 ratio specimen had the lowest strength at 0.15 MPa. Based on the previous section’s analysis of the strength of the similar ratio of 1:300, it is evident that the specimen’s uniaxial strength is comparable to that of the actual ore body and the peripheral rock when the ratio is 11:3:7, 11:5:5, or 11:7:3. Therefore, we have selected 11:3:7, 11:5:5, and 11:7:3 as the similar simulation materials for the lower disk enclosure, ore body, and upper disk enclosure, respectively, in accordance with the test requirements.
Table 3 presents the uniaxial compressive strengths of specimen blocks made of similar materials with varying ratio numbers. The data in the table reveal that specimen blocks with ratios of 737, 837, and 937 exhibit higher compressive strengths attributed to their elevated proportion of cementitious materials. However, this finding deviates from the required strength for the experiment. Notably, an increase in gypsum content correlates with an increase in the strength of the test block, while a rise in sand content leads to a decrease in compressive strength. Specifically, the specimen with a ratio of 1137 exhibits the lowest strength at 0.15 MPa. Building on the analysis from the preceding section regarding the strengths of similar ratios at 1:300, it becomes apparent that the uniaxial strength of the specimen aligns with that of the actual ore body and surrounding rock when the ratio is set at 11:3:7, 11:5:5, or 11:7:3. Consequently, we have opted for 11:3:7, 11:5:5, and 11:7:3 as the analogous simulation materials for the lower disk enclosure, ore body, and upper disk enclosure, respectively, in accordance with the experimental requirements.

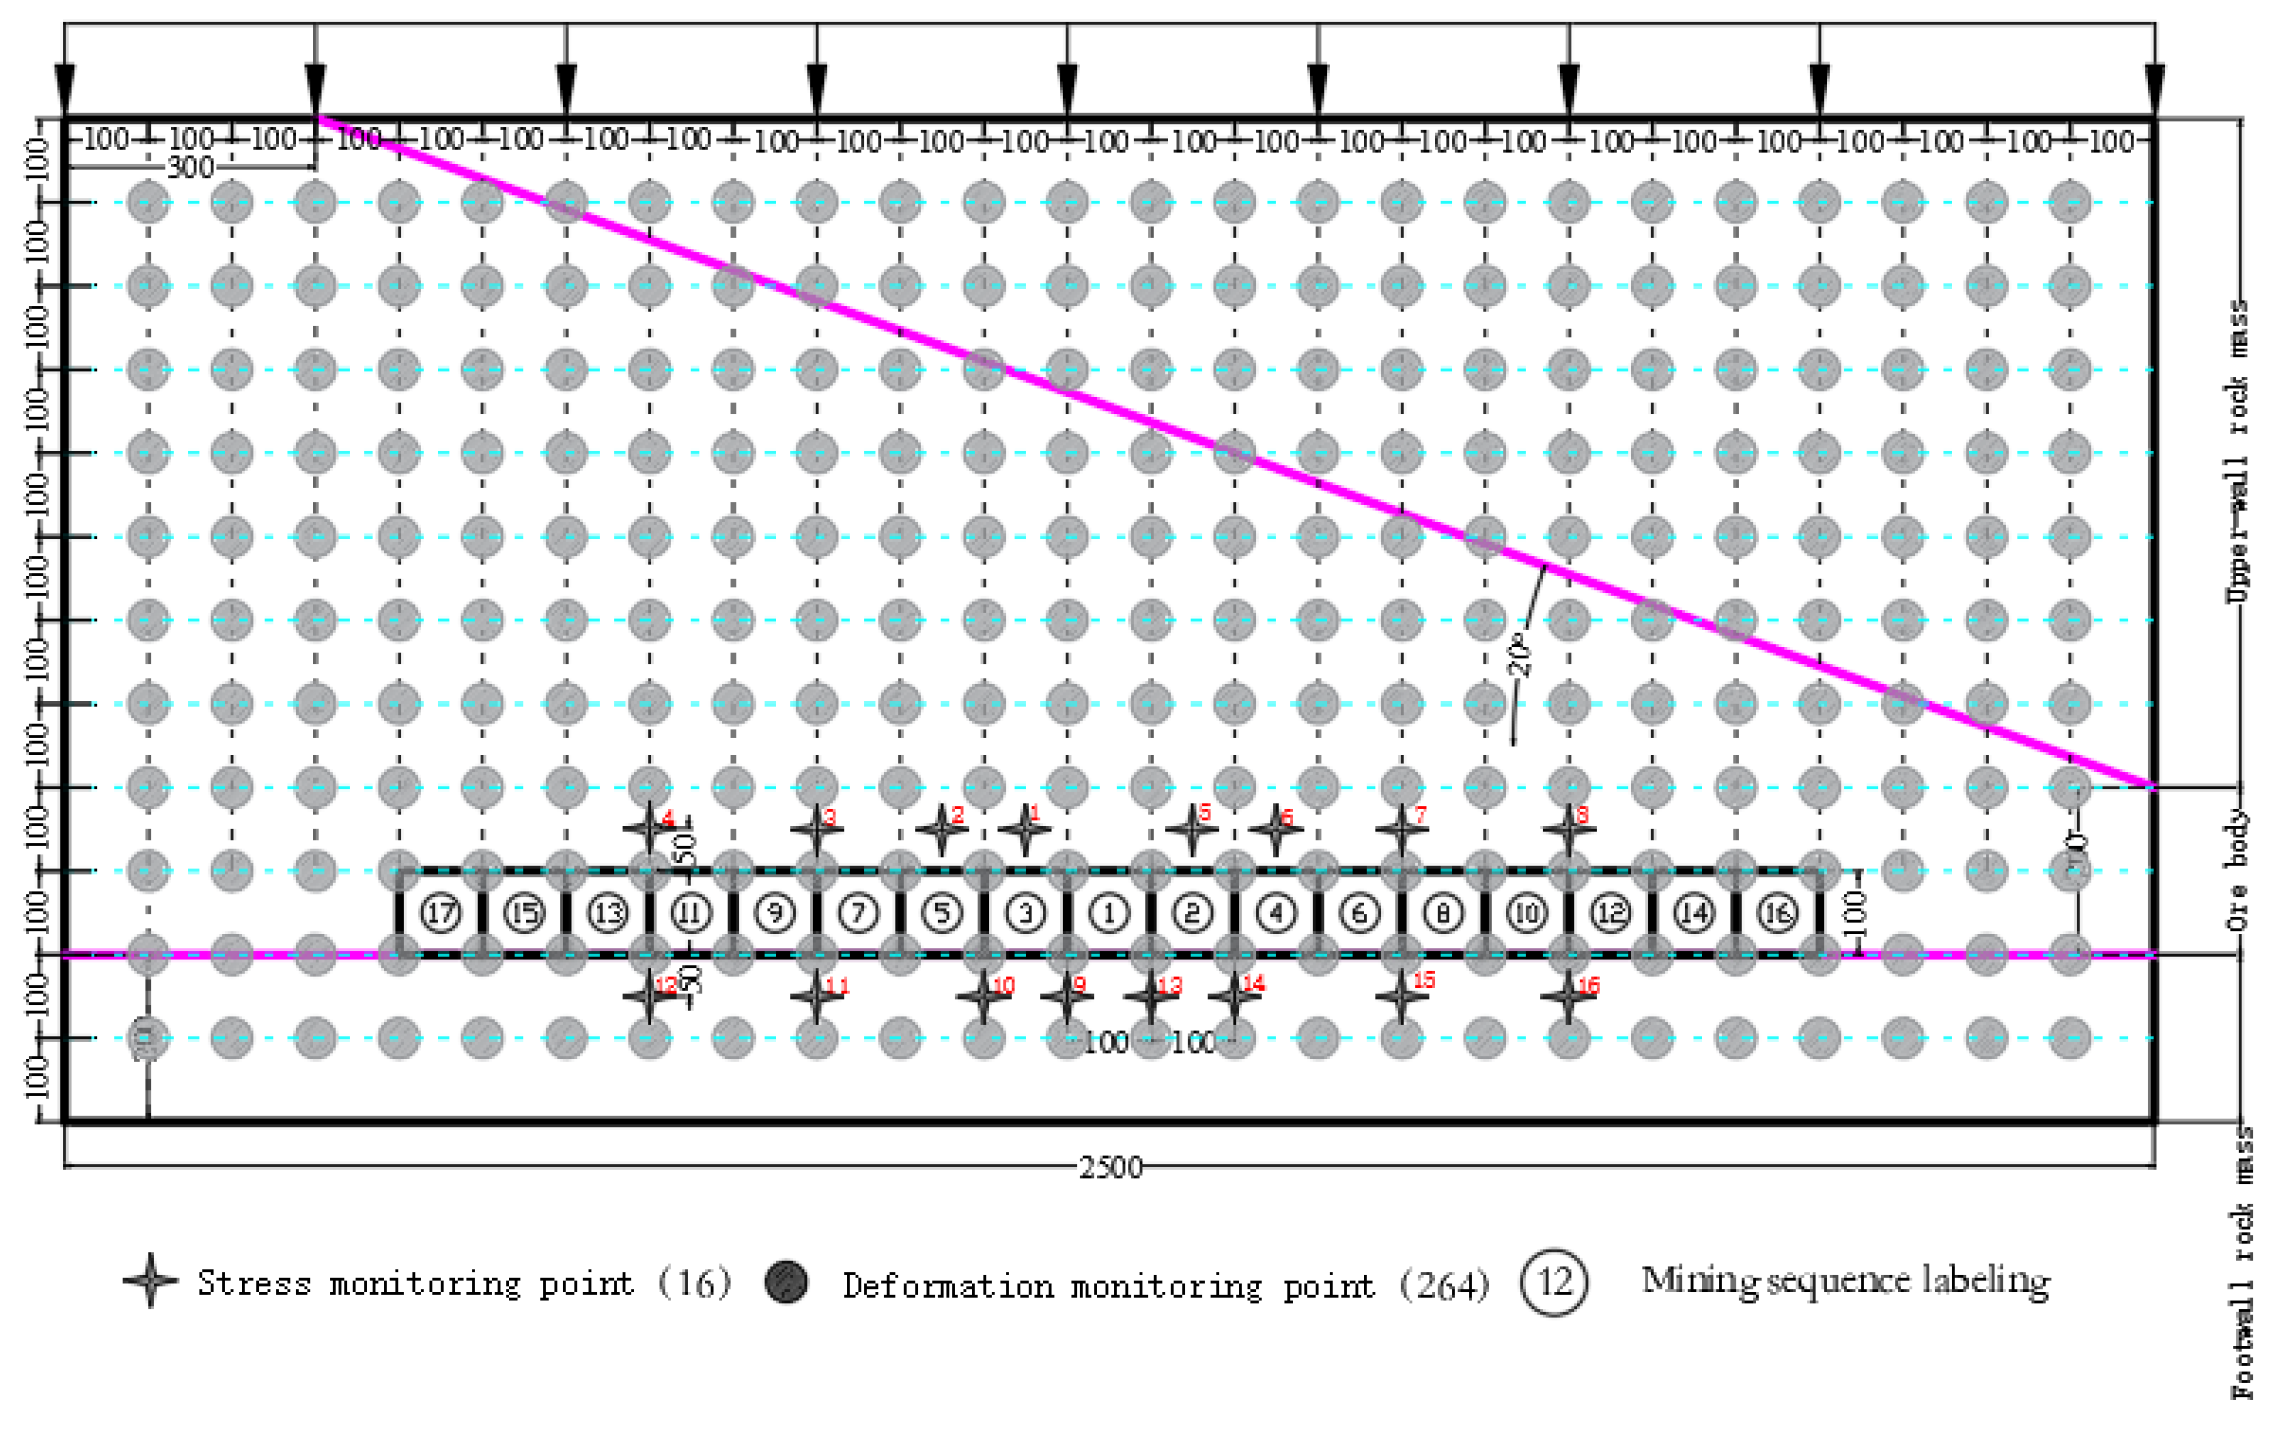
3.3. Experimental Procedure

The experiment employed the CM250/18 planar test rig with a model measuring 250 cm in length and 120 cm in height, yielding a geometric similarity ratio of 200. The bulk similarity ratio was set at 1.5, the strength similarity ratio at 300, and the time similarity ratio at 10. The model featured the ore body in its middle section, with the upper plane aligned to the average inclination angle of the ore body, and the peripheral rock surrounding the ore body. The specific model design is illustrated in the accompanying figure.
Based on the findings from similar material proportioning experiments, a comprehensive analysis is conducted to establish the construction of a similar model using proportioning numbers. The similar model was paved in conjunction with the pre–designed scheme and arrangement of the test elements. The paving process involved laying one layer every 20 mm from the bottom, with mica evenly distributed in the middle, and loading the unpaved rock layer above based on the buried depth load using a lever scale. The model is equipped with two rows of 16 pressure boxes, which collect data on the stress distribution of the overlying rock as the excavation width increases. These pressure boxes also monitor changes in the upper and lower plate stress levels after excavation. The pressure box data collection uses Donghua Testing Company’s static DH3815N collector, which is set to collect data five times per minute. Deformation at measuring points is observed using the digital scattering correlation method. After air–drying the model and removing the beams, a black line is drawn on the surface at 10 cm intervals, marking three–dimensional photographic observation points. Photographic coding points and scales are affixed at 10 cm intervals around the model’s edges, and a camera monitors rock displacement during stabilization and excavation. A special camera was used to capture photographs during both the loading and stabilization of the model, as well as throughout the excavation process, to monitor rock displacement changes. The model surface is equipped with 240 measuring points arranged in a 10 × 24 grid to analyze overburden movement during mining. Adjacent measurement points are spaced 10 cm × 10 cm apart, with the bottom row positioned at the ore body’s bottom plate. Displacement monitoring points are arranged according to Figure 10 and Figure 11.
This model represents a two–dimensional plane stress configuration, with excavation occurring in the direction of the bottom working face. The final excavation length for each bottom working face corresponds to the tendency length observed in the actual project, adjusted according to dimensional similarity ratios. Excavation procedures strictly adhere to the site’s location and mining sequence, and the excavation plan for working faces with similar material properties follows dimensional and temporal similarity considerations.
The entire test was conducted manually, with bottom pulling initiated from the center and extending towards both sides. Each bottom pull covered a step distance of 100 mm with a height of 60 mm, which, after adjustment for similarity ratios, equated to an actual step distance of 20 m. The thickness of each bottom pull was 12 m, following a sequential numbering scheme for the bottom pulling sequence. A total of 17 bottom pulling units were established. Following each bottom pull, there was a 15 min stagnation period for ore discharge, during which one–third of the ore collapsed. This was followed by another 15 min stagnation period before the next excavation unit resumed mining. Each excavation unit lasted a total of 30 min. Continuous deformation observations were conducted throughout the excavation process, alongside continuous collection of high–speed images and strain gauge data. The model was designed for 17 bottom pulls, with the order of pulls alternating from the center to the ends, as depicted in Figure 12.

3.4. Analysis of Test Results

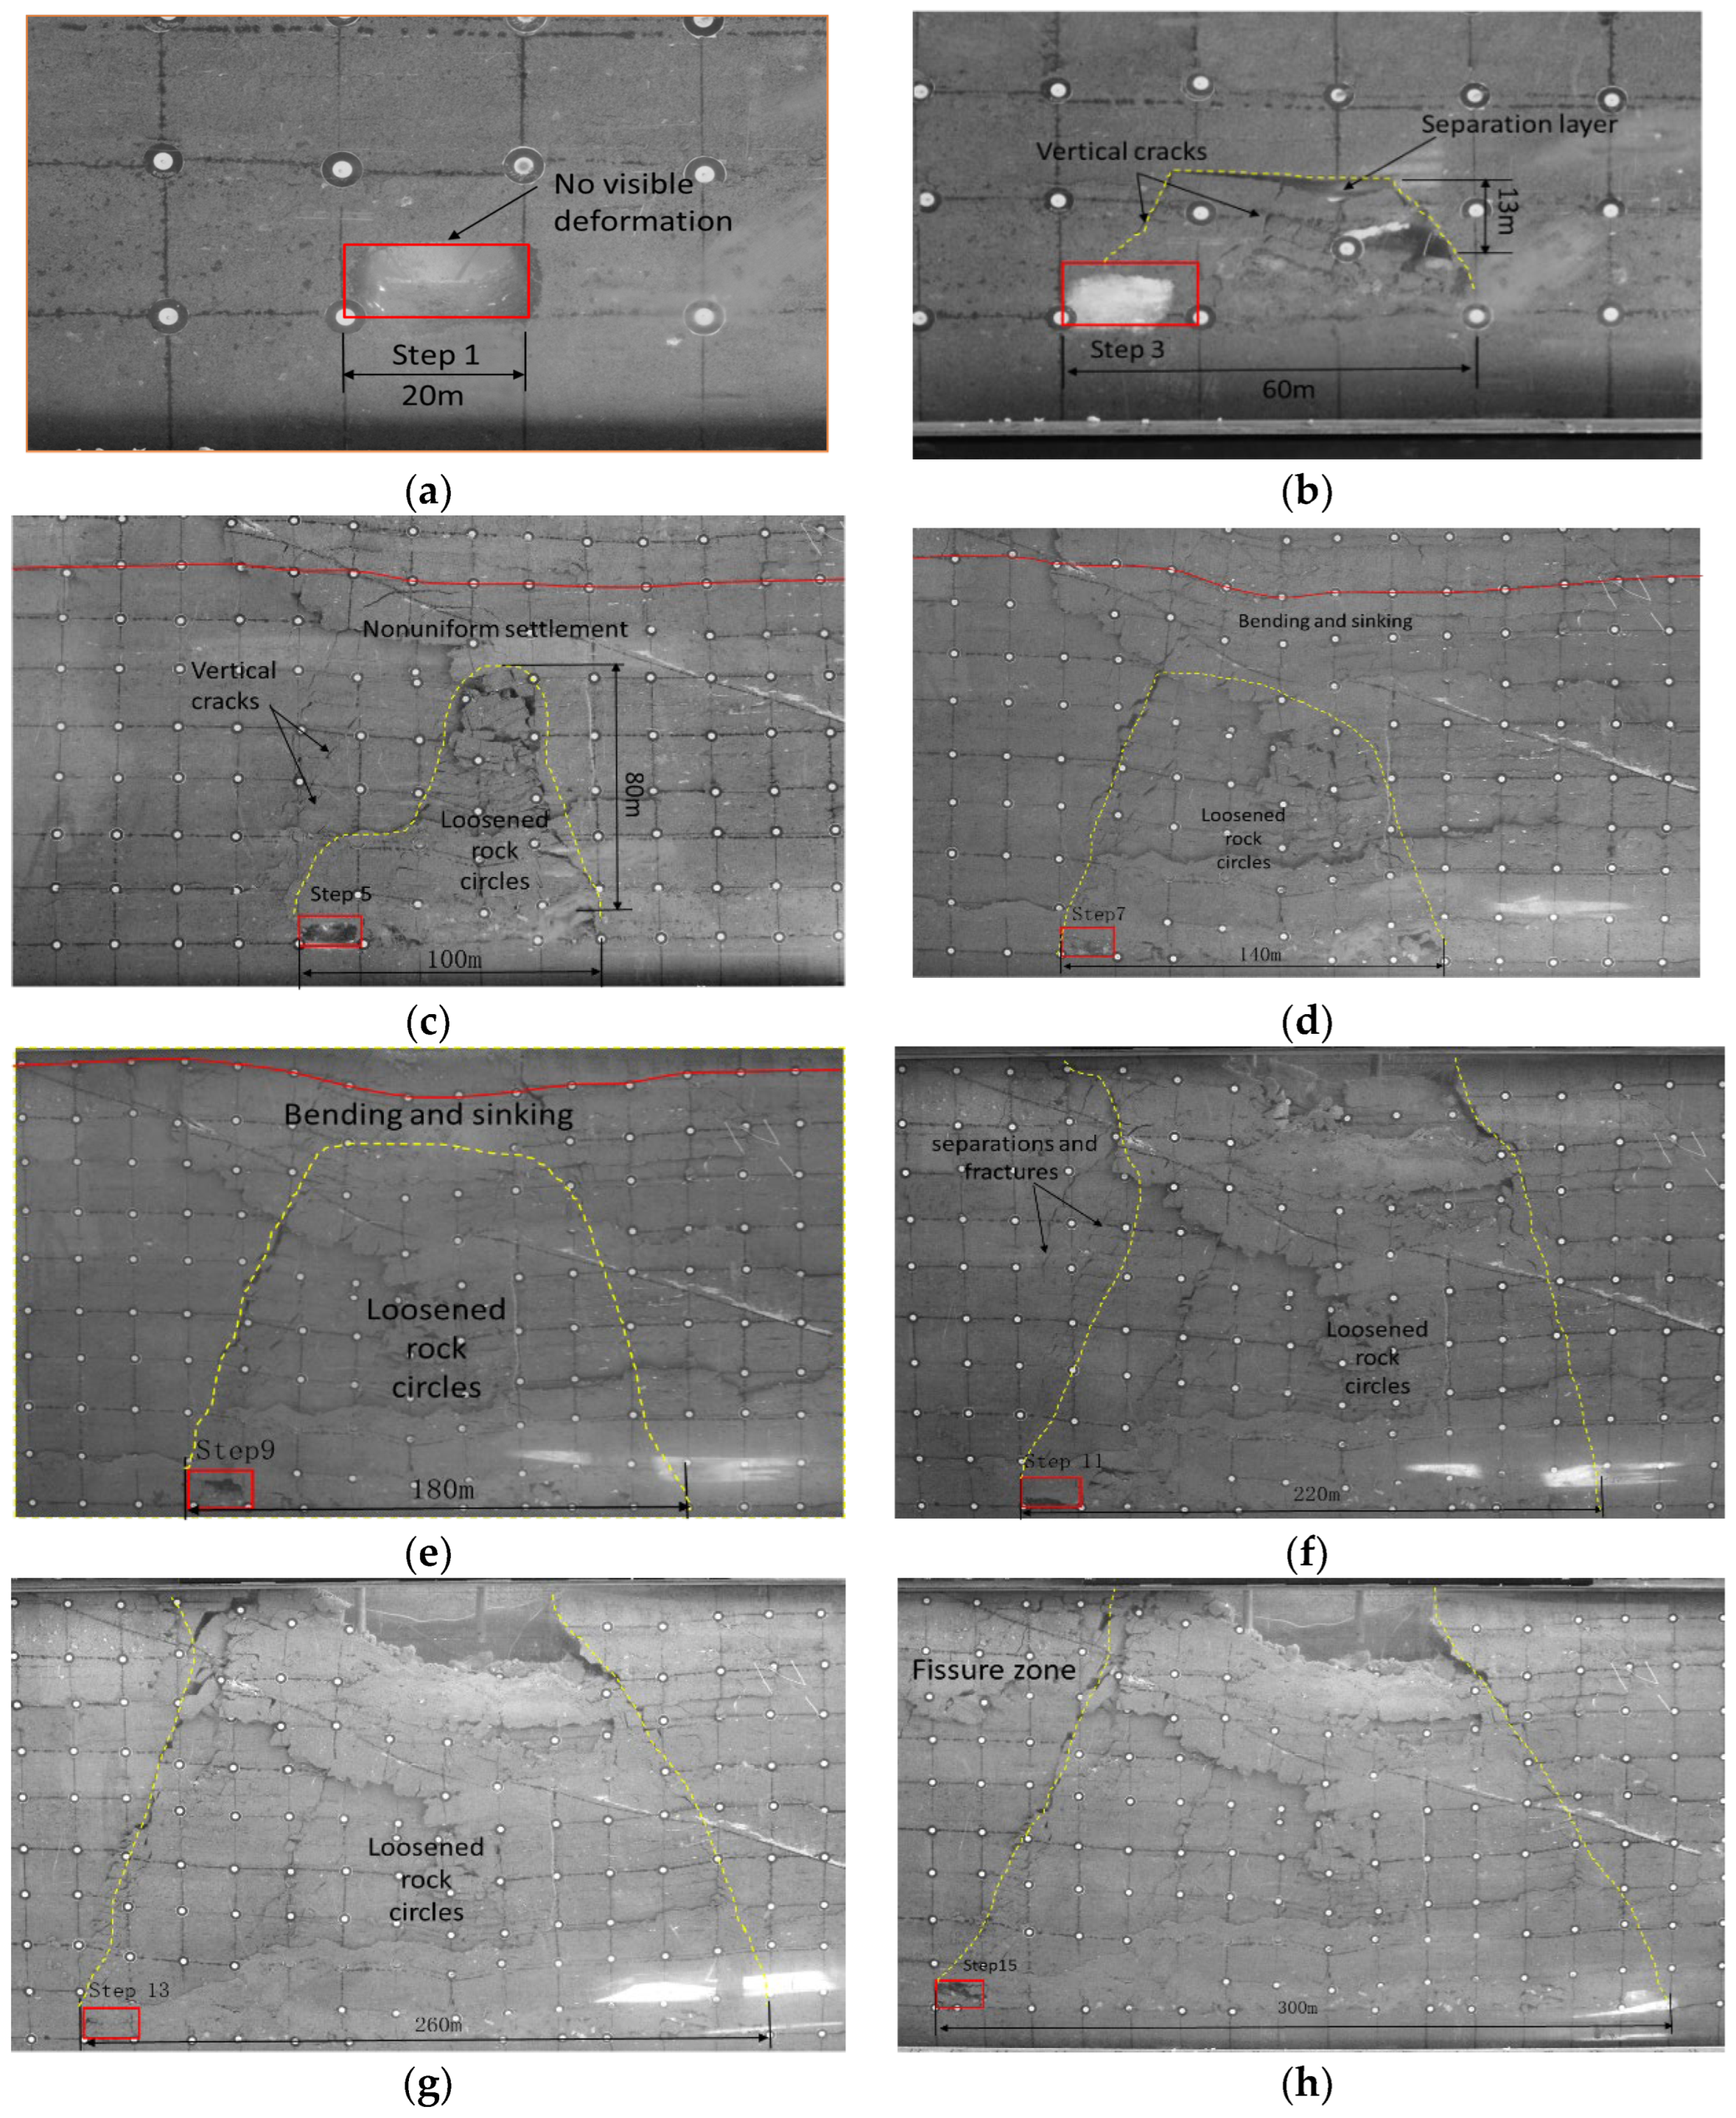
3.4.1. Deformation and Damage Analysis of the Overburden

Following the completion of bottom pulling in the model, the damage patterns of the ore body and overburden rock are observed, and the collapse phenomenon is studied and analyzed. Figure 13a–h illustrate the deformation and destruction of overburden rock at various stages of bottom pulling. It is observed that after each bottom pull, a collapse space forms between the bottom pulling roadway and the ore body, disrupting the original equilibrium among the top plate, bottom pulling layer, and bottom rock layer. This disruption leads to stress redistribution and establishes a new equilibrium as mining progresses. During this process, the ore body will experience various forms of movement, including bending, collapsing, breaking, rotating, and bulging. The test results indicate clear zoning for the collapse and destruction of the rock layer, progressing from the fall zone at the bottom, through the fissure zone, to the bending and sinking zone at the top. As the burial depth decreases, the deformation range of the overburden rock gradually expands, while the degree of destruction gradually diminishes.
In summary, the model is excavated from the middle to both ends of the pull–down, revealing a distinct pattern in the collapse of overburden rock after each completion of the pull–down work in the physical similarity simulation test. As the pull–down space expands, the un–collapsed overburden above the collapse area transitions from an elastic to a plastic state. The increase in pull–down width results in a steady increase in lateral fissures, while the ore body in the upper part of the pull–down layer stabilizes through bubbling down. Given the two–dimensional test limitations, this study assumes isotropic material properties and aligns the vertical ore body strike with the overburden falling law along the ore body strike. A pull–down width exceeding 80 m leads to new fissure expansion in the top plate after each pull–down, with an estimated initial collapse area of the ore body at 6400 m2. If the pull–down width exceeds 120 m, the ore body collapses entirely to fill the pull–down space, resulting in lateral fissures on both sides of the model and an estimated continuing collapse area of the ore body of 14,400 m2. The ground pressure manifestation law of the No. 2 ore body caving method in Tongshan Mine is consistent with the ground pressure evolution law obtained from numerical simulation and similar simulation experiments.

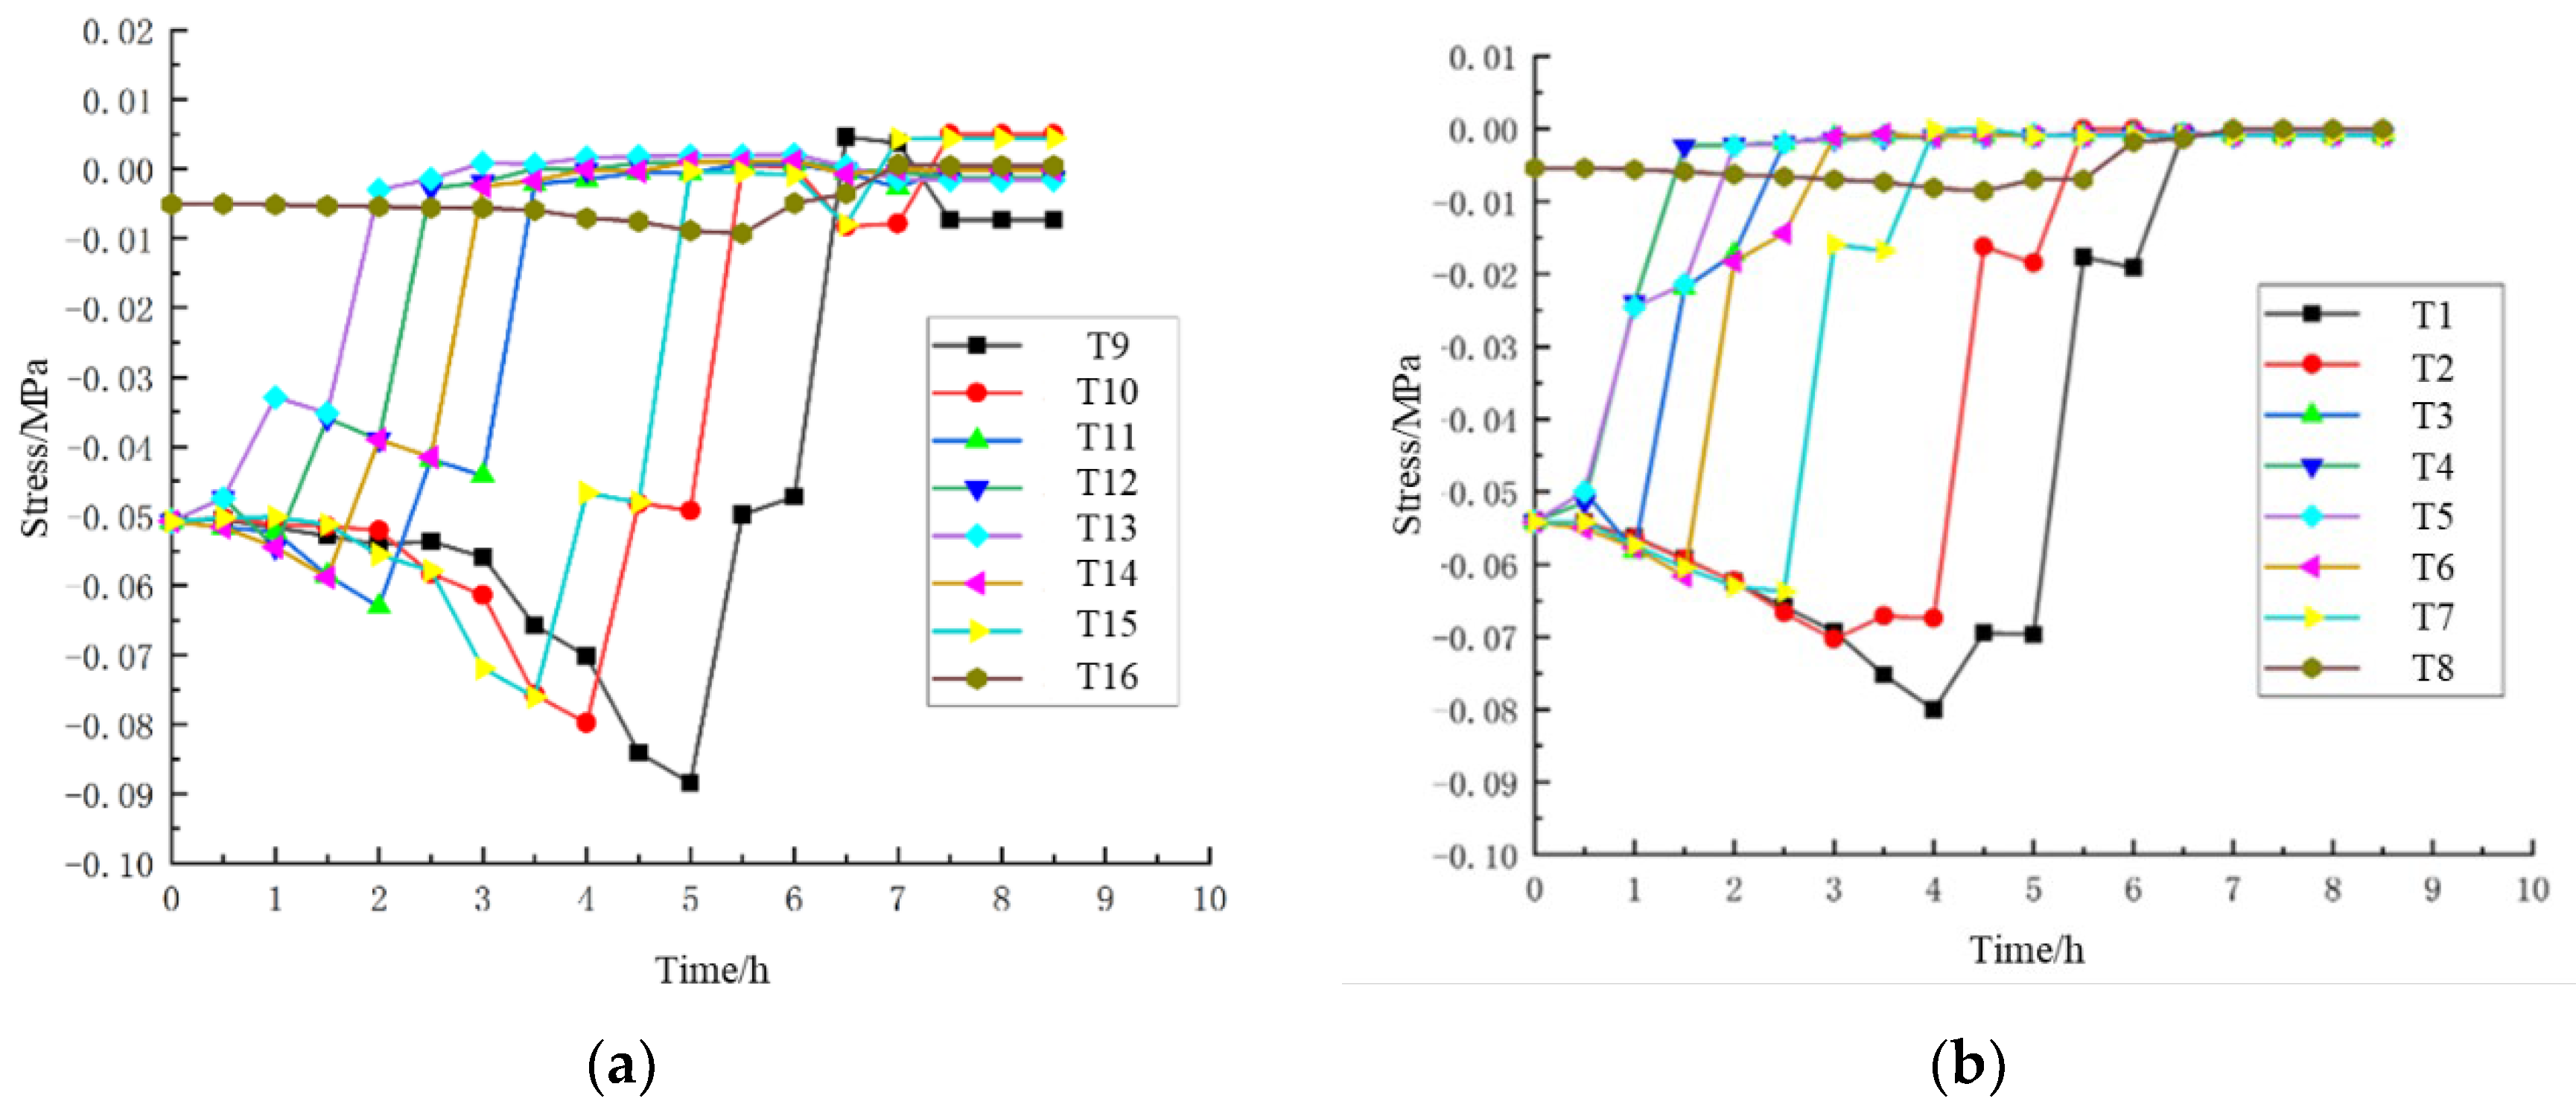
3.4.2. Overburden Stress Distribution Pattern

Figure 14a illustrates the pressure curve of the roof slab of the advancing bottom pulling roadway. As depicted in Figure 14, when the undercut area width reaches 20 m, although the relative range of the undercut area is small at this stage, there is a noticeable change in the surrounding rock stress within the undercut area space, ranging from 0.005 to 0.01 MPa. This stress change is also monitored at the pressure box measuring point located 30 m ahead of the undercut area face.
As the undercut area width increases to 60 m, the stress in front of the working face continues to rise, reaching a maximum of 0.06 MPa within 10 m of the face. With the expanding undercut area, the ore body gradually accumulates energy. Once this energy reaches the rock body’s strength limit, the ore body fractures and collapses. Concurrently, the disturbance in the overlying ore body caused by the mining area significantly increases. The peak stress above the top plate of the pull–down layer reaches 0.057 MPa, affecting a 60 m area.
Upon reaching an 80 m pull–down layer width, the peak overpressure reaches 0.075 MPa, leading to rock layer collapse in the upper ore body. Comparing the pressure curves at measurement points 4 and 5 in the top plate of the pull–down layer between the 60 m and 80 m scenarios, they both converge to 0, indicating rockfall occurrence and the initiation of ore body collapse.
Figure 14b displays the stress curve of the bottom plate of the advancing excavation roadway. It reveals a cyclic stress pattern as the excavation layer width advances on both sides. During bottom pulling work, stress from the overlying rock movement transfers to the bottom plate, creating stress concentration [38]. As the roadway advances, measurement points within the stress concentration area transition to pressure relief zones, leading to stress reduction until reaching 0 overburden pressure. Measurement points further from the roadway exhibit similar trends, with higher peak stress levels.

3.4.3. Laws of Motion of the Overburden

To analyze the deformation, damage, and movement patterns of the overburden rock at various pull–down stages, we processed deformation data from measured points in the model’s deformation monitoring system. Figure 15 presents deformation curves from monitoring points above the roof plate at different pull–down stages. Monitoring lines 1 to 9 are positioned above the roof plate of the ore body at intervals of 10 cm, covering a range from 10 cm to 90 cm, with the unit representing actual deformation in the model. The figure reveals that in the early stages of undercut area advancement, overburden rock deformation is minimal. However, once the undercut area width reaches 80 m, significant rock falls occur in the mining hollow area, with noticeable–to–obvious deformation at the top plate measuring point. As undercut area operations continue, the downward displacement and range of the top plate measuring point gradually increase [39]. Near the undercut area working face, the top plate measuring point exhibits greater movement compared to points near the peripheral rock of the ore body. Furthermore, as overburden rock movement expands, the incremental subsidence at the mining action’s rear diminishes, while frontward subsidence increments gradually rise. Post–initial collapse, overburden rock subsidence shows a trend of increase followed by decrease. Extreme subsidence values at different depths indicate maximum subsidence values of 1886 mm, 3491 mm, and 4860 mm, respectively, with the subsidence coefficient increasing alongside the burial depth. Regardless of the mining stage, working face displacement and deformation follow a deep ’V’ pattern. Observing roof subsidence in different mining stages reveals asymmetrical deformation on both sides of the model, attributed to the inclined ore body and non–uniform rock layer distribution.

4. Conclusions

In this study, we utilized GPI–3D–FDEM software to establish an N–H hyperelastic intrinsic numerical simulation model based on the actual engineering parameters and physical parameters of the mine. The simulation process adhered to the backward bottom pulling method. Additionally, similar simulation experiments were conducted in conjunction with an indoor physical model to verify the correctness of the proposed simulation experiments. Subsequently, we systematically investigated the stress evolution law of the bottom structure during the bottom pulling advancement process of the natural collapse method, revealed the mechanisms behind ground pressure disasters in the bottom structure, guided the production of the natural collapse method under horizontal ground stress, and provided reference values for rock damage assessment. Through our analysis, the following conclusions were drawn:
(1)
Analysis from three–dimensional numerical simulation calculations revealed that as the range of bottom pulling expanded, stress redistribution was increasingly disrupted, and the vertical stress unloading of the top and bottom plates became obvious, gradually forming an unloading funnel under the influence of bottom pulling. This disruption led to stress concentration in local areas around the collapsed arch, specifically on both sides of the arch top and in the bottom pulling area. Moreover, when the fracture zone extended to the rock mass above the bottom pulling area, the horizontal stress distribution gradually lost symmetry, and the degree of horizontal stress concentration increased with the expansion of the bottom pulling area.
(2)
A comprehensive analysis combining three–dimensional numerical simulation and two–dimensional similar material simulation tests concluded that the stress in the rock layer surrounding the bottom pulling roadway exhibited periodic changes. This analysis also demonstrated consistency in the chipping law along both perpendicular and parallel ore body strikes. Additionally, the displacement and deformation exhibit a deep “V”–type configuration. Before the top plate broke, stress values in the layer increased, followed by a decrease after the top plate breakage, indicating energy release in the rock layer. Upon entering the pull–down space, stress changes were influenced by overburden movement and the compression of broken rock layers, resulting in wave–like fluctuations that eventually stabilized.
(3)
Tensile stress concentration in the lower layer beneath the pulling bottom area of the structure increases with the pulling bottom area’s expansion. Horizontal stress from natural collapse leads to a stress sequence of “initial compression, followed by tension”. Upon increasing the pulling bottom area, compressive and tensile stress concentrations intensify. This phenomenon manifests during actual bottom structure production. The stress state of the structure is affected by the bulk ore load in the quarry, resulting from the uneven discharge of the quarry, leading to an uneven distribution of the ore bulk load. Hence, further investigation is needed into how the uneven ore discharge affects bottom structure stress distribution.

Author Contributions

Validation, L.X.; investigation, X.Q.; writing—review and editing, Z.L.; project administration, X.Y.; funding acquisition, H.C. All authors have read and agreed to the published version of the manuscript.

Funding

This work is financially supported by the National Key Research and Development Project of China (2023YFC2907403), Fundamental Research Funds for the Central Universitys (06500229).

Institutional Review Board Statement

Not applicable.

Informed Consent Statement

Not applicable.

Data Availability Statement

The original contributions presented in the study are included in the article, further inquiries can be directed to the corresponding author.

Conflicts of Interest

Authors Xiushan Qin and Xiaocong Yang were employed by the company BGRIMM Technology Group, Beijing. The remaining authors declare that the research was conducted in the absence of any commercial or financial relationships that could be construed as a potential conflict of interest.

References

  1. Yu, R.C. Mining Engineer Handbook; Metallurgical Industry Press: Beijing, China, 2013. [Google Scholar]
  2. Cai, M.F. Rock Mechanics and Engineering; Science Press: Beijing, China, 2013. [Google Scholar]
  3. Chen, J.P.; Zhang, Y.; Wang, J.X.; Xiao, K.Y.; Lou, D.B.; Ding, J.H.; Yin, J.N.; Xiang, J. On present situation and potential analysis of copper resources in China. J. Geol. 2013, 37, 358–365. [Google Scholar] [CrossRef]
  4. Deng, H.J.; Ji, G.Y.; Yi, J.J.; Shang, L.; Jiang, A. Current status of copper–ore resources in China and screening of national copper–ore geological material data. China Min. Mag. 2016, 25, 143–149. [Google Scholar] [CrossRef]
  5. Skrzypkowski, K.; Gómez, R.; Zagórski, K.; Zagórska, A.; Gómez–Espina, R. Review of Underground Mining Methods in World–Class Base Metal Deposits: Experiences from Poland and Chile. Energies 2023, 16, 148. [Google Scholar] [CrossRef]
  6. Skrzypkowski, K.; Zagórski, K.; Zagórska, A.; Sengani, F. Access to Deposits as a Stage of Mining Works. Energies 2022, 15, 8740. [Google Scholar] [CrossRef]
  7. Wu, J.J. Study on Ore Drawing law and Structure Parameter Optimization in Natural Caving Method. Master’s Thesis, Central South University, Changsha, China, 2009. [Google Scholar] [CrossRef]
  8. Cao, H.; Yang, X.C.; Wang, H.; Yu, S. State of predicting cavability study for block caving. China Min. Mag. 2015, 24, 113–117. [Google Scholar] [CrossRef]
  9. Lan, Q.C. Design for novel natural caving mining technology and its application. Gold 2018, 39, 49–53. [Google Scholar]
  10. Yuan, H.P.; Cao, P. Present Status of Block Caving Development and lts Application Prospect in China. Met. Mine 2004, 8, 25–28. [Google Scholar] [CrossRef]
  11. Someehneshin, J.; Oraee-Mirzamani, B.; Oraee, K. Analytical Model Determining the Optimal Block Size in the Block Caving Mining Method. Indian Geotech. J. 2014, 45, 156–168. [Google Scholar] [CrossRef]
  12. Melati, S.; Wattimena, R.K.; Sahara, D.P.; Syafrizal; Simangunsong, G.M.; Hidayat, W.; Riyanto, E.; Felisia, R.R.S. Block Caving Mining Method: Transformation and Its Potency in Indonesia. Energies 2023, 16, 9. [Google Scholar] [CrossRef]
  13. Liang, Z.H.; Yu, Z.Q.; Guo, L.R.; Huang, S.; Qin, N.; Wen, Z. Evaluation of white sandstone mechanical behaviour and the energy evolution of prepeak unloading damage. Sci. Rep. 2022, 12, 2793. [Google Scholar] [CrossRef]
  14. Suzuki Morales, K.; Suorineni, F.T.; Hebblewhite, B. Orebody cavability prediction challenges in block caving mining—A review. Bull. Eng. Geol. Environ. 2023, 83, 23. [Google Scholar] [CrossRef]
  15. Trueman, R.; Pierce, M.; Wattimena, R. Quantifying stresses and support requirements in the undercut and production level drifts of block and panel caving mines. Int. J. Rock Mech. Min. Sci. 2002, 39, 617. [Google Scholar] [CrossRef]
  16. Zhe, Y.L.; Hou, K.P.; Cheng, Y.; Yang, J. Research on bottom structural stress state by natural caving method. Met. Mine 2018, 2, 61. [Google Scholar] [CrossRef]
  17. Liang, J.B.; Liu, H.W.; Feng, X.L. Numerical simulation study on advanced undercutting in block caving method. Min. Res. Dev. 2017, 37, 93. [Google Scholar] [CrossRef]
  18. Ding, Y.M. Research on stress distribution of extraction level excavations in block caving method. Non–Ferr. Met. Mine Part 1995, 3, 20. [Google Scholar]
  19. Su, S.L.; Gu, X.W.; Zhang, L.; Shi, X. Physical simulation test study on bearing characteristics of deep layered rock mass roadway. China Min. Mag. 2020, 29, 123–128. [Google Scholar] [CrossRef]
  20. Ge, Q.F.; Fan, W.L.; Zhu, W.G.; Chen, X. Application and research of block caving in Pulang copper mine. 3rd Int. Conf. Environ. Sci. Mater. Appl. ESMA 2018, 108, 042006. [Google Scholar] [CrossRef]
  21. Jiang, Z.G.; Yang, B.C. Numerical simulation of caving law in natural caving mining method based on deformable discrete element method. Rock Soil Mech. 2005, 26, 239–242. [Google Scholar] [CrossRef]
  22. Jing, L. A review of techniques, advances and outstanding issues in numerical modelling for rock mechanics and rock engineering. Int. J. Rock Mech. Min. Sci. 2003, 40, 283–353. [Google Scholar] [CrossRef]
  23. Cundall, P.A.; Strack, O.D.L. A discrete numerical model for granular assemblies. Géotechnique 1979, 29, 47–65. [Google Scholar] [CrossRef]
  24. Fan, W.L.; Liu, Y.M.; Ge, Q.F. Study on bottom structure stability in the undercutting process of block caving. China Mine Eng. 2017, 46, 1–4. [Google Scholar] [CrossRef]
  25. Lu, J.T.; Chu, H.T.; Lin, W.X.; Gong, Y. Research on Stability of Bottom Structure Based on FLAc3D Numerical Simulation. Min. Res. Dev. 2020, 40, 19–23. [Google Scholar]
  26. Xia, Z.Y.; Tan, Z.Y.; Pei, Q.Y.; Wang, J.H. Mechanism of ground pressure disaster evolution of extraction level excavations in blockcaving with high horizontal in situ stress. J. Harbin Inst. Technol. 2020, 52, 8. [Google Scholar]
  27. Yang, Z.Y.; Tan, Z.Y.; Xia, Z.Y.; Hong, W. Analysis with FLAc3D for Stability of Bottom Structure of Sublevel in Mining of Main Level of Ore Bodies. Min. Metall. Eng. 2022, 42, 6–10. [Google Scholar]
  28. Liu, Y.; Weng, L.; Chu, Z.F. Numerical investigation of rock dynamic fragmentation during rockslides using a coupled 3D FEM–DEM method. J. Mt. Sci. 2022, 19, 1051–1069. [Google Scholar] [CrossRef]
  29. Jiang, H.X.; Cai, Z.Y.; Zhao, H.H. Numerical study of hard rock breakage under indenter impact by the hybrid FDEM. Eng. Fract. Mech. 2020, 233, 107068. [Google Scholar] [CrossRef]
  30. Wu, Z.J.; Yu, F.Z.; Zhang, P.L.; Liu, X. Micro–mechanism study on rock breaking behavior under water jet impact using coupled SPH–FEM/DEM method with Voronoi grains. Eng. Anal. Bound. Elem. 2019, 108, 472–483. [Google Scholar] [CrossRef]
  31. Su, Z.D.; Zhou, S.Z.; Wang, C.H.; Sun, J.; Zeng, Y.; Zhang, J.; Zhang, M.; Wang, L.; Zhu, Z.; Li, X. Selection and application of experimental materials in physical simulation of engineering rock mass. Geol. Rev. 2023, 69, 1133–1149. [Google Scholar] [CrossRef]
  32. Li, Y.; Wang, Y.Y. Development and experimental analysis of similar materials for simulating creep characteristics of soft rock. J. Qingdao Agric. Univ. Nat. Sci. Ed. 2024. [Google Scholar]
  33. Wang, J.; Yang, Z.J.; He, J.T.; Xu, Z.; Li, W. Study on deformation of surrounding rock of underground coal bunker based on similar simulation experiment. Coal Min. Mach. 2022, 43, 65–68. [Google Scholar] [CrossRef]
  34. Dong, W.J.; Sun, Z.M.; Wang, J.C.; Chen, Z. Simulation test of similar materials in natural caving of ore body. Min. Technol. 2001, 3, 13–15. [Google Scholar] [CrossRef]
  35. Li, Y.B.; Ma, Y.P. Study on simulation test of similar materials in Longhu Coal Mine. J. Henan Coll. Urban Constr. 2024, 33, 26–33. [Google Scholar] [CrossRef]
  36. Cao, H.; Ma, G.; Liu, P.; Qin, X.; Wu, C.; Lu, J. Multi–Factor Analysis on the Stability of High Slopes in Open–Pit Mines. Appl. Sci. 2023, 13, 5940. [Google Scholar] [CrossRef]
  37. Ma, G.; Cao, H.; Tao, Z.; Lu, J.; Zhu, C. Experimental Study on Deformation and Failure Characteristics and Monitoring and Early Warning of Surrounding Rock of Tunnel Crossing Sliding Surface. Rock Mech. Rock Eng. 2023, 56, 9035–9056. [Google Scholar] [CrossRef]
  38. Tang, Q. Research on Inclined and Medium–Thickness Phosphate Ore Body’ Stope Strata Behaviors and the Overlying Strata’Failure Law of Caving Method. Master’s Thesis, Chongqing University, Chongqing, China, 2012. [Google Scholar]
  39. Liu, C.Y.; Liu, H.D.; Chen, Y.Q.; Yang, P.; Wang, C.; Yang, J. Failure laws of overburden and mechanisms of water inrush and support crushing in extra–thick coal seam mining within anticline structural. J. Min. Saf. Eng. 2024, 1–14. [Google Scholar]
Figure 1. Bottom plan graph.
Applsci 14 04704 g001
Figure 2. The flowchart of the Simulation Analysis Framework.
Applsci 14 04704 g002
Figure 3. Overarching Model. (a) Geometric models. (b) Network models.
Applsci 14 04704 g003
Figure 4. Geostress balance’s resultant diagram: (a) x-stress, (b) y-stress, and (c) z-stress.
Applsci 14 04704 g004
Figure 5. Vertical displacement of the ore body during the bottoming process: (a) Step 1, (b) Step 3, (c) Step 5, (d) Step 10, (e) Step 15, and (f) Step 21.
Applsci 14 04704 g005
Figure 6. Vertical stress map of the ore body during the bottoming process: (a) Step 2, (b) Step 5, (c) Step 10, (d) Step 15, (e) Step 21, and (f) Step 21 (cross-section).
Applsci 14 04704 g006
Figure 7. Horizontal stress map of the ore body during the bottoming process: (a) Step 2, (b) Step 5, (c) Step 10, (d) Step 15, (e) Step 21, and (f) Step 21 (cross-section).
Applsci 14 04704 g007
Figure 8. Damage rupture extension cloud map of the ore body bottoming process: (a) Step 2, (b) Step 5, (c) Step 10, (d) Step 15, (e) Step 21, and (f) Step 21 (cross-section).
Applsci 14 04704 g008aApplsci 14 04704 g008b
Figure 9. Standard specimens.
Applsci 14 04704 g009
Figure 10. Schematic diagram of the Copper Hill Mine II ore body model.
Applsci 14 04704 g010
Figure 11. Layout diagram of displacement monitoring points.
Applsci 14 04704 g011
Figure 12. Layout of measurement points and excavation sequence diagram.
Applsci 14 04704 g012
Figure 13. Deformation and damage law of overburden rock: (a) drawdown width 20 m, (b) drawdown width 60 m, (c) drawdown width 100 m, (d) drawdown width 140 m, (e) drawdown width 180 m, (f) drawdown width 220 m, (g) drawdown width 260 m, and (h) drawdown width 300 m.
Applsci 14 04704 g013
Figure 14. Pressure distribution graph: (a) roof pressure distribution curve; (b) bottom plate pressure distribution curve.
Applsci 14 04704 g014
Figure 15. Schematic diagram of the top plate displacement and sinking: (a) advancement of drawdown width to 80 m, (b) advancement of draw-down width to 120 m, and (c) advancement of drawdown width to 170 m.
Applsci 14 04704 g015
Table 1. Model input parameters.
ParameterUnitRock–BodyOre BodyFaultPrefabricated Joints
DensityKg/m3276527802770
Modulus of deformationGPa15.7716.150.73
Poisson’s ratio0.260.280.31
Tensile strengthMPa0.260.340.040.1
CohesionMPa5.075.220.280.75
Angle of internal friction°39.2639.0727.6529.24
Type I fracture energyJ/m21441445032
Type II fracture energyJ/m230030015090
Normal contact stiffnessGPa71.3153.428.0
Tangential contact stiffnessMN/m71305342800
Contact friction coefficient0.730.620.5
Normal stiffness of nodal unitGPa360036004003600
Tangential stiffness of nodal unitGPa360036004003600
Table 2. Similar material ratio number and material amount.
Ratio NumberSandGypsumPutty PowderTotal Weight
7370.70.090.211.0
8370.80.060.141.0
9370.90.030.071.0
9.5370.950.0150.0351.0
9.5730.950.0350.0151.0
9.5550.950.0250.0251.0
10371.00.030.071.1
10551.00.050.051.1
10731.00.070.031.1
11731.10.070.031.2
11551.10.050.051.2
11371.10.030.071.2
Table 3. Comparative test results of similar materials.
NoRatio NumberCompressive Strength/MPaAverage Compressive Strength/MPaNoRatio NumberCompressive Strength/MPaAverage Compressive Strength/MPa
17371.71.422410370.440.31
20.96250.35
31.91260.36
41.112710550.340.355
58370.871.0725280.38
61.68290.33
70.76300.37
80.983110730.380.365
99370.520.515320.33
100.42330.37
110.59340.38
120.533511730.360.3075
139.5370.370.2775360.38
140.24370.24
150.29380.25
169.5730.280.30753911550.140.1575
170.3400.14
180.28410.18
199.5550.30.3420.17
200.284311370.130.145
210.31440.14
220.31450.18
2310370.45 460.13
Disclaimer/Publisher’s Note: The statements, opinions and data contained in all publications are solely those of the individual author(s) and contributor(s) and not of MDPI and/or the editor(s). MDPI and/or the editor(s) disclaim responsibility for any injury to people or property resulting from any ideas, methods, instructions or products referred to in the content.

