Article

Differentiated Interval Structural Characteristics of Wufeng−Longmaxi Formation Deep Shale Gas Reservoirs in Western Chongqing Area, China: Experimental Investigation Based on Low-Field Nuclear Magnetic Resonance (NMR) and Fractal Modeling

1
Artificial Intelligence Research Institute, China University of Mining & Technology, Xuzhou 221116, China
2
Sunyueqi Honors College, China University of Mining and Technology, Xuzhou 221116, China
3
School of Earth Sciences, Nanjing University, Nanjing 210023, China
4
Chongqing Institute of Geology and Mineral Resources, Chongqing 401120, China
5
Chongqing Industry Polytechnic College, Chongqing 401120, China
6
School of Resources and Geosciences, China University of Mining and Technology, Xuzhou 221116, China
7
School of Chemical Engineering, University of Queensland, Brisbane 4072, Australia
*
Authors to whom correspondence should be addressed.
Appl. Sci. 2024, 14(11), 4733; https://doi.org/10.3390/app14114733
Submission received: 21 April 2024 / Revised: 22 May 2024 / Accepted: 25 May 2024 / Published: 30 May 2024
(This article belongs to the Special Issue State-of-the-Art Earth Sciences and Geography in China)

Abstract

:
The study of deep shale gas (>3500 m) has become a new research hotspot in the field of shale gas research in China. In this study, 16 representative deep shale samples were selected from different layers of the Wufeng–Longmaxi Formation in the Z-3 well in the western Chongqing area to conduct low-field nuclear magnetic resonance (NMR) tests, field-emission scanning electron microscopy (FE-SEM) observation, and fractal modeling. By comparing the differences in pore structure and their influencing factors in representative samples from different layers, the particularities of high-quality reservoirs have been revealed. The results show that the Z-3 well shales mainly develop micropores and mesopores, with pore sizes of 1 nm–200 nm. The fractal dimensions of bound fluid pores D1 (1.6895–2.3821) and fractal dimension of movable fluid pores D2 (2.9914–2.9996) were obtained from T2 spectra and linear fitting, and the pores were divided into three sections based on the NMR fractal characteristics. TOC content was one of the major factors affecting the gas content in the study area. The shale samples in the bottom S1l1-1 sub-layer with a higher TOC content have larger porosity and permeability, leading to enhanced homogeneity of the pore structure and favorable conditions for shale gas adsorption. A comparative understanding of the particularities of pore structure and influencing factors in high-quality reservoirs with higher gas content will provide the scientific basis for further exploration and exploitation of the Wufeng–Longmaxi Formation deep shale reservoirs in the western Chongqing area.

1. Introduction

In recent years, China has achieved remarkable progress in the exploration of shale gas resources, making it the third-largest producer of shale gas in the world [1,2]. In this process, scholars and the industry have not only continuously made breakthroughs in shale gas exploitation in major resource-bearing basins, including the Sichuan Basin, but also established a systematic geological understanding of shale gas enrichment and accumulation in China [3,4]. With the continuous mining of medium and shallow shale gas resources, the development of deep shale gas reserves, at depths exceeding 3500 m, has become a crucial issue for the sustainable growth and long-term development of the shale gas industry [5]. The Wufeng–Longmaxi Formation shale reservoirs in the Sichuan Basin have great potential for deep shale gas exploration and development. It is noteworthy that deep shale wells in western Chongqing have exhibited good productivity capacities, showing promising development prospects [6]. However, the geological conditions of deep shale are more complicated, and the factors affecting the gas content of medium–shallow and deep shale gas fields are very different [7,8]. Therefore, deepening the understanding of deep shale reservoir characteristics is a fundamental basis for the evaluation of potential reserves and the effectiveness of shale gas exploration. Pore structure parameters are critical indicators of reservoir quality, performing an essential role in the evaluation and prediction of shale gas resources [9,10]. Shale gas reservoirs are characterized by complex nanoscale pore systems, and a comprehensive understanding of the pore system’s structural characteristics is key to estimating gas content and assessing the productivity of the reservoir. Furthermore, the microscopic pore structure of deep shale reservoirs exhibits strong complexity and heterogeneity, which directly affects gas enrichment and is also an important influencing factor for the effectiveness of reservoir evaluation and prediction results [5]. The application of complementary methods and fractal theory is of great importance to form a comprehensive understanding of the particularity and heterogeneity of pore structure. NMR methods are widely used to acquire pore size distributions by measuring T2 relaxation time distributions [11,12,13,14]. The measurement of shale pore structure using NMR methods has been proven to be a reliable technique. NMR is one of the precise methods for characterizing pore size distributions in natural porous media [15,16]. Compared with high-pressure mercury injection and gas adsorption methods, NMR measurement is fast, accurate, nondestructive, and has a wide measuring range [14,16]. Previous studies have shown that shale reservoir pores have a certain degree of self-similarity [17,18]. Therefore, fractal theory can quantitatively analyze pore networks’ complexity and heterogeneity and has gained widespread application in the analysis of rock pore structure [19,20]. Shale reservoir pores are developed at both nanoscale and microscale, and fractal modeling can be used as a powerful tool for measuring their non-intuitive characteristics. In this study, a qualitative–quantitative combined investigation was conducted to reveal the pore structure and fractal characteristics of representative deep shale samples from the Wufeng–Longmaxi Formation in the western Chongqing area based on low-field nuclear magnetic resonance (NMR) and fractal modeling methods. Samples from different layers were selected to obtain information on the pore development degree, pore size distribution, and complexity of the pore system, and to compare the differences between layers. Field-emission scanning electron microscopy (FE-SEM) was employed to observe and examine the morphological characteristics of different types of pores at different scales. Several related factors that influence the fractal dimension and pore structure were analyzed to provide a detailed evaluation of the microstorage space and a detailed explanation of high-quality reservoir development mechanisms. The influencing factors in pore development and the particularity of high gas-bearing reservoirs are discussed to provide scientific guidance for further deep shale gas exploration and prediction.

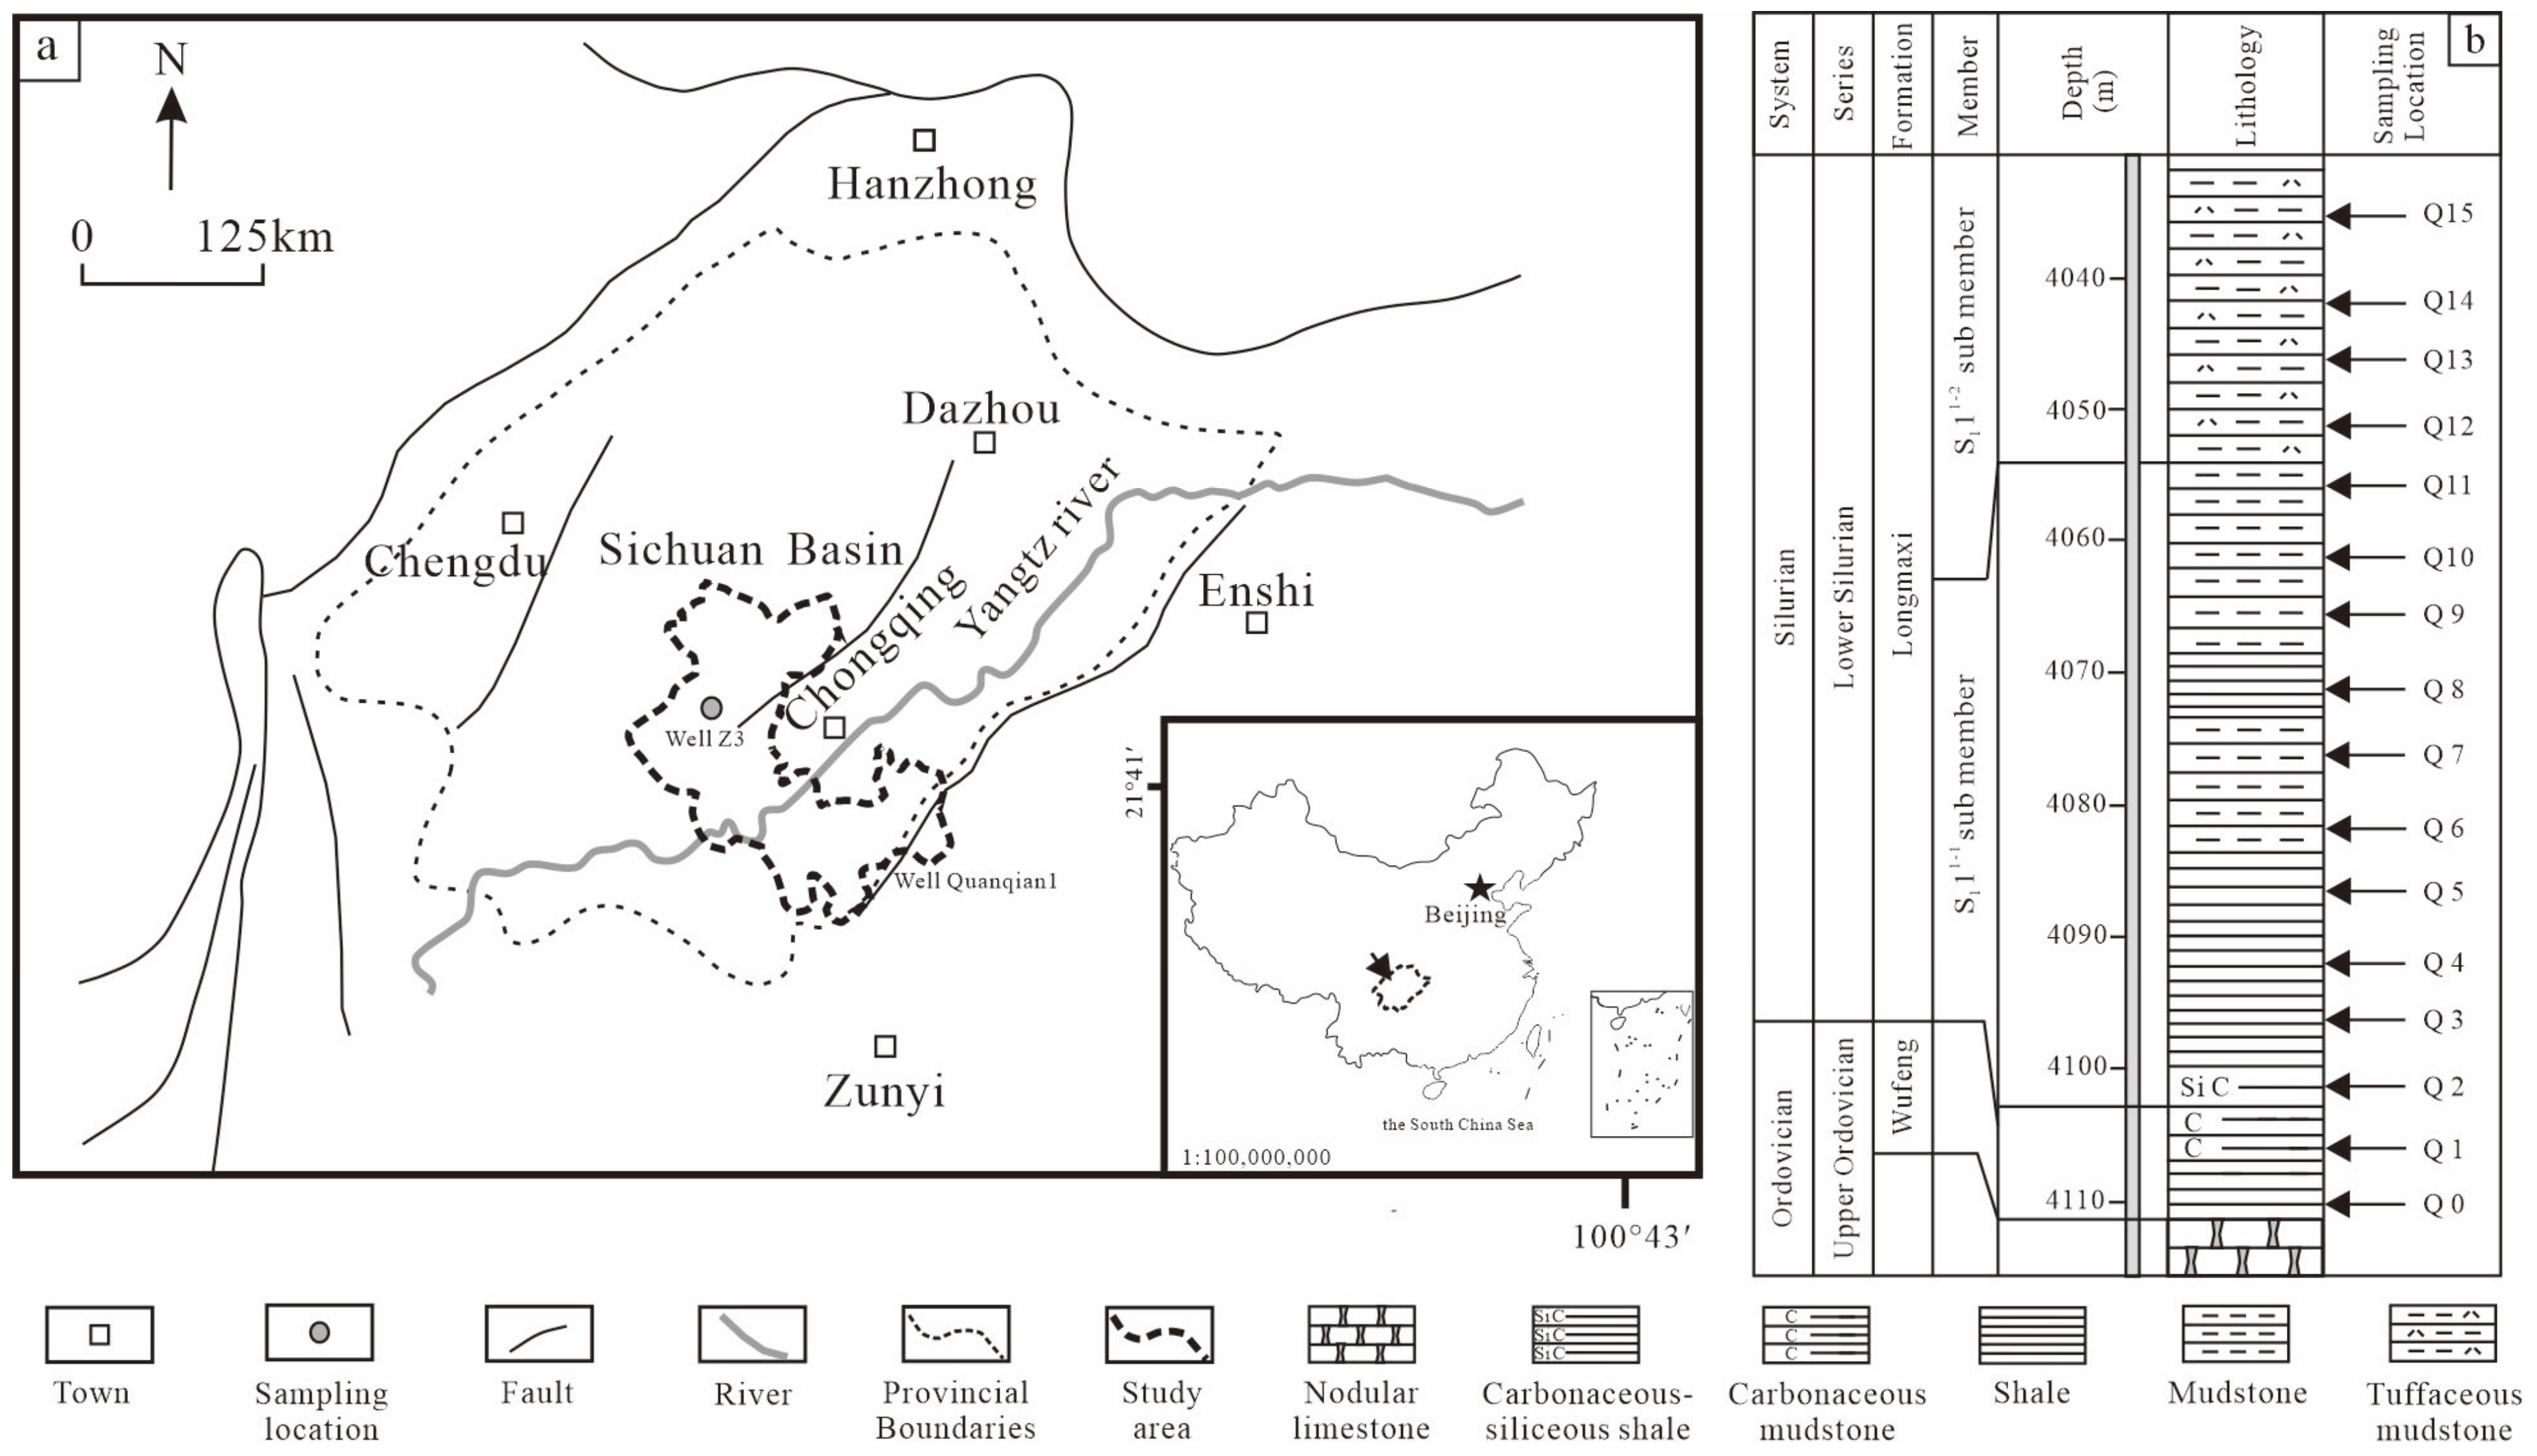
2. Geological Setting and Sampling

The research area is located in the Dazu block of the western Sichuan Basin (Figure 1). Multiple sets of black gas-bearing shale strata have developed in the Sichuan Basin. Among them, the Wufeng–Longmaxi Formation is currently the main target strata for achieving commercial exploitation of shale gas. In the past decade, the utilization of middle–shallow shale gas resources in the Sichuan Basin achieved rapid development. In recent years, the exploration targets for shale gas have shifted towards deep shale. The Dazu block is a region that has successfully achieved commercial development of deep shale gas. In the study area, the Z-3 well is a representative borehole with high production capacity. The Z-3 well is located in the middle of the Puluchang syncline, between the low–gentle tectonic area of the central Sichuan uplift and the southern Sichuan low–steep fold belt. The sedimentary environment of the Wufeng Formation and the S1l1-1 sub-layer in the study area is mainly deep-water continental shelf facies. The lithology is mainly composed of black siliceous shale, black carbonaceous shale, and gray-black silty shale.
In total, 16 representative samples were selected from the S1l1-1 sub-layer of the Longmaxi Formation from the Z-3 well of the Dazu block in the western Chongqing area for experimental testing and analysis. The S1l1-1 sub-layer of the Longmaxi Formation can be partitioned into four sub-layers based on the sequence stratigraphic wavelet analysis, reservoir petrological characteristics, and sedimentary facies markers [21,22]. Representative samples were selected from these four sub-layers and the underlying Wufeng Formation, as well as the overlying S1l1-2 sub-layer (Table 1). There are significant differences in mineral composition, total organic carbon (TOC) content, and physical features among the different layers, with extremely significant heterogeneity [23]. The interval differences in reservoir development within the sequence framework of the Longmaxi Formation can serve as a basis for reservoir evaluation and exploration. Sample Q0 was selected from the Wufeng Formation. Samples Q1 and Q2 were selected from the bottom of the Longmaxi Formation, with the lithology of black carbonaceous shale. The horizontal beddings of Samples Q0–Q3 are highly developed, and the bedding planes are rich in graptolite fossils. Samples Q3–Q5, Q6–Q9, and Q10–Q12 were selected from the lower, middle, and upper parts of the S1l1-1 sub-layer, respectively. Within the S1l1-1 sub-layer, the content of silty minerals in the samples relatively increases, while the development of horizontal bedding deteriorates. Q13–Q15 were selected from the S1l1-2 sub-layer. The lithology of the Q13–Q15 samples is mainly silty mudstone and muddy siltstone. In addition to differences in mineral composition, sedimentary structure, organic matter content, and physical properties, the mechanical brittleness of the Z-3 well was proven to have interlayer differences. The TOC content of the 16 samples in the Z-3 well ranged between 0.23% and 4.76%, with an average value of 1.97%. The TOC content of the Wufeng–Longmaxi Formation shale gradually decreases from the deep to shallow layers. The samples were rich in quartz, ranging from 23.5% to 70.1%, which increased with the TOC content and burial depth in the Longmaxi formation.

3. Experiments and Methods

3.1. NMR Tests

Using X-ray diffraction (XRD) and total organic carbon (TOC) measurements of the selected samples, this study further employed low-field nuclear magnetic resonance (NMR) analyses to quantitatively study the characteristics of the pore structures. The MesoMR23-060H-I instrument of Niumai Electric Technology limited liability company in Shanghai, China was used for the NMR tests, with experimental conditions of 200 KHz resonance frequency, 0.1 ms echo interval, 1000 ms waiting time (TW), 5000 echo number, and a scan count of 64. The experiments were conducted to obtain information on the T2 distribution of the samples under conditions of oil and water saturation, which can be approximated by the transverse relaxation time:
1 T 2 = 1 T 2 S = ρ S V = F S ρ r
where ρ is the surface relaxivity, µm/ms; and S/V is the ratio of pore-specific surface area to volume, µm−1. FS is the pore shape factor, related to the pore properties, with cylindrical pore FS being 2 and spherical pore FS being 3. r is the pore radius. Considering FS and ρ as constants, with FS taken to be 2 and ρ taken to be 50 μm/ms, the relationship between the pore diameter and the T2 relaxation time can be described as:
d = 4 × ρ × T 2
According to the correlation between NMR signals and shale pores tested, pore structure characteristics such as pore size distribution, NMR porosity, and permeability can be obtained. Based on Equation (2) and the basic principle of NMR, the relaxation times of the T2 spectra of 0.02–1 ms, 1–10 ms, 10–100 ms, and 100–1000 ms correspond to pores with pore sizes of 1 nm–20 nm, 20 nm–200 nm, 0.2 µm–2 µm, and 2 µm–20 µm, respectively.

3.2. Fractal Modeling Based on NMR Data

Previous studies on shale reservoirs have suggested that the pore systems possess fractal properties [24,25,26]. Fractal theory is a powerful analytical tool for measuring the complex and irregular pore structure of various types of rocks. Based on the T2 spectrum distribution of the samples obtained by NMR experiments, the fractal theory is introduced to analyze the fractal features of shale pores, and the complexity and non-intuitive characteristics of the pore structures are further investigated. The equation for calculating the fractal dimension using NMR is presented as follows [27]:
lg S = 3 D lg T 2 + D 3 lg ( T 2 m a x )
In Formula (3), S denotes the ratio of accumulated pore volume with a relaxation time less than T2 to the overall pore volume. D represents the fractal dimension, and T2max is the maximum relaxation time.
Given that the samples display self-similar pore structures and demonstrate fractal characteristics, the fractal dimension can be determined by evaluating the slope ‘k’ of Equation (4):
D = 3 k
Assuming that pores with pore sizes of 1 nm–20 nm and 20 nm–200 nm correspond to bound fluids, and pores with sizes of 0.2 µm–20 µm correspond to movable fluids, a certain T2 value can be selected to divide movable and bound fluids based on the correlation between the T2 relaxation time distribution and pore size distribution, which is called the T2cutoff value.

4. Results

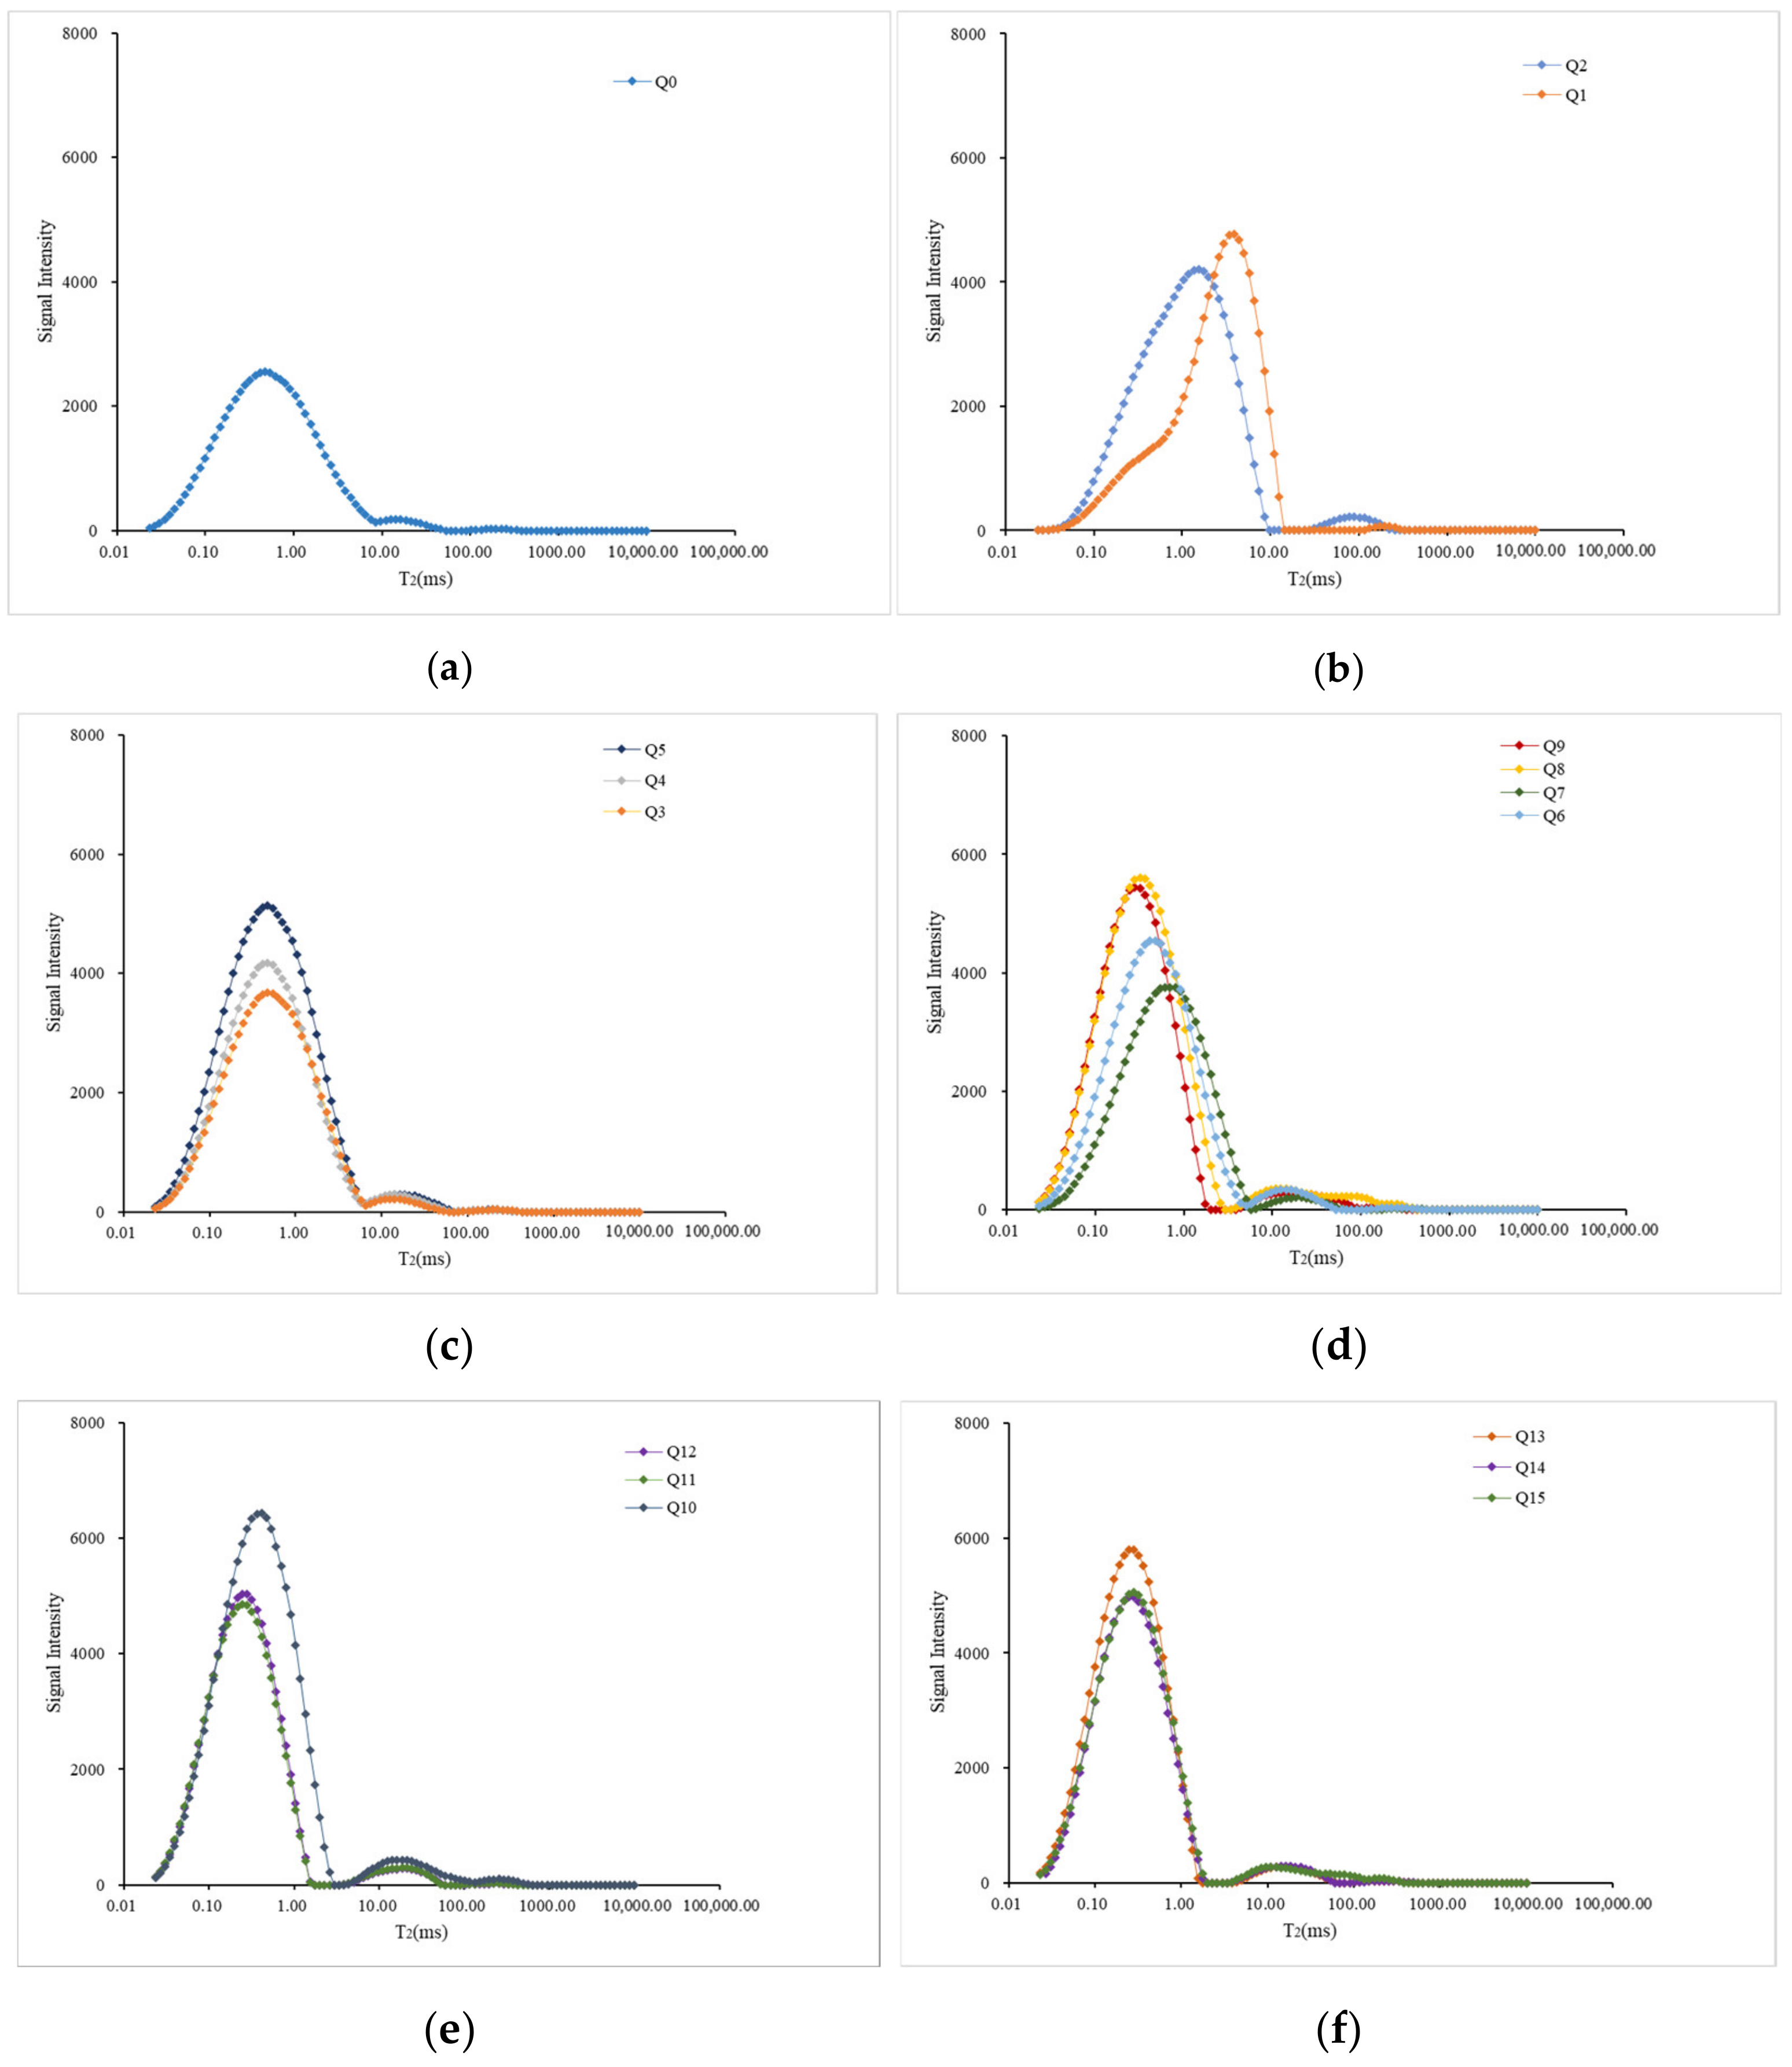
4.1. NMR T2 Spectrum and Related Pore Structure Parameters

Through NMR experiments, the connections between T2 relaxation time and signal intensity of 16 shale samples were obtained (Figure 2). The T2 spectrum mainly exhibited distinct double peaks, and the left peak was the major peak for most of the tested samples. The T2 relaxation times varied from 0.2466 ms to 3.8606 ms for the left peak signals, indicative of pores with diameters from 1 nm to 200 nm. The right peak signals exhibited relaxation times from 11.0094 ms to 331.8049 ms, corresponding to larger pores ranging in size from 0.2 µm to 20 µm. The plots in Figure 2 display a wide range of pore sizes, indicating strong complexity in pore size distribution. In addition, for most of the tested samples, the values in the interval between the two peaks approached zero, indicating the discontinuity between the two groups of pores represented by the left and right peaks. The T2 spectra of most shale samples show peaks at 0.1–1 ms, and the left peaks are much more significant than the right peaks, showing that the NMR T2 curves’ morphology of shale samples are dominantly contributed by pores with pore size ranging from 1 nm to 200 nm. The proportion of the storage capacity provided by pores with pore sizes ranging from 1 nm to 200 nm is much larger than the proportion provided by pores with pore sizes ranging from 0.2 µm to 20 µm.
NMR is an effective approach to obtain pore size distribution of shale samples [28]. The pore size distribution of the Wufeng–Longmaxi Formation in the Z-3 well is shown in Figure 3 based on T2 spectrum data. The pore size of the Wufeng–Longmaxi shale samples is mainly within the 1–100 nm range, with a notable secondary distribution from 100 nm to 1 µm.
NMR characterizes the pore structures in rocks by generating relaxation signals from hydrogen nuclei under an external magnetic field and measuring T2 relaxation time spectra established by fluid hydrogen nuclear relaxation signals in pores of different radii. Therefore, analyzing the T2 spectrum is a feasible way to characterize the pore structure of shale and investigate non-intuitive features, such as fractal features [11].
The integral area of the T2 spectrum is directly proportional to the hydrogen content of the fluid in the core pores, and the correlation between the nuclear magnetic signal and the porosity can be obtained by calibrating the nuclear magnetic porosity of the rock samples to be tested. The results (Table 2) show that the NMR porosity of the Wufeng–Longmaxi Formation in the Z-3 well ranges from 2.61% to 4.81%, with an average value of 4.33%. The T2 cutoff value of 16 tested samples ranges from 2.2861 ms to 68.8991 ms, averaging at 24.89 ms. The permeability of the samples obtained by Coates’ model varies from 0.00011 mD to 0.235 mD, and the average value is 0.01566 mD.

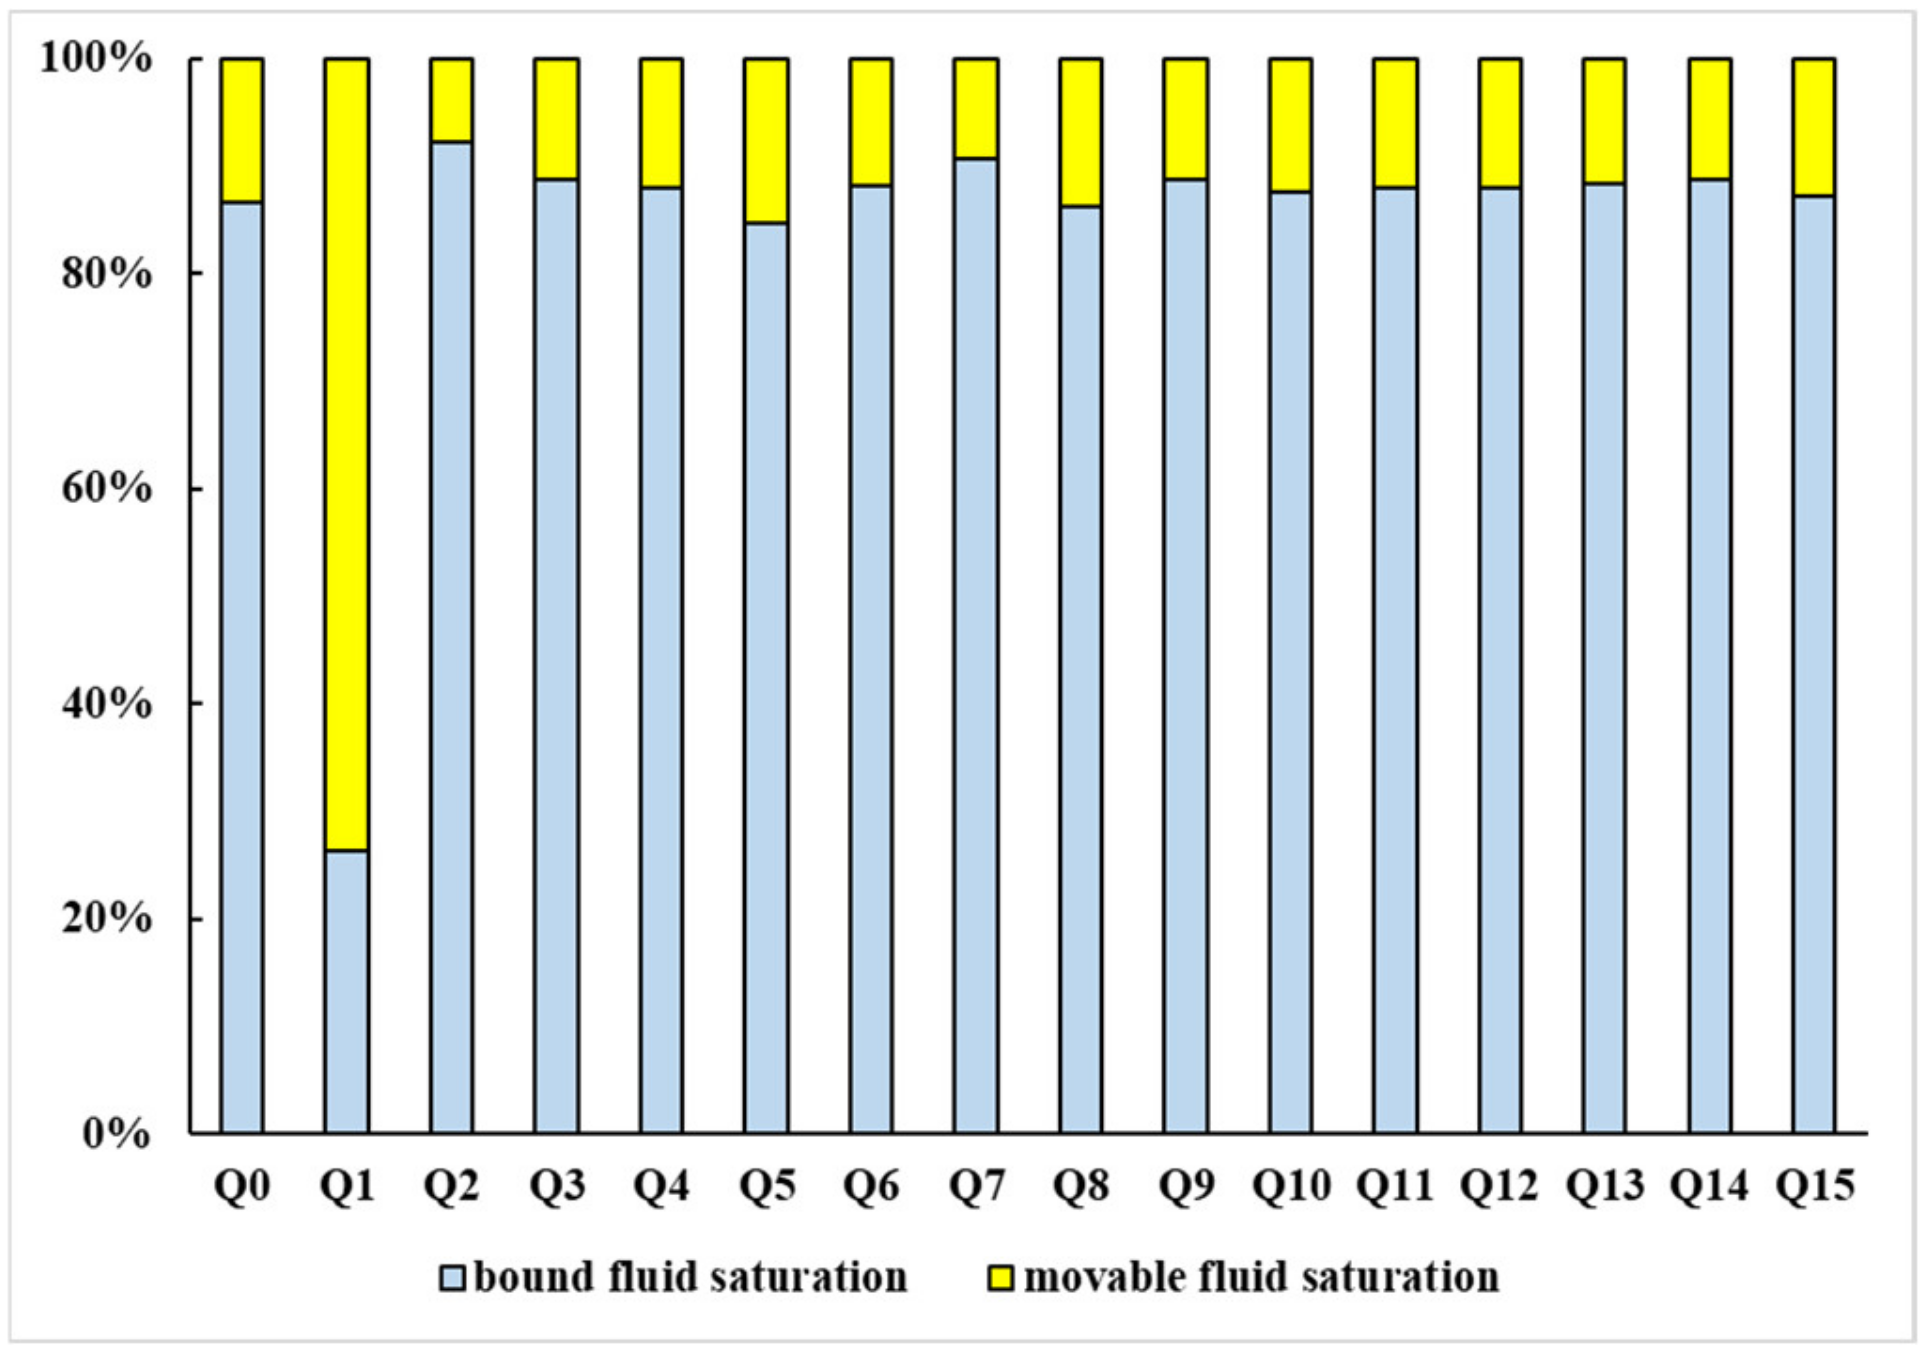
4.2. Bound and Movable Fluids

During oil and gas migration, a certain amount of water remains in the pore system, almost non-flowing, called bound water. Bound water is mostly distributed in the pores with pore sizes smaller than 200 nm, whose presence and distribution are significantly influenced by the solid properties. The corresponding saturation of bound water is called bound water saturation. The saturation of movable fluids reflects the amount of fluid that can be collected and produced in a reservoir, which is of great significance for reservoir evaluation and exploitation.
The bound water saturation of tested samples from the Z-3 well ranged from 26.41% to 92.2%, with an average value of 84.24% (Figure 4). The higher the saturation of the bound fluid, the more pores with sizes ranging from 1 nm to 200 nm developed in the sample. The pores with a pore size larger than 0.2 µm are more developed, with higher saturation of the movable fluid, showing better flow capacity of the reservoir. The samples exhibit a relatively high bound water saturation, while the movable fluid saturation tends to be relatively low, which represents the high proportion of pores with a pore size of 1 nm–200 nm in the relaxation time of T2 spectrum distribution. Thus, pores with a pore size of less than 100 nm are more developed in the samples and composed of the major microstorage space. Note that the movable fluid saturation of Sample Q1 is much higher than the bound fluid saturation, indicating the unique pore structure.
The T2 spectrum of the Q1 sample is characterized by a prolonged T2 relaxation time, with no distinct peak observed between pore sizes ranging from 1 nm to 20 nm, as well as between 20 nm and 100 nm (Figure 3). Moreover, the permeability of the Q1 sample is significantly better than the other layers. The significant difference between the saturation of movable fluid in Sample Q1 and other samples indicates that the high saturation of movable fluid contributes to favorable conditions for percolation. The enlarged pore size and improved connectivity promote the generation of sufficient storage space and efficient paths for fluid flow in the reservoir.

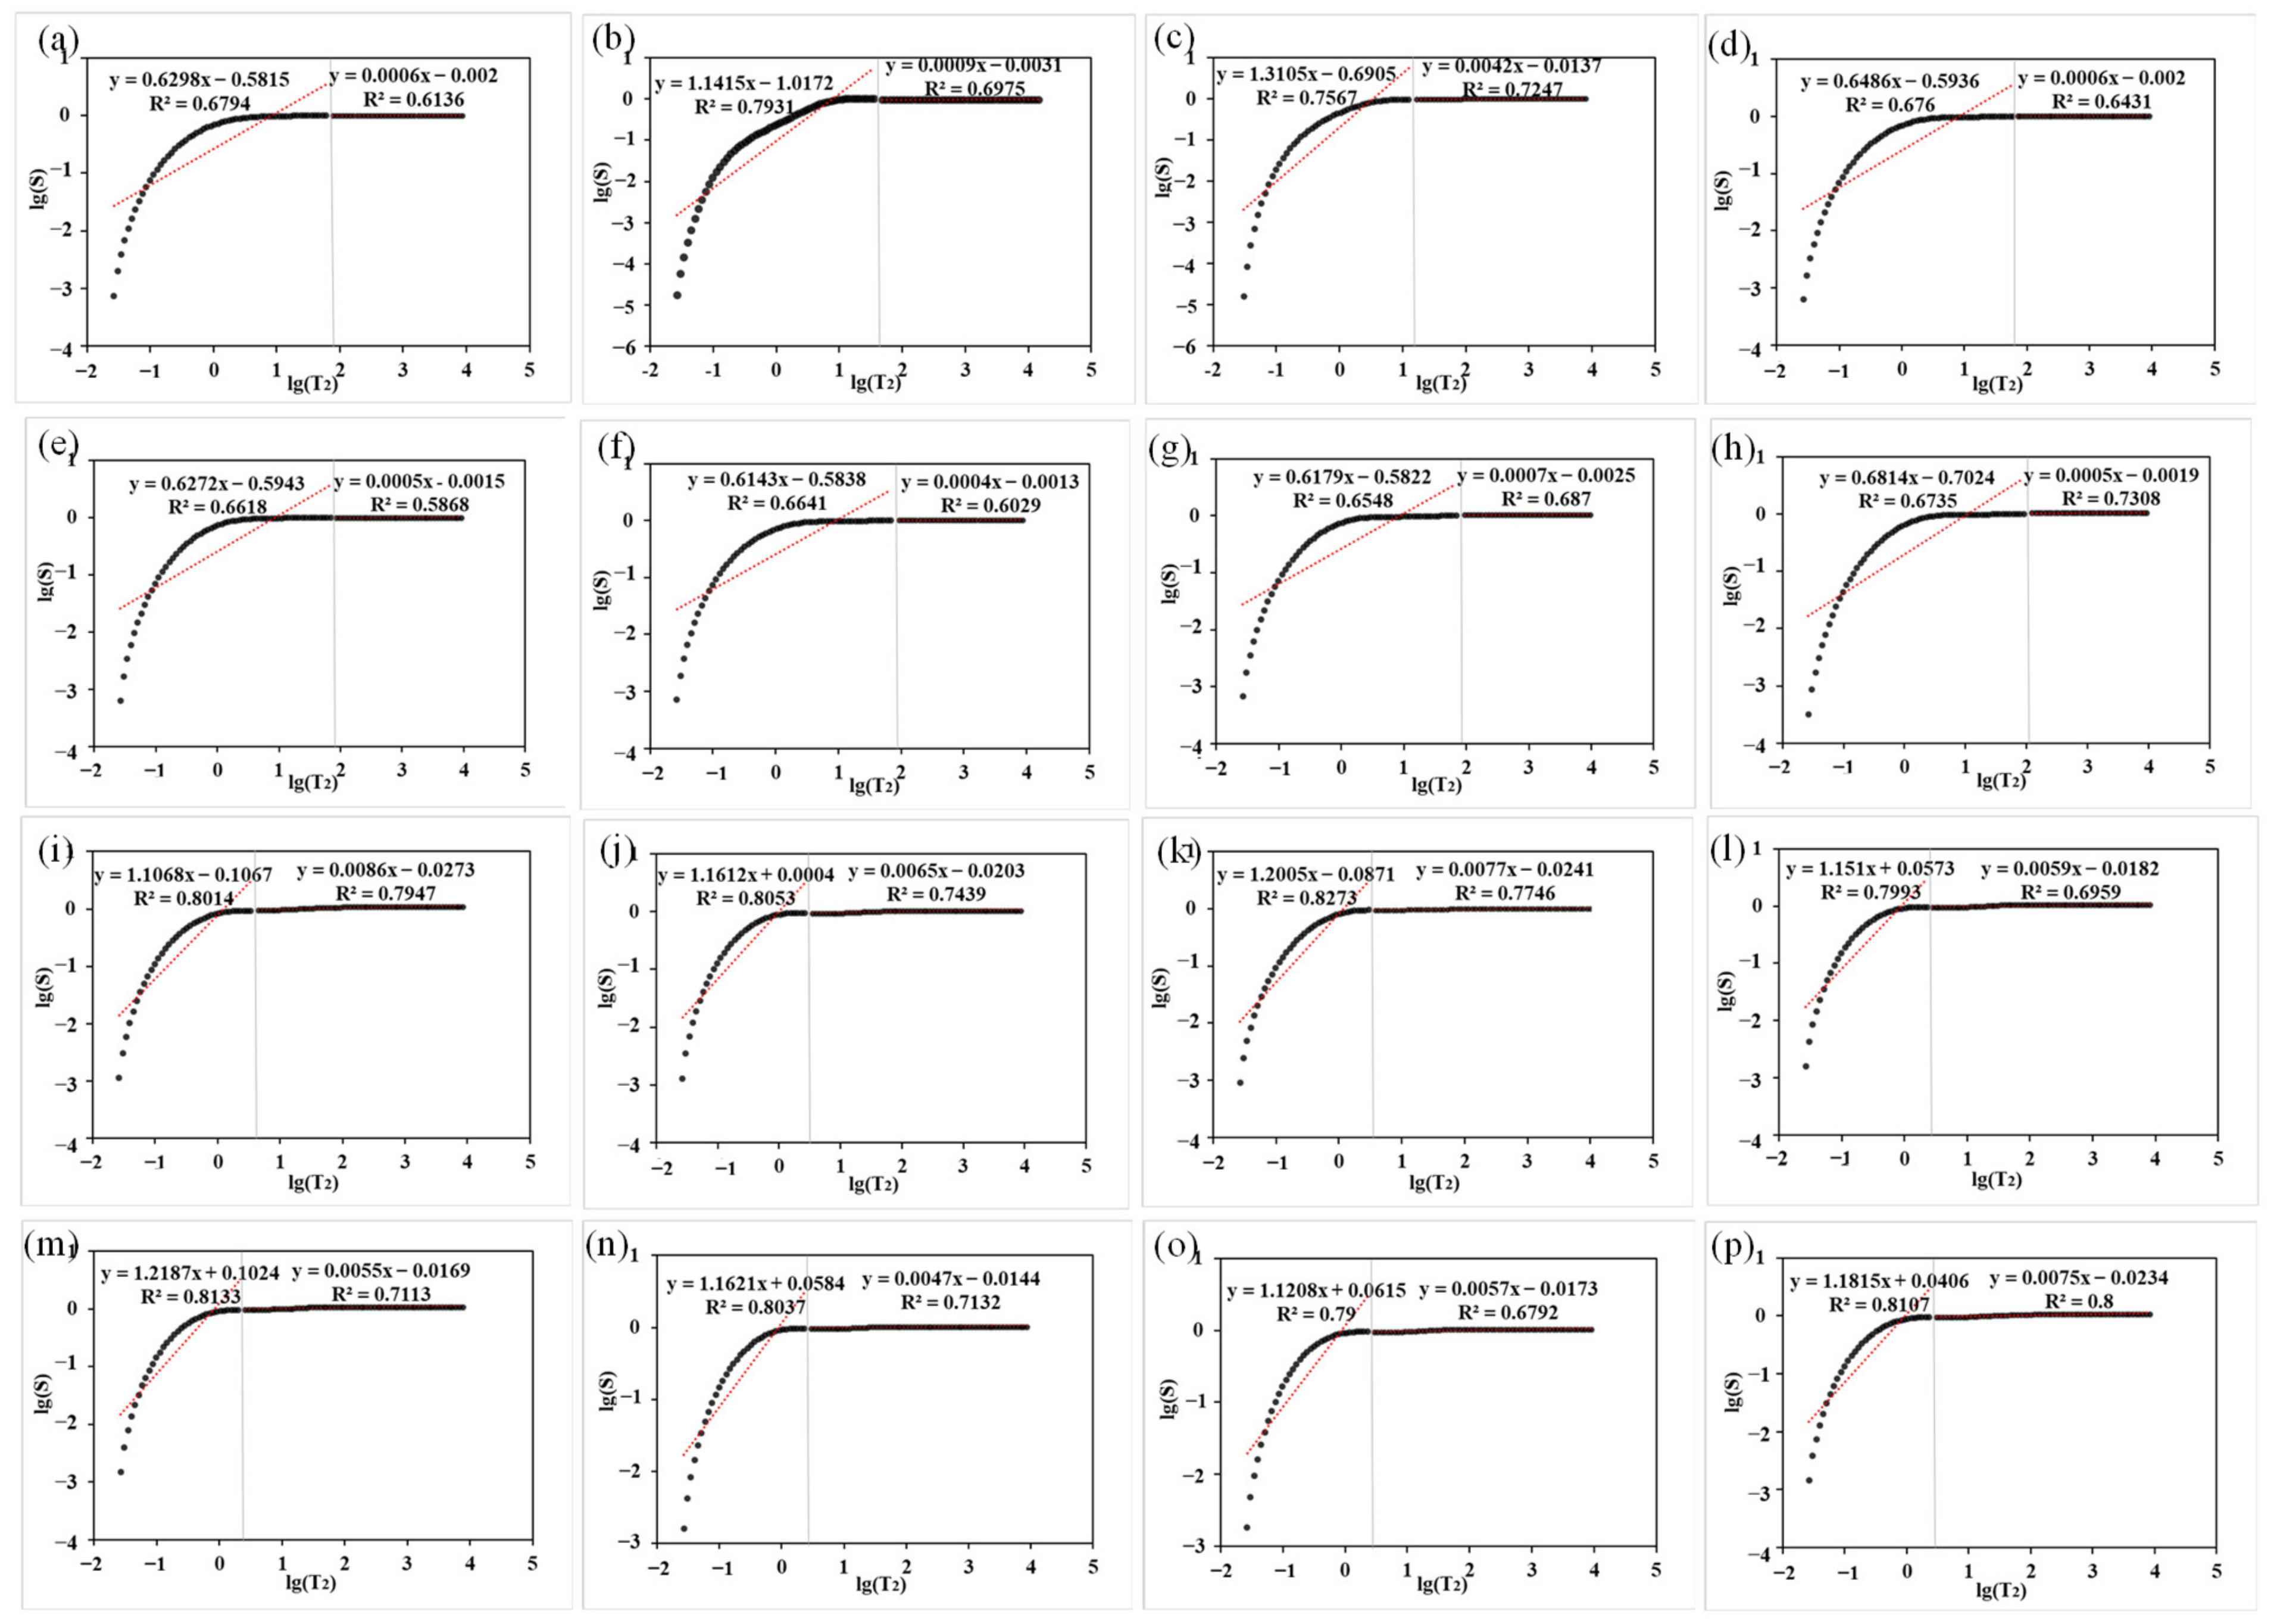
4.3. NMR Fractal Characteristics

During the investigation of the heterogeneity and non-intuitive characteristics of pore structure, T2cutoff value (T2C) was used as an effective point for relaxation time that partitioned the fractal curve into two sections [29]. It is believed that pores with relaxation time less than T2C represent bound fluid pores, and pores with relaxation time exceeding T2C are movable fluid pores.
The T2 spectrum of the Wufeng–Longmaxi Formation shale samples mainly presented as double peaks (Figure 2). Therefore, the T2C value of shale can be calculated based on T2 morphology, which means that the T2 value corresponding to the lowest point between the two peaks is used as the T2C. The fractal dimensions obtained from the T2 distribution’s segments, where the T2 values exceeded the T2C, characterized the fractal dimensions of movable fluid pores (D2), and the fractal dimensions calculated from segments with T2 that were smaller than the T2C referred to the fractal dimensions of bound fluid pores (D1).
By analyzing the plots of lg(S) versus lg(T2), the NMR fractal dimensions of the 16 shale samples in the study area are depicted in Figure 5, which demonstrates a clear characteristic of a two-section pattern. By linearly fitting the two segmented curves, D1 and D2, respectively, were calculated (Table 3). The fractal dimension (D1) of the bound fluid pores in the shale samples ranges from 1.6895 to 2.3821, with an average value of 2.0267. The fractal dimension (D2) of movable fluid pores ranges from 2.9914 to 2.9996, with an average value of 2.9962. Overall, the data indicates the relatively strong heterogeneity of the movable fluid pores of shale samples in the Z-3 well. According to the linear regression coefficient, R2, the average value of the first segment linear fitting coefficients is 0.75 and that of the second segment is 0.7, indicating that the shale pore structure based on NMR experiments has certain fractal characteristics, and this method is reasonable for characterizing pore structure.
The range of self-similarity in pore size is often used as the basis for the internal division of pore systems [30,31,32]. Based on the NMR fractal features of pores and the extent of fractal fitting, the pore sizes of tested samples from the Wufeng–Longmaxi Formation in the Z-3 well can be further classified into three categories: micropores (<0.1 µm), mesopores (0.1 µm–1.0 µm), and macropores (>1.0 µm). By plotting lg(S)−lg(R) curves, three segments of pores with differentiated pore structures can be observed, where R is the pore radius (Figure 6). This classification scheme represents the characteristics of the pore structure in different pore size ranges.
The linear regression coefficient of movable fluid pores is smaller than that of bound fluid pores. Thus, the bound fluid pores exhibit stronger fractal characteristics than the movable fluid pores. In addition, the D1 values are all smaller than D2, which indicates that pores with larger diameters have a more heterogeneous pore structure. Also, there seems to be a positive correlation between D1 and D2 of the lower S1l1-1 sub-layer and its upper layer in the Longmaxi Formation in the Z-3 well (Figure 7). To a certain degree, both D1 and D2 can represent the complexity of the overall pore structure in the middle and upper Longmaxi Formation. According to Table 3 and Table 4, shale pores in the bottom S1l1-1 sub-layer (Layer 2) are significantly different from the other shale layers in terms of pore structure parameters and fractal dimension.

5. Discussion

5.1. Quantitative Characterization of Reservoir Pore Structure

Different types of pore volume proportions can be obtained based on the pore classification (Table 4). The total pore volume of the Wufeng–Longmaxi Formation in the Z-3 well varies from 9.96 × 10⁻³ cm3 to 25.006 × 10⁻³ cm3 at different depths, with an average value of 15.5543 × 10⁻³ cm3. The volume of macropores ranges from 0.0399 × 10⁻³ cm3 to 1.570 × 10⁻³ cm3, with an average value of 0.6331 × 10⁻³ cm3, accounting for 0.21% to 7.8% of the total volume and an average proportion of 3.77%. The volume of mesopores ranges from 0.481 × 10⁻³ cm3 to 11.370 × 10⁻³ cm3 (avg. 5.007 × 10⁻³ cm3), which accounted for 3.34% to 63.47% of the total pore volume, with an average percentage of 30.72%. The volume of micropores varies from 4.949 × 10⁻³ cm3 to 17.868 × 10⁻³ cm3 (avg. 65.51%), with an average proportion of 65.51% and a range from 28.72% to 96.37%.
Therefore, the pore volume of the Wufeng–Longmaxi Formation in the Z-3 well is mainly comprised of micropores and mesopores, dominated by micropores, which verifies the analysis of the characteristics of the pore size distribution curves. The analysis shown in Figure 8 reveals that the proportion of micropore volume displays moderately negative correlations with the burial depth, while the proportion of mesopore volume exhibits moderately positive correlations with depth.
As shown in Figure 9, the mesopore volume exhibited a weak positive linear relationship to TOC content and no obvious relationship to quartz content. The TOC content is indicative of the richness of organic matter. Hence, mesopores of the Wufeng–Longmaxi Formation shales mainly consist of organic matter pores.

5.2. Relationship between Fractal Dimensions and Physical Properties

The correlation analysis of pore structure parameters and fractal dimensions of shale samples from the Wufeng–Longmaxi Formation was conducted. The physical characteristics of shale reservoirs can be evaluated by key parameters such as porosity and permeability. According to Q1’s pore size distribution (Figure 3) and fluid saturation features (Figure 4), the Q1 sample exhibits strong peculiarities. Except for the Q1 sample, the relationship between permeability and porosity of the other shale samples is shown in Figure 10. There is a strong exponential increase (R2 = 0.9229) in correlation between shale permeability and porosity.
The bound fluid fractal dimension (D1) and movable fluid fractal dimension (D2) have no obvious correlation with porosity and permeability in the Z-3 well (Figure 11). Scholars confirmed that as the movable fluid fractal dimension increased, the reservoir pore structure became more complex and the seepage capacity deteriorated [33]. In this study, the porosity and permeability of shale reservoirs are speculated to be influenced by multiple and complex factors that need further study.

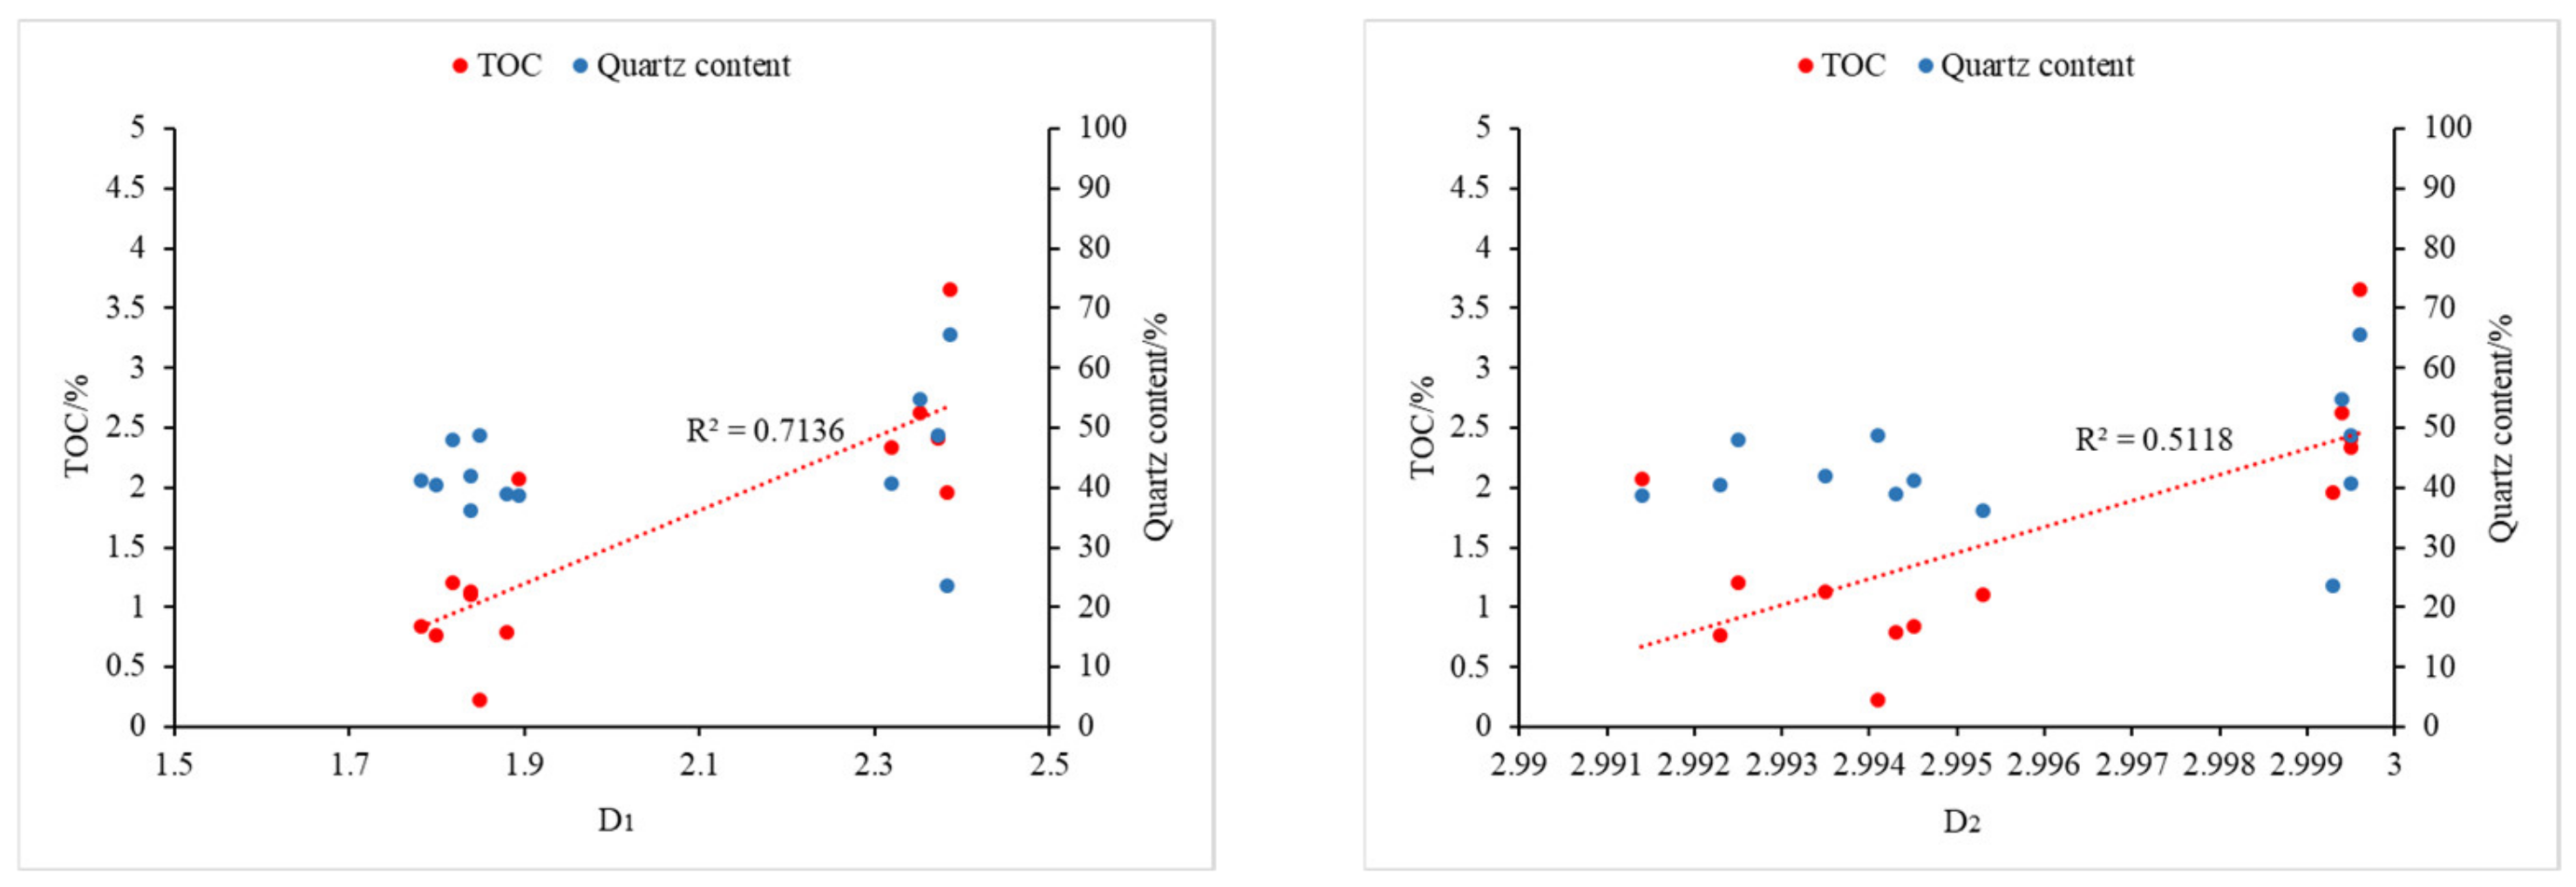
5.3. Relationship between NMR Fractal Dimension and Mineral Compositions

The relationships between TOC content, different mineral composition, and NMR fractal dimensions of the lower S1l1-1 sub-layer and its upper layer samples were also investigated (Figure 12). The plots show that bound fluid pore fractal dimensions and movable fluid pore fractal dimensions have moderate positive correlations with TOC content while showing no correlation with quartz content. Previous studies have also demonstrated the absence of a correlation between fractal dimensions and quartz concentration due to the fact that the quartz surface is rather smooth and has fewer pores [15,34].
Previous research explained the increased number of micropores resulting from higher TOC and the number of micropores is mainly influenced by the specific surface area [34]. Therefore, the increasing TOC content leads to a significant increase in pores within the organic matter, thereby facilitating the development of micropores derived from the organic matter pores [35]. The pore system of shales in the middle and upper parts of the S1l1-1 sub-layer are developed with less complicated structures and thus lead to lower fractal dimensions.
Heterogeneous pore space distribution was formed during the hydrocarbon process, influenced by the differences in structure, composition, and intensity of decomposition or condensation reactions within organic matter [36]. This process facilitated the expansion of storage space and enhanced pore connectivity. Thus, the TOC content exhibits a relatively weak positive correlation with the fractal dimension of the movable fluid pores (D2).

5.4. The Particularities and Influencing Factors of High-Quality Reservoir Pore System

The optimization of engineering transformation layers as fracturing and mining targets in gas-bearing strata requires an understanding of the unique characteristics (particularities) of high-quality reservoirs [37,38,39]. The results of NMR testing, fractal modeling, and comparison of representative samples from different layers of the S1l1-1 sub-layer suggest that the pore system of gas-rich layers is developed with particularities, compared with other layers.
Based on NMR results and pore structure parameters, the bottom S1l1-1 sub-layer of shale reservoirs is developed with higher porosity and permeability, and pore sizes are more concentrated in the range of 20 nm to 2 µm. The saturation of the movable fluid is much higher than that of samples from other layers (Figure 4). Previous studies have revealed that the shale in the research area exhibits a maximum maturity index (Ro) of less than 3.5% [39], indicating that the reservoir is currently in a favorable stage for the development of organic pores. The observation results of FE-SEM also confirmed that the main type of nanopores in the bottom S1l1-1 sub-layer of shale reservoirs is organic matter pores (Figure 13a). The presence of numerous organic matter micropores indicates that the high concentration of organic matter in this layer promotes the development of micropores and increases the storage space in the reservoir. In addition, the micro reservoir space with a pore size of >1 µm is more developed in the bottom S1l1-1 sub-layer shale, resulting in a high saturation of movable fluids and enhancing the permeability conditions of the reservoir. FE-SEM images show that these micro reservoir spaces are mainly microfractures and mineral-related pores in the shale matrix (Figure 13b).
Based on image processing, pore types were classified into 16 shale samples, and the result of a typical sample is shown in Figure 14a,b. Organic pores are highly developed in the Q1 sample from the bottom Longmaxi Formation (Figure 14c). Inorganic pores account for a large proportion in the middle Longmaxi Formation shale sample, Q6 (Figure 14d). By comparing the samples of the bottom Longmaxi Formation with samples from other layers, the particular pore system of gas-rich layers can be further analyzed. According to the fractal linear fitting results and SEM image processing results, the fractal dimensions of the shale samples in the bottom S1l1-1 sub-layer are smaller than samples from other layers. This phenomenon may be due to the higher TOC content and the quantity of organic pores in this layer. Therefore, the pore types in this layer of the reservoir are more singular, leading to enhanced homogeneity. Organic matter pores provide abundant microspaces for gas adsorption and enrichment. It is notable that the TOC values of the test samples are positively correlated with the fractal dimensions, but Sample Q1 has a high organic matter content with a smaller fractal dimension. This may be due to the singular pore types of Sample Q1 resulting in weaker complexity of the microstructure, showing a decrease in fractal dimension.
The gas content in shale reservoirs is mainly influenced by several factors, such as the TOC content and thermal maturity of the organic matter. The relevance analysis reveals a correlation between the TOC content and gas content of shale samples from the Wufeng–Longmaxi Formation, as shown in Figure 15. A positive correlation is observed between gas content and TOC content, with an R2 value of 0.7277. Therefore, TOC content could potentially be the main influencing factor in shale gas content. As the organic matter goes through hydrocarbon generation during geological burial processes, modified by shale reservoir diagenesis, developed organic nanopores are formed that enhance the adsorption and storage capacity of the reservoir. Rich shale gas in the reservoir is also formed during this process. Overall, the accumulation of shale gas in the Wufeng–Longmaxi Formation reservoirs of the Z-3 well is influenced by multiple factors. TOC content is one of the most important factors among them. The bottom S1l1-1 sub-layer section of the shale reservoir has a high TOC content, a high level of organic matter pore development, and good porosity and permeability, which is conducive to the adsorption and storage of shale gas. The total gas content of shale samples in the bottom S1l1-1 sub-layer is greater than 2 m3/t, and the TOC content exceeds 4%, which indicates that the bottom S1l1-1 sub-layer should be regarded as a higher prioritized layer for exploration.

6. Conclusions

Differentiated interval structural characteristics of the Wufeng–Longmaxi Formation deep shale reservoirs in the western Chongqing area were studied through an experimental investigation based on low-field nuclear magnetic resonance (NMR) and fractal modeling methods. The following conclusions were obtained in this study.
(1)
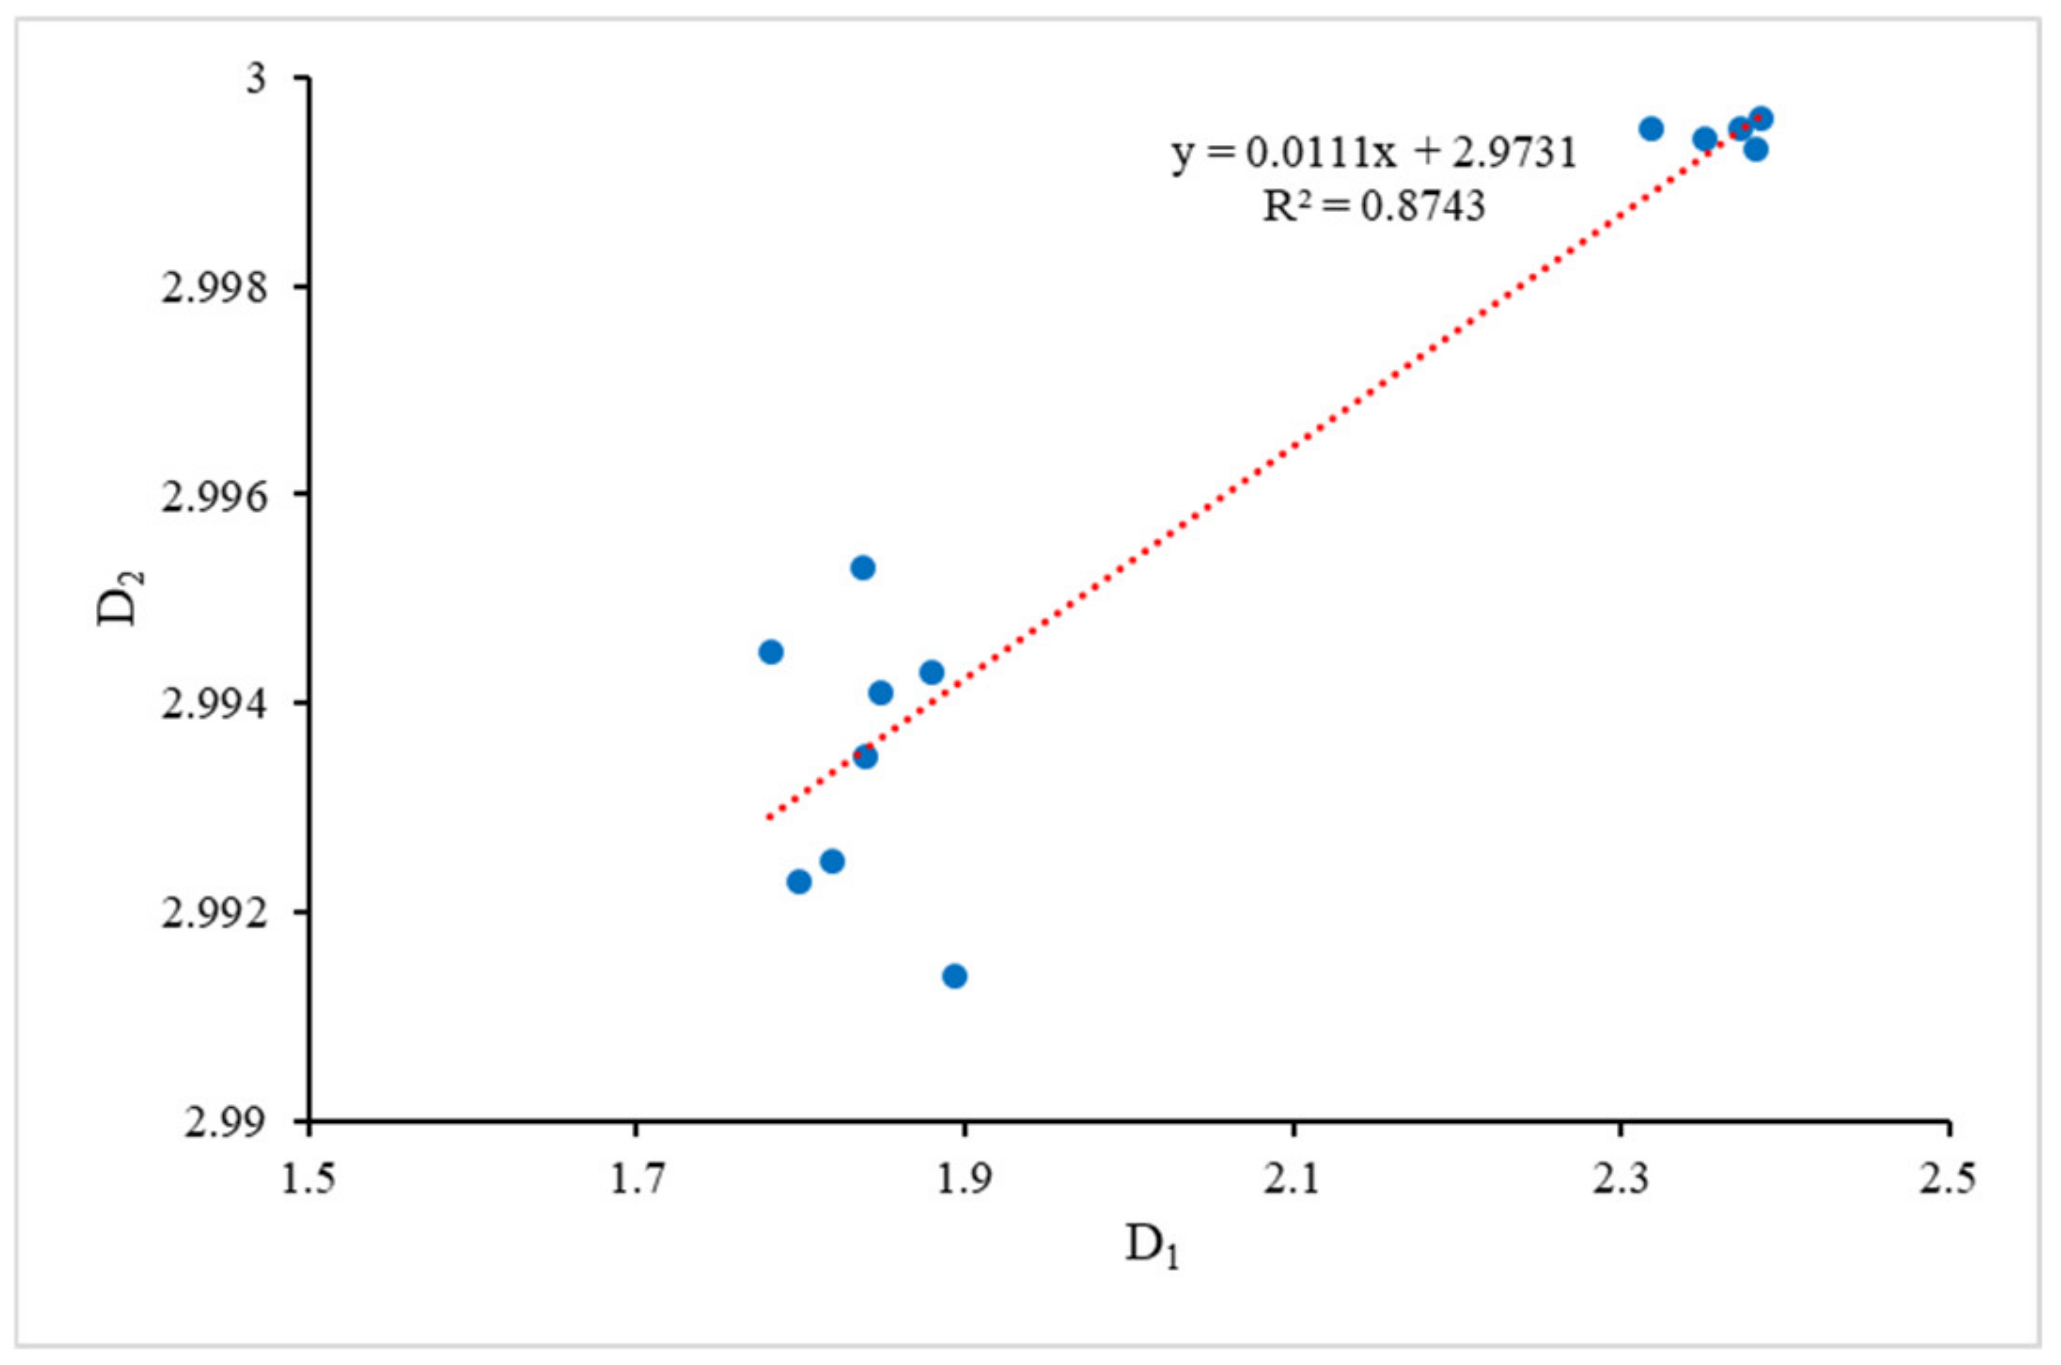
The pore structure of the Wufeng–Longmaxi Formation shale from the western Chongqing area was fractal to a degree. The fractal dimension of bound fluid pores (D1) based on NMR tests ranged from 1.6895 to 2.3821, and the fractal dimension of movable fluid pores (D2) ranged from 2.9914 to 2.9996, indicating that the pore systems are complicated and heterogeneous. In addition, both D1 and D2 can represent the complexity of the overall pore structure in the middle and upper Longmaxi Formation.
(2)
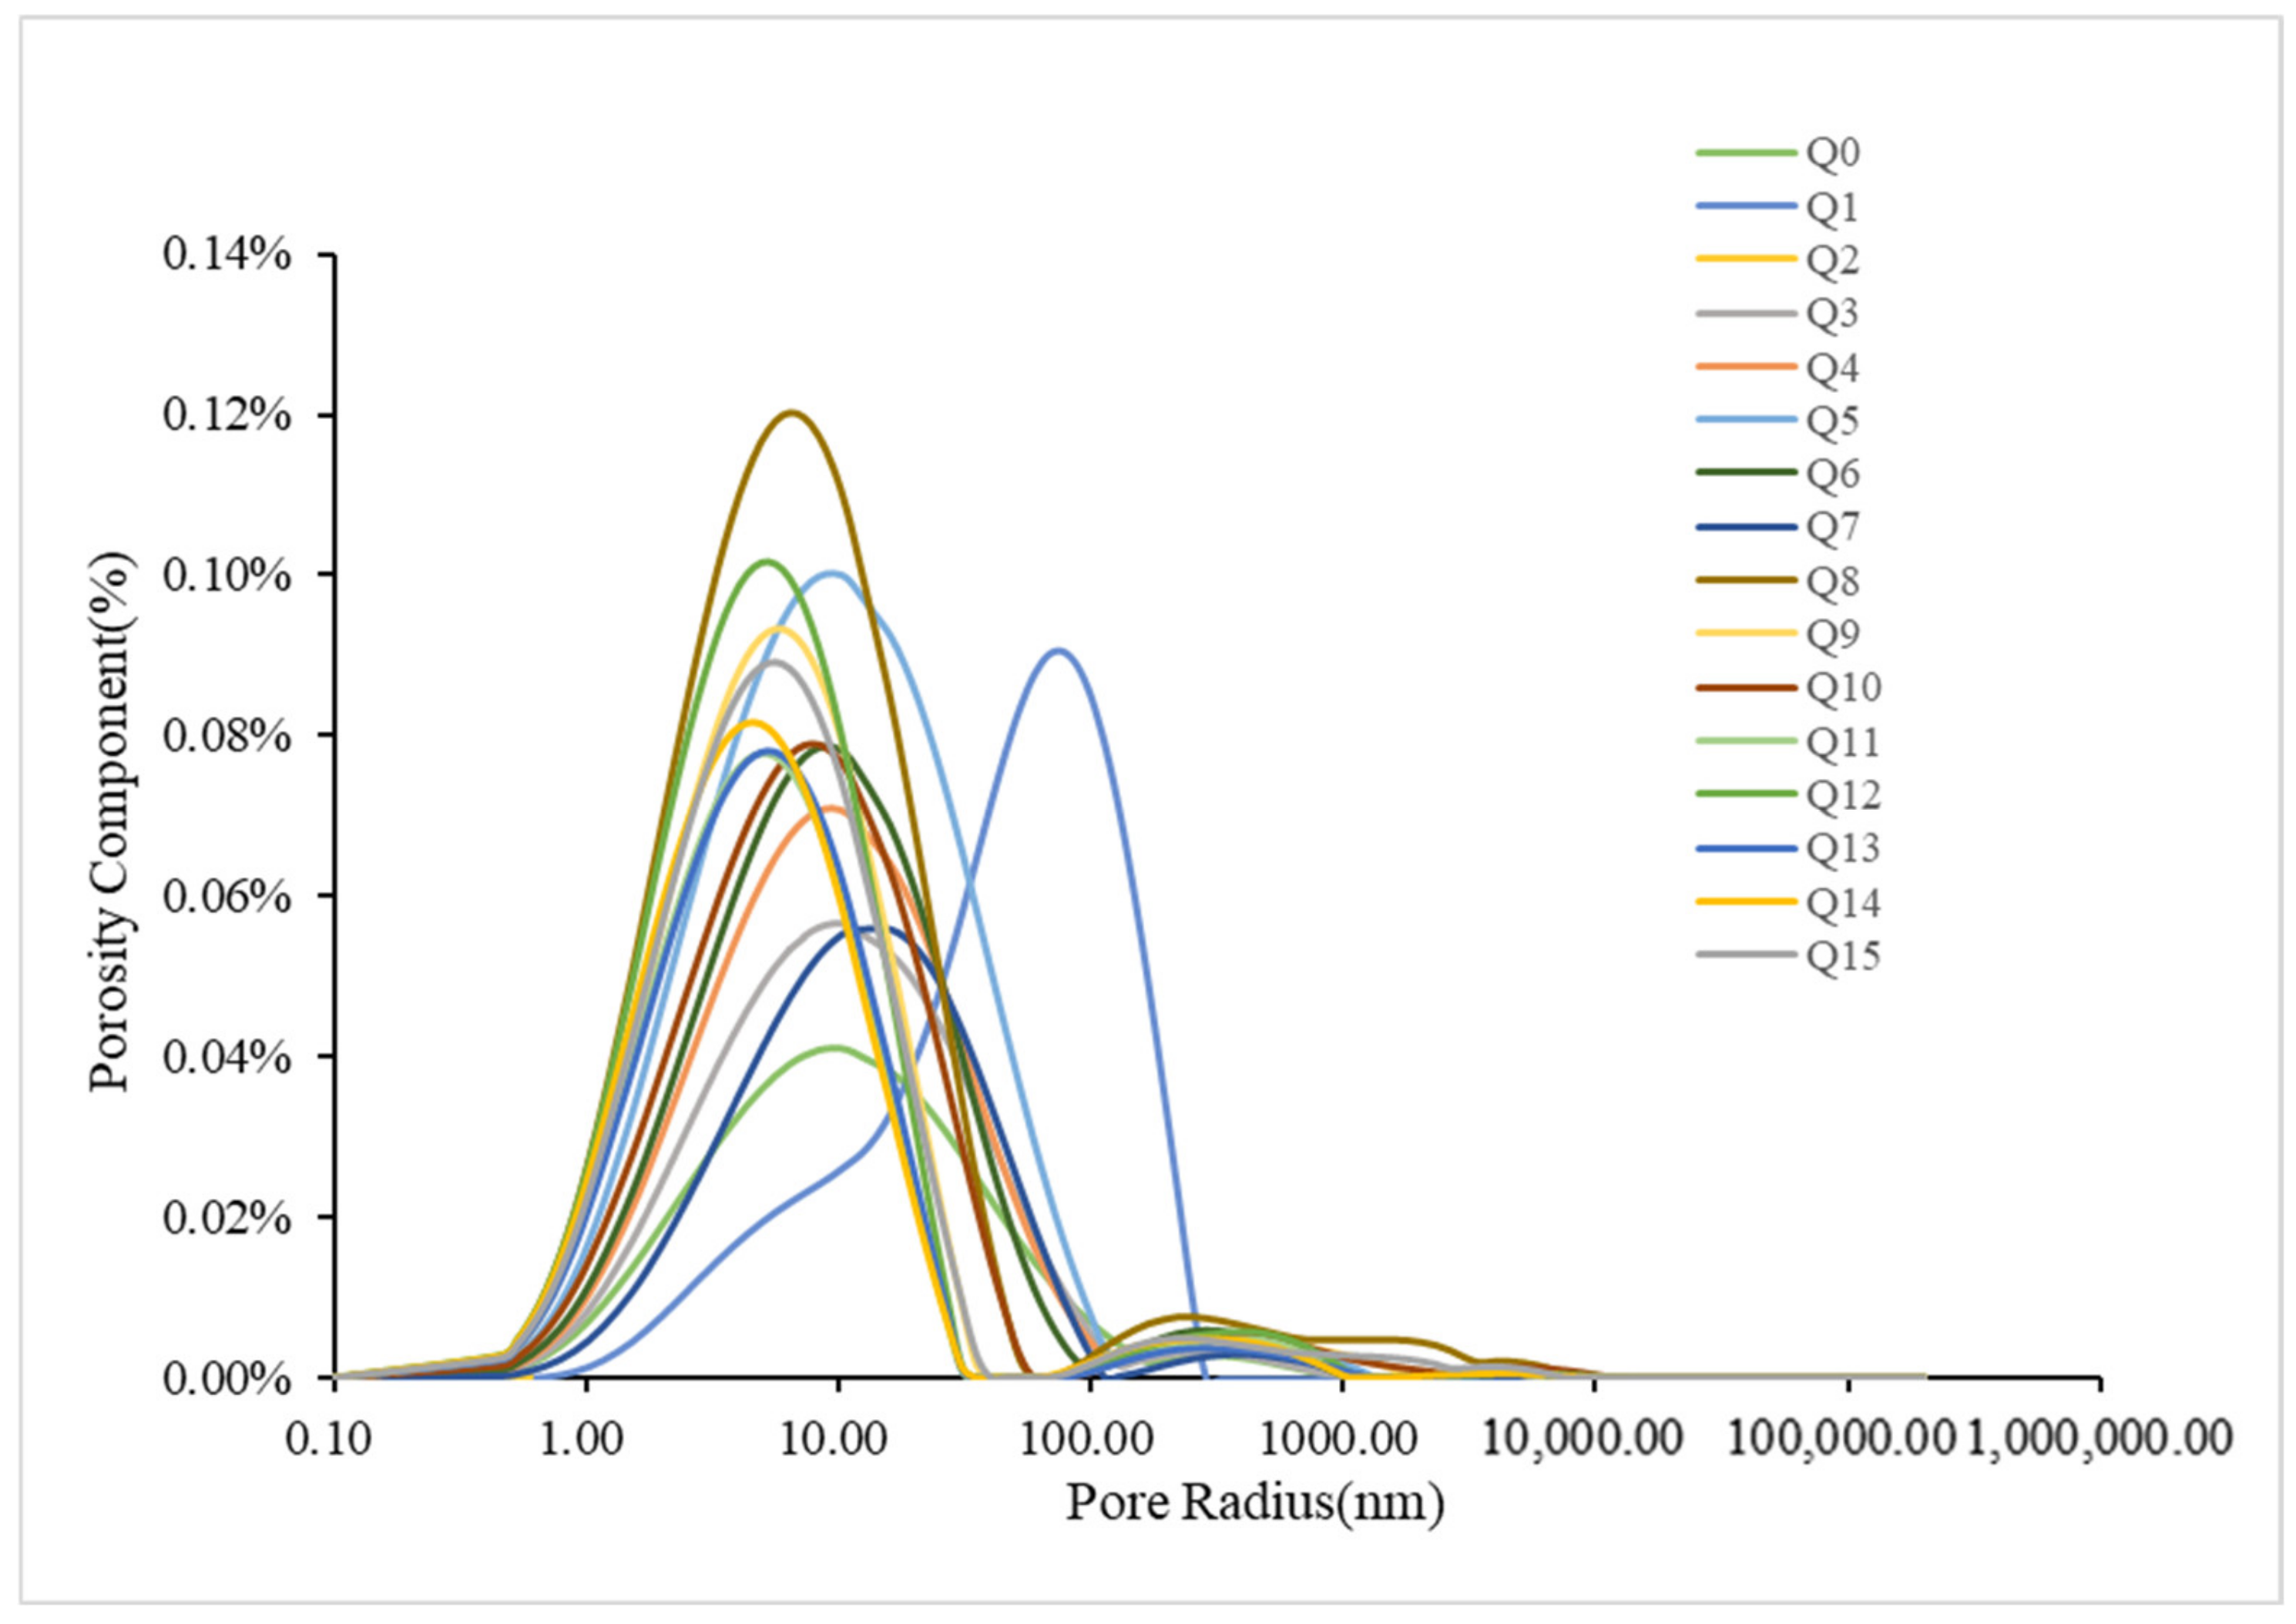
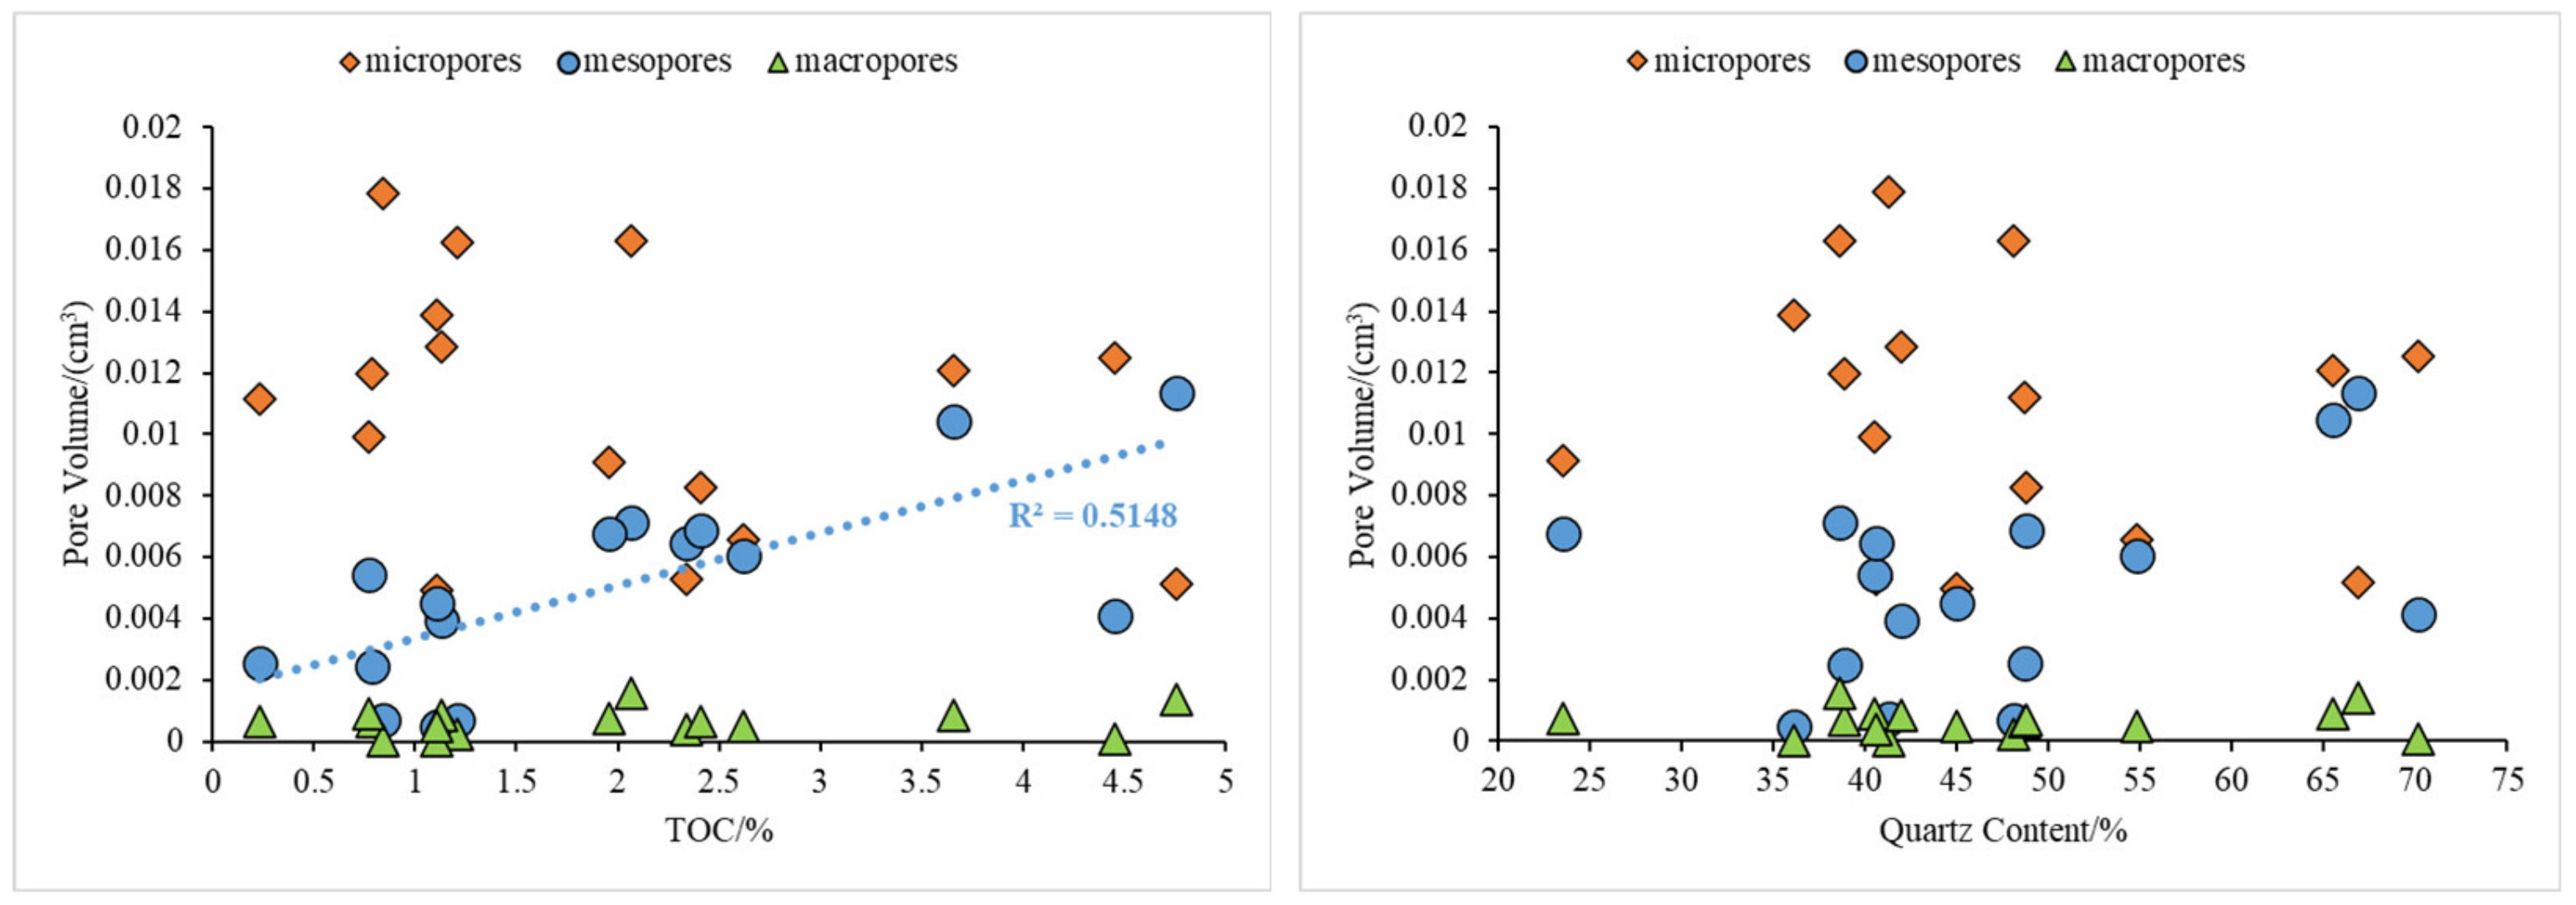
The pore size distribution in the Wufeng–Longmaxi shale samples in the Z-3 well was mainly in the range of 1–100 nm and 100 nm–1 µm, concentrated between 1nm and 100 nm. Mesopores and micropores provided a large proportion of the pore volume, and micropores comprised the major microstorage space.
(3)
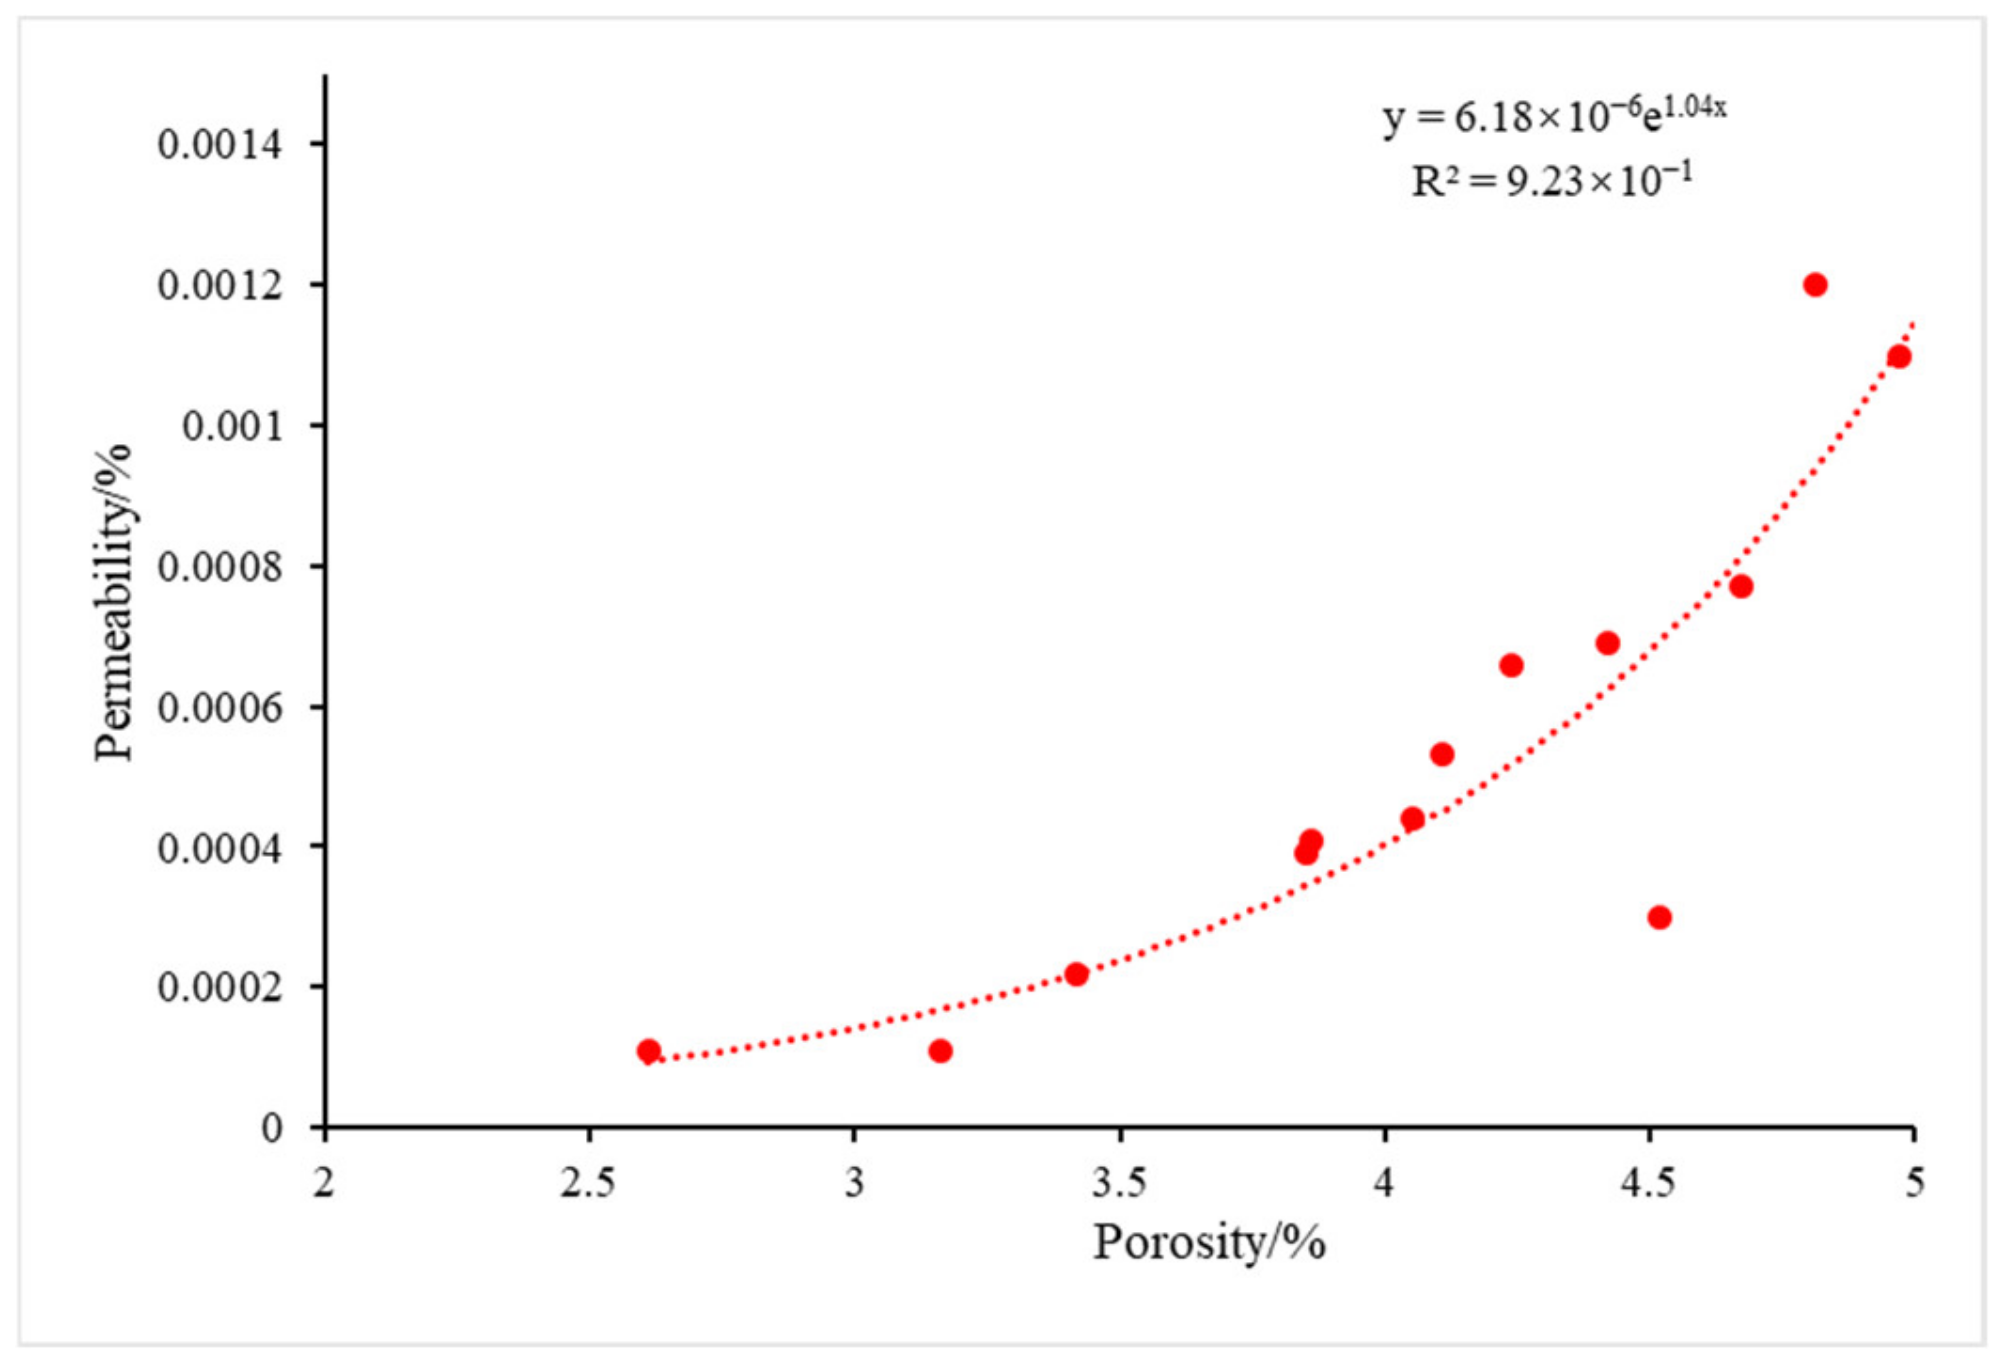
The exponential correlation between shale permeability and porosity was strong. D1 and D2 had no apparent correlation with permeability and porosity, while fractal dimensions had moderately positive correlations with TOC content in the lower S1l1-1 sub-layer and its upper layers.
(4)
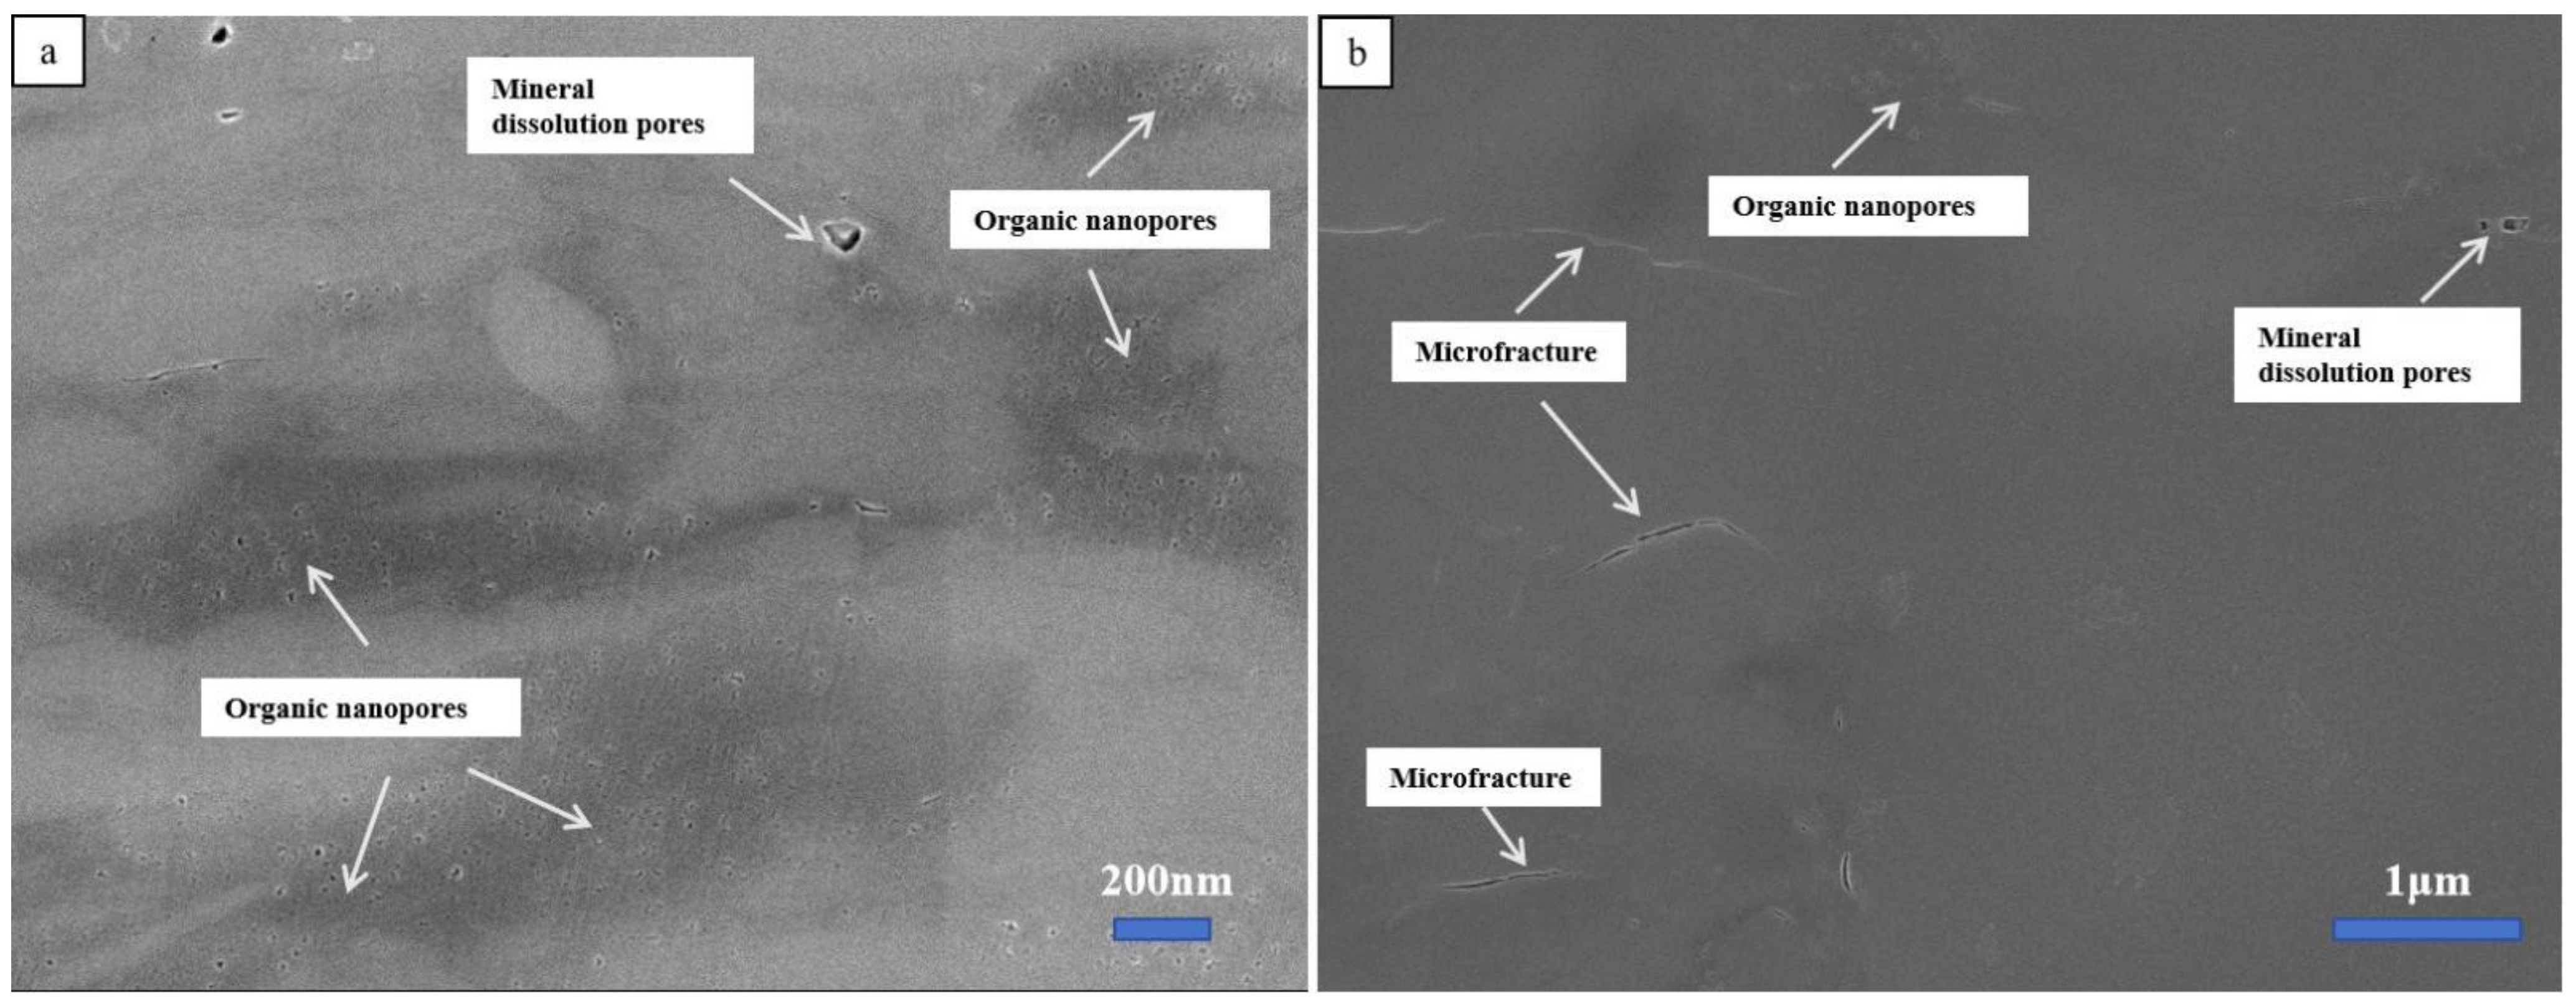
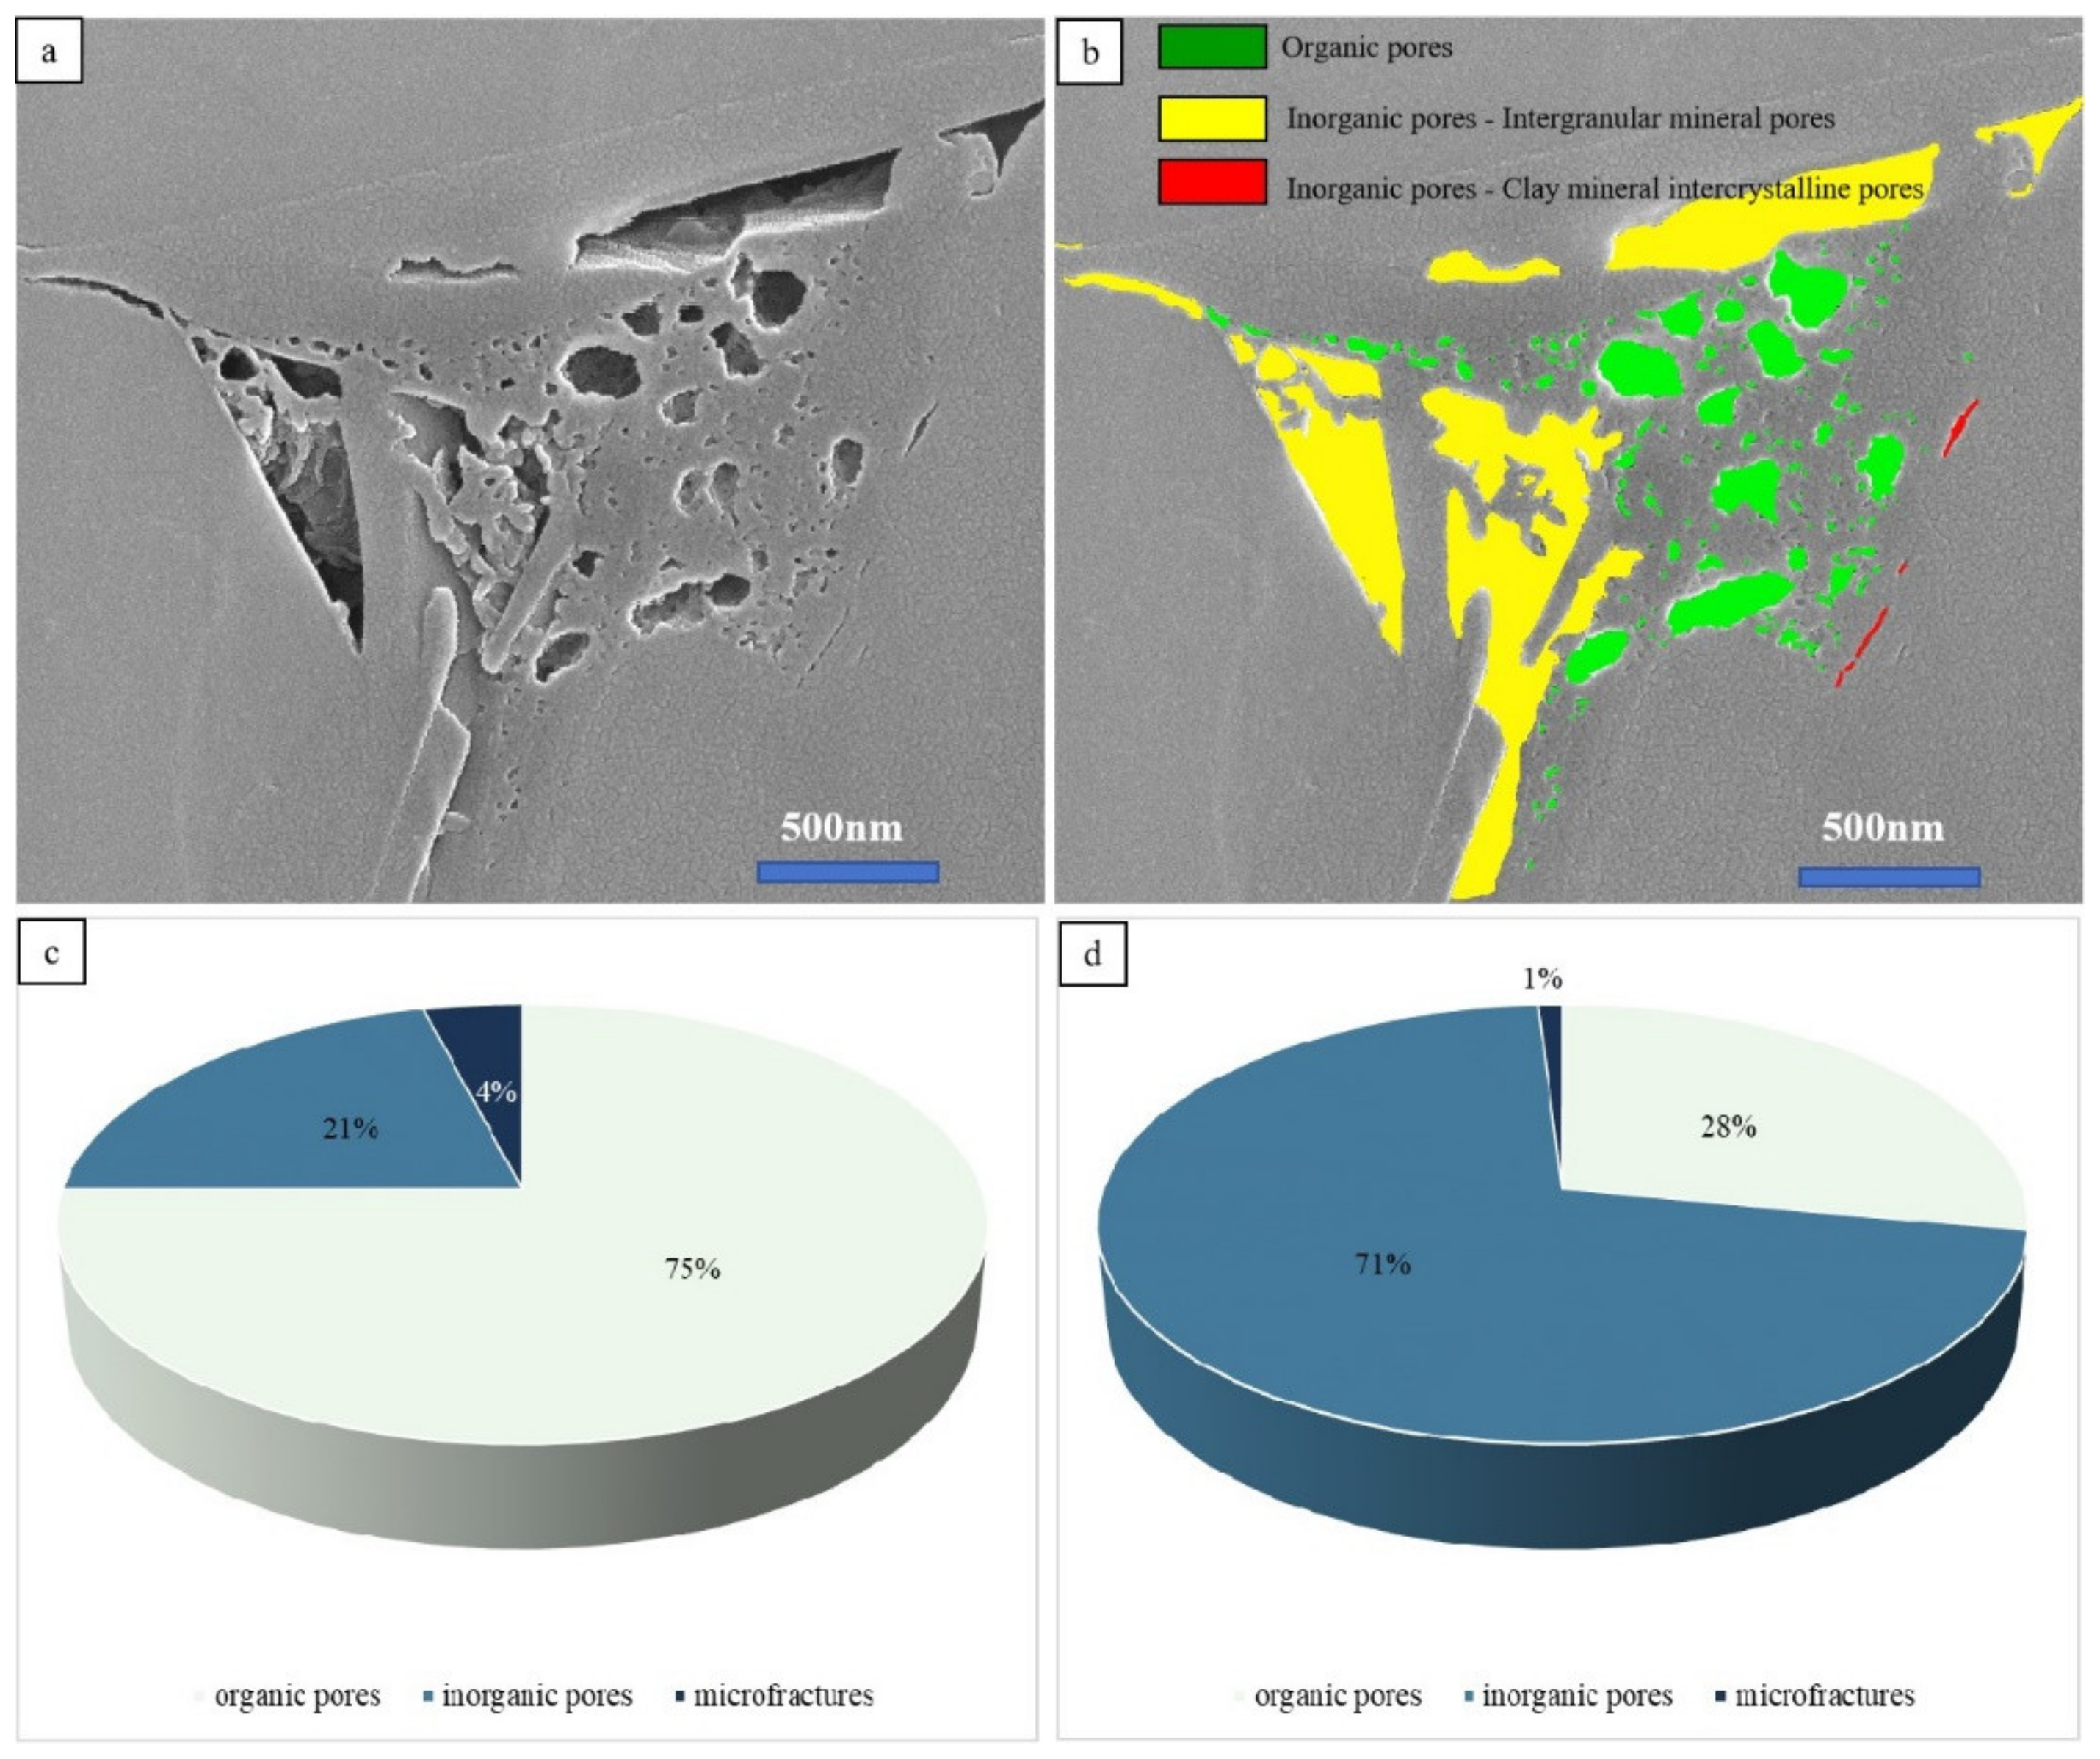
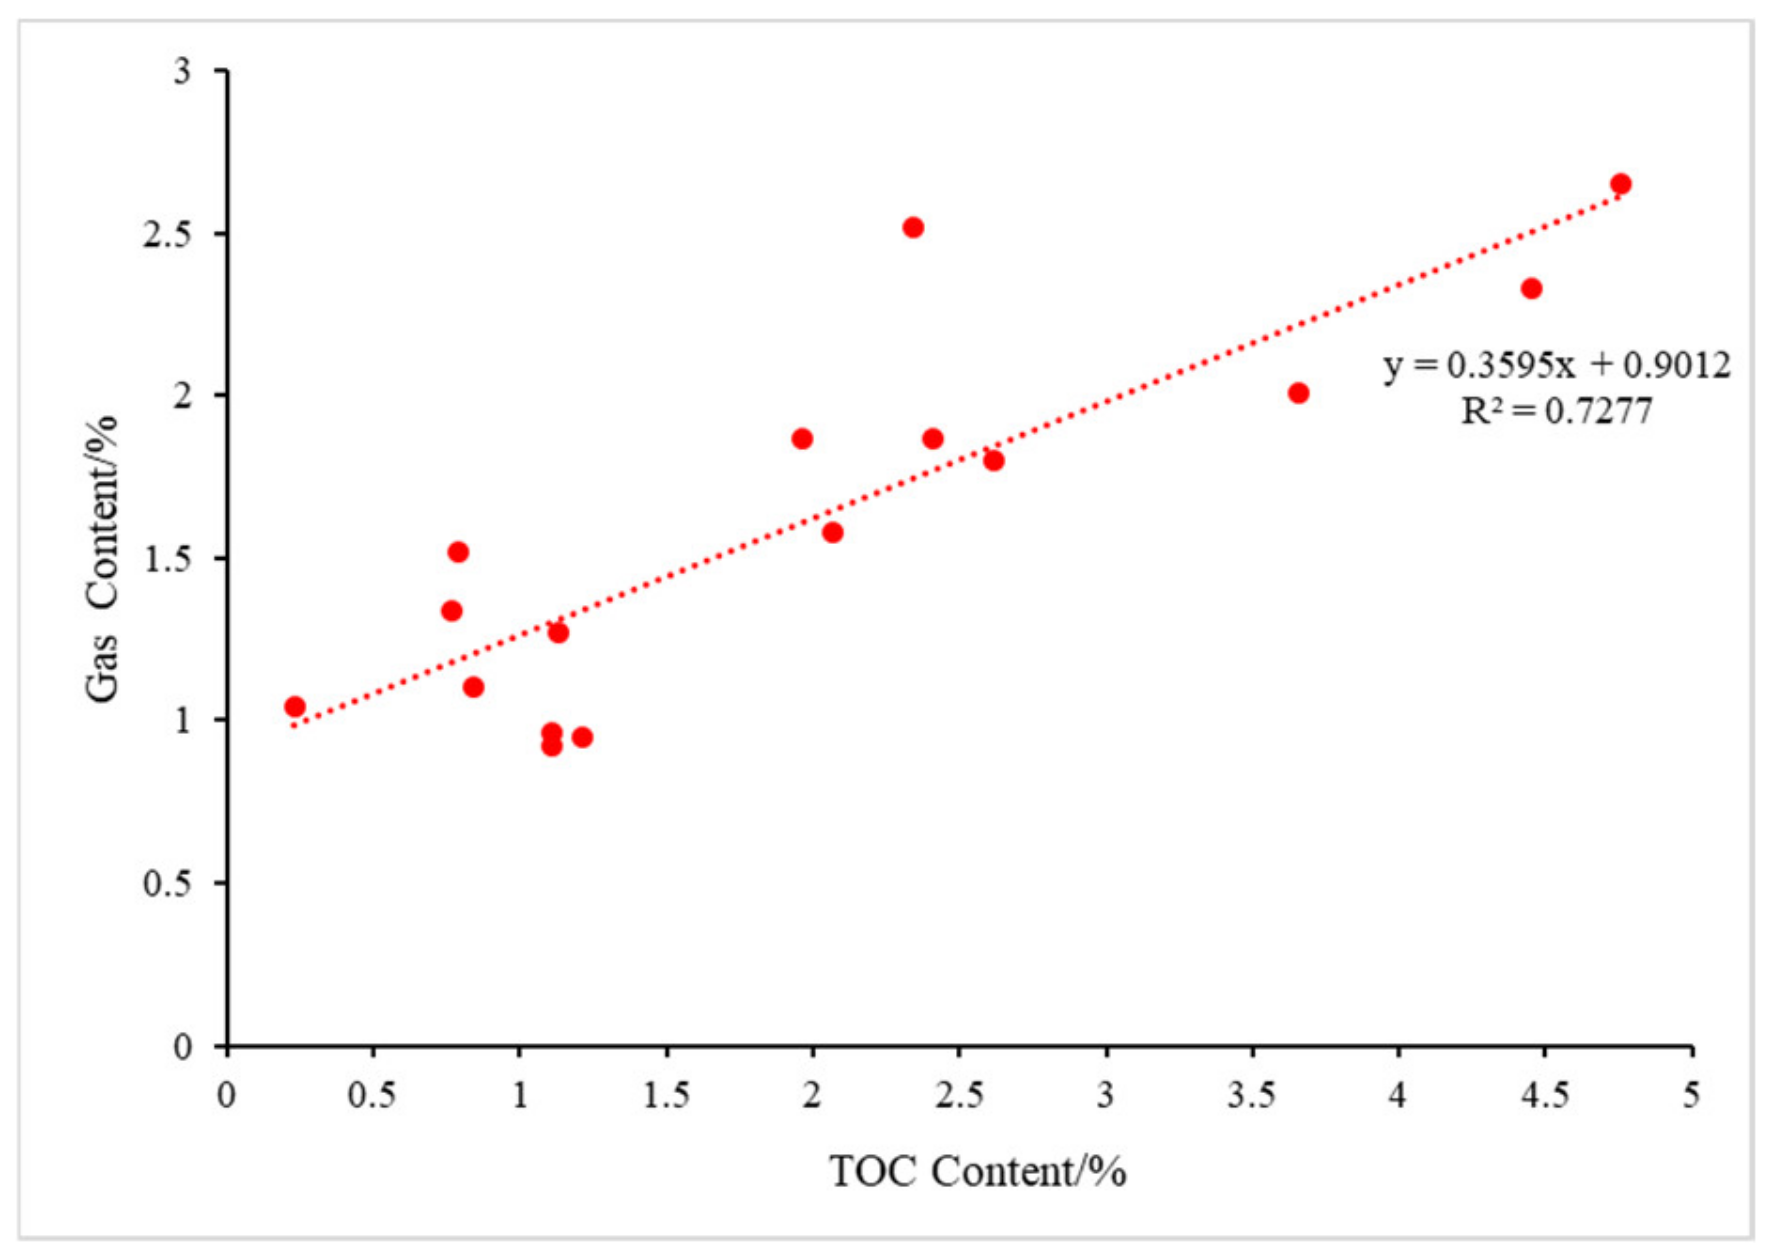
TOC content was one of the major factors influencing the gas content in the Wufeng–Longmaxi Formation shale in the Z-3 well. Specifically, an increase in TOC content resulted in greater porosity, leading to a more abundant organic matter pore network and enhanced homogeneity of the pore structure in the bottom S1l1-1 sub-layer, which showed significant potential for the exploration of shale gas.

Author Contributions

Conceptualization, D.Z., X.Z. and G.W.; Methodology, D.Z., Q.W., X.Z. and G.W.; Software, D.L., Y.W., Q.W. and X.Z.; Validation, D.L.; Formal analysis, D.Z. and D.L.; Investigation, D.Z., D.L., Y.W. and S.W.; Resources, D.Z., S.W., W.J. and Y.G.; Data curation, Y.W. and W.J.; Writing—original draft, D.L.; Writing—review & editing, D.Z., Y.G. and G.W.; Visualization, D.L. and Y.G.; Supervision, D.Z. and G.W.; Project administration, D.Z.; Funding acquisition, D.Z. All authors have read and agreed to the published version of the manuscript.

Funding

This work was founded by the Natural Science Foundation of Jiangsu Province (No. BK20210521), Provincial College Student Innovation Training Project of Jiangsu Province (No. 202310290234Y/202310290500H/202310290501H), the Natural Science Foundation of China (No. 41772130/52374105/52204113), the Fundamental Research Funds for the Central Universities (No. 2021QN1061), the Natural Science Foundation of Chongqing City (No. cstc2021jcyj-msxmX0624), the “Energy and Environment Youth Talent Training Program” by the China Energy Society, China Environmental Protection Foundation, and Beijing Energy Society (No. RCJH2022081), and the Science and Technology Research Project of the Chongqing Education Commission (No. KJZD-K202103201).

Institutional Review Board Statement

Not applicable.

Informed Consent Statement

Not applicable.

Data Availability Statement

The dataset is available on request from the authors.

Acknowledgments

Thanks to the reviewers for their suggestions. Thanks to Zhu Yanming from China University of Mining & Technology for his suggestions on the research process.

Conflicts of Interest

The authors declare no conflict of interest.

References

  1. Zou, C.N.; Yang, Z.; Pan, S.Q.; Chen, Y.; Lin, S.J.; Huang, S.W.; Dong, D.; Wang, S.; Liang, F. Shale Gas Formation and Occurrence in China: An Overview of the Current Status and Future Potential. Acta Geol. Sin. (Engl. Ed.) 2016, 90, 1249–1283. [Google Scholar]
  2. Zhang, J.; Li, Z.; Wang, D.; Xu, L.; Li, Z.; Niu, J.; Chen, L.; Sun, Y.; Li, Q.; Yang, Z.; et al. Shale gas accumulation patterns in China. Nat. Gas Ind. B 2023, 10, 14–31. [Google Scholar] [CrossRef]
  3. Li, H.; Zhou, J.; Mou, X.; Guo, H.; Wang, X.; An, H.; He, S. Pore structure and fractal characteristics of the marine shale of the longmaxi formation in the changning area, Southern Sichuan Basin, China. Front. Earth Sci. 2022, 10, 1018274. [Google Scholar] [CrossRef]
  4. Shi, S.; He, J.; Zhang, X.; Wu, H.; Yu, Z.; Wang, J.; Yang, T.; Wang, W. Fractal analysis of pore structures in transitional shale gas reservoirs in the Linxing area, Ordos Basin. Front. Earth Sci. 2022, 10, 979039. [Google Scholar] [CrossRef]
  5. Nie, H.; Li, P.; Wei, D.; Ding, J.; Sun, C.; Liu, M.; Wang, J.; Du, W.; Zhang, P.; Li, D.; et al. Enrichment characteristics and exploration directions of deep shale gas of Ordovician–Silurian in the Sichuan Basin and its surrounding areas, China. Pet. Explor. Dev. 2022, 49, 744–757. [Google Scholar] [CrossRef]
  6. Ma, X.; Wang, H.; Zhou, S.; Shi, Z.; Zhang, L. Deep shale gas in China: Geological characteristics and development strategies. Energy Rep. 2021, 7, 1903–1914. [Google Scholar] [CrossRef]
  7. Nie, H.; Jin, Z.; Li, P.; Katz, B.J.; Dang, W.; Liu, Q.; Ding, J.; Jiang, S.; Li, D. Deep shale gas in the Ordovician-Silurian Wufeng–Longmaxi formations of the Sichuan Basin, SW China: Insights from reservoir characteristics, preservation conditions and development strategies. J. Asian Earth Sci. 2023, 244, 105521. [Google Scholar] [CrossRef]
  8. Zhang, Q.; Hou, B.; Pang, H.; Liu, S.; Zeng, Y. A Comparison of Shale Gas Fracturing Based on Deep and Shallow Shale Reservoirs in the United States and China. Comput. Model. Eng. Sci. 2022, 133, 471–507. [Google Scholar] [CrossRef]
  9. Dong, L.; Bian, C.; Guo, B.; Zeng, X.; Liang, S. Pore structure and reservoir physical properties for effective development of tight sandstone gas: A case study from the Central Sichuan Basin, China. Geol. J. 2022, 57, 2497–2510. [Google Scholar] [CrossRef]
  10. Zhu, B.; Meng, J.; Song, C.; Pan, R.; Zhu, Z.; Jin, J. Complexity and Heterogeneity Evaluation of Pore Structures in the Deep Marine Shale Reservoirs of the Longmaxi Formation, China. J. Mar. Sci. Eng. 2023, 11, 1613. [Google Scholar] [CrossRef]
  11. Li, C.; Shen, B.; Lu, L.; Pan, A.; Li, Z.; Zhu, Q.; Sun, Z. Quantitative Characterization of Shale Pores and Microfractures Based on NMR T2 Analysis: A Case Study of the Lower Silurian Longmaxi Formation in Southeast Sichuan Basin, China. Processes 2023, 11, 2823. [Google Scholar] [CrossRef]
  12. Aksnes, D.W.; Forland, K.; Kimtys, L. Pore size distribution in mesoporous materials as studied by 1H NMR. Phys. Chem. Chem. Phys. 2001, 3, 3203–3207. [Google Scholar] [CrossRef]
  13. Yang, R.; Liu, W.; Meng, L. Multifractal Analysis of the Structure of Organic and Inorganic Shale Pores Using Nuclear Magnetic Resonance (NMR) Measurement. J. Mar. Sci. Eng. 2023, 11, 752. [Google Scholar] [CrossRef]
  14. Li, C.; Tan, M.; Wang, Z.; Li, Y.; Xiao, L. Nuclear magnetic resonance pore radius transformation method and fluid mobility characterization of shale oil reservoirs. Geoenergy Sci. Eng. 2023, 221, 211403. [Google Scholar] [CrossRef]
  15. Fu, H.; Wang, X.; Zhang, L.; Gao, R.; Li, Z.; Xu, T.; Zhu, X.; Xu, W.; Li, Q. Investigation of the factors that control the development of pore structure in lacustrine shale: A case study of block X in the Ordos Basin, China. J. Nat. Gas Sci. Eng. 2015, 26, 1422–1432. [Google Scholar] [CrossRef]
  16. Song, Y.; Ravinath, K. NMR application in unconventional shale reservoirs-A new porous media research frontier. Prog. Nucl. Magn. Reson. Spectrosc. 2019, 112–113, 17–33. [Google Scholar] [CrossRef] [PubMed]
  17. Broseta, D.; Barré, L.; Vizika, O.; Shahidzadeh, N.; Guilbaud, J.P.; Lyonnard, S. Capillary condensation in a fractal porous medium. Phys. Rev. Lett. 2001, 86, 5313–5316. [Google Scholar] [CrossRef] [PubMed]
  18. Abhra, G.; Tarafdar, P.; Tapati, D. Fractal pore structure of sedimentary rocks: Simulation in 2-d using a relaxed bidisperse ballistic deposition model. J. Appl. Geophys. 2012, 87, 40–45. [Google Scholar]
  19. Avnir, D.; Farin, D.; Pfeifer, P. Molecular fractal surfaces. Nature 1984, 308, 261–263. [Google Scholar] [CrossRef]
  20. Fan, X.; Wang, G.; Li, Y.; Dai, Q.; Song, L.; Duan, C.; Zhang, C.; Zhang, F. Pore structure evaluation of tight reservoirs in the mixed siliciclastic-carbonate sediments using fractal analysis of NMR experiments and logs. Mar. Pet. Geol. 2019, 109, 484–493. [Google Scholar] [CrossRef]
  21. Wei, Y.; Zhao, D.; Jiao, W.; Zhang, H. Heterogeneity of mechanical brittleness in Wufeng–Longmaxi shale reservoirs in western Chongqing area-Using well Z-3 as an example. Unconv. Oil Gas 2021, 8, 67–76. [Google Scholar]
  22. Zhang, X.; Wang, R.; Shi, W.; Hu, Q.; Xu, X.; Shu, Z.; Yang, Y.; Feng, Q. Structure- and lithofacies-controlled natural fracture developments in shale: Implications for shale gas accumulation in the Wufeng–Longmaxi Formations, Fuling Field, Sichuan Basin, China. Geoenergy Sci. Eng. 2023, 223, 211572. [Google Scholar] [CrossRef]
  23. Zhao, D.; Guo, Y.; Zhu, Y. Analysis of micro-scale heterogeneity characteristics in marine shale gas reservoir: Pore heterogeneity and its quantitative characterization. J. China Univ. Min. Technol. 2018, 47, 296–307. [Google Scholar]
  24. Wu, Y.; Tahmasebi, P.; Lin, C.; Zahid, M.A.; Dong, C.; Golab, A.N.; Ren, L. A comprehensive study on geometric, topological and fractal characterizations of pore systems in low-permeability reservoirs based on SEM, MICP, NMR, and X-ray CT experiments. Mar. Pet. Geol. 2019, 103, 12–28. [Google Scholar] [CrossRef]
  25. Yang, M.; Huang, S.; Zhao, F.; Sun, H.; Chen, X. Experimental investigation of CO2 huff-n-puff in tight oil reservoirs: Effects of the fracture on the dynamic transport characteristics based on the nuclear magnetic resonance and fractal theory. Energy 2024, 294, 130781. [Google Scholar] [CrossRef]
  26. Zhang, J.; Li, X.; Wei, Q.; Sun, K.; Zhang, G.; Wang, F. Characterization of Full-Sized Pore Structure and Fractal Characteristics of Marine-Continental Transitional Longtan Formation Shale of Sichuan Basin, South China. Energy Fuels 2017, 31, 10490–10504. [Google Scholar] [CrossRef]
  27. Zhang, J.; Deng, H.; Deng, J.; Gao, R. Fractal Analysis of Pore Structure Development of Sandstone: A Nuclear Magnetic Resonance Investigation. IEEE Access 2019, 7, 47282–47293. [Google Scholar] [CrossRef]
  28. Zhao, P.; Wang, L.; Xu, C.; Fu, J.; Shi, Y.; Mao, Z.; Xiao, D. Nuclear magnetic resonance surface relaxivity and its advanced application in calculating pore size distributions. Mar. Pet. Geol. 2020, 111, 66–74. [Google Scholar] [CrossRef]
  29. Shao, W.; Ding, Y.; Xiao, F. On the method of determingT2 cutoff value with the T2 spectrum characteristics. Well LogGing Technol. 2009, 33, 430–435. (In Chinese) [Google Scholar]
  30. Zang, Q.; Liu, C.; Rizwan, S.; Yang, X.; Li, G.; Wu, Y.; Lu, Z.; Feng, D. Occurrence characteristics of the movable fluid in heterogeneous sandstone reservoir based on fractal analysis of NMR data: A case study of the Chang 7 Member of Ansai Block, Ordos Basin, China. J. Pet. Sci. Eng. 2022, 214, 110499. [Google Scholar] [CrossRef]
  31. Zhang, C.; Guan, P.; Zhang, J.; Ding, X. Methodological Study on the Full-Range Pore Structure and Fractal Characteristics of the Tight Reservoirs. Minerals 2023, 13, 587. [Google Scholar] [CrossRef]
  32. Liu, Y.; Zhang, L.; Zhang, X.; He, X.; Li, J.; Xing, Y.; Jin, F.; Wang, Y. Pore Structure and Fractal Characteristics of Continental Low Maturity Organic-Rich Shale in the Sha-4 Member of the Liaohe Western Depression. Energies 2023, 16, 327. [Google Scholar] [CrossRef]
  33. Dong, J.; Huang, Z.; Chen, J.; Li, T.; Zhao, J.; Pan, Y.; Qu, T. Pore Structure and Fractal Characteristics of Tight Sandstone: A Case Study for Huagang Formation in the Xihu Sag, East China Sea Basin, China. Energies 2023, 16, 2013. [Google Scholar] [CrossRef]
  34. Xi, Z.; Tang, S.; Wang, J.; Yi, J.; Guo, Y.; Wang, K. Pore Structure and Fractal Characteristics of Niutitang Shale from China. Minerals 2018, 8, 163. [Google Scholar] [CrossRef]
  35. Fu, Q.; Hu, Z.; Qin, T.; Feng, D.; Yang, B.; Zhu, Z.; Xing, L. Diagenesis and Pore Formation Evolution of Continental Shale in the Da’anzhai Lower Jurassic Section in the Sichuan Basin. Minerals 2023, 13, 535. [Google Scholar] [CrossRef]
  36. Wang, Z.; Zhu, Y.; Jiang, Z.; Gong, H.; Yang, Y.; Wang, B.; Wang, X. A Study on the Pore Structure and NMR Fractal Characteristics of Continental Shale in the Funing Formation of the Gaoyou Sag, Subei Basin. Appl. Sci. 2023, 13, 12484. [Google Scholar] [CrossRef]
  37. Wang, F.; Yang, K.; Cai, J. Fractal Characterization of Tight Oil Reservoir Pore Structure Using Nuclear Magnetic Resonance and Mercury Intrusion Porosimetry. Fractals 2018, 26, 1840017. [Google Scholar] [CrossRef]
  38. Wu, W.; Li, Q.; Pei, J.; Ning, S.; Tong, L.; Liu, W.; Feng, Z. Seismic sedimentology, facies analyses, and high-quality reservoir predictions in fan deltas: A case study of the Triassic Baikouquan Formation on the western slope of the Mahu Sag in China’s Junggar Basin. Mar. Pet. Geol. 2020, 120, 104546. [Google Scholar] [CrossRef]
  39. Zhu, B.; Meng, J.; Pan, R.; Hu, H.; Song, C.; Zhu, Z.; Jin, J. New insights into the evaluation criteria for high-quality deep marine shale gas reservoirs in the Longmaxi formation: Evidence from organic matter pore development characteristics. Front. Ecol. Evol. 2023, 11, 1138991. [Google Scholar] [CrossRef]
Figure 1. Research area and lithological columnar diagram of Q3w-S1l1-1 in the Z-3 well. (a) The location of the Chongqing Area and the Z-3 well. (b) Lithological column of the Wheng-Longmation Formation in the Sichuan Basin, China.
Applsci 14 04733 g001
Figure 2. T2 spectrum of representative samples of Wufeng–Longmaxi Formation in the Z-3 well. (a) Sample Q0 from layer 1; (b) Samples Q1–Q2 from layer 2; (c) Samples Q3–Q5 from layer 3; (d) Samples Q6–Q7 from layer 4; (e) Samples Q10–Q12 from layer 5; (f) Samples Q13–Q15 from layer 6.
Applsci 14 04733 g002
Figure 3. Comparison of NMR pore size distributions of tested shale samples.
Applsci 14 04733 g003
Figure 4. The proportion of bound fluid saturation and movable fluid saturation in shale samples.
Applsci 14 04733 g004
Figure 5. NMR fractal linear fitting curves of the shale samples in the Z-3 well. Figures (ap) are fractal curves for samples Q0–Q15.
Applsci 14 04733 g005
Figure 6. Pore aperture segmentation fitting results for 16 shale samples. Figures (ap) are fitting results for samples Q0–Q15.
Applsci 14 04733 g006
Figure 7. Relationship between D1 and D2 of the middle and upper Longmaxi Formation (layers 3, 4, 5, and 6) shale in the Z-3 well.
Applsci 14 04733 g007
Figure 8. Relationship between volume and depth for micro-, meso- and macropores.
Applsci 14 04733 g008
Figure 9. Correlation between the pore volume of different scale pores and TOC and quartz contents in shale samples from the Z-3 well.
Applsci 14 04733 g009
Figure 10. The relationship between porosity and permeability of shale samples in the Z-3 well (excluding the Q1 sample).
Applsci 14 04733 g010
Figure 11. The fractal dimension, porosity, and permeability of shale samples in the Z-3 well.
Applsci 14 04733 g011
Figure 12. The relationship between fractal dimension and mineral composition, TOC of shale samples in layers 3,4,5, and 6 in the Z-3 well.
Applsci 14 04733 g012
Figure 13. FE-SEM images of nanopores in the bottom S1l1-1 sub-layer of shale reservoirs. (a) Image of mineral dissolution pores, organic nanopores in the Wufeng-Longmaxi Formation in the Z-3 well. (b) Image of organic nanopores, microfractures, mineral dissolution pores in the Wufeng-Longmaxi Formation in the Z-3 well.
Applsci 14 04733 g013
Figure 14. Classification of different pore types using SEM. (a) Image of original shale sample. (b) Image of different types of pores. (c) Proportion of organic matter pores, inorganic pores, and microcracks in Sample Q1 based on SEM. (d) Proportion of organic matter pores, inorganic pores, and microcracks in Sample Q6.
Applsci 14 04733 g014
Figure 15. The relationship between gas content and TOC, quartz content of shale samples in the Z-3 well.
Applsci 14 04733 g015
Table 1. Stratification and lithology of representative samples from the Z-3 well.
SampleDepth/mStratumLithologyGas Content (m3/t)TOC (%)Quartz (%)
Q04110.7Wufeng Fr. (Layer 1)black carbonaceous shale0.961.1145.0
Q14105.0Longmaxi Fr. Bottom S1l1-1 sub-layer (Layer 2)black carbonaceous shale2.334.4570.1
Q24101.22.654.7666.9
Q34096.1Lower S1l1-1 sub-layer (Layer 3)black argillaceous shale1.802.6254.8
Q44091.41.872.4148.8
Q54086.42.013.6665.5
Q64081.2Middle S1l1-1 sub-layer (Layer 4)black silty shale1.871.9623.5
Q74076.12.522.3440.6
Q84071.31.582.0738.6
Q94066.21.271.1342.0
Q104061.7Upper S1l1-1 sub-layer (Layer 5)black silty shale1.340.7740.5
Q114056.7muddy siltstone1.040.2348.7
Q124051.9black silty shale1.100.8441.3
Q134046.2S1l1-2 sub-layer (Layer 6)silty mudstone, muddy siltstone0.921.1136.1
Q144042.21.520.7938.9
Q154036.50.951.2148.1
Table 2. Porosity and permeability characteristics of representative samples from each layer of the Wufeng–Longmaxi Formation in the Z-3 well.
SampleDepth (m)LayerNMR Porosity (%)Permeability (mD)T2C (ms)
Q04110.712.610.0001160.4400
Q14105.024.170.23535.7905
Q24101.24.520.0003016.3092
Q34096.133.420.0002260.4400
Q44091.44.110.0005368.8991
Q54086.45.950.004168.8991
Q64081.744.420.0006960.4400
Q74076.13.160.000115.7190
Q84071.36.520.00462.9708
Q94066.24.670.000772.6061
Q104061.754.240.000662.9708
Q114056.73.860.000412.2861
Q124051.94.970.00112.9708
Q134046.263.850.000392.6061
Q144042.24.050.000442.6061
Q154036.54.810.00122.2861
Table 3. NMR fractal fitting equations for tested samples.
SampleT2 < T2CT2 > T2C
Regression EquationD1R2Regression EquationD2R2
Q0y = 0.6298x − 0.58152.37050.6794y = 0.0006x − 0.0022.99940.6136
Q1y = 1.1415x − 1.01721.85850.7931y = 0.0009x − 0.00312.99910.6975
Q2y = 1.3105x − 0.69051.68950.7567y = 0.0042x − 0.01372.99580.7247
Q3y = 0.6486x − 0.59362.35140.676y = 0.0006x − 0.0022.99940.6431
Q4y = 0.6272x − 0.59432.37280.6618y = 0.0005x − 0.00152.99950.5868
Q5y = 0.6143x − 0.58382.38570.6641y = 0.0004x − 0.00132.99960.6029
Q6y = 0.6179x − 0.58222.38210.6548y = 0.0007x − 0.00252.99930.687
Q7y = 0.6814x − 0.70242.31860.6735y = 0.0005x − 0.00192.99950.7308
Q8y = 1.1068x − 0.10671.89320.8014y = 0.0086x − 0.02732.99140.7947
Q9y = 1.1612x + 0.00041.83880.8053y = 0.0065x − 0.02032.99350.7439
Q10y = 1.2005x − 0.08711.79950.8273y = 0.0077x − 0.02412.99230.7746
Q11y = 1.151x + 0.05731.8490.7993y = 0.0059x − 0.01822.99410.6959
Q12y = 1.2187x + 0.10241.78130.8133y = 0.0055x − 0.01692.99450.7113
Q13y = 1.1621x + 0.05841.83790.8037y = 0.0047x − 0.01442.99530.7132
Q14y = 1.1208x + 0.06151.87920.79y = 0.0057x − 0.01732.99430.6792
Q15y = 1.1815x + 0.04061.81850.8107y = 0.0075x − 0.02342.99250.8
Table 4. Pore volumes of different types of Wufeng–Longmaxi Formation shale samples in the Z-3 well.
SamplePore Volume (10−3 cm3)Total Pore Volume (10−3 cm3)
MicroporesMesoporesMacropores
Q04.9494.5020.5099.96
Q112.5204.1230.07016.713
Q25.14611.3701.39817.914
Q36.5726.0640.48313.119
Q48.2516.8670.67415.792
Q512.08410.4540.87523.413
Q69.1216.7910.74916.661
Q75.2876.4760.40412.167
Q816.2917.1451.57025.006
Q912.8653.9450.85717.667
Q109.9025.4270.90316.232
Q1111.1762.5690.65114.396
Q1217.8680.7310.039918.6389
Q1313.8820.4810.04214.405
Q1411.9932.4770.67915.149
Q1516.2710.6940.22517.19
Disclaimer/Publisher’s Note: The statements, opinions and data contained in all publications are solely those of the individual author(s) and contributor(s) and not of MDPI and/or the editor(s). MDPI and/or the editor(s) disclaim responsibility for any injury to people or property resulting from any ideas, methods, instructions or products referred to in the content.

