Abstract
Speech forgery and tampering, increasingly facilitated by advanced audio editing software, pose significant threats to the integrity and privacy of digital speech avatars. Speech resampling is a post-processing operation of various speech-tampering means, and the forensic detection of speech resampling is of great significance. For speech resampling detection, most of the previous works used traditional methods of feature extraction and classification to distinguish original speech from forged speech. In view of the powerful ability of deep learning to extract features, this paper converts the speech signal into a spectrogram with time-frequency characteristics, and uses the feature pyramid network (FPN) with the Squeeze and Excitation (SE) attention mechanism to learn speech resampling features. The proposed method combines the low-level location information and the high-level semantic information, which dramatically improves the detection performance of speech resampling. Experiments were carried out on a resampling corpus made on the basis of the TIMIT dataset. The results indicate that the proposed method significantly improved the detection accuracy of various resampled speech. For the tampered speech with a resampling factor of 0.9, the detection accuracy is increased by nearly 20%. In addition, the robustness test demonstrates that the proposed model has strong resistance to MP3 compression, and the overall performance is better than the existing methods.
1. Introduction
In the rapidly evolving field of digital speech, particularly in the context of digital avatars, the ease of audio editing and modification through software (such as Audacity 3.4.2 [1], developed by Audacity Team, sourced from Carnegie Mellon University, Pittsburgh, USA; Adobe Audition 23.5 [2], developed by Adobe Systems, sourced from San Jose, California, USA; and GoldWave 6.80 [3], developed by GoldWave Inc., sourced from St. John’s, Newfoundland and Labrador, Canada) raises critical concerns for security and privacy. The undetectable manipulation of digital speech avatars poses substantial threats to judicial processes, political fields, and social security. Contemporary speech forensics techniques are pivotal in ensuring the integrity of digital avatars and focus on detecting tampering facilitated by audio editing software, such as deletion, insertion, copy and move, splicing, resampling and recompression of audio clips [4,5,6,7]. It is worth noting that in the field of speech content forensics, there are more forensic methods for speech deletion, copy and move, splicing, and other tampering approaches [8,9,10], while there are relatively few methods for speech resampling forensics, and these tampering means are often accompanied by resampling operations. Thus, the study of speech resampling detection has significance in complex forensics environments, which will provide comprehensive tools and methods for forensics to ensure the authenticity and integrity of audio.
Speech resampling refers to converting the original sampling frequency of speech into a new sampling frequency. The bulk of the existing detection methods for speech resampling are inspired by detection algorithms of digital image resampling [11,12]. According to the fact that the resampling process will introduce periodic information into the original speech, Yao et al. [13] proposed an audio resampling detection method based on expectation maximization (EM), which uses the spectral statistical moments of fixed sample points as input features. At the same time, the audio amplitude histogram is introduced to approximate the audio signal distribution more accurately. However, this algorithm can only detect resampled speech under linear interpolation. For this reason, Chen et al. [14] improved the algorithm of Yao et al. [13]. The EM algorithm was used to simultaneously estimate a set of periodic sample points with domain correlation and specific correlation coefficients, and obtain the normalized probability vector of all sample points to observe whether it exhibits periodicity. The method is able to detect resampled speech using different interpolation methods. The algorithms in [13,14] require highly accurate selection of initial parameters to reduce the impact of noise. Factors such as noise and signal distortion can lead to lower detection accuracy in speech down-sampling. Shi et al. [15] detected resampling by analyzing the interpolation characteristics of resampled speech and studying the singular values of the signal formed by the sampling points. Specifically, after the singular value decomposition of the speech signal, a set of singular values and the corresponding left and right singular signals are obtained, and the variation in the speech signal is indicated by counting the average number of zero singular values. Hou et al. [16], referred to the image forensics method proposed by Farid et al. [17], that an image would show periodic domain correlation after resampling. They found that after resampling an audio signal through the second-order difference, the interval between its zero values is periodic, and this feature was applied to nonlinear interpolation. However, different thresholds are selected by this method for different resampling factors and interpolation kernels, so it has limitations in practical application. Wang et al. [18] calculated the logarithm ratio of band energy between original and resampled speech according to the characteristics that the bandwidth of the resampled speech is inconsistent with its sampling rate, so as to distinguish true and false speech. The algorithm can detect resampled speech in a variety of situations and has a certain degree of anti-compressibility, but it fails to show its effectiveness for resampled speech with a small tampering amplitude. Zhang et al. [19] proposed an algorithm that uses the local binary pattern (LBP) operator to model the statistical change characteristics of spectrograms and uses support vector machines (SVMs) for resampling detection, which has better detection performance and better robustness against MP3 compression, but the accuracy of detection for resampling factors, ranging from 0.8 to 1.2, still needs to be improved. Although the methods discussed above can achieve good accuracy, most require artificial feature engineering, which involves massive human professional knowledge and is usually a very time-consuming process. In recent years, deep learning has made significant progress in machine learning and has been widely applied in various fields such as digital image recognition, speech recognition, and steganography analysis [20,21,22,23,24]. Among them, Xu et al. [20] proposed a multiscale attention network for splicing tampering forensics in image recognition, which utilizes the integration of residual attention and multiscale information in order to improve the detection accuracy. Lang et al. [21] applied deep learning technology to the field of industrial defect detection, aiming to improve the accuracy of magnetic flux leakage (MFL) image recognition of pipeline corrosion defects, and achieved remarkable results. Taiba et al. [22] proposed a stride-based convolutional neural network (SCNN) model for speech emotion recognition. Banerjee et al. [23] applied deep learning in bio-signal steganography to provide robust, undetectable and trustworthy information security techniques. Huang et al. [24] built an attention-guided robust image watermarking model based on a generative adversarial network (GAN) to solve the problem of insufficient features and failure to highlight essential features in the existing deep learning watermarking models.
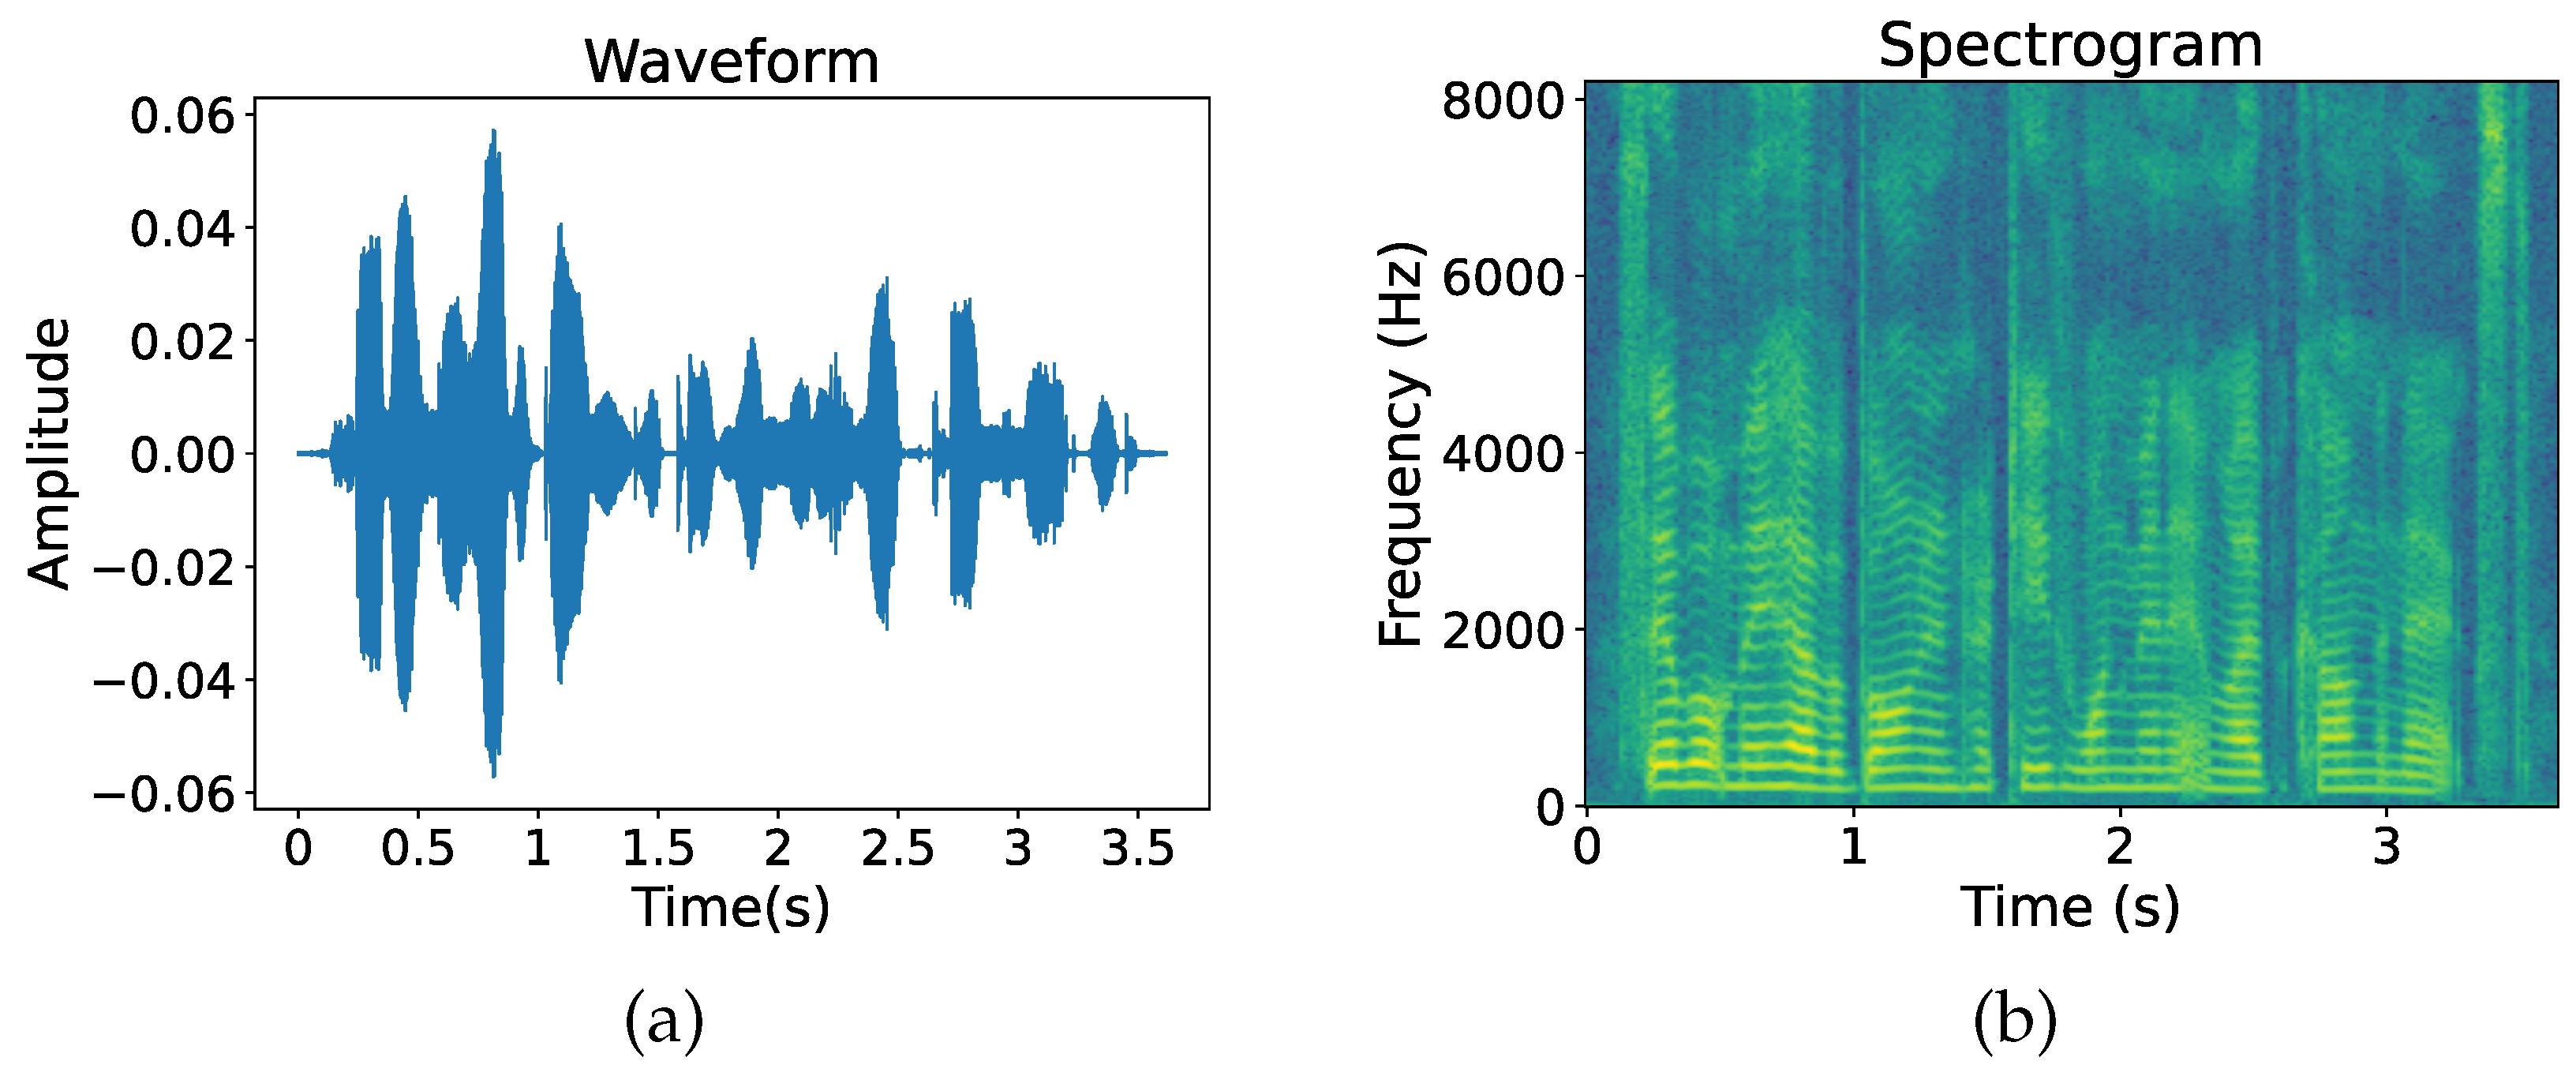
Traditional features have certain advantages in some aspects. But if the scene used is changed, the detection effect of manual features may be reduced [25,26,27]. In contrast, deep learning has great advantages at the level of extracting features, and it also has impressive classification capabilities. However, less work has been performed on applying deep learning to speech-tampering forensics. As can be seen in Refs. [28,29,30], some studies exist on speech copy–move detection, speech splicing detection, and speech deletion detection using deep learning. In these studies, the two-dimensional graph generated by speech signals is used as the input of a neural network and its graphical characteristics are utilized to achieve different speech tasks. The two-dimensional graph in Figure 1 is also known as the spectrogram, which is a simple but informative speech visualization map. In addition to being easier to interpret than the speech signal itself, it preserves time, frequency and amplitude information in a single plot. Therefore, using deep learning methods to extract time–frequency features of spectrograms for speech resampling detection will to some extent help us improve the detection accuracy of forged speech.
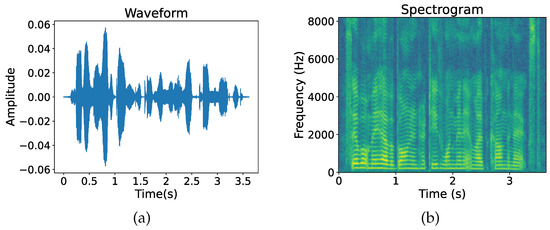
Figure 1.
Visualization of speech signals. (a) Speech signal waveforms; (b) spectrogram.
Based on the existing research, this paper conducts experiments using a resampling-tampered corpus with multiple factors produced by Zhang et al. [19] utilizing the TIMIT dataset. Combined with the deep learning method, this paper constructs a feature pyramid network (FPN) structure to extract the features of the spectrogram, carrying out feature fusion, and adds the Squeeze and Excitation (SE) attention mechanism [31] to obtain the feature map containing low-level location information and high-level semantic information for resampling-tamper detection. In summary, the contributions of this paper mainly include the following three points:
- We propose to use a deep learning method to extract resampling features from spectrograms containing time–frequency information, and apply various models of classical image classification for speech resampling detection;
- We apply the SE attention mechanism to the feature pyramid fusion network, which can focus on those channels that are more efficient for the resampling classification task and help the network to make resampling decisions;
- Thorough experimental evaluations show that the proposed method is suitable for speech detection tampered with multiple resampling factors, especially for tampering close to the original speech, and the detection performance is significantly improved. Moreover, the effect of MP3 compression on speech resampling detection is evaluated, and the results show that the proposed model is robust to MP3 compression.
The remaining sections of this paper are as follows: the second part focuses on speech preprocessing and introduces the structure of our proposed network model; the third part is about the experimental setup and analysis of the experimental results. Finally, in the fourth part, the paper is summarized and future work is prospected.
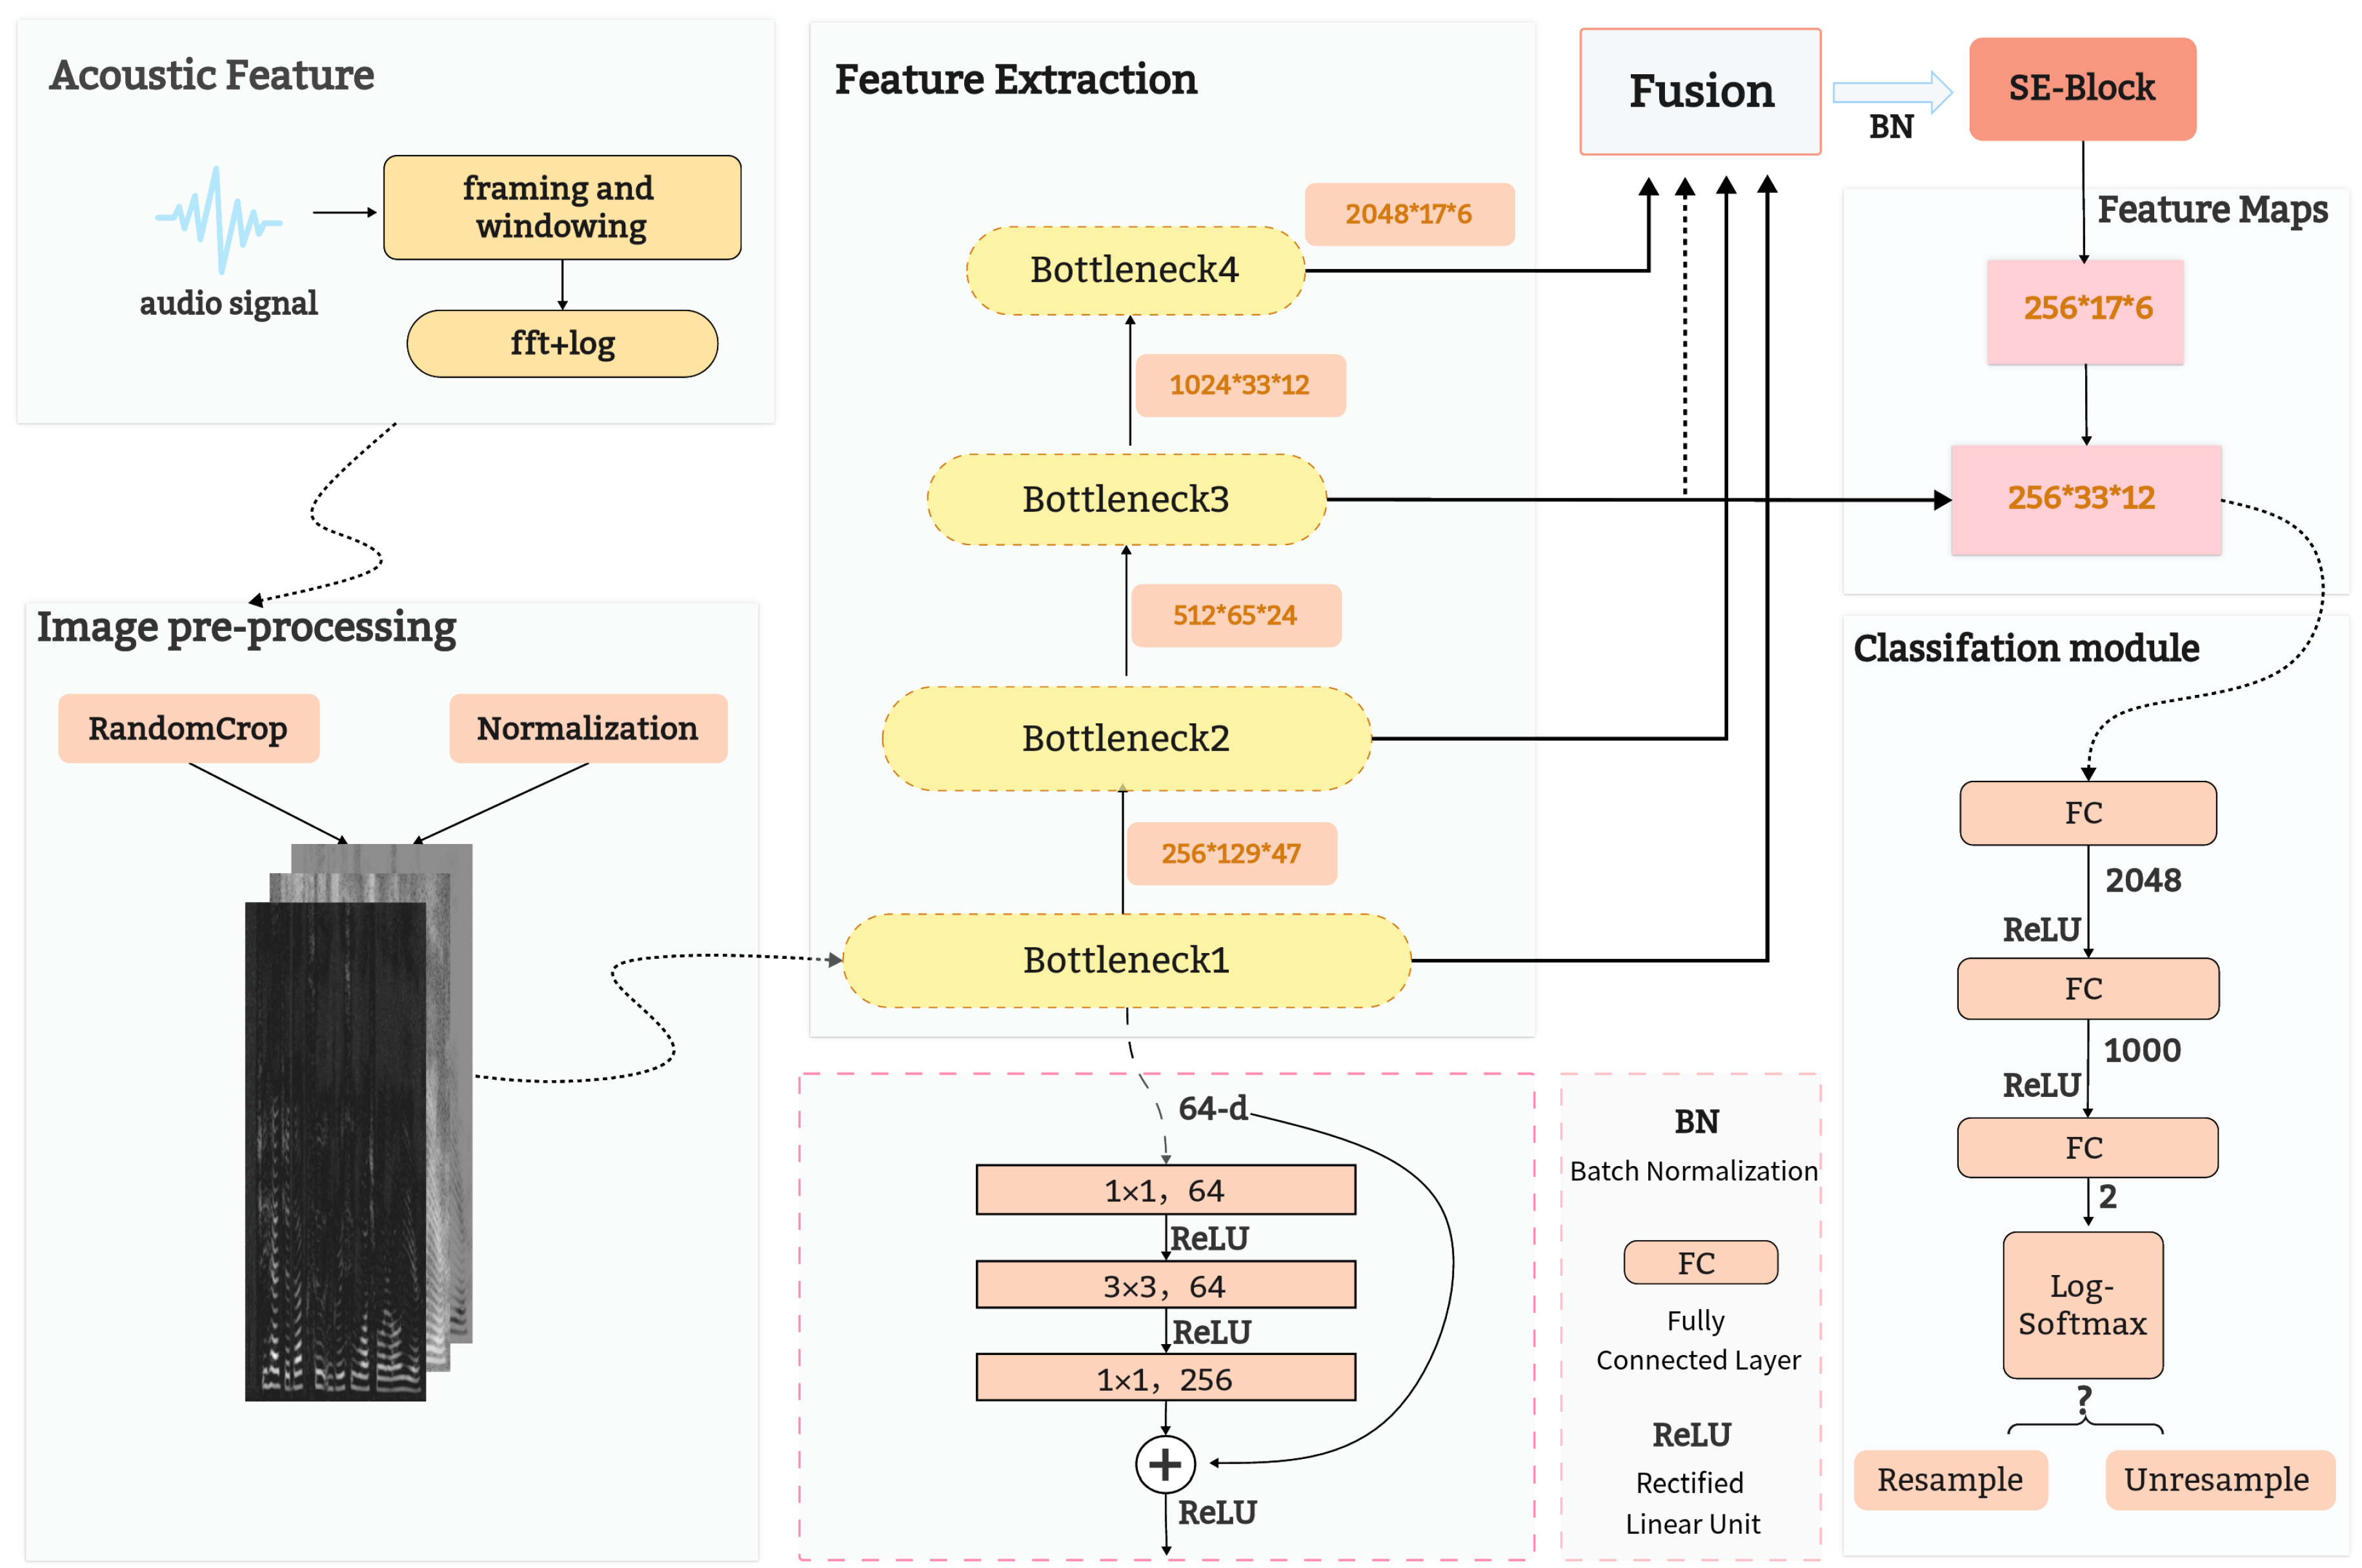
2. Proposed Method
The overall framework of the proposed approach is shown in Figure 2. It consists of three modules: speech signal extraction and preprocessing, feature extraction and fusion, and classification. The modules are described in detail in the following sections.
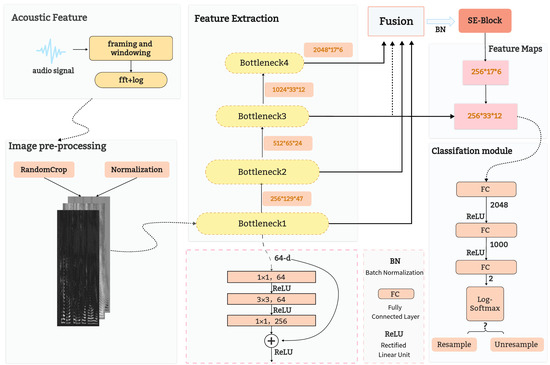
Figure 2.
Structure of the proposed scheme.
2.1. Speech Preprocessing
2.1.1. Audio Signal to Spectrogram
Since a one-dimensional speech signal cannot adequately represent the features of resampled speech, this paper converts it into a two-dimensional spectrogram to represent three-dimensional features [32,33]. The x-axis represents time, and the y-axis represents frequency. The color of the coordinate points in the spectrogram represents the level of volume. For a speech signal, its changes are rapid, and the Fourier transform is suitable for analyzing stable signals. It is necessary to slice the audio of variable length into fixed-length segments, namely, framing. In order to ensure a smooth transition between frames to maintain continuity, there will be overlap. Before the Fourier transform of each frame of speech, it needs to be multiplied by a smooth window function, so that both ends of the frame can be smoothly attenuated to zero. The purpose of this is to avoid spectrum leakage and generate a higher quality spectrum [34]. Subsequently, a fast Fourier transform (FFT) is performed on each frame of the speech signal, and its transformation form is as follows:
where is the signal of the t-th frame after the speech signal is divided into frames, is the selected Hamming window function, and N is the number of frames. The transformation of each obtained frame is spliced according to the frequency axis to generate a linear spectrum. Finally, in order to reduce the dynamic change of the amplitude component, the linear spectrum is converted into a logarithmic spectrum:
The final spectrogram is calculated by the above equation. In this paper, the frame length is 50 ms and the frame shift is 25 ms in the process of converting speech signals from the time domain to the frequency domain.
2.1.2. The Performance of Resampling on the Spectrogram
Resampling can be achieved by up-sampling, interpolation, and down-sampling, depending on the desired sampling multiple. For any multiple of sampling, a combination of up-sampling, interpolation, and down-sampling is required. Assuming an audio signal with a length of m sampling points, p is the interpolation factor, and q is the decimation factor. After resampling by the sampling factor , the number of samples of the signal can be increased or decreased. The process is as follows:
- Up-sampling: By inserting zeros between every two sample points of the signal, the sampling point of the signal becomes after the change, so that the signal is expanded by a factor of p in the time domain. When , ; otherwise, .
- Interpolation: The signal is convolved by a low-pass linear interpolation filter to obtain the interpolated signal . According to the use of different filters [35], the interpolated signal can be divided into linear interpolation, spline interpolation, and cubic interpolation.
- Down-sampling: One point is extracted every sample points, so that the signal is reduced by a factor of q in the time domain. The changed signal is . When ,, the resampled signal is .
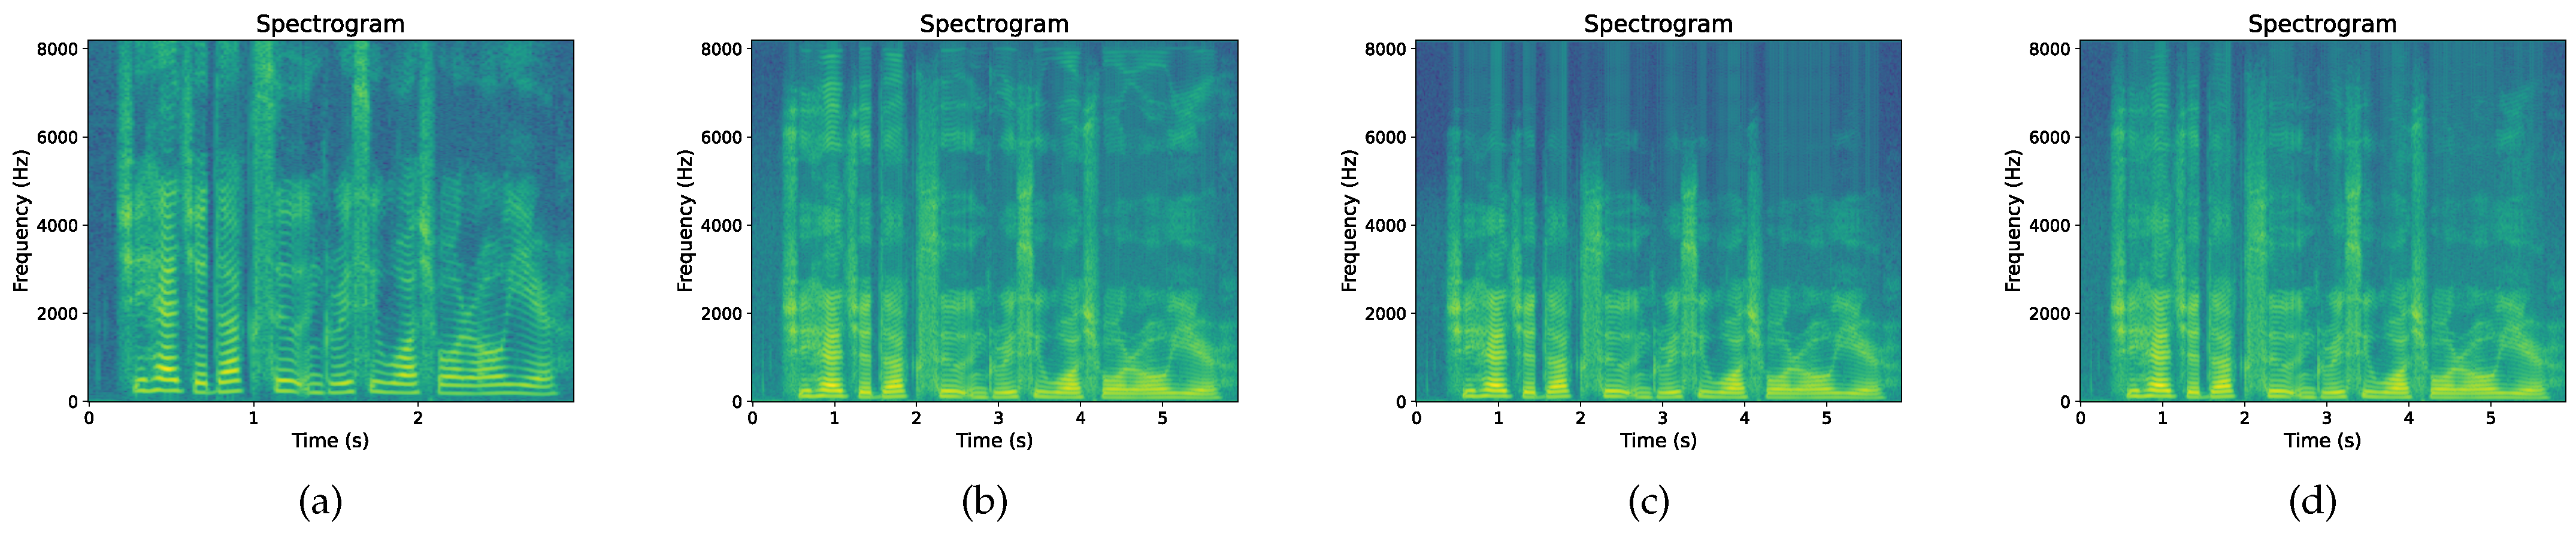
Figure 3 shows the spectrogram of the original speech signal that has undergone resampling by a factor of 2. Different resampling results are obtained based on different interpolation filters . It is observed that the length of the original signal is doubled in the time domain, the low-frequency region has high resolution and the bandwidth is narrowed, which is affected by a certain degree of noise and distortion. After applying the linear interpolation filter, there are jagged changes in the spectrogram, and these are prominent in the high-frequency region. Spline interpolation is an interpolation method based on local polynomial approximation, which is more accurate and complex than linear interpolation. From the analysis of the spectrogram, it alleviates the jagged changes in the high-frequency region to a certain extent. Cubic interpolation based on cubic polynomial approximation is a more accurate interpolation method than the previous two. It can be seen that after cubic interpolation, a smooth spectral curve is obtained, which can better analyze and process speech signals.
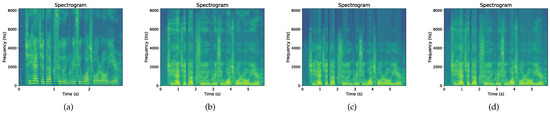
Figure 3.
Spectrogram: (a) Original, (b) linear interpolation, (c) spline interpolation, and (d) cubic interpolation.
2.2. Image Preprocessing
After the speech preprocessing operation, the speech spectrogram I is obtained, where is the -th frame, , F represents the number of frequency bins extracted, and T represents the number of time frames. The spectrogram size is , and is saved in the PNG format. After the speech with 3 s duration is processed with a frame length of 50 ms and a frame shift of 25 ms, the time frame and the frequency bin . Since the average duration of the TIMIT speech database is 3 s, in order to preserve the information of the resampled spectrogram in the frequency direction, we random-crop the spectrogram I of a different size to the size of along the time direction, which is used as the input to the network. When , the pixels will be interpolated with zero-padding, that is, , where the parameter t is a random number selected, . In contrast to resizing, which can distort the temporal and spectral characteristics of the speech signal, random-cropping preserves the original resolution and structure of the spectrogram, ensuring that important features are not lost or altered. Additionally, random-cropping helps to prevent overfitting during model training, so that the model can be better generalized to new data [36]. Before entering the network training and testing, the spectrogram needs to be standardized to prevent the gradient from disappearing or exploding, and to speed up the training and fitting process.
2.3. Architecture
The proposed model contains a feature extraction module, a feature fusion module and a classification module. The feature extractor is a bottom-up module in the feature pyramid that is stacked using the Bottleneck infrastructure of ResNet. The feature fusion module fuses the features of four different scales, and the obtained feature map contains information of different levels. Then, through the SE attention mechanism, greater weight is given to those channels that are more effective for classification. After the feature map is up-sampled, the lateral connection operation in the feature pyramid is performed to achieve cross-scale information transfer, so as to improve the performance of resampling detection tasks [37]. The classification module uses multiple full-connection layers to achieve feature dimension reduction, and obtains more abstract and distinguishable feature vectors, which are used for resampling decisions.
2.3.1. Feature Extraction
- (a)
- Bottleneck: A residual basis of ResNet [38], which is different from another residual basis, Basicblock, Bottleneck is divided into three steps: first, convolution is used to reduce the dimension of data; then the conventional convolution kernel is used; and finally, convolution is used to increase the dimension of the data. Its structure is similar to an hourglass, so it is called a bottleneck structure. For example, if the number of input channels is 256, the convolutional layer will first reduce the number of channels to 64, and then, increase the number of channels to 256 after the convolutional layer.
- (b)
- FPN: The feature pyramid is a pyramid shape composed of features at different scales extracted by deep convolutional neural networks [39]. In this paper, we use four bottleneck modules as the backbone network for extracting features at different scales, and the high-level features with low resolution but high-semantic information and the low-level features with high resolution but low-semantic information are added by up-sampling and lateral connection methods. The features at all scales have rich semantic information. Finally, feature maps of different scales are used for classification tasks.
2.3.2. Feature Fusion
- (a)
- Concat: Unifies the scale of the feature map through the maximum pooling operation. Utilizes the convolution kernel to adjust the 4-layer features to the same number of channels, and feature fusion is completed by using the Concat function.
- (b)
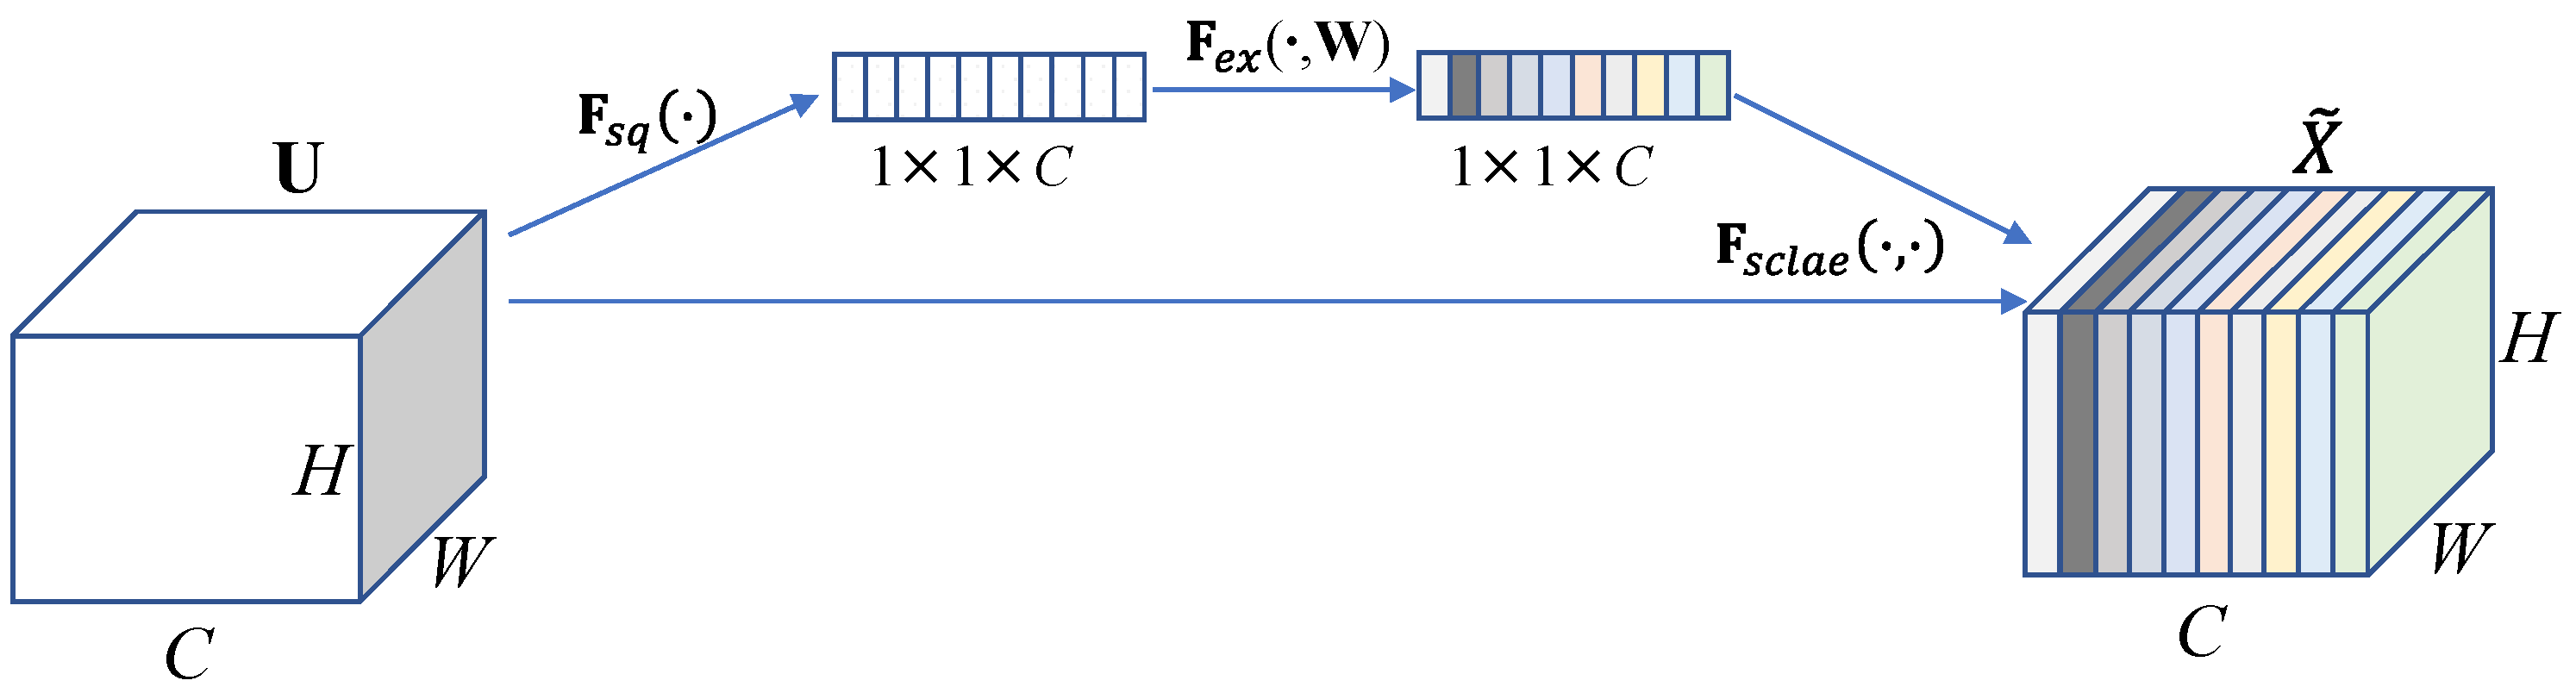
- SENet: Adjusts the channel attention of the fused feature map through the SE attention module to enhance the expression ability of the feature map [40]. SENet, shown in Figure 4, is a plug-and-play channel attention module that is often applied in visual models. It can enhance the channel features of the input feature map, and the output of the SE module does not change the size of the input feature map. SENet mainly includes two operations: squeeze and excitation.
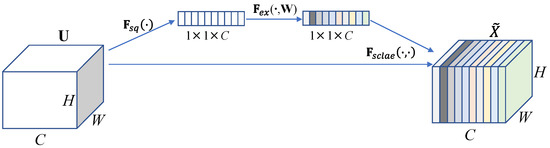 Figure 4. SENet block.
- : Squeeze refers to compressing the spatial information in the input feature map. The input feature map ’s dimensions are . In the spatial dimension, global average pooling is realized to obtain a feature map. The following equation is used:
- : Excitation combines the learned channel attention information with the input feature map . The vector obtained in the previous step is processed through two fully connected layers and , and the channel weight value is obtained. The formula is as follows:The activation function of the first fully connected layer is ReLU, and the activation function of the second fully connected layer is sigmoid.
- : The generated weight vector is weight-assigned to the feature map . To obtain the feature map with channel attention, the formula is as follows:The size of is the same as the feature map , which realizes the weighting of the feature map . The SE attention module can enhance the resampling time–frequency characteristics expressed in the feature map by focusing on channels that are effective for the resampling classification task and suppressing channels that are ineffective.
- (c)
- Lateral connection: Used in the top-down up-sampling process of the network, accompanied by the operation of lateral connection. The results of up-sampling are fused with the bottom-up-generated feature maps of the same scale, that is, added pixel by pixel [40]. In the experiment, bilinear interpolation is selected for up-sampling. is obtained by the SE attention module, which reduces the number of channels to 256 by convolution, obtaining through (6):where represents the weight coefficients of the four pixels closest to the target pixel, which can be obtained from the distance between the target pixel and these four pixels. We will process the feature maps extracted from the Bottleneck3 through convolution, reducing the number of channels to 256, and obtain . After Equation (7), the final feature map is calculated.
The main purpose of this is to exploit detailed information such as edges and textures of shallow resampled speech, which fuses semantic information of deep feature maps to achieve cross-level information transfer.
2.3.3. Classification and Evaluation Metrics
In the experiments, the obtained feature map is flattened to remove the spatial relationship between pixels and effectively combine the spatial information with the channel information. After the fully connected layer, the high-dimensional feature vectors are compressed to be low dimensional to obtain more abstract and distinguished feature vectors and to reduce the computational complexity and the number of parameters. Using the ReLU activation function, the nonlinear fitting ability of the model is increased, and then, the probabilities of two classes are output after the linear layer. Finally, the proposed model loss is calculated through the cross-entropy loss function.
Cross-entropy: Cross-entropy is mainly used to measure the difference between two probability distributions, which is a loss function often used in classification problems. Firstly, log-softmax normalization is performed on the obtained vector, and the formula is as follows:
Given the output node i, is the probability of the correct category. Next, the NLLloss is calculated as in Equation (9):
is the data label after one-hot encoding, 1 for the positive class and 0 for the negative class. Finally, combining the two gives the cross-entropy loss:
The predicted probability for each category is and . C is one of the evaluation metrics used in this paper.
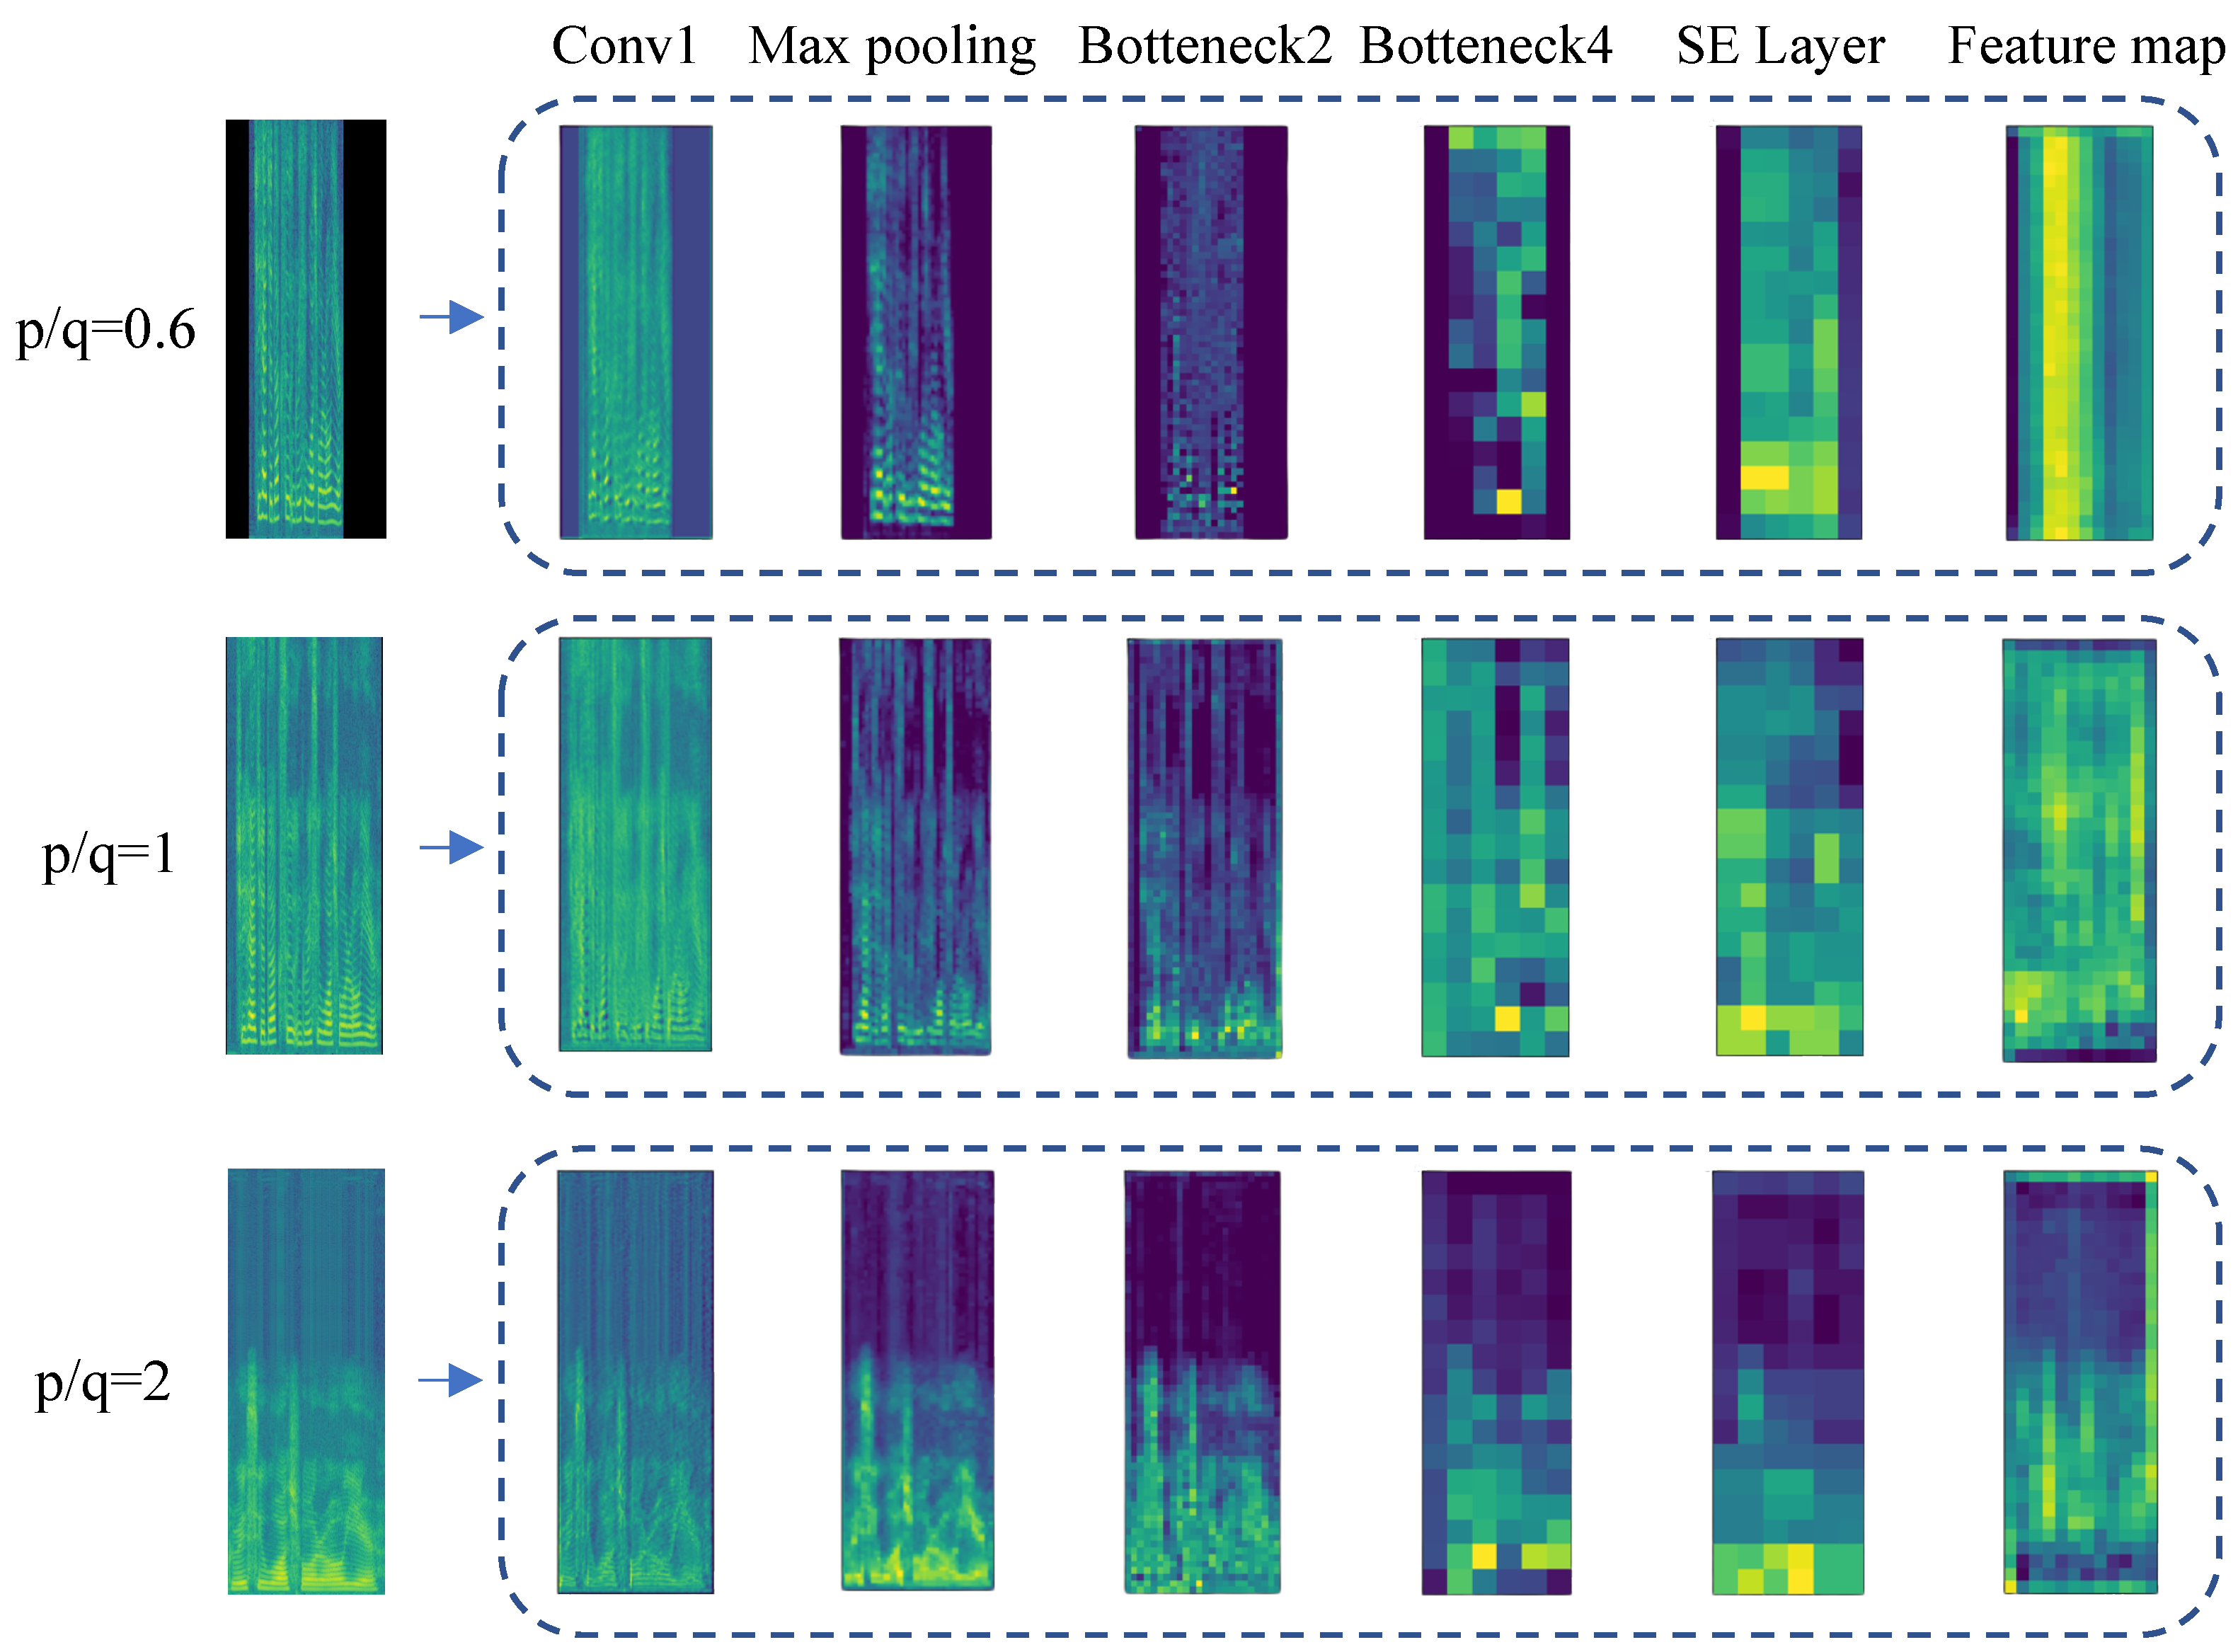
2.4. Changes in Spectrogram Features in Different Network Layers
To visually observe the ability of the proposed model to extract features and capture resampling changes, we analyzed the feature variations in the spectrogram at different network layers. Figure 5 shows the feature visualization process of the spectrogram through the proposed model, which includes down-sampled speech, original speech, and up-sampled speech. To observe the changes more intuitively, the resampling is performed by the zero-complementing interpolation method. When p/q = 0.6, the time-domain length decreases, the frequency-band length stretches, and the energy of the high-frequency component in the spectrogram increases. And zero-padding is carried out before inputting the model for training. When p/q = 2, the length doubles in the time domain. As the frequency resolution increases in the low-frequency region, the frequency bandwidth decreases. Therefore, the frequency domain exhibits the characteristics of compression, resulting in the energy reduction of the high-frequency components in the spectrogram.
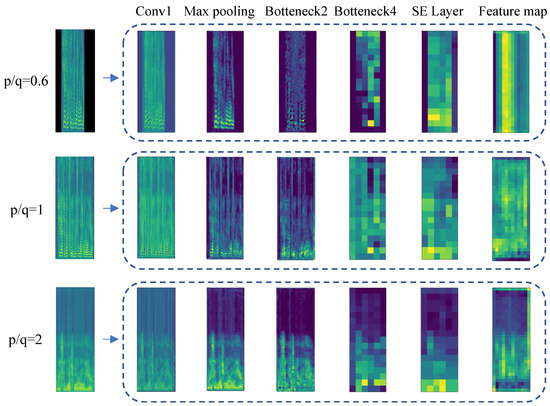
Figure 5.
Spectrogram features at different network layers.
When the spectrogram enters the first convolution layer, the proposed model can capture the resampling characteristics of the above analysis. After the maximum pooling layer, the model focuses on the pixels with large energy and reduces the dimensions of the feature map. The output of Bottleneck2 layer indicates that the model is still able to capture the characteristics of up-sampling, original speech, and down-sampling in the time and frequency domains. The model extracts semantic information of the spectrogram through Bottleneck4, and the features of the down-sampling frequency domain stretching and up-sampling frequency domain compression can still be observed. It is noted in the figure that the SE layer helps to assign greater weight to channels that are more effective for model detection tasks, and the pixel values of the feature map corresponding to channels are enlarged. Finally, after the lateral connection operation, due to the fusion of the edge texture information captured by the upper layer, it can be seen that the final feature map restores the characteristics of the resampled spectrogram in the time and frequency domains and contains rich semantic information. Thus, the subsequent resampling classification task has better performance.
3. Experiments and Analysis
3.1. Experimental Setup
3.1.1. Dataset
Since there is no public speech database for speech resampling detection at present, the resampling corpus constructed by Zhang et al. [19] is used in this paper, and the original speech is selected from the TIMIT dataset. The TIMIT database contains 6300 utterances, with an average duration of 3 s, from 630 participants in eight major dialect areas in the United States. The original speech files is mono, PCM encoded, 16 kHz sampling ratio, and 16 bit quantization [18]. The resampling corpus selects 3000 original speech samples from TIMIT. These samples were resampled using the linear interpolation, spline interpolation, and cubic interpolation methods, and the sampling factor range was 0.6∼1.6 with a step size of 0.1. This resampled corpus is used to comprehensively evaluate the effectiveness of our proposed method for detecting resampled speech.
As shown in Table 1, the corpus also includes MP3-compressed speech databases using three different bit rates of 32 kbps, 64 kbps, and 128 kbps for the original speech and resampled speech, as well as the mixed corpus constructed by randomly selecting resampled speech from different interpolation databases.

Table 1.
Corpus used in experiments.
3.1.2. Implementation Details
The experiment used the Pytorch framework, the development environment was python 3.7, and the hardware platform was an NVIDIA GTX 3070. The study in this paper was experimented on a corpus made by Zhang [19] et al. based on the TIMIT database. The detection experiment of each sampling factor has a total of 6000 pictures. The training set and the test set are divided into 5:5, and the pictures of variable length are randomly cropped, and then, standardized. As supervised learning, instances of the false speech class are marked 1 as negative and instances of the natural speech class are marked 0 as positive. Model training uses cross-entropy as a loss function and using SGD optimizer. The initial learning rate is 0.01, the batch size is 16, and the number of training epochs is set to 12. In the experiment, we focus on selecting the mixed corpus for detection to verify the effectiveness of the model. In order to verify the robustness of the model, we selected speeches with different compression bit rates in the mixed corpus for comparative experiments.
3.2. Results and Analysis
3.2.1. Different Interpolation Methods
The process of resampling was introduced earlier, including up-sampling, interpolation, and down-sampling. The interpolation methods mainly include linear interpolation, spline interpolation, and cubic interpolation. Different interpolation methods have different effects on the accuracy of resampling-tamper detection. When the resampling factors are 0.8, 0.9, 1.1, and 1.2, the tampered speech is closer to the original speech, which has higher reconstruction quality and less information loss. Therefore, the tamper detection accuracy of these factors is low in the current methods. In this section, the proposed model is compared with a traditional speech signal feature extraction algorithm [16] and a manual spectrogram feature extraction algorithm [18,19] on the corpus of three interpolation methods and four representative resampling factors. The restuls are shown in Table 2.
Table 2.
Resampling detection results under different interpolation methods.
- Different interpolation methods have a certain impact on the detection model, and the detection accuracy obtained by different interpolation methods varies from 0.17% to 2.16%. In general, the detection accuracy of the model is less affected by the interpolation method.
- Regardless of the detection under different sampling factors or different interpolation methods, the accuracy of the method proposed in this paper is higher than the methods of Hou [16], Wang [18] and Zhang [19]. The results show that the performance of using the deep learning method to extract spectrogram features for resampling detection is significantly better than the existing research results.
3.2.2. Architecture Comparison
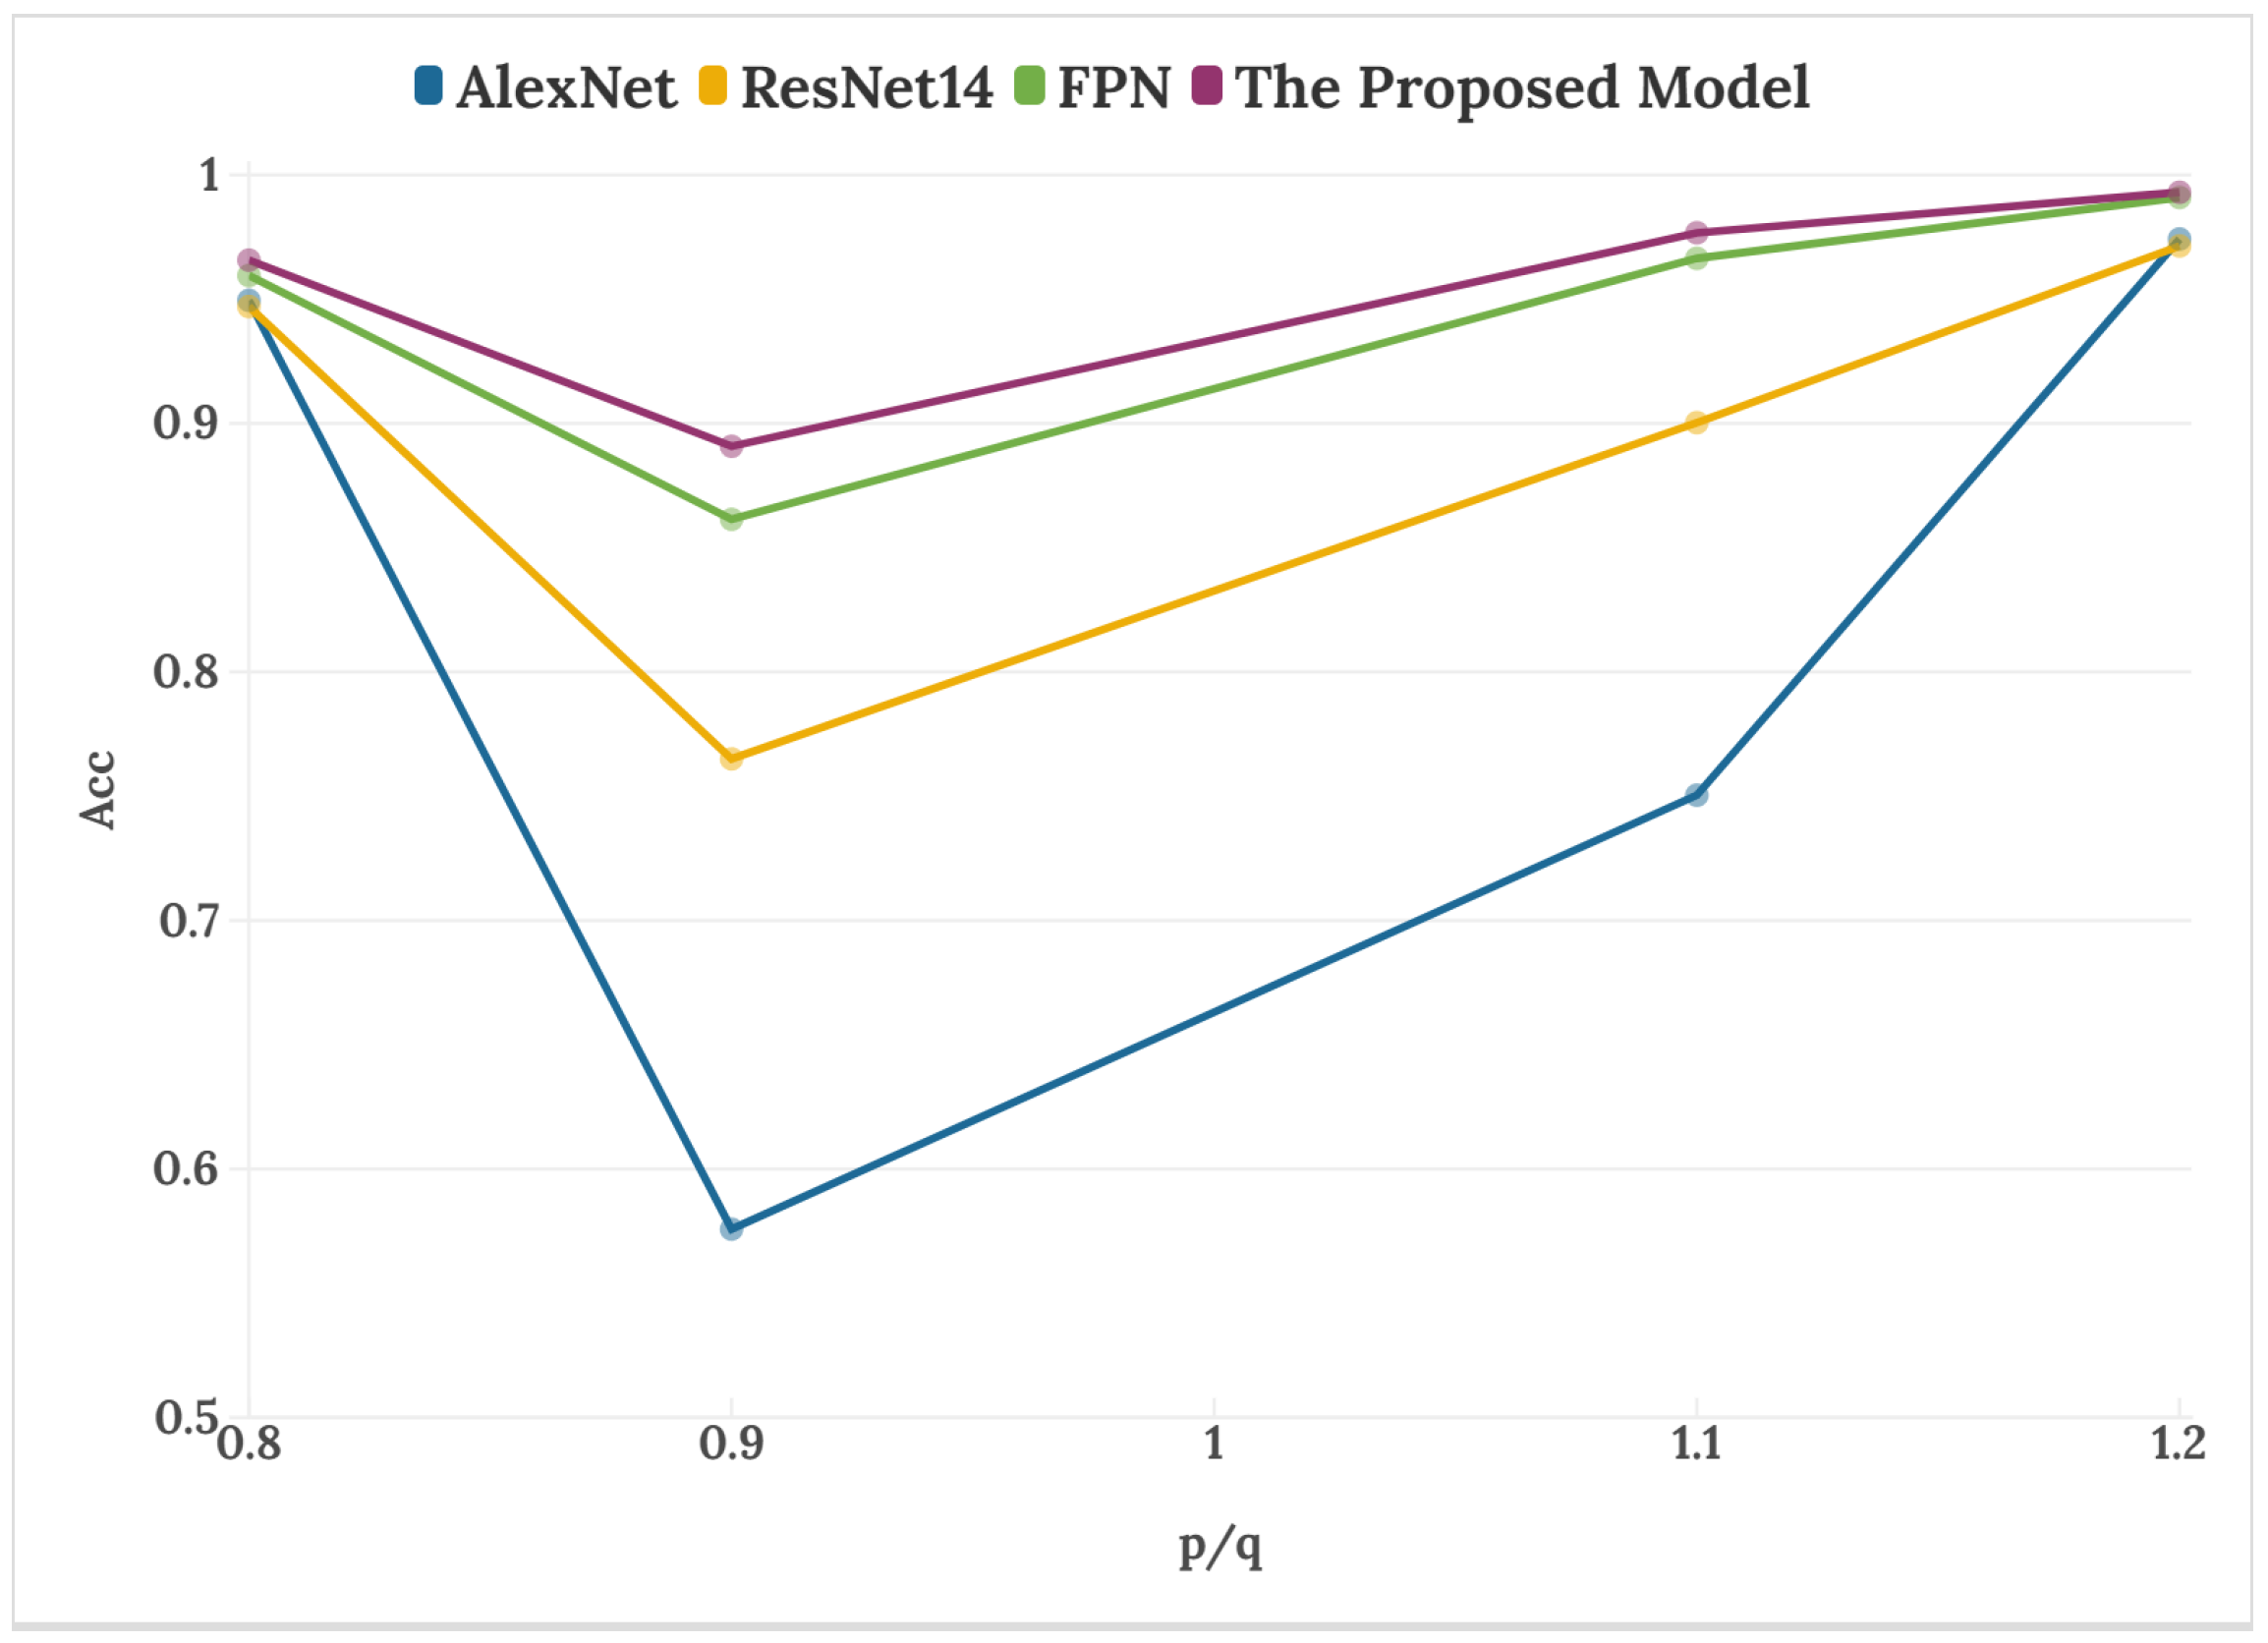
With the innovation of deep learning, the ability of neural networks to extract features is also constantly enriched. In this paper, one-dimensional speech signals are converted into a two- dimensional spectrogram, and neural networks are used to extract the spectrogram features, which greatly improves the ability of speech resampling detection. In this section, after attempting to train different network models, we construct a deep attention network that combines low-level location features with high-level semantic features and adds SE attention modules. In the experiment, classic classification networks are compared with the proposed model to test the accuracy of resampling detection. ResNet14 is a feature extractor formed by stacking four Bottlenecks, and FPN is a model structure that integrates top-down two-layer feature maps based on ResNet14. The speech of the four sampling factors in the table is from the mixed corpus.
The data in Table 3 and Figure 6 show the impact of the four network models on the accuracy of different resampling factors. It is worth noting that when p/q = 0.8 and p/q = 1.2, AlexNet, ResNet14, and FPN all have good detection capabilities. When the resampling factor is 1.1, it is observed that the classification ability of the AlexNet model decreases, and the detection performance of ResNet14 also slightly weakens. When p/q = 0.9, the detection accuracy of the four models has a different degree of decline, among which AlexNet and ResNet14 decrease significantly, indicating that the two comparison models could not adapt to tamper detection of multiple resampling factors. The accuracy rate of the proposed model is as high as 89.09%, which is about three percentage points higher than the high-performance FPN. In addition, under other sampling factors, the proposed model achieved optimal results, which verifies its effectiveness.
Table 3.
Detection results of different network models.
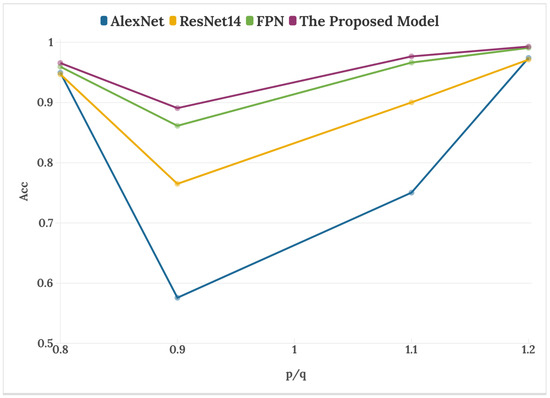
Figure 6.
Detection accuracy of different network models.
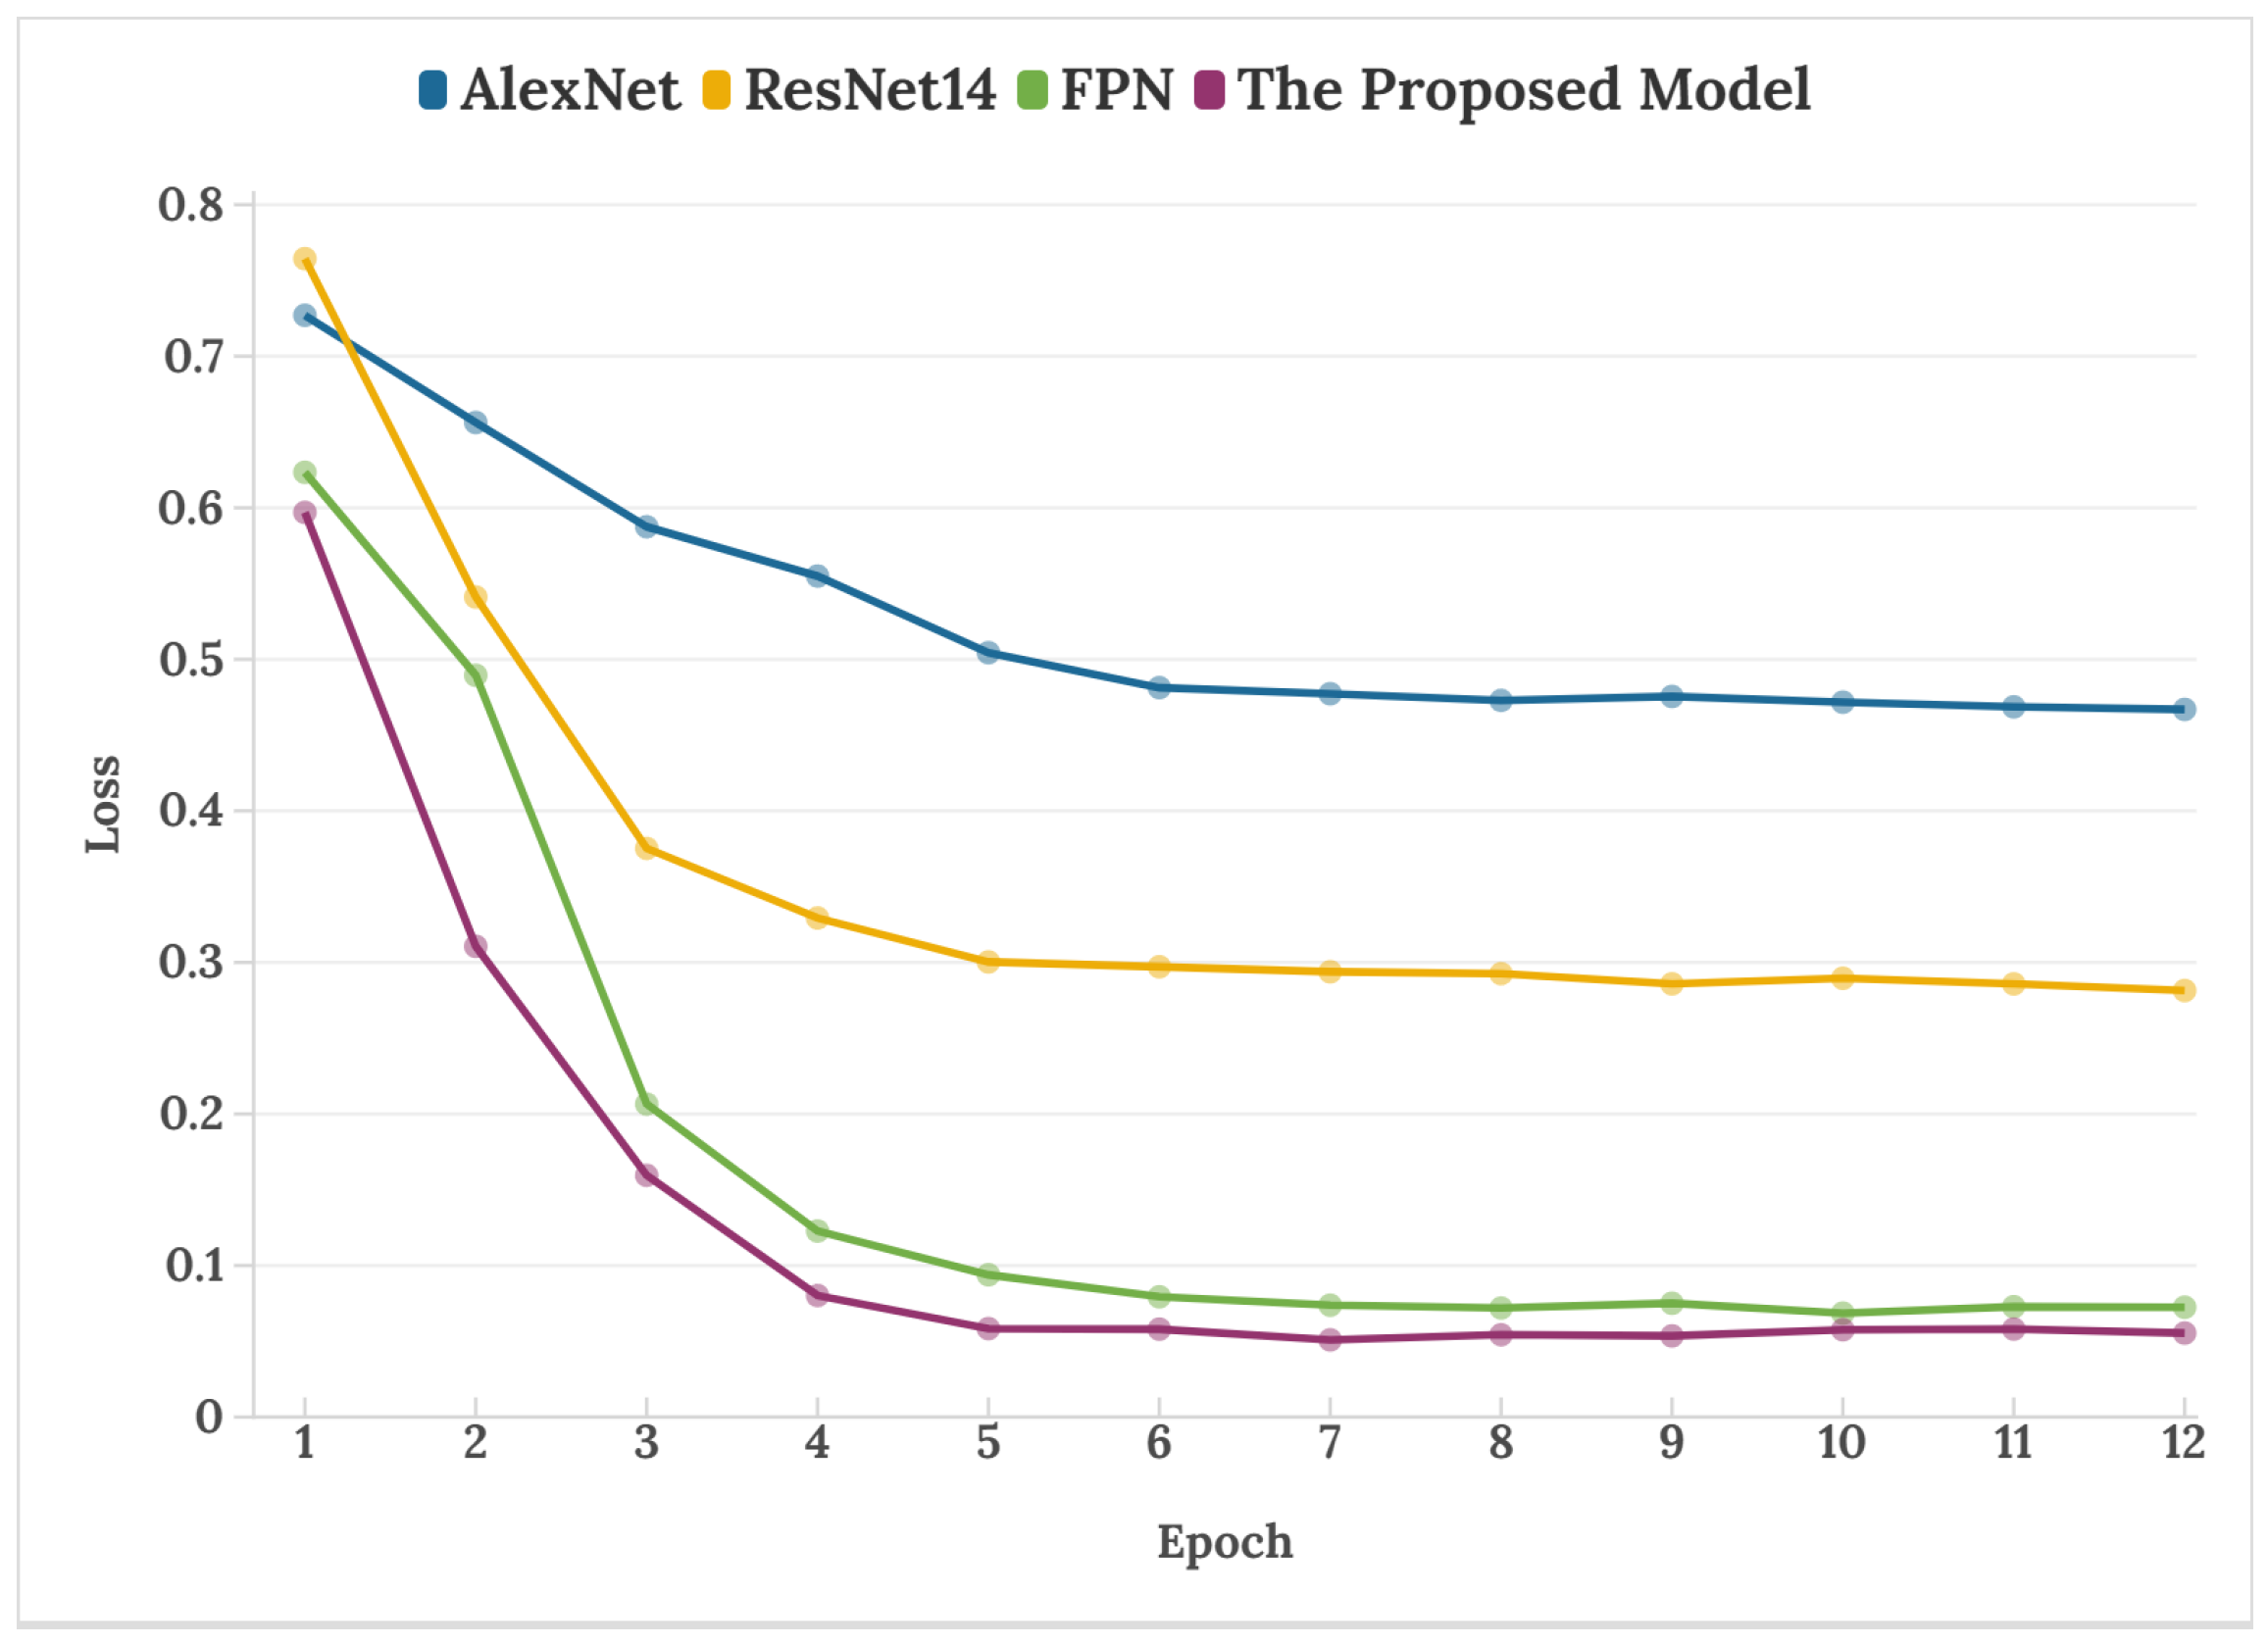
Figure 7 shows the training loss curves of different network models when the resampling factor is 1.1. Its variation indicates that the loss value of the proposed model can converge quickly and maintain stability with the increase in the number of iterations.
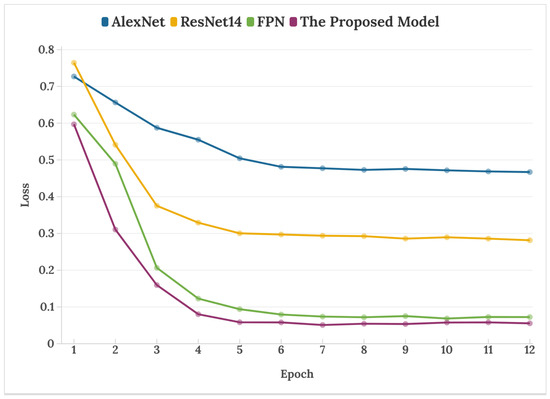
Figure 7.
Loss curves of different network models.
To validate the stability of the proposed model, we evaluated the performance using different backbone networks in the speech resampling detection model. The choice of backbone network is crucial for the model’s feature extraction efficiency and overall performance. In this study, we used ResNet14 as the backbone for the proposed model. Additionally, we integrated other backbone networks, EfficientNet and Vision Transformer (ViT), into our model framework and analyzed their performance in detection accuracy. Table 1 shows the impact of different backbone networks on the detection accuracy under small-scale resampling-tampering.
As can be seen from Table 4, the ResNet14 backbone has better detection performance than the other two backbone networks. Additionally, we experimented with different learning rates and found that ResNet14 could adapt to various learning rates. This adaptability effectively helped us complete the speech resampling detection task.
Table 4.
Comparison of detection results for different backbone networks.
It is worth noting that the results for ViT were achieved using a learning rate ten times lower than those used for ResNet14 and EfficientNet-B0, as ViT could not be trained properly with the same learning rate. Therefore, although ViT showed high accuracy when p/q = 0.9, its requirement for a lower learning rate indicates potential training instability issues under different learning rates.
3.2.3. Different Compression Sampling Factors
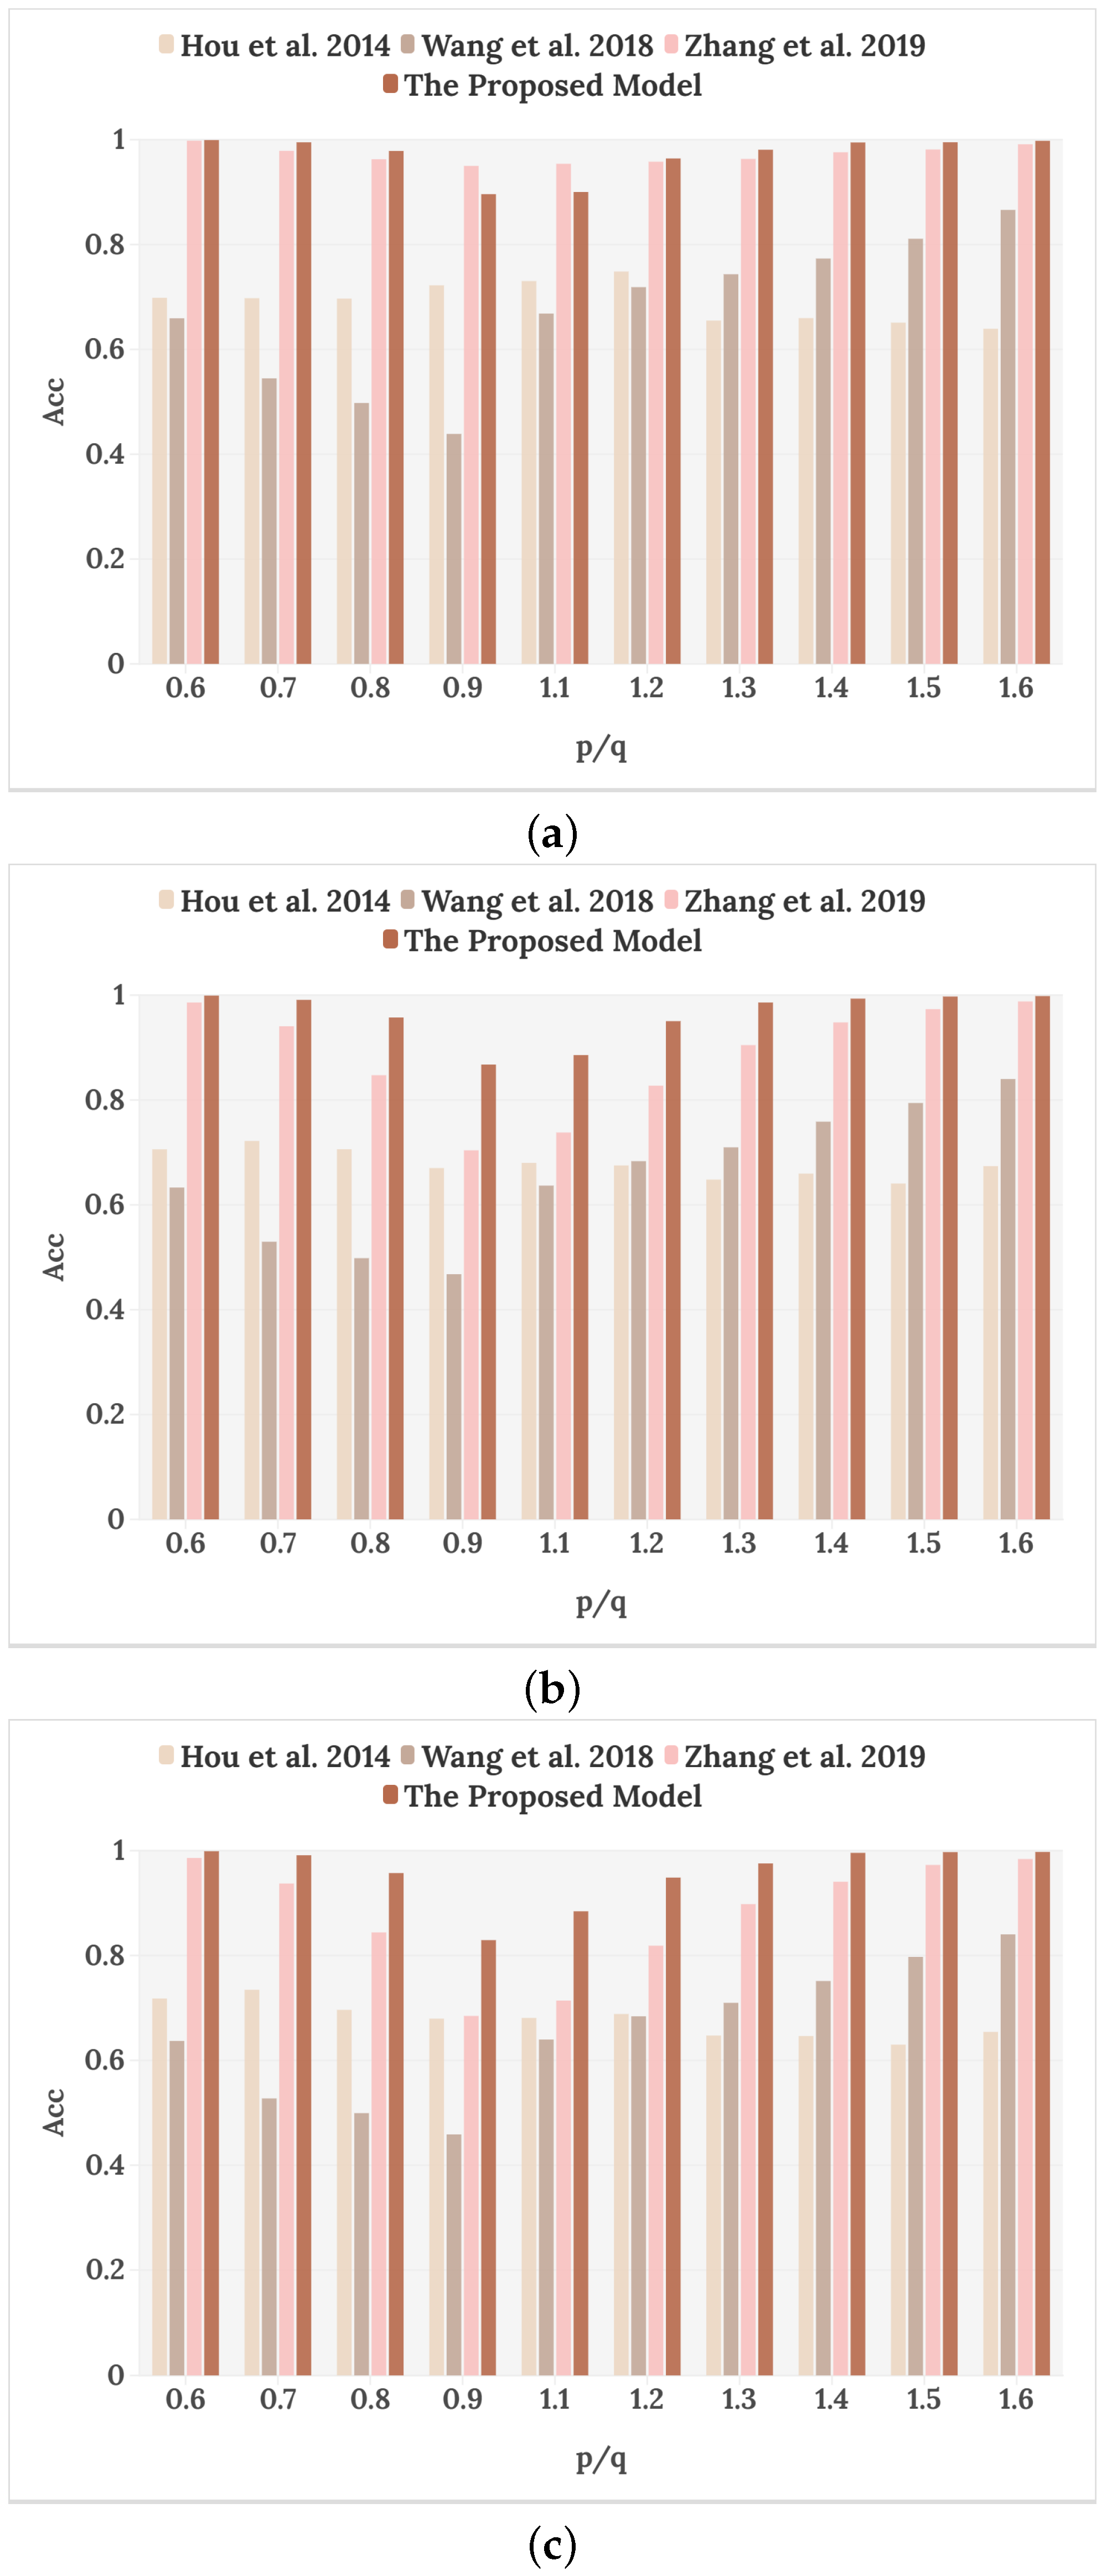
In this section, our main objective is to compare the detection capabilities of the proposed model with traditional methods under different sampling factors. In traditional methods, Hou et al. [16] calculated the second-order difference of the speech signal and found the periodicity of the zero-value interval to detect resampling. Wang et al. [18] found that an incomplete interpolation process resulted in inconsistent bandwidth and sampling frequency of the spectrogram to detect resampling. Zhang et al. [19] used LBP operators to model time–frequency statistical changes in the spectrogram, and used SVM to classify the features of the LBP histogram to distinguish between original speech and resampled speech. In the case of large-scale speech tampering, the above methods are able to determine speech resampling to some extent. However, for small-scale tamper detection, that is, the resampling factor is 0.8 to 1.2, they do not show high detection accuracy. Therefore, the experiment in this section compares the detection accuracy of 10 resampling factors using the proposed model and other methods on the mixed resampling corpus, as shown in the following table.
The results in Table 5 show that the detection accuracy of our proposed model is better than other methods under a resampling factor of 0.6∼1.6. Moreover, the accuracy under resampling factors of 0.8, 0.9, 1.1, and 1.2, which are difficult to detect, is greatly improved. In particular, the accuracy of resampling-tampering detection with p/q = 0.9 is increased by nearly 20%. And with an increase or decrease in the resampling factor, the accuracy rate gradually improves. The reason is that the larger the scale of down-sampling and up-sampling, the more obvious are the time–frequency variation characteristics displayed on the spectrogram. The model can effectively learn its changes and make better classification decisions, which verifies that the proposed model has a strong ability to extract resampling features from the spectrogram, and has high generalization.
Table 5.
Detection results of different network models.
3.2.4. The Impact of MP3 Compression
Speech compression is necessary in the process of voice transmission. In real-world scenarios, MP3 is the most commonly used speech format, which is obtained by compressing WAV speech [41]. However, the MP3 compression operation may obscure previous resampling traces in speech, so we test the robustness of MP3 compression in this section.
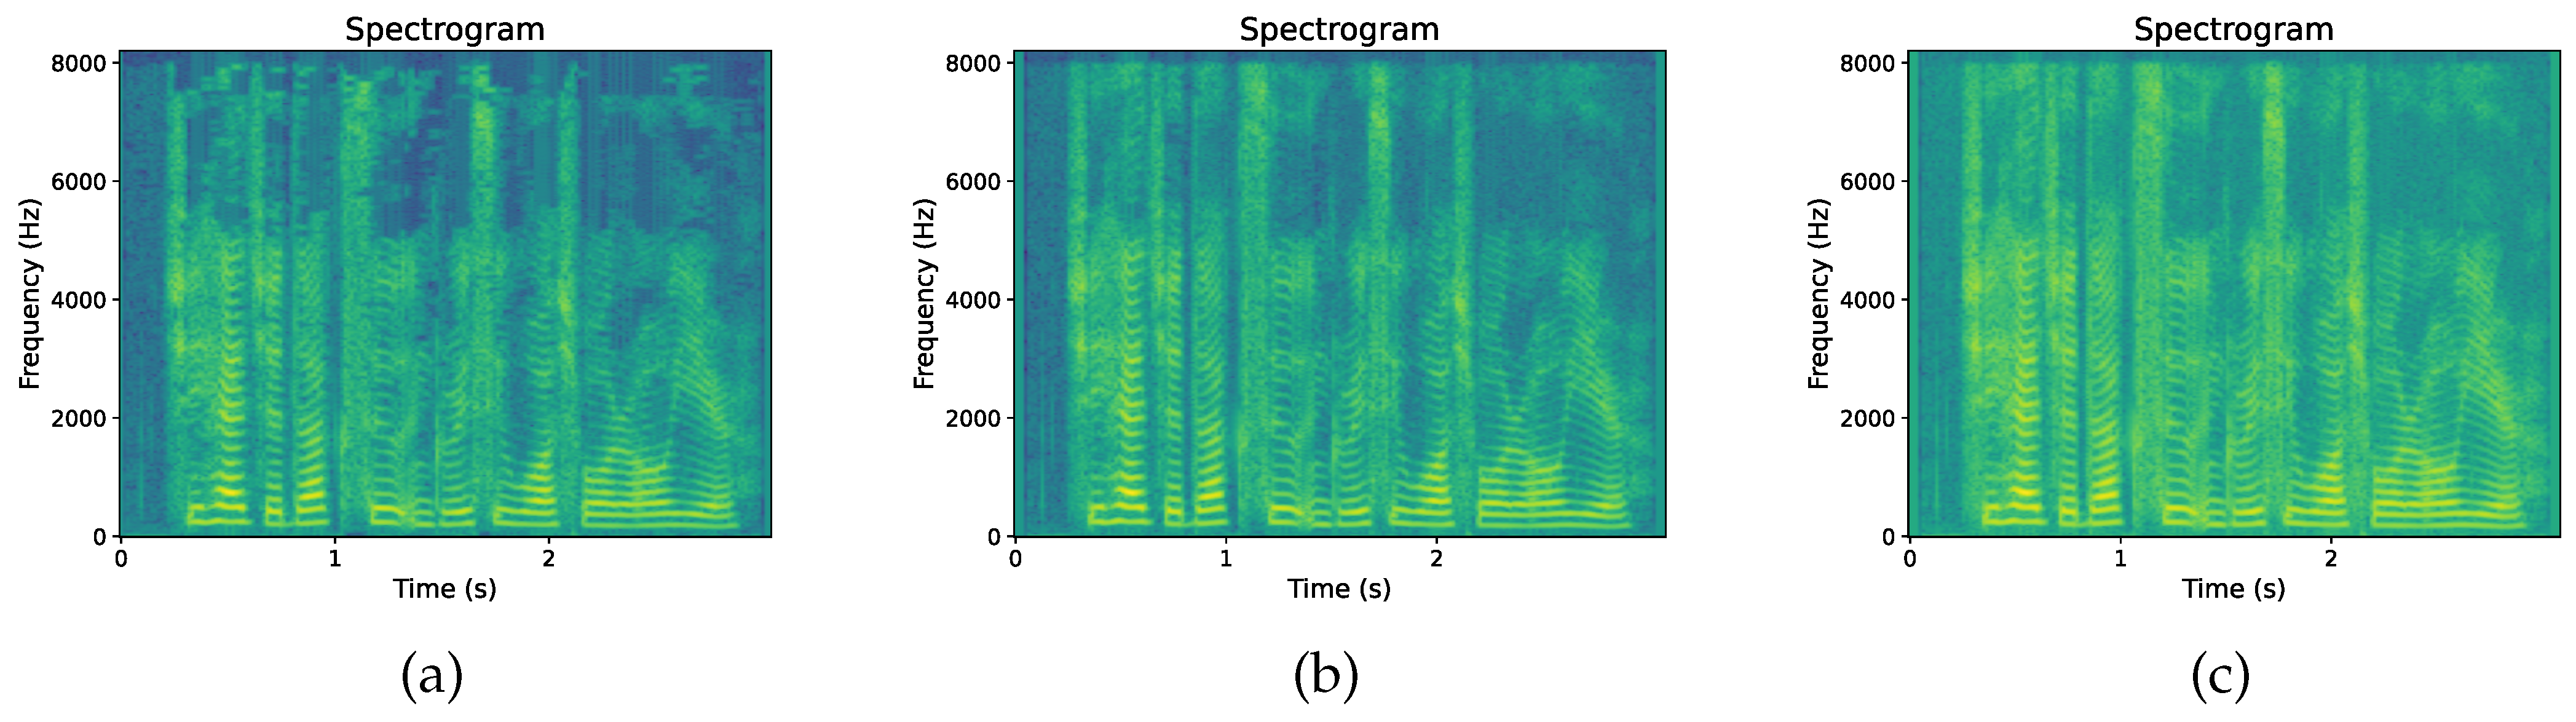
The experiment uses compression bit rates of 128 kbps, 64 kbps, and 32 kbps to compress speech signals, as shown in Figure 8. As the compression bit rate decreases, the frequency resolution of the high-frequency region in the spectrogram decreases, resulting in a more ambiguous representation of high-frequency signals and a relatively clearer representation of low-frequency signals [42]. A low compression bit rate leads to distortion of the speech signal, which makes abnormal spectral components appear in the spectrogram.
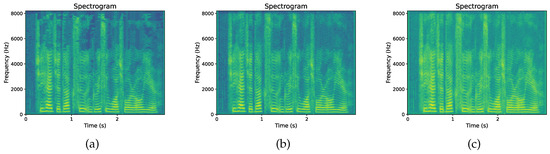
Figure 8.
Spectrogram at three compression bit rates: (a) 32 kbps, (b) 64 kbps, and (c) 128 kbps.
In order to analyze whether the changes in the spectrogram caused by MP3 compression has some influence on the resampling detection model in this paper, we train and test the original speech and resampled speech with different compression bit rates. The experiments analyze the changes in the model detection effect after the original speech and the resampled speech of each factor are compressed, as shown in Table 6.
Table 6.
Comparison of detection accuracy under different compression bit rates.
It can be observed from Table 6 and Figure 9 that the performance of the model is disturbed after MP3 compression, and the detection performance of the algorithm is degraded to some extent, but the proposed method still has a high detection accuracy for compressed resampled speech. By observing the feature map captured by the model, it is found that the smaller the speech compression bit rate, the more significant the distortion and noise effects of the signal, but the classification ability of the model is improved. This is because the sampling rate of the original speech does not change before compression, and the degree of information loss is relatively light, while the resampled speech being compressed results in more information loss due to the sampling rate conversion before compression, so that the difference between the two is more significant.
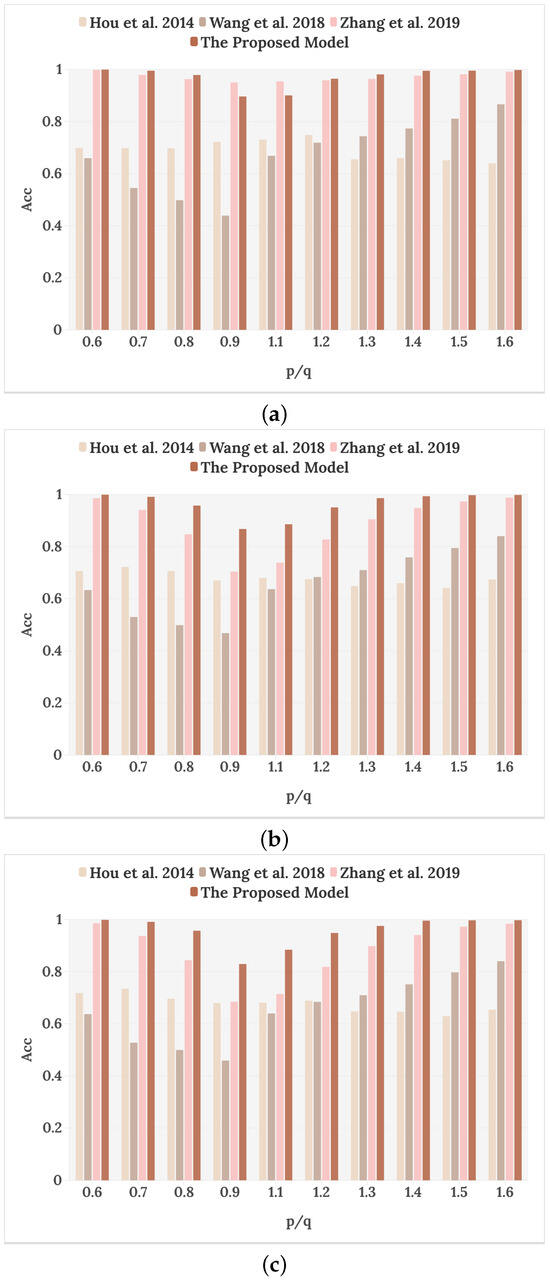
Figure 9.
Resampling detection results with different compression bit rates: (a) 32 kbps, (b) 64 kbps, and (c) 128 kbps [16,18,19].
However, at a compression bit rate of 32 kbps, two types of resampled speech close to the original speech have a lower detection capability than the method of Zhang et al. [19] because the LBP operator is a local feature descriptor, which has a better representation of high-frequency detail loss, and the proposed model focuses on learning more complex global time–frequency variation features. Compared with other methods, for which the resampling detection performance degrades at high compression bit rates, the detection accuracy of the proposed model is less affected by the degree of compression, indicating that the proposed method is strongly resistant to compression.
4. Conclusions
The application of deep learning methods in speech-resampling-tamper detection is a new task. Based on our previous work [19], this paper uses a feature pyramid network that integrates attention mechanism to extract the spectrogram features of original and tampered speech and classify them. The experimental results show that the proposed method can distinguish between the original speech and the resampled speech effectively under the condition of speech tampering with multiple resampling factors. Among them, the accuracy of resampling detection is significantly improved when the amplitude of tampering is small. In addition, in the test under different compression ratios, the proposed model shows relatively good robustness, and can still accurately detect and recognize the compressed speech. To enhance the robustness and generalizability of our findings, we plan to extend our experiments to more recent and larger datasets such as DidiSpeech [43] and AiShell-4 [44]. We also plan to make our resampled and compressed speech corpus publicly available for further validation. For future work, we will consider using other deep networks to further improve the accuracy of small-scale resampling-tamper detection, and estimating the resampling factor is also a part of our future plans.
Author Contributions
Conceptualization, X.Z. and Y.Z.; methodology, X.Z. and Y.Z.; software, X.Z.; validation, X.Z.; formal analysis, Y.Z.; investigation, X.Z. and Y.Z.; resources, Y.Z.; data curation, X.Z. and Y.Z.; writing—original draft preparation, X.Z.; writing—review and editing, X.Z., Y.Z., Y.W., J.T. and S.X.; visualization, X.Z.; supervision, Y.Z.; project administration, X.Z. and Y.Z.; funding acquisition, Y.Z. All authors have read and agreed to the published version of the manuscript.
Funding
This work was supported in part by the National Natural Science Foundation of China under Grant No. 62072057, in part by the Natural Science Foundation of Shanghai under Grant No. 17ZR1411900, in part by the Opening Project of Shanghai Key Laboratory of Integrated Administration Technologies for Information Security under Grant No. AGK20190005 and in part by the Innovation Fund for Industry-University-Research of Chinese Universities under Grant No. 2021ZYB01003.
Institutional Review Board Statement
Not applicable.
Informed Consent Statement
Not applicable.
Data Availability Statement
The dataset and code used in this study are available upon request from the corresponding author.
Conflicts of Interest
The authors declare no conflicts of interest.
References
- Audacity: Free Audio Editor and Recorder. Available online: http://www.audacityteam.org/ (accessed on 17 December 2023).
- Cool Edit Pro Is Now Adobe Audition. Available online: http://www.adobe.com/products/audition.html (accessed on 6 August 2023).
- Gold Wave-Audio Editor, Recorder, Converter, Restoration, and Analysis Software. Available online: http://www.goldwave.ca/ (accessed on 3 February 2024).
- Yan, Q.; Yang, R.; Huang, J. Detection of speech smoothing on very short clips. IEEE Trans. Inf. Forensics Secur. 2019, 14, 2441–2453. [Google Scholar] [CrossRef]
- Bevinamarad, P.R.; Shirldonkar, M. Audio forgery detection techniques: Present and past review. In Proceedings of the 2020 4th International Conference on Trends in Electronics and Informatics (ICOEI)(48184), Tirunelveli, India, 15–17 June 2020; IEEE: Piscataway, NJ, USA, 2020; pp. 613–618. [Google Scholar]
- Mubeen, Z.; Afzal, M.; Ali, Z.; Khan, S.; Imran, M. Detection of impostor and tampered segments in audio by using an intelligent system. Comput. Electr. Eng. 2021, 91, 107122. [Google Scholar] [CrossRef]
- Saleem, S.; Dilawari, A.; Khan, U.G. Spoofed voice detection using dense features of stft and mdct spectrograms. In Proceedings of the 2021 International Conference on Artificial Intelligence (ICAI), Islamabad, Pakistan, 5–7 April 2021; IEEE: Piscataway, NJ, USA, 2021; pp. 56–61. [Google Scholar]
- Capoferri, D.; Borrelli, C.; Bestagini, P.; Antonacci, F.; Sarti, A.; Tubaro, S. Speech audio splicing detection and localization exploiting reverberation cues. In Proceedings of the 2020 IEEE International Workshop on Information Forensics and Security (WIFS), New York, NY, USA, 6–11 December 2020; IEEE: Piscataway, NJ, USA; 2020; pp. 1–6. [Google Scholar]
- Huang, X.; Liu, Z.; Lu, W.; Liu, H.; Xiang, S. Fast and effective copy-move detection of digital audio based on auto segment. In Digital Forensics and Forensic Investigations: Breakthroughs in Research and Practice; IGI Global: Hershey, PA, USA, 2020; pp. 127–142. [Google Scholar]
- Zhao, J.; Lu, B.; Huang, L.; Huang, M.; Huang, J. Digital audio tampering detection using ENF feature and LST-MInception net. In Proceedings of the AIIPCC 2022; The Third International Conference on Artificial Intelligence, Information Processing and Cloud Computing, Online, 21–22 June 2022; VDE: Berlin, Germany, 2022; pp. 1–4. [Google Scholar]
- Gallagher, A.C. Detection of linear and cubic interpolation in JPEG compressed images. In Proceedings of the 2nd Canadian Conference on Computer and Robot Vision (CRV’05), Victoria, BC, Canada, 9–11 May 2005; IEEE: Piscataway, NJ, USA, 2005; pp. 65–72. [Google Scholar]
- Mahdian, B.; Saic, S. Blind authentication using periodic properties of interpolation. IEEE Trans. Inf. Forensics Secur. 2008, 3, 529–538. [Google Scholar] [CrossRef]
- Yao, Q.; Chai, P.; Xuan, G.; Yang, Z.; Shi, Y. Audio re-sampling detection in audio forensics based on EM algorithm. J. Comput. Appl. 2006, 26, 2598–2601. [Google Scholar]
- Chen, Y.X.; Xi, W.U. A method of detecting re-sampling based on expectation maximization applied in audio blind forensics. J. Circuits Syst. 2012, 17, 118–123. [Google Scholar]
- Shi, Q.; Ma, X. Detection of audio interpolation based on singular value decomposition. In Proceedings of the 2011 3rd International Conference on Awareness Science and Technology (iCAST), Dalian, China, 27–30 September 2011; IEEE: Piscataway, NJ, USA, 2011; pp. 287–290. [Google Scholar]
- Hou, L.; Wu, W.; Zhang, X. Audio re-sampling detection in audio forensics based on second-order derivative. J. Shanghai Univ. 2014, 20, 304–312. [Google Scholar]
- Popescu, A.C.; Farid, H. Exposing digital forgeries by detecting traces of resampling. IEEE Trans. Signal Process. 2005, 53, 758–767. [Google Scholar] [CrossRef]
- Wang, Z.; Yan, D.; Wang, R.; Xiang, L.; Wu, T. Speech resampling detection based on inconsistency of band energy. Comput. Mater. Contin. 2018, 56, 247–259. [Google Scholar]
- Zhang, Y.; Dai, S.; Song, W.; Zhang, L.; Li, D. Exposing speech resampling manipulation by local texture analysis on spectrogram images. Electronics 2019, 9, 23. [Google Scholar] [CrossRef]
- Xu, Y.; Irfan, M.; Fang, A.; Zheng, J. Multiscale Attention Network for Detection and Localization of Image Splicing Forgery. IEEE Trans. Instrum. Meas. 2023, 72, 1–15. [Google Scholar] [CrossRef]
- Lang, X.; Han, F. MFL Image Recognition Method of Pipeline Corrosion Defects Based on Multilayer Feature Fusion Multiscale GhostNet. IEEE Trans. Instrum. Meas. 2022, 71, 1–8. [Google Scholar] [CrossRef]
- Wani, T.M.; Gunawan, T.S.; Qadri, S.A.A.; Mansor, H.; Arifin, F.; Ahmad, Y.A. Stride Based Convolutional Neural Network for Speech Emotion Recognition. In Proceedings of the 2021 IEEE 7th International Conference on Smart Instrumentation, Measurement and Applications (ICSIMA), Bandung, Indonesia, 23–25 August 2021; IEEE: Piscataway, NJ, USA, 2021; pp. 41–46. [Google Scholar]
- Banerjee, S.; Singh, G.K. A Robust Bio-Signal Steganography With Lost-Data Recovery Architecture Using Deep Learning. IEEE Trans. Instrum. Meas. 2022, 71, 1–10. [Google Scholar] [CrossRef]
- Huang, J.; Luo, T.; Li, L.; Yang, G.; Xu, H.; Chang, C.C. ARWGAN: Attention-Guided Robust Image Watermarking Model Based on GAN. IEEE Trans. Instrum. Meas. 2023, 72, 1–17. [Google Scholar] [CrossRef]
- Küçükuğurlu, B.; Ustubioglu, B.; Ulutas, G. Duplicated Audio Segment Detection with Local Binary Pattern. In Proceedings of the 2020 43rd International Conference on Telecommunications and Signal Processing (TSP), Milan, Italy, 7–9 July 2020; IEEE: Piscataway, NJ, USA, 2020; pp. 350–353. [Google Scholar]
- Yan, D.; Dong, M.; Gao, J. Exposing speech transsplicing forgery with noise level inconsistency. Secur. Commun. Networks 2021, 2021, 6659371. [Google Scholar] [CrossRef]
- Ulutas, G.; Tahaoglu, G.; Ustubioglu, B. Forge Audio Detection Using Keypoint Features on Mel Spectrograms. In Proceedings of the 2022 45th International Conference on Telecommunications and Signal Processing (TSP), Virtual, 13–15 July 2022; IEEE: Piscataway, NJ, USA, 2022; pp. 413–416. [Google Scholar]
- Jadhav, S.; Patole, R.; Rege, P. Audio splicing detection using convolutional neural network. In Proceedings of the 2019 10th International Conference on Computing, Communication and Networking Technologies (ICCCNT), Kanpur, India, 6–8 July 2019; IEEE: Piscataway, NJ, USA, 2019; pp. 1–5. [Google Scholar]
- Ustubioglu, A.; Ustubioglu, B.; Ulutas, G. Mel spectrogram-based audio forgery detection using CNN. Signal Image Video Process. 2023, 17, 2211–2219. [Google Scholar] [CrossRef]
- Chuchra, A.; Kaur, M.; Gupta, S. A Deep Learning Approach for Splicing Detection in Digital Audios. In Proceedings of the Congress on Intelligent Systems: Proceedings of CIS 2021; Springer: Berlin/Heidelberg, Germany, 2022; Volume 1, pp. 543–558. [Google Scholar]
- Hu, J.; Shen, L.; Sun, G. Squeeze-and-Excitation Networks. In Proceedings of the 2018 IEEE/CVF Conference on Computer Vision and Pattern Recognition, Salt Lake, UT, USA, 18–23 June 2018; pp. 7132–7141. [Google Scholar]
- Özseven, T. Investigation of the effect of spectrogram images and different texture analysis methods on speech emotion recognition. Appl. Acoust. 2018, 142, 70–77. [Google Scholar] [CrossRef]
- Zeng, Y.; Mao, H.; Peng, D. Spectrogram based multi-task audio classification. Multimed. Tools Appl. 2019, 78, 3705–3722. [Google Scholar] [CrossRef]
- Pyrovolakis, K.; Tzouveli, P.; Stamou, G. Multi-modal song mood detection with deep learning. Sensors 2022, 22, 1065. [Google Scholar] [CrossRef] [PubMed]
- Savić, N.; Milivojević, Z.; Prlinčević, B.; Kostić, D. Septic-convolution Kernel-Comparative Analysis of the Interpolation Error. In Proceedings of the 2022 International Conference on Development and Application Systems (DAS), Suceava, Romania, 26–28 May 2022; IEEE: Piscataway, NJ, USA, 2022; pp. 36–41. [Google Scholar]
- Pereira, E.; Carneiro, G.; Cordeiro, F.R. A Study on the Impact of Data Augmentation for Training Convolutional Neural Networks in the Presence of Noisy Labels. In Proceedings of the 2022 35th SIBGRAPI Conference on Graphics, Patterns and Images (SIBGRAPI), Natal, Brazil, 24–27 October 2022; IEEE: Piscataway, NJ, USA, 2022; Volume 1, pp. 25–30. [Google Scholar]
- Yue, G.; Li, S.; Cong, R.; Zhou, T.; Lei, B.; Wang, T. Attention-Guided Pyramid Context Network for Polyp Segmentation in Colonoscopy Images. IEEE Trans. Instrum. Meas. 2023, 72, 1–13. [Google Scholar] [CrossRef]
- He, K.; Zhang, X.; Ren, S.; Sun, J. Deep residual learning for image recognition. In Proceedings of the IEEE Conference on Computer Vision and Pattern Recognition, Las Vegas, NV, USA, 27–30 June 2016; pp. 770–778. [Google Scholar]
- Lin, T.Y.; Dollár, P.; Girshick, R.; He, K.; Hariharan, B.; Belongie, S. Feature pyramid networks for object detection. In Proceedings of the IEEE Conference on Computer Vision and Pattern Recognition, Honolulu, HI, USA, 21–26 July 2017; pp. 2117–2125. [Google Scholar]
- Zhang, H.; Zu, K.; Lu, J.; Zou, Y.; Meng, D. EPSANet: An efficient pyramid squeeze attention block on convolutional neural network. In Proceedings of the Asian Conference on Computer Vision, Macao, China, 4–8 December 2022; pp. 1161–1177. [Google Scholar]
- Xiang, Z.; Bestagini, P.; Tubaro, S.; Delp, E.J. Forensic Analysis and Localization of Multiply Compressed MP3 Audio Using Transformers. In Proceedings of the ICASSP 2022—2022 IEEE International Conference on Acoustics, Speech and Signal Processing (ICASSP), Singapore, 22–27 May 2022; IEEE: Piscataway, NJ, USA, 2022; pp. 2929–2933. [Google Scholar]
- Hailu, N.; Siegert, I.; Nürnberger, A. Improving automatic speech recognition utilizing audio-codecs for data augmentation. In Proceedings of the 2020 IEEE 22nd International Workshop on Multimedia Signal Processing (MMSP), Tampere, Finland, 21–24 September 2020; IEEE: Piscataway, NJ, USA, 2020; pp. 1–5. [Google Scholar]
- Guo, T.; Wen, C.; Jiang, D. Didispeech: A large scale mandarin speech corpus. In Proceedings of the ICASSP 2021-2021 IEEE International Conference on Acoustics, Speech and Signal Processing (ICASSP), Toronto, ON, Canada, 6–11 June 2021; IEEE: Piscataway, NJ, USA, 2021; pp. 6968–6972. [Google Scholar]
- Fu, Y.; Cheng, L.; Lv, S. Aishell-4: An open source dataset for speech enhancement, separation, recognition and speaker diarization in conference scenario. arXiv 2021, arXiv:2104.03603. [Google Scholar]
Disclaimer/Publisher’s Note: The statements, opinions and data contained in all publications are solely those of the individual author(s) and contributor(s) and not of MDPI and/or the editor(s). MDPI and/or the editor(s) disclaim responsibility for any injury to people or property resulting from any ideas, methods, instructions or products referred to in the content. |
© 2024 by the authors. Licensee MDPI, Basel, Switzerland. This article is an open access article distributed under the terms and conditions of the Creative Commons Attribution (CC BY) license (https://creativecommons.org/licenses/by/4.0/).