Article

Imaging and 3D Analysis Based on Two or More Three-Dimensional CBCT Recordings before and after Orthodontic Treatment and Maxillofacial Therapy

1
Department of Stomatology, 2nd Medical Faculty, Charles University in Prague, 150 06 Prague, Czech Republic
2
Department of Mathematics, Informatics and Cybernetics, University of Chemistry and Technology in Prague, 166 28 Prague, Czech Republic
3
Czech Institute of Informatics, Robotics and Cybernetics, Czech Technical University in Prague, 160 00 Prague, Czech Republic
4
Department of Anthropology, Faculty of Science, Masaryk University, 611 37 Prague, Czech Republic
*
Author to whom correspondence should be addressed.
Appl. Sci. 2024, 14(11), 4829; https://doi.org/10.3390/app14114829
Submission received: 13 April 2024 / Revised: 17 May 2024 / Accepted: 31 May 2024 / Published: 3 June 2024
(This article belongs to the Special Issue Advanced Biotechnology Applied to Orthodontic TSADs and CBCT)

Abstract

:
Cone beam computed tomography (CBCT) has emerged as a crucial radiographic technique for orthodontic diagnosis and treatment planning, particularly for cases requiring the assessment of complex anatomical relationships. In the first part of the study, we examined metric characteristics measured on 3D cranial models of patients before and after surgery. In the second part, we conducted more complex data processing, analyzing a set of 12 cranial feature points using Procrustes analysis to quantify and visually represent surgical modifications. The third part involved comparing 3D facial surfaces using Iterative Closest Point (ICP) alignment and nearest point-to-point distances. Additionally, we tested point configurations in the facial soft tissues. The study included a group of orthodontic patients from whom CBCT data and 3D facial scans were obtained during treatment. The results demonstrated that each method could assess preoperative and postoperative changes to varying degrees. They also highlighted potential gender differences in surgical modifications that warrant further investigation and consideration during surgical planning. The aim of our study was to compare 3D visualizations of skull and facial models before and after surgery, to assess the degree of relative agreement or similarity, and to identify any morphological differences.

1. Introduction

Since its introduction to dentistry in 1998, cone beam computed tomographic (CBCT) imaging has become an essential radiographic technique for orthodontic diagnosis and treatment planning, particularly in situations requiring the evaluation of complex anatomical relationships within the maxillofacial skeleton [1,2,3]. The adoption of CBCT has been driven by its advantages in providing three-dimensional (3D) imaging over traditional two-dimensional radiography [4,5,6,7,8].
It is recognized that CBCT imaging in orthodontics and pediatric dentistry exposes children to three to five times more radiation than adults during the same scanning session. However, patients with severe malocclusions and dentofacial deformities often require combined orthodontic treatment and maxillofacial surgery [9,10]. In these cases, CBCT integrated with virtual surgical planning allows surgeons to simulate different treatment options and predict the postoperative facial profile [11,12].
Previous research has used comparisons of 3D visualizations of cranial models and configurations of landmarks on the skull and face for surgical planning [13,14]. Basic forms of comparison, such as the evaluation of metric features and the calculation of distances between landmarks on 3D models, help determine the relative agreement or similarity between external structures or identify significant differences [15]. More complex data processing, such as landmark-based analysis through geometric morphometrics or surface-based processing, facilitates the exploration and representation of spatial relationships between craniofacial components [16,17].
Geometric morphometrics processes discrete points (expressed in X, Y, Z Cartesian coordinates) using General Procrustes Analysis (GPA) for alignment. Once aligned, these coordinates are used to compute the Procrustes distance (PD), a metric that indicates the dissimilarity or similarity between two or more shapes [18,19]. Conversely, comparing two or more 3D surfaces [20] often requires more computationally intensive registration algorithms such as Iterative Closest Point (ICP), with differences expressed as nearest point-to-point distances or cumulative measures such as the Hausdorff distance.
The size and shape of the facial skeleton are fundamental determinants of facial appearance. Small asymmetries in skeletal morphology are noticeable, but the changes resulting from orthodontic therapy or maxillofacial surgery are usually much more significant. Soft tissues, in particular, can either mask or accentuate deformities, but they do not always correspond directly to the underlying skeleton.
Given these circumstances, orthodontics and maxillofacial surgery rely on long-term imaging techniques to monitor both soft and hard head tissues, primarily the profile, skeleton, and dentition, for therapy planning and orthodontic and orthognathic treatment. These techniques can also be applied to anthropology and forensic dentistry [21,22]. The 3D treatment plan for orthodontic patients, which includes both soft and hard tissue considerations along with orthognathic surgery, allows for an accurate prognosis of the outcome when the skeletal basis of the face is available in two or more three-dimensional image sets.
The aim of our study was to compare 3D visualizations of skull and facial models before and after surgery, to assess the degree of agreement or similarity, and to identify any morphological differences [23,24]. All of these methods use advanced sensor systems, traditional signal and image processing tools, and computational intelligence methods to support the needs of 3D CBCT models in dentistry [25,26]. The new 3D technology proposed in our research is based on CBCT recordings taken before and after orthodontic therapy, offering advantages such as (i) the accurate long-term planning of future maxillofacial surgery over several years and (ii) the ability to visualize future positions of the soft and hard tissues of the face in 3D space.

2. Materials and Methods

The study consisted of three separate parts, each involving a group of orthodontic patients from whom CBCT data and 3D facial scans were obtained before and after treatment. All participants provided informed consent before the study, were in good general health, and the research was conducted according to the guidelines of the American Dental Association (ADA) and the tenets of the Declaration of Helsinki. Data confidentiality and anonymity were strictly maintained. The study was approved by the Ethics Committee (EK-973IGA 1.12/11). Our methodology focused on comparing three-dimensional images of the skull or its components, supplemented by 3D facial scans to enhance the robustness of our findings.
The proposed methodology includes:
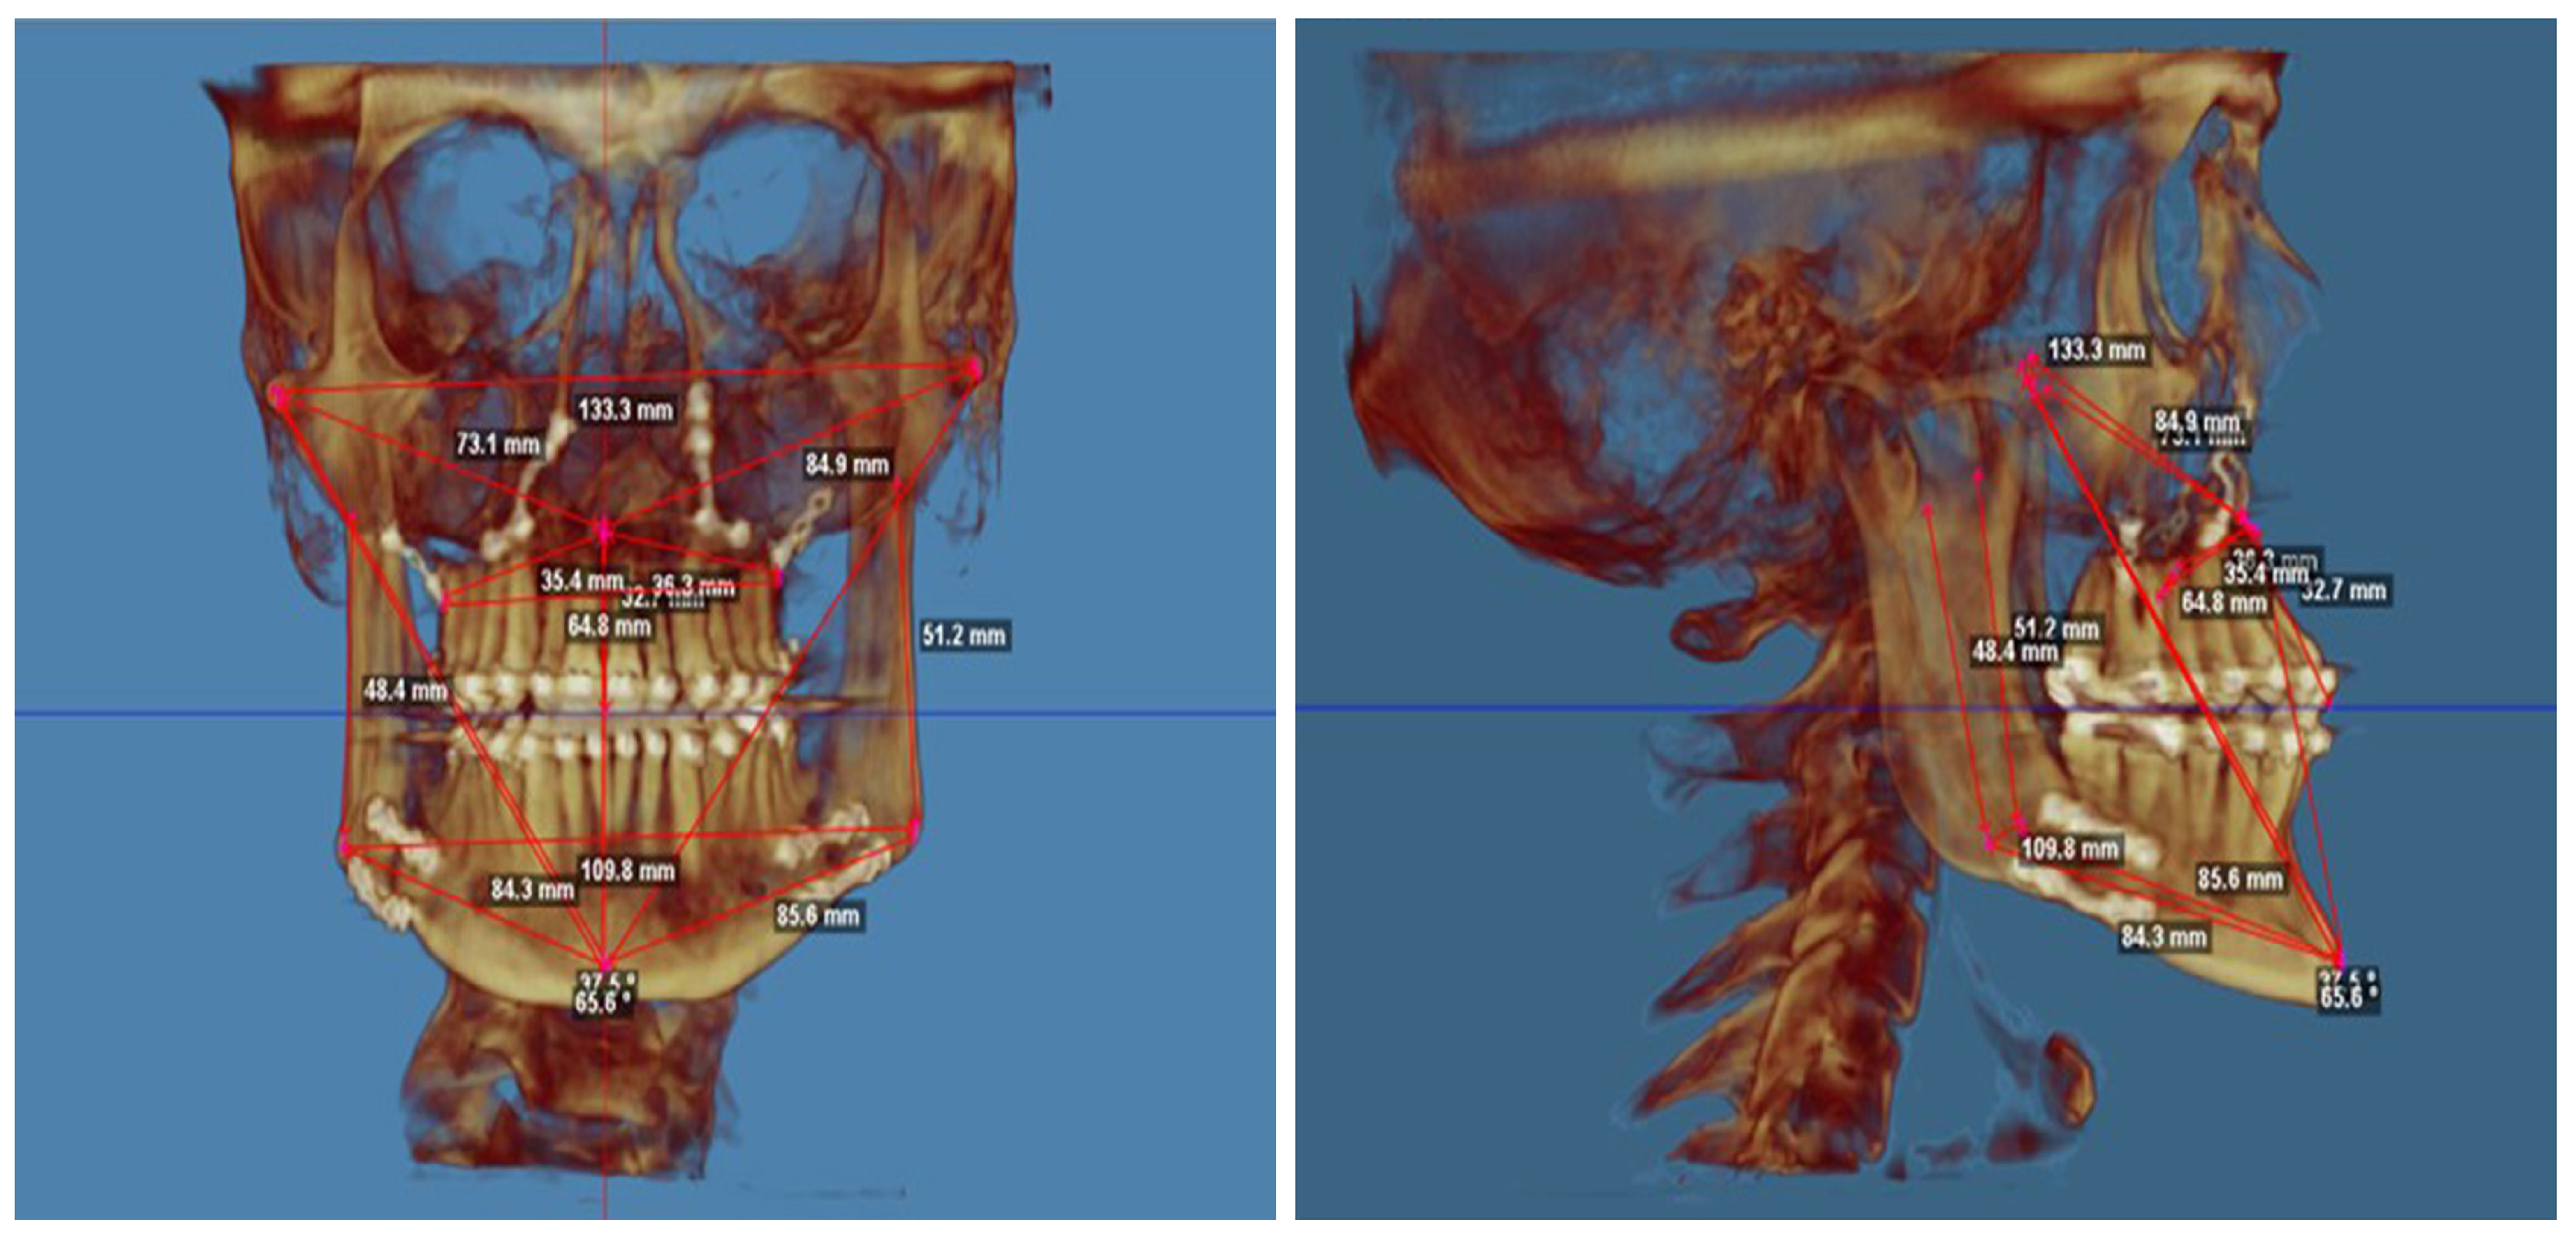
  • taking cranial measurements on 3D cranial models,
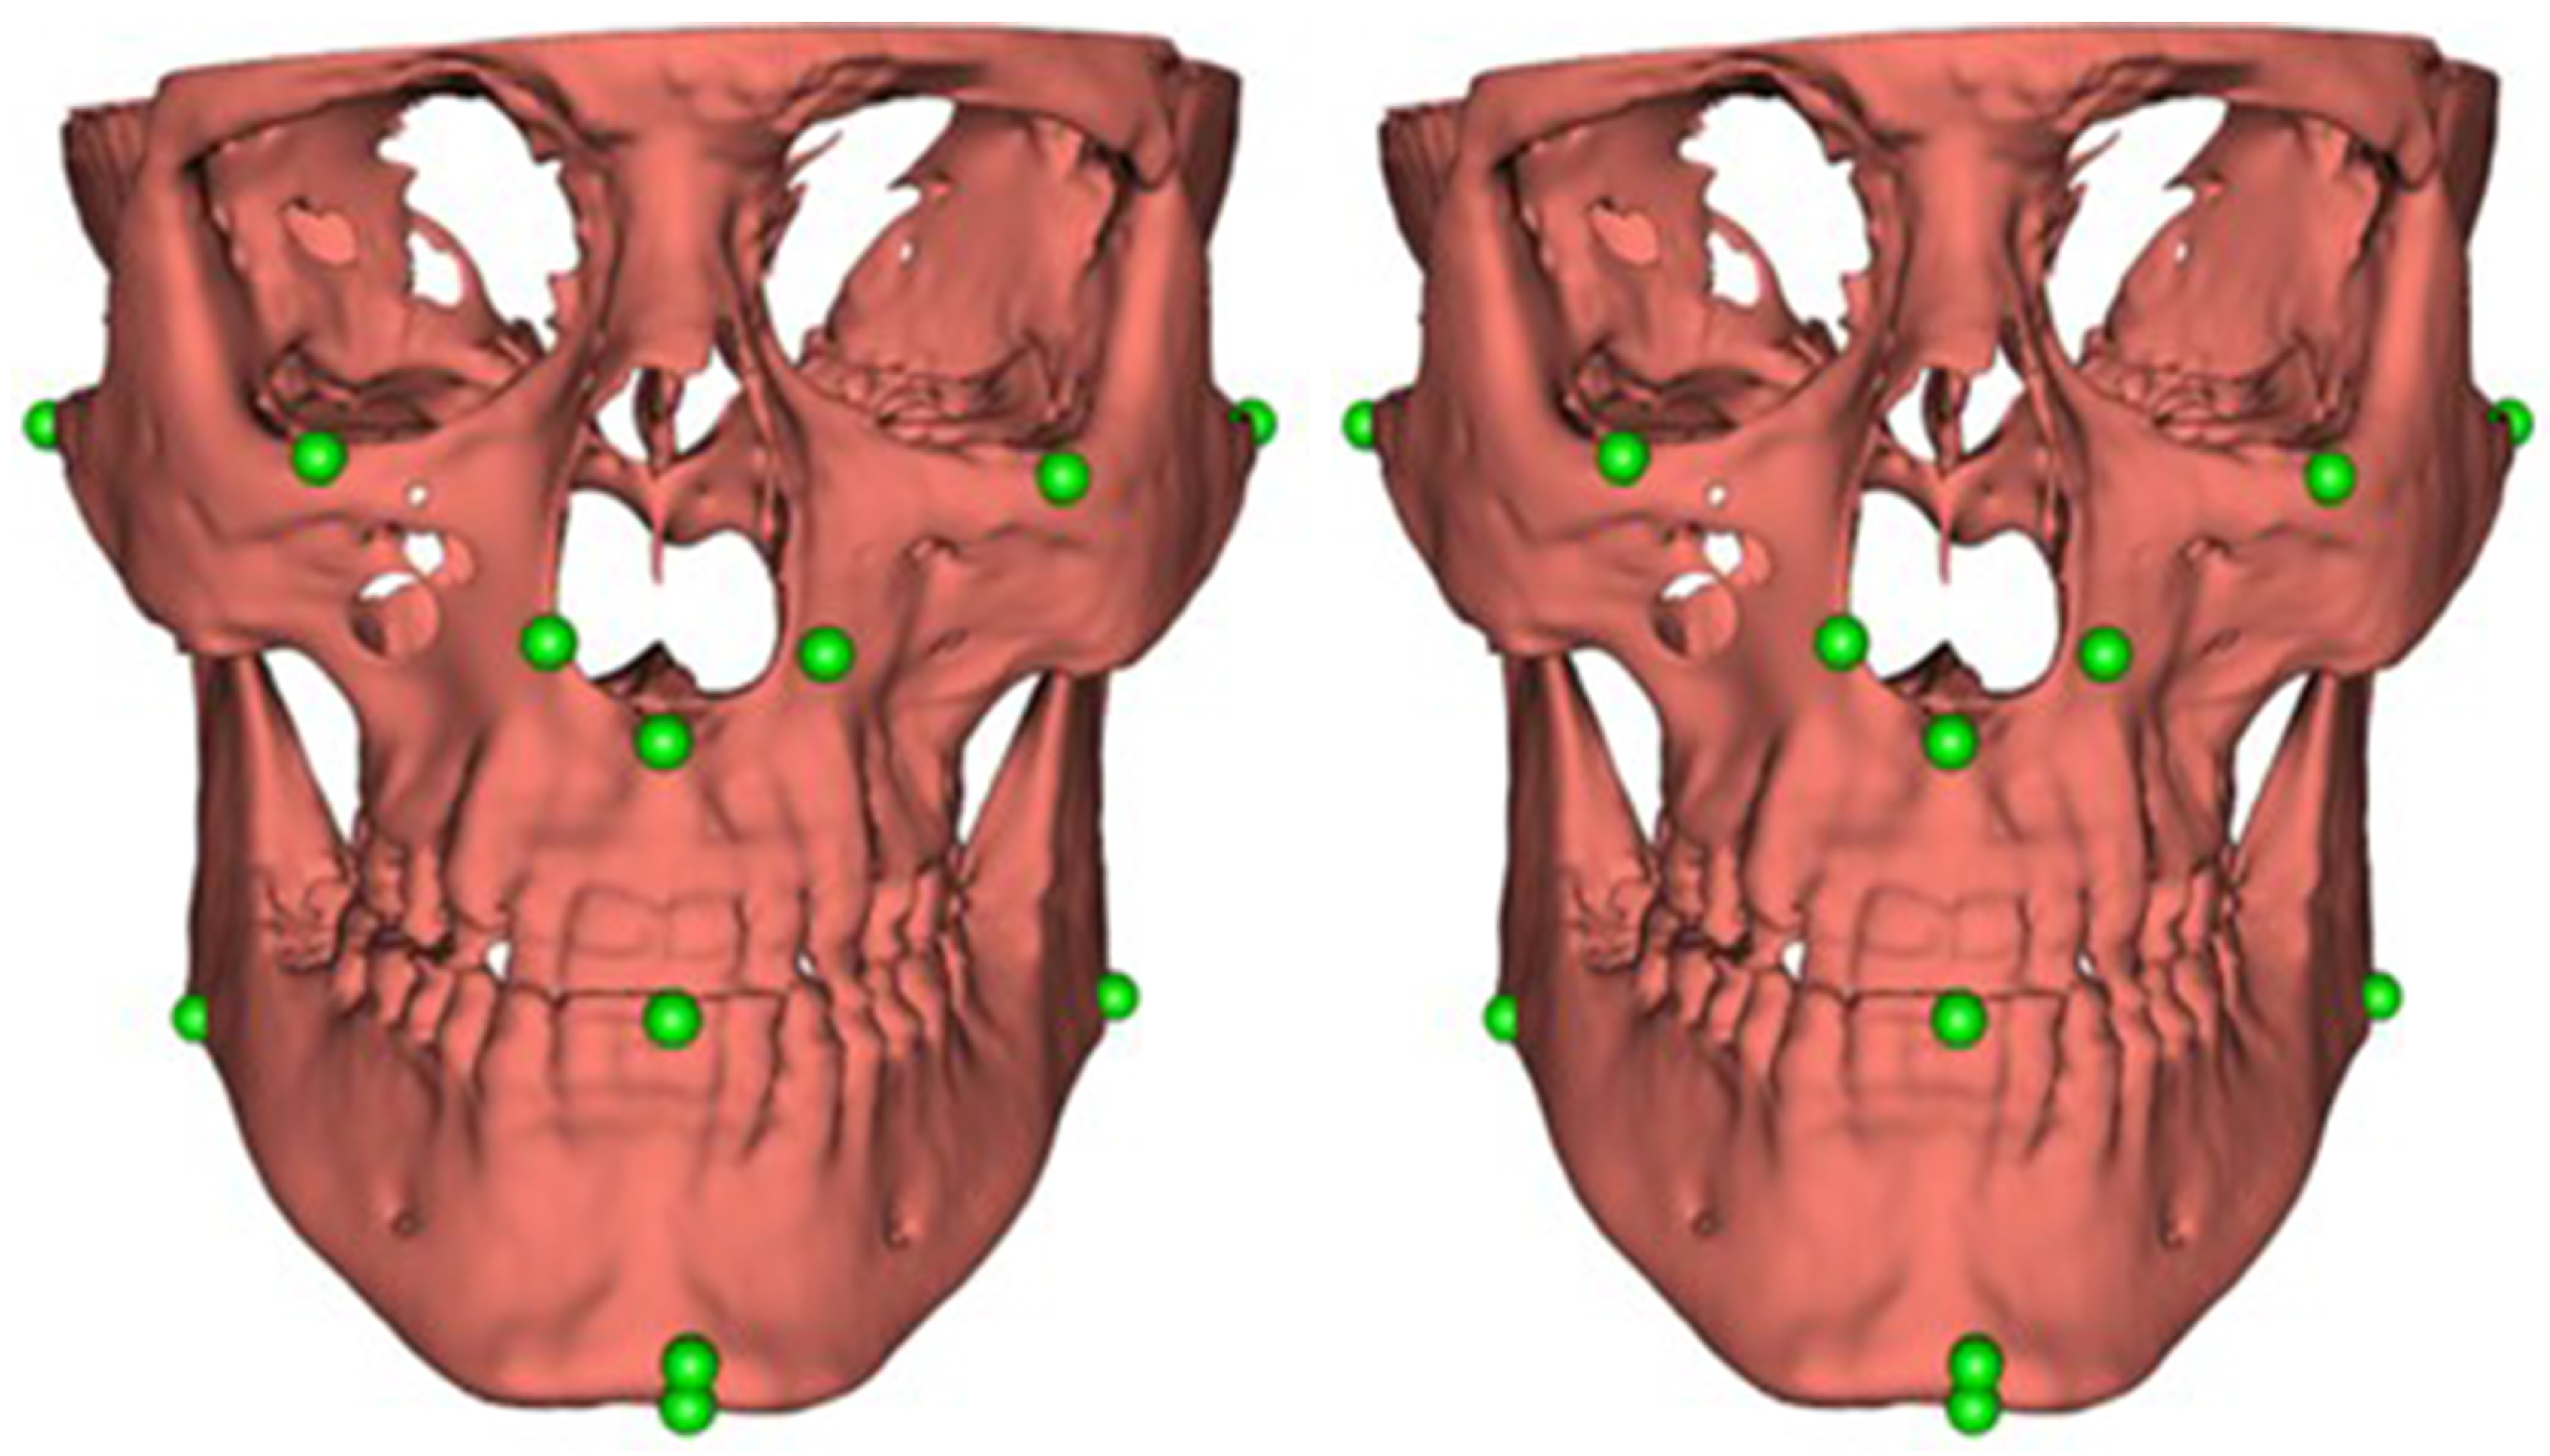
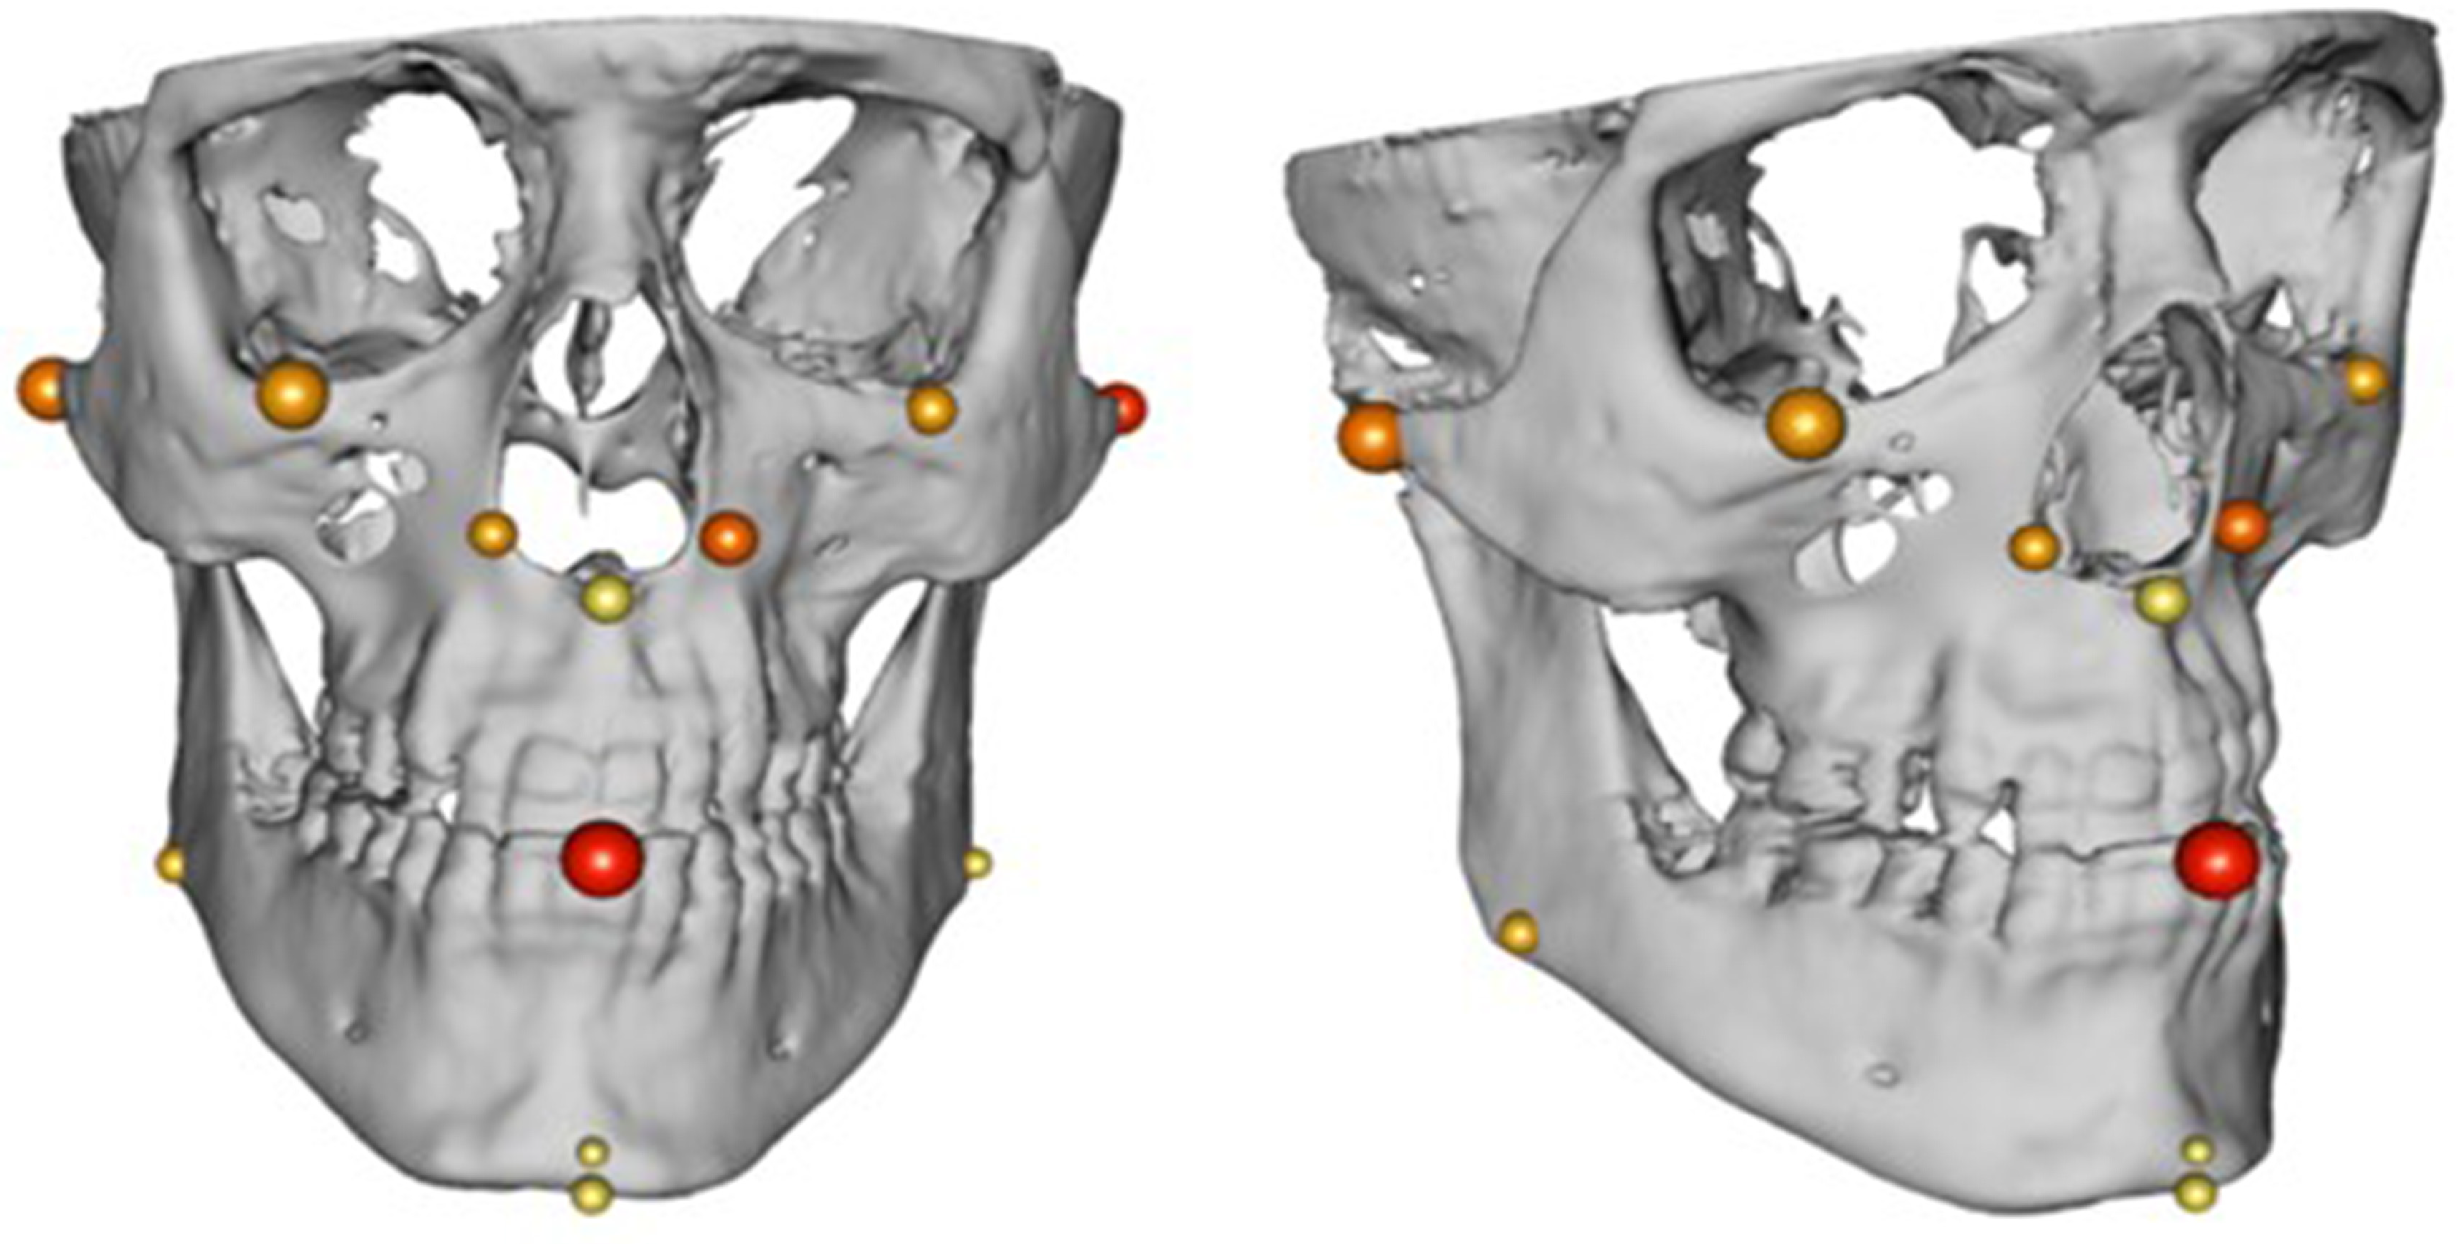
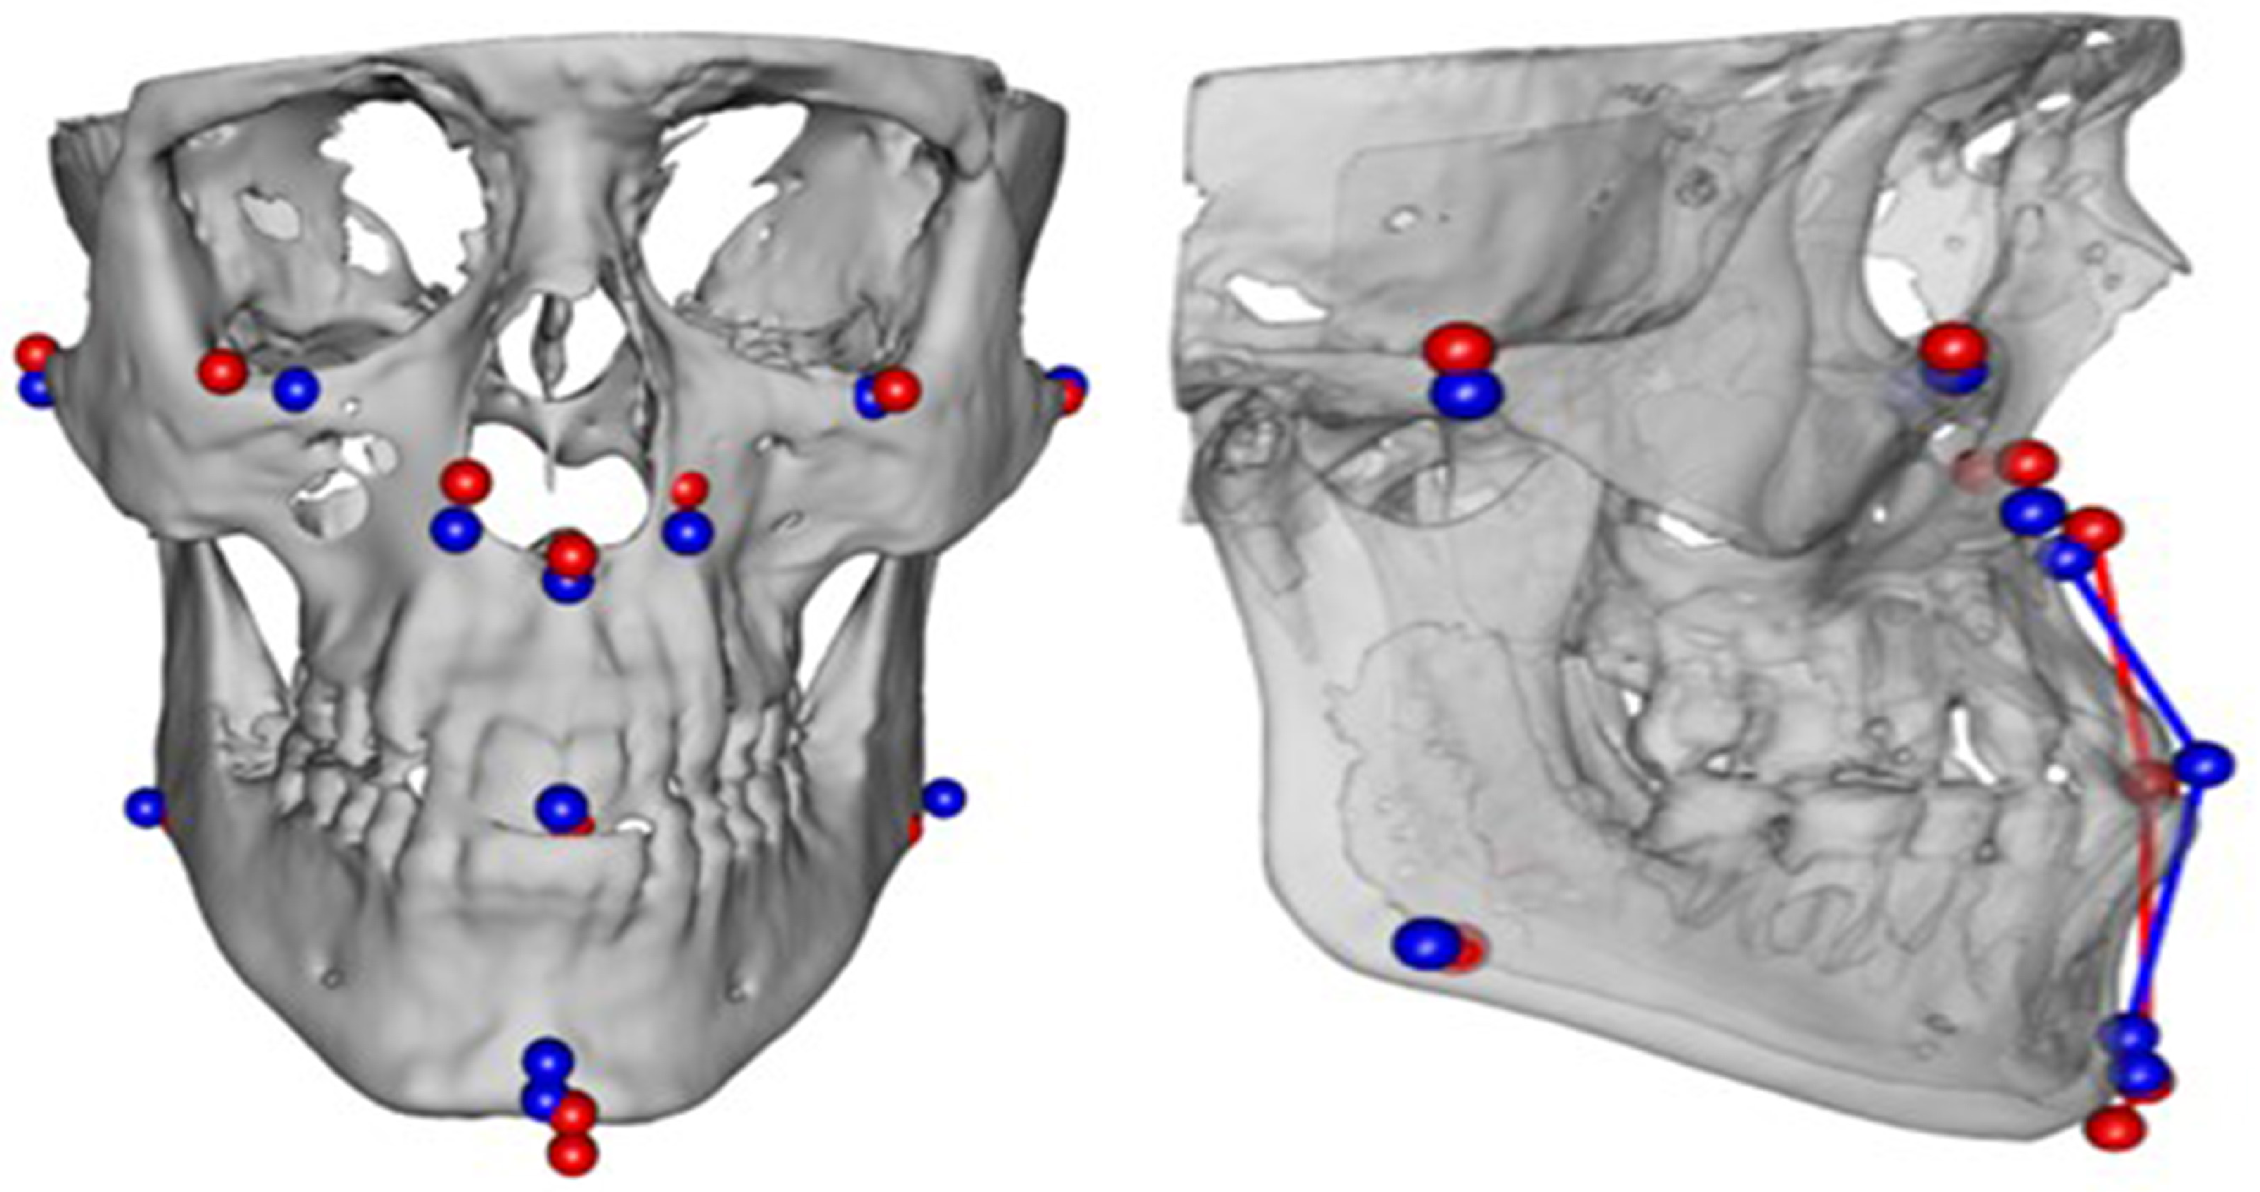
  • collecting discrete feature points on 3D cranial models,
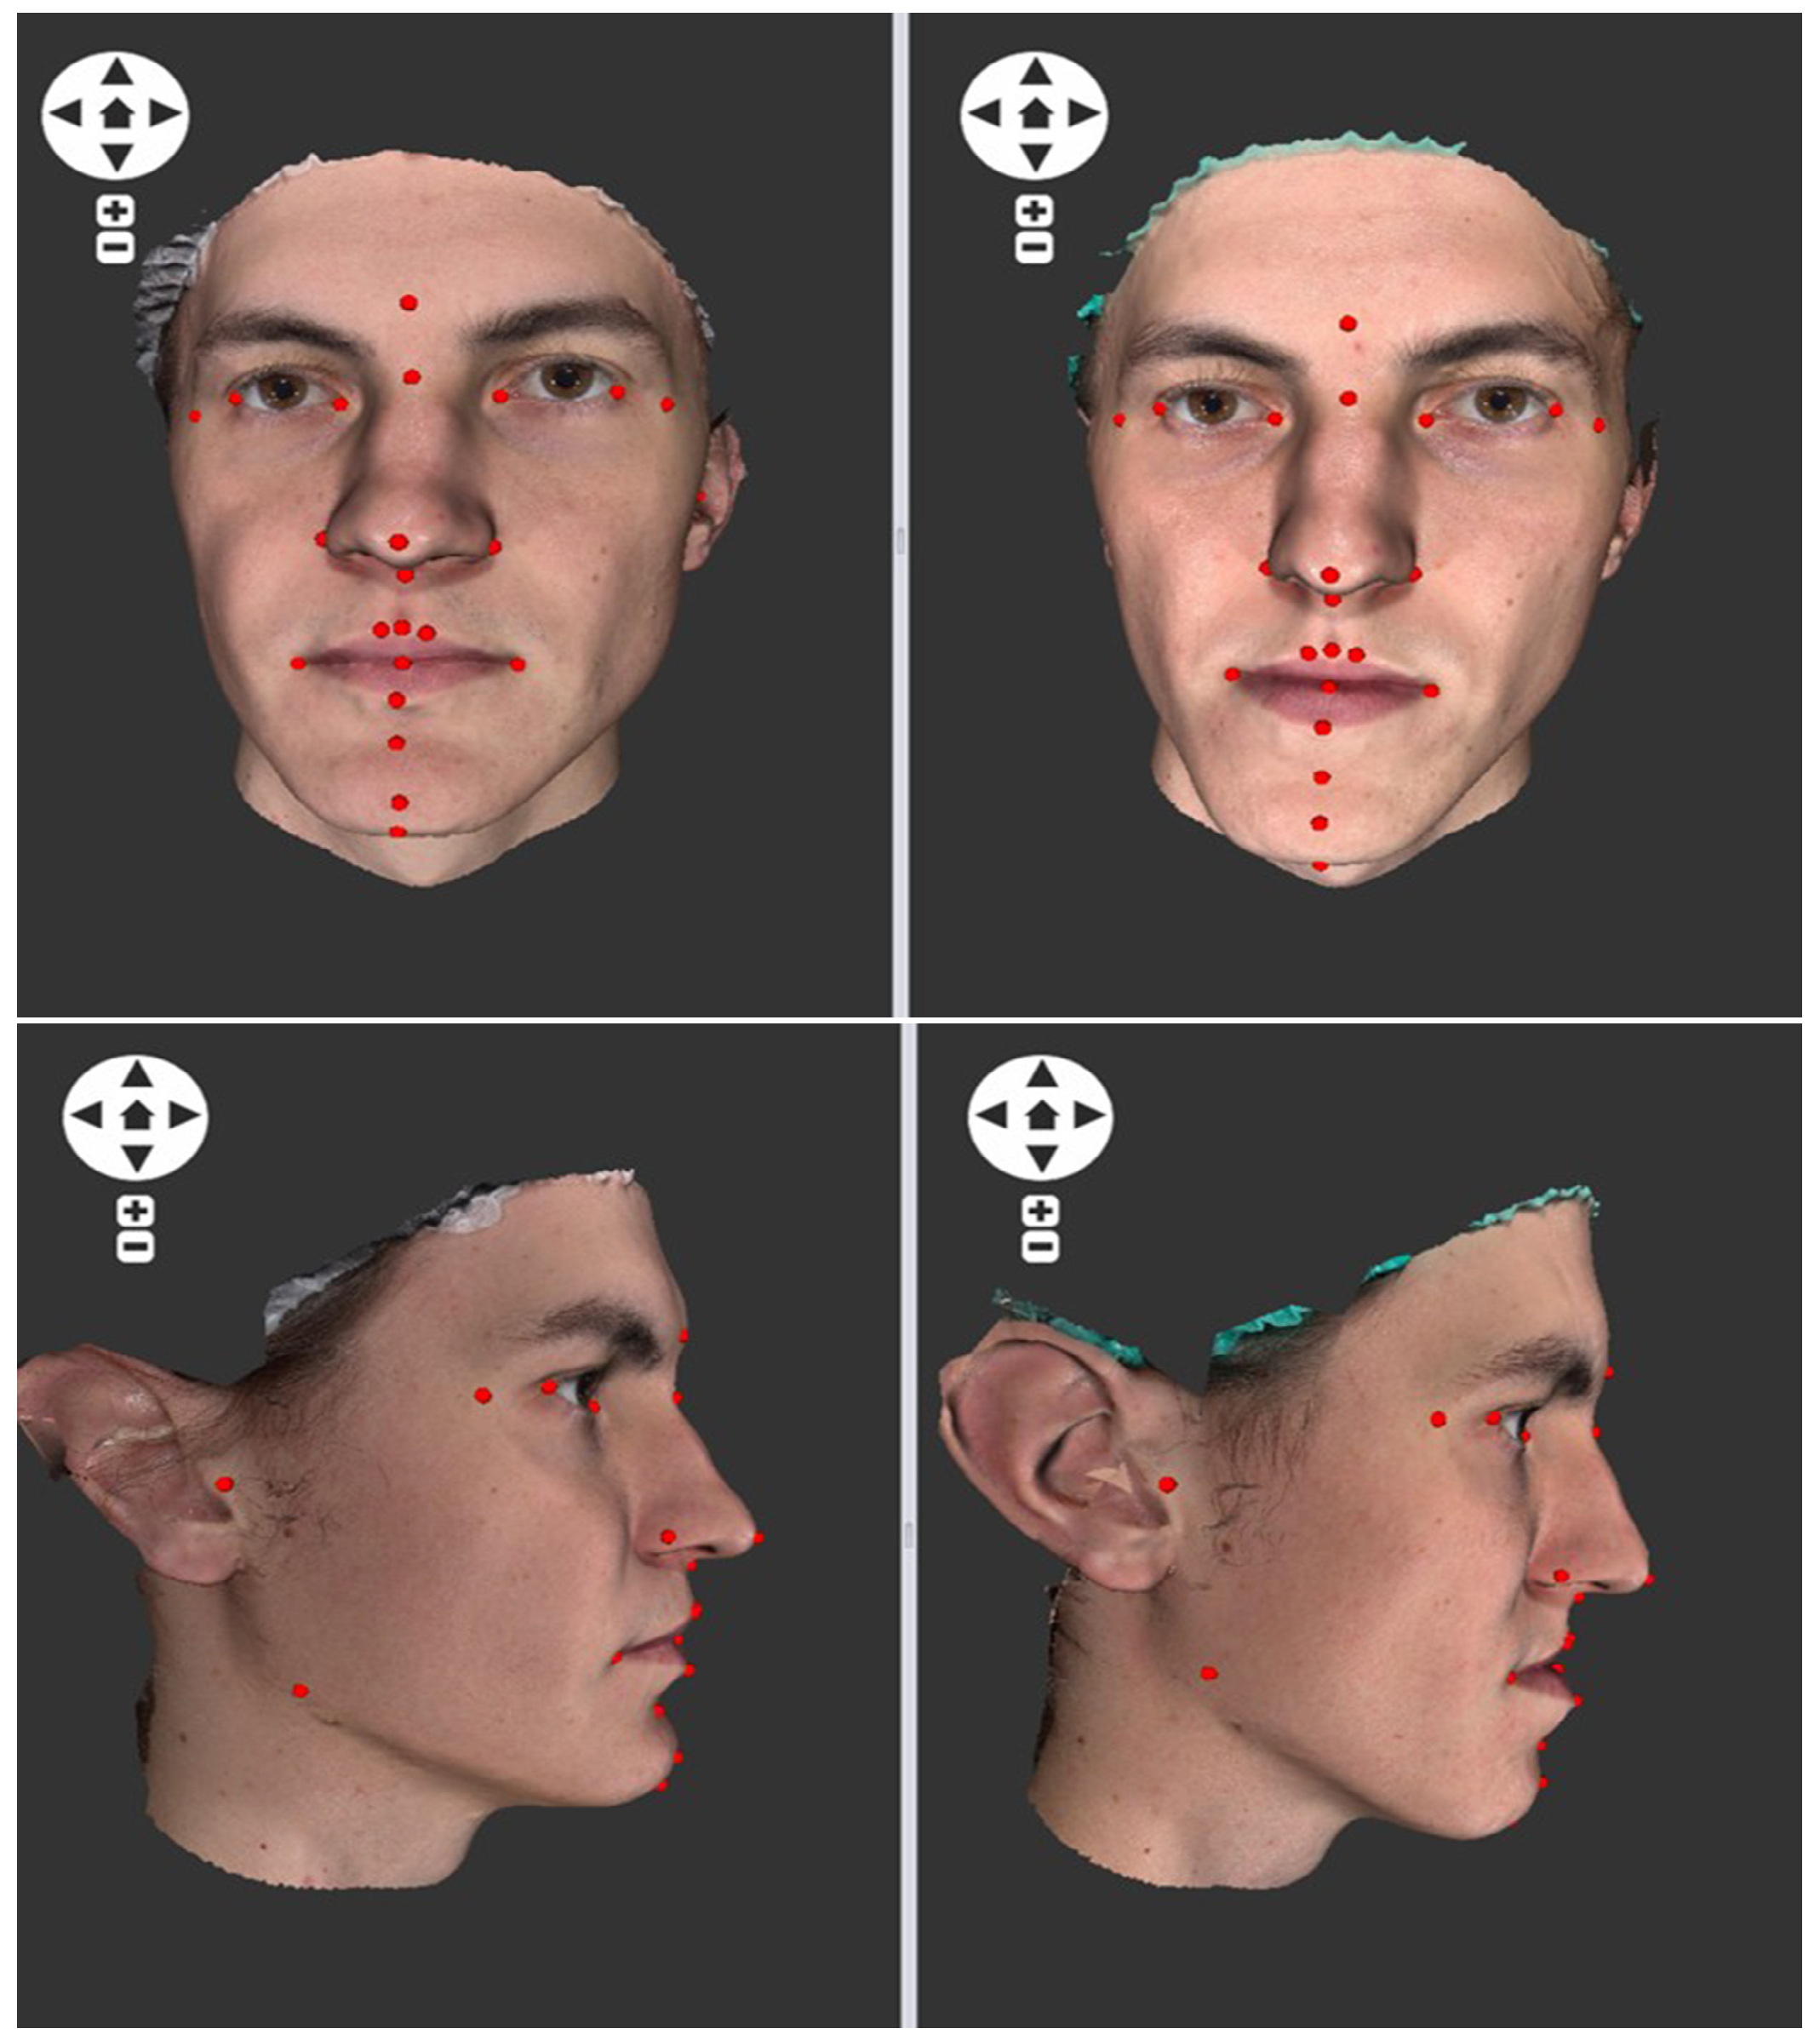
  • using surface face models and discrete feature points collected on 3D face models.
Our study focused on adult orthodontic patients, both male and female. A 3D treatment plan was prepared for each participant, with surgical intervention as a core component of the therapy. Inclusion criteria included planned therapy, surgical intervention, comparison with a diagnostic standard, and desired outcomes (PICO). The study aimed to contribute to a methodology that can enhance quality of life and facial aesthetic appearance.
The initial set of patients included 45 individuals, selected based on age, general health condition, orthodontic defects, and surgery types. This set was later reduced to 30 individuals from whom 3D scans of both soft and hard facial tissues were obtained. Analyses of these scans included: (i) surgically altered cranial metrics, (ii) hard tissue landmark assessment, and (iii) soft tissue surface and landmark matching. No facial soft tissue scans were available for 15 patients in the first group, which was closely related to upper and lower jaw therapy, leading to their exclusion from this part of the study.
The surgically altered cranial metrics in the first part of the study consisted of 45 individuals who had undergone corrective surgery of the upper and lower jaw. Two medical imaging data sets were available for each patient, obtained by cone beam computed tomography (CBCT). The sample consisted of 19 women and 26 men. The mean age at the start of treatment was 22.21 years (females: 22.31, males: 22.13). The mean age after surgery was 23.01 years. The mean time between data sets was 0.85 years (approximately 10 months), ranging from 4.5 months to 2 years and 11 months. According to a Mann–Whitney test, no statistically significant differences in age or time interval were found between males and females at the 5% significance level.
For each image dataset, a set of 14 linear measurements were taken using the functionalities available in the Anatomage Invivo software (Figure 1). Eight of these measurements were bilateral (comprising four pairs), while the remaining six were unilateral. The differences between the preoperative ( P R E ) and postoperative ( P O S T ) data were analyzed using univariate statistical tests, both unpaired and paired. In addition, identical tests were performed separately for males and females. Furthermore, the signed relative preoperative to postoperative differences P P D were calculated using the formula:
P P D = ( P O S T P R E ) / m e a n ( P O S T , P R E ) × 100
These differences were evaluated using t-tests and Mann–Whitney tests concerning biological sex, the time interval between image datasets, and patient age at baseline. Finally, the overall differences were analyzed by multivariate analysis of variance with biological sex and time interval as factors. For bilateral linear distances, side differences were assessed using both unpaired and paired tests. Within-group variations according to biological sex and preoperative and postoperative status were also examined.
The landmark-based comparison of hard tissues in the second part of the study consisted of 30 individuals who had undergone corrective surgery of the upper and lower jaw as in the previous case. Two medical imaging data sets were available for each patient, obtained by cone beam computed tomography (CBCT). The sample consisted of 11 females and 19 males. The mean age at the start of treatment was 23.30 years—25.30 years for women and 22.14 years for men. A Mann–Whitney test showed no statistically significant differences in age or time interval between men and women at the 5% significance level.
For all participants, facial geometry was recorded using CBCT protocol. For each CBCT dataset, a set of 12 landmarks (or dx/sin, zy dx/sin, go dx/sin, al dx/sin, na, inc, pg, gn) was manually collected using the functionalities available in the Anatomage Invivo software (Figure 2). The entire dataset was first registered using partial Procrustes analysis, an alternative to generalized Procrustes analysis that standardizes the variation in position and rotation while preserving the variation in size. Once registered, the dataset was analyzed for differences between the preoperative and postoperative groups using one-way PERMANOVA. In addition, the centroid size was extracted from the coordinates and compared between the preoperative and postoperative sets using both a paired Wilcox test and an unpaired Mann–Whitney test.
In the second step, the postoperative point configuration was fitted to the preoperative configuration using Ordinary Procrustes Analysis (OPA), which preserves the size variation. OPA involves the superimposition of two sets of points (as opposed to generalized Procrustes analysis, which typically involves three or more sets of points). The Procrustes distance was then calculated between the pairs of registered coordinates and was analyzed for differences based on the biological sex and age of the patient. In addition, Procrustes residuals were computed pairwise, tested for sex and age differences, and plotted on a mean point configuration to illustrate the magnitude and variance of changes associated with maxillofacial surgery.
Surface and landmark-based comparison of soft tissues in the third part of the study was used on 30 patients (the same as in the second part of this study) from the Department of Stomatology, Second Medical Faculty, with a mean age of 23.57 years, resulting in a total of 60 facial scans. Each patient was scanned using the Vectra M3 3D non-invasive, ambient light-based scanner (Canfield Scientific Inc., Fairfield, NJ, USA). All individuals were scanned from the front and were instructed to maintain a neutral facial expression throughout the process. Raw data were processed using Mirror PhotoTools software, version 7.4 (Canfield Scientific Inc.), which generated a surface model represented as a mesh of several hundred thousand triangles. All images were taken with the patients in their natural upright head position to ensure that the Frankfort plane was parallel to the floor.
A set of 26 features was manually collected for each facial model (Figure 3). For each surgical patient, a pair of preoperative and postoperative 3D facial models were directly compared. Initially, the postoperative 3D model was designated as the primary (reference) model, while the preoperative model was designated as the secondary (comparison) model. Iterative closest point (ICP) registration was then performed to align the secondary model to the primary model, preserving the size differences. The closest point distances were then calculated for each vertex of the primary model. Statistical descriptors, including root mean square (RMS) and 75th percentile (PERC75), were extracted and used as measures of deviation. These distances were visualized using color-coded deviation maps.
In the next stage, the postoperative point configuration was aligned with the preoperative configuration using ordinary Procrustes analysis, while maintaining the size variation. The Procrustes distance was then calculated between the pairs of registered coordinates as a measure of morphological dissimilarity.

3. Results

3.1. Cranial Metrics Altered by Surgery

Descriptive statistics for each measurement are shown in Table 1. When tested with an unpaired t-test, no statistically significant differences were observed between the preoperative and postoperative measurements. However, when tested in a pairwise manner, only 2 of the 14 measurements, mandibular width and facial width, showed statistically significant results (Table 1). When analyzed separately for males and females, statistically significant results were observed only for mandibular width. The use of parametric/non-parametric and paired/non-paired statistical text confirmed the optimal evaluation of the acquired data. The cranial metric on the 3D skull models, landmark configuration on the skull, and facial models were received. All data were subjected to a comparative analysis before and following the intervention, with individuals of varying age and gender.
The side differences were then analyzed and no differences were found for the bilateral measurements when tested with the paired t-test, except for the distance between the mandibular notch (inc) and gonion (go) points, where the right measurement was on average greater than the left. These results were also consistent for the preoperative and postoperative data sets when tested separately. Similarly, both females and males showed identical side asymmetry in the postoperative images. In females, there was no asymmetry in the preoperative images. In contrast, in males, two measurements (mx-subsp and inc-go) showed statistically significant side differences. The side differences between the bilateral measurements are shown in Table 2.
Post to preoperative differences were then examined, and for the signed measurements, none of the linear measurements showed statistically significant variations between males and females at a 5% level of significance (Table 2). However, at the 10% level of significance, variations were observed in the distance between the stomion and pogonion points. Conversely, for absolute differences, the B-pog measurement showed statistically significant differences between males and females at the 5% level of significance. In addition, three other measurements showed differences at the 10% level of significance. The post-pre differences between the linear measures are presented in Table 3.

3.2. Landmark-Based Hard Tissue Comparison

The mean difference in centroid size between the preoperative and postoperative point configurations was −1.09, indicating a reduction in size due to surgery. The maximum difference was 12.5 and the minimum was −12.8. A Wilcox test showed no statistically significant differences between pairs of size measures (p-value = 0.191), nor did the Mann–Whitney test (p-value = 0.728). In contrast, sex-related differences were found to be significant (Mann–Whitney, p-value = 0.0001), as was an age-related correlation, indicating a negative relationship between size and patient age (Spearman’s rho = −0.329, p-value = 0.01).
When the pooled data set was registered and analysed using one-way PERMANOVA, no statistically significant differences were found between the preoperative and postoperative groups (overall sum of squares: 2.941 × 10⁴, within-group sum of squares: 2.904 × 10⁴, F = 0.7419, p-value = 0.652). Similarly, testing for gender differences also revealed statistically significant differences (one-way PERMANOVA, overall sum of squares: 2.941 × 10⁴, within-group sum of squares: 2.448 × 10⁴, F = 11.69, p-value = 0.0001).
Pairwise comparisons showed that Procrustes distances ranged from 0.022 to 0.168, with an average of 0.093 (Table 4). Although the median values suggested that females had greater differences between preoperative and postoperative configurations, the Mann–Whitney test did not confirm this finding. Similarly, no age-related correlation was observed (Spearman’s rho = 0.12, p-value = 0.523). The most significant differences between preoperative and postoperative skulls were mainly distributed among the midfacial points, with the greatest variance observed at the upper incisor. Figure 4 further details the relocation of the points after surgery.
Descriptive statistics for the Procrustes residuals at each feature point are presented in Table 5, with visual representations in Figure 4. The most significant deviations from the preoperative cranial configuration are observed at the stomion point, which is located at the midpoint between the maxilla and the mandible. This area also showed the greatest variance in the Procrustes residuals, indicating a substantial range of spatial displacement. The mean point displacement is shown in Figure 5.
Figure 4 shows the Procrustes residuals between pairs of preoperative and postoperative skull configurations for each tested point. The size of each point reflects the average value of the residuals at that point, and the colour represents the variance of the residuals relative to the maximum value observed. Figure 5 illustrates the differences between the average preoperative point configuration (shown in red) and the postoperative configuration (shown in blue), with the differences magnified by a factor of five.

3.3. Surface and Landmark-Based Soft Tissue Comparison

The mean differences between the preoperative and postoperative 3D facial models for the sample studied were 1.81 and 1.93, based on the RMS and PERC75 metrics, respectively. The Mann–Whitney U test revealed statistically significant differences between male and female patients, with the males showing greater preoperative and postoperative deviations than females (RMS: U = 2.282, p-value = 0.022; PERC75: U = 2.010, p-value = 0.036). Although not statistically significant, there was a trend of decreasing deviation with patient age at preoperative examination.
These findings were corroborated by landmark-based analysis, which showed that the Procrustes distances averaged 18.86, with males having larger values than females (see Table 6). Figure 6 shows the preoperative and postoperative situations and Figure 7 shows the differences between the average preoperative and postoperative point configurations.

4. Discussion

CBCT is a precise imaging technique that provides a three-dimensional analysis of head and neck anatomy to assist clinicians in the planning of maxillofacial and orthognathic surgery, as well as postoperative assessment [7,8]. CBCT provides clinicians with multi-planar views of the skull, facilitating more accurate treatment planning, diagnosis and therapy while minimising X-ray radiation exposure compared to traditional computed tomography [3,8].
In this study, we used CBCT to identify changes associated with maxillofacial surgery. Our research highlighted that data derived from 3D CBCT scans, including measurements and spatial points, can overcome the limitations of data obtained from 2D orthopantomogram (OPG) images, such as lack of depth, real-world scale, and perspective distortion [3,8,27]. This is consistent with a retrospective pilot study that supported the replacement of two-dimensional analysis with three-dimensional methods in orthognathic surgery planning [11,18]. We have shown that CBCT scans are compatible with both basic measurements and more sophisticated exploration and analysis methods, such as surface-based and landmark-based data processing.
Our manuscript confirms the fact that oral and maxillofacial surgery (OMFS) can transform the current concepts of reconstruction and rehabilitation of maxillofacial defects using Artificial Intelligence (AI) by providing various 3D techniques that can improve the accuracy, efficiency, and outcomes of surgical procedures [28]. Computer-aided design and computer-aided manufacturing (CAD/CAM) uses three-dimensional (3D) CBCT and facial scans not only for treatment planning, but also for precise reconstruction of maxillofacial defects. All 3D systems were responsible for more precise function and aesthetics of the therapy [29].
The results of our manuscript also demonstrated quantitative and qualitative differences in the power of each methodological approach. The initial study using cranial linear distances revealed significant postoperative changes, particularly an increase in mandibular width (go dx-go sin measurement). The subsequent landmark-based approach, while confirming this increase, effectively depicted both numerical and visual changes in the configuration of the maxilla and mandible.
The third study design focused on exploring 3D facial scans using landmark-based and surface-based approaches. Unlike the complex 3D cranial data, 3D facial scans, which take the form of an open-ended digital shell, are easier to process as polygonal models or point clouds. The surface-based approach allows postoperative changes to be investigated independently of preoperatively selected feature points or linear distances. This allows practitioners the freedom to examine changes without bias, and to view them both numerically and visually. For example, this approach has shown how regions such as the chin, cheeks, and nasal area have been affected by surgery and postoperative treatment.
The results in Table 1, Table 2, Table 3, Table 4, Table 5 and Table 6 confirm our new clinical strategy based on 3D planning and treatment for the precision, optimal control, and prediction of treatment outcomes. For all interventions, we propose 3D treatment planning, which is much more precise than 2D imaging, following the guidelines of the American Dental Association (ADA). Techniques and technologies are repeatable in orthodontic and maxillofacial treatment, but the individual approach for each patient is necessary.

5. Conclusions

It is well known that there is currently a great deal of progress in three-dimensional (3D) technologies in the field of medicine. Methods such as model surgery or cephalometric prediction methods (2D prediction) including video imaging are considered gold standards in orthognathic surgery. Although these techniques are a routine part of the diagnostic and treatment planning process, they have their limitations. The 3D environment adds the third dimension to planning, bringing planning closer to reality and providing us more information to diagnose a wider range of dentofacial anomalies.
Our results showed differences between male and female patients, both in the overall configuration of points and in individual measurements, including anterior mandibular height with pogonion as one of the measurement endpoints. Average differences were also evident in the facial scans. This correlation between hard tissue and overlying soft tissue suggests that soft tissue does not necessarily compensate for underlying structural changes. It is important to note that our research design did not specifically examine the relationship between hard and soft tissues in the same context, although there was considerable overlap between the three datasets. The presence of sex-related differences may have implications for surgical planning and postoperative management, but our small sample size requires further investigation.
Future studies should be devoted to more detailed data analysis, the application of computational intelligence to the processing of spatial models, and the application of the proposed methodology to larger numbers of patients and different types of surgical interventions. More detailed visualization of future positions of the soft and hard tissues of the face in 3D space and detailed monitoring of proposed results during future operations should form specific topics of further research.

Author Contributions

Conceptualization: T.D., H.E. and P.U.; methodology: A.P. and T.D.; software: P.U. and A.N.; validation: T.D.; formal analysis: T.D.; investigation: T.D., H.E. and P.U.; resources: P.U.; visualization: A.P. and T.D.; project administration: T.D. and P.U. All authors have read and agreed to the published version of the manuscript.

Funding

This research received no external funding.

Institutional Review Board Statement

The study was conducted in accordance with the Declaration of Helsinki, and approved by the Ethics Committee of of Charles University, 2nd Faculty of Medicine and the Motol University Hospital (IRB approval No. EK-973IGA 1.12/11, 23 July 2019).

Informed Consent Statement

Informed consent was obtained from all subjects involved in the study.

Data Availability Statement

The data presented in this study are available on request from the corresponding author.

Acknowledgments

The research was conducted under Project No. 00064203 (FN Motol), project No. MUNI/A/1597/2023 (Masaryk University), and Operational Programme Johannes Amos Comenius of the European Structural and Investment Funds and the Czech Ministry of Education, Youth and Sports (Project No. SENDISO-CZ.02.01.01/00/22_008/0004596).

Conflicts of Interest

The authors declare no conflicts of interest.

References

  1. Scarfe, W.; Azevedo, B.; Toghyani, S.; Farman, A. Cone Beam Computed Tomographic Imaging in Orthodontics. Aust. Dent. J. 2017, 62, 33–50. [Google Scholar] [CrossRef] [PubMed]
  2. Kapila, S.; Nervina, J. CBCT in orthodontics: Assessment of treatment outcomes and indications for its use. Dentomaxillofac. Radiol. 2015, 44, 20140282. [Google Scholar] [CrossRef]
  3. Flugge, T.; Derksen, W.; Te Poel, J.; Hassan, B.; Nelson, K.; Wismeijer, D. Registration of cone beam computed tomography data and intraoral surface scans—A prerequisite for guided implant surgery with CAD/CAM drilling guides. Clin. Oral Implants Res. 2017, 28, 1113–1118. [Google Scholar] [CrossRef]
  4. Nur, R.; Derya Germec Cakan, D.; Arun, T. Cone Beam Computed Tomography in Oral and Maxillofacial Surgery: An Evidence-Based Review. Am. J. Orthod. 2016, 149, 225–237. [Google Scholar] [CrossRef]
  5. Gráfová, L.; Kašparová, M.; Kakawand, S.; Procházka, A.; Dostálová, T. Study of Edge Detection Task in Dental Panoramic X-ray Images. Dentomaxillofac. Radiol. 2013, 42, 20120391. [Google Scholar] [CrossRef] [PubMed]
  6. Heinz, J.; Stewart, K.; Ghoneima, A. Evaluation of two-dimensional lateral cephalogram and three-dimensional cone beam computed tomography superimpositions: A comparative study. Int. J. Oral Maxillofac. Surg. 2018, 48, 519–529. [Google Scholar] [CrossRef]
  7. Kim, D.; Lagravere, M. Assessing the Correlation between Skeletal and Corresponding Soft-Tissue Equivalents to Determine the Relationship between CBCT Skeletal/Dental Dimensions and 3D Radiographic Soft-Tissue Equivalents. Int. J. Dent. 2018, 2018, 8926314. [Google Scholar] [CrossRef] [PubMed]
  8. Eliášová, H.; Dostálová, T.; Procházka, A.; Šedivá, E.; Horáček, M.; Urbanová, P.; Hlinakova, P. Comparison of 2D OPG Image versus Orthopantomogram from 3D CBCT from the Forensic Point of View. Leg. Med. 2021, 48, 101802. [Google Scholar] [CrossRef]
  9. Plooij, J.; Maal, T.; Haers, P.; Borstlap, W.; Kuijpers-Jagtman, A.; Berge, S. Digital three-dimensional image fusion processes for planning and evaluating orthodontics and orthognathic surgery: A systematic review. Int. J. Oral Maxillofac. Surg. 2011, 40, 341–352. [Google Scholar] [CrossRef]
  10. Jarnstedt, J.; Sahlsten, J.; Jaskari, J.; Kaski, K.; Mehtonen, H.; Hietanen, A.; Sundqvist, O.; Varjonen, V.; Mattila, V.; Prapayasatok, S.; et al. Reproducibility analysis of automated deep learning based localisation of mandibular canals on a temporal CBCT dataset. Sci. Rep. 2023, 13, 14159. [Google Scholar] [CrossRef]
  11. Baan, F.; de Waard, O.; Bruggink, R.; Xi, T.; Ongkosuwito, E.; Maal, T. Virtual setup in orthodontics: Planning and evaluation. Clin. Oral Investig. 2020, 24, 2385–2393. [Google Scholar] [CrossRef] [PubMed]
  12. Verykokou, S.; Ioannidis, C.; Angelopoulos, C. Evaluation of 3D Modeling Workflows Using Dental CBCT Data for Periodontal Regenerative Treatment. Pers. Med. 2022, 12, 1355. [Google Scholar] [CrossRef] [PubMed]
  13. Gupta, A.; Kharbanda, O.; Balachandran, R.; Sardana, V.; Kalra, S.; Chaurasia, S.; Sardana, H. Precision of manual landmark identification between as-received and oriented volume-rendered cone-beam computed tomography images. Am. J. Orthod. Dentofac. Orthop. 2017, 151, 118–131. [Google Scholar] [CrossRef] [PubMed]
  14. Weiss, R.; Read-Fuller, A. Cone Beam Computed Tomography in Oral and Maxillofacial Surgery: An Evidence-Based Review. Dent. J. 2019, 7, 52. [Google Scholar] [CrossRef] [PubMed]
  15. Bookstein, F. Foundations of morphometrics. Annu. Rev. Ecol. Syst. 1982, 13, 451–470. [Google Scholar] [CrossRef]
  16. Li, J.; Wu, S.; Mei, L.; Wen, J.; Marra, J.; Lei, L.; Li, H. Facial asymmetry of the hard and soft tissues in skeletal Class I, II, and III patients. Sci. Rep. 2024, 14, 4966. [Google Scholar] [CrossRef] [PubMed]
  17. Nahm, K.; Kim, Y.; Choi, Y.; Lee, J.; Kim, S.; Nelson, G. Accurate registration of cone-beam computed tomography scans to 3-dimensional facial photographs. Am. J. Orthod. Dentofac. Orthop. 2014, 145, 256–264. [Google Scholar] [CrossRef]
  18. Resnick, C.; Dang, R.; Glick, S.J. Padwa, B. Accuracy of three-dimensional soft tissue prediction for Le Fort I osteotomy using Dolphin 3D software: A pilot study. Int. J. Oral Maxillofac. Surg. 2017, 46, 289–295. [Google Scholar] [CrossRef] [PubMed]
  19. Ross, A.; Williams, S. Testing repeatability and error of coordinate cranial landmark data acquired from skulls. J. Forensic Sci. 2008, 53, 782–785. [Google Scholar] [CrossRef]
  20. Mukhia, N.; Birur, N.; Shubhasini, A.; Shubha, G.; Keerthi, G. Dimensional measurement accuracy of 3-dimensional models from cone beam computed tomography using different voxel sizes. Oral Surg. Oral Med. Oral Pathol. Oral Radiol. 2021, 132, 361–369. [Google Scholar] [CrossRef]
  21. Tanna, N.; AlMuzaini, A.; Mupparapu, M. Imaging in Orthodontics. Dent. Clin. N. Am. 2021, 65, 623–641. [Google Scholar] [CrossRef] [PubMed]
  22. Elshebiny, T.; Bous, R.; Withana, T.; Morcos, S.; Valiathan, M. Accuracy of Three-Dimensional Upper Airway Prediction in Orthognathic Patients Using Dolphin Three-Dimensional Software. J. Craniofac. Surg. 2020, 31, 1098–1100. [Google Scholar] [CrossRef] [PubMed]
  23. Dahiya, N.; Alam, S.; Zhang, P.; Zhang, S.; Li, T.; Yezzi, A.; Nadeem, S. Multitask 3D CBCT-to-CT translation and organs-at-risk segmentation using physics-based data augmentation. Med Phys. 2021, 48, 5130–5141. [Google Scholar] [CrossRef] [PubMed]
  24. Park, J.; Lee, G.; Moon, D.; Yun, K.; Kim, J.; Lee, K. Creation of Digital Virtual Patient by Integrating CBCT, Intraoral Scan, 3D Facial Scan: An Approach to Methodology for Integration Accuracy. J. Craniofacial Surg. 2022, 33, e396–e398. [Google Scholar] [CrossRef] [PubMed]
  25. Procházka, A.; Vyšata, O.; Mařík, V. Integrating the Role of Computational Intelligence and Digital Signal Processing in Education. IEEE Signal Process. Mag. 2021, 38, 154–162. [Google Scholar] [CrossRef]
  26. Bora, P.; Agrawal, P.; Bagga, D.; Tiwari, S.; Singh, A. Applications of Cone Beam Computed Tomography in Orthodontics: An Overview. Biosci. Biotechnol. Res. Comm. 2021, 13, 168–172. [Google Scholar] [CrossRef]
  27. van Bakelen, N.; van der Graaf, J.; Kraeima, J.; Spijkervet, F. Reproducibility of 2D and 3D Ramus Height Measurements in Facial Asymmetry. J. Pers. Med. 2022, 12, 1181. [Google Scholar] [CrossRef] [PubMed]
  28. Balaji, S. Maxillofacial Surgery and Artificial Intelligence. Ann. Maxillofac. Surg. 2023, 13, 1–2. [Google Scholar] [CrossRef]
  29. Rasteau, S.; Ernenwein, D.; Savoldelli, C.; Bouletreau, P. Artificial intelligence for oral and maxillo-facial surgery: A narrative review. J. Stomatol. Oral Maxillofac. Surg. 2022, 123, 276–282. [Google Scholar] [CrossRef]
Figure 1. Preoperative and postoperative en face and profile measurements.
Applsci 14 04829 g001
Figure 2. The tested configuration of 12 landmarks (green color points: or dx/sin, zy dx/sin, go dx/sin, al dx/sin, na, inc, pg, gn) manually collected by the Anatomage Invivo software.
Applsci 14 04829 g002
Figure 3. The tested configuration of manually collected points (in red color) used for each facial model.
Applsci 14 04829 g003
Figure 4. Procrustes residuals between pairs of pre-operative and post-operative cranial configurations for each tested point where the size of each point reflects the average value of residuals and the color represents the variance of residuals relative to the maximum value observed (from light yellow through orange to red).
Applsci 14 04829 g004
Figure 5. Differences between average preoperative (red colour) and postoperative (blue colour) point configuration magnified by 5.
Applsci 14 04829 g005
Figure 6. Blue mesh—postoperative average, yellow mesh—preoperative average.
Applsci 14 04829 g006
Figure 7. Differences between average preoperative and postoperative point configurations.
Applsci 14 04829 g007
Table 1. Descriptive statistics for preoperative and postoperative cranial measurements.
MeasurementDatasetNMEANSTDMINMAXtp-Value
MEAN Females Males
zy dx-sinpre436.8066.806105.6135.6
zy dx-sinpost43124.6306.339107134.7−0.8000.4290.2020.734
mx dx-mx sinpre4360.3704.3094969.4
mx dx-mx sinpost4460.6024.94650.274.6−0.4840.6310.9030.443
go dx-go sinpre4495.3846.91384.5109.8
go dx-go sinpost4497.3117.21579.1112.1−3.9350.0010.0330.004
zy dx-subsppre381.5515.59170.192.8
zy dx-subsppost4382.5355.29068.890.8−1.2230.2280.3510.447
zy sin-subsppre4380.3406.98359.492.1
zy sin-subsppost4382.1845.45369.192.8−2.1300.0390.2870.083
mx dx-subsppre4338.2603.34431.744.4
mx dx-subsppost4437.8144.36730.348.40.8470.4020.3060.809
mx sin-subsppre4338.7934.09930.246.2
mx sin-subsppost4438.2003.51631.145.81.2100.2330.8220.202
go dx-pogpre4478.4457.55061.392.9
go dx-pogpost4378.9427.3556292.9−0.5240.6030.3390.915
go sin-pogpre4478.5327.81858.892.9
go sin-pogpost4379.5747.34460.990.9−1.5550.1270.4240.203
inc dx-go dxpre4443.0806.6203265.1
inc dx-go dxpost4442.6274.91736.153.70.6710.5060.6370.197
inc sin-go sinpre4441.5095.8803461.4
inc sin-go sinpost4441.0414.48434.449.60.7680.4470.4550.169
subsp-pogpre2966.9075.60957.275.3
subsp-pogpost2765.3007.86639.677.31.2710.2150.6220.266
sto-pogpre2942.79016.58733.7102
sto-pogpost2737.6484.55722.546.81.7420.0930.430.085
B-pogpre2820.9292.54413.625.6
B-pogpost2520.6162.82815.725.30.4860.6310.9270.297
Table 2. Lateral difference between the bilateral measurements.
NMEANSTDtpp-prep-postp-female p-male
pre post pre post
zy dx-subsp 81.8915.464
zy sin-subsp8881.1366.2801.4970.1380.6460.1240.0570.082 0.7130.436
mx dx-subsp 38.0193.836
mx sin-subsp8938.4583.769−0.9830.3280.5940.3960.2490.627 0.0350.244
go dx-pog 78.6537.337
go sin-pog8979.0227.478−0.6390.5250.4790.9280.4620.468 0.3980.108
inc dx-go dx 42.6505.897
inc sin-go sin9041.0705.3304.4420.0000.0010.0060.1350.014 0.0220.020
Table 3. Signed post-to-preoperative differences between the linear measurements.
Signed Post-to-Preoperative Differences Absolute Post-to-Pre Operative Differences
MEAN Sth Z p -Value   MEAN Sth Z p -Value
zy dx-sin0.2562.0420.8710.384 1.3641.528−0.7940.427
mx dx-sin0.1643.148−0.8000.424 2.1482.2840.0620.951
go dx-go sin1.9833.394−0.3100.756 3.0792.417−0.2860.775
zy dx-subsp0.8924.7520.0001.000 3.5453.2440.0770.939
zy sin-subsp2.2756.7970.1790.858 5.3134.7531.7170.086 *
mx dx-subsp−1.4929.475−0.9350.350 7.0206.449−0.1480.883
mx sin-subsp−1.5819.2410.9720.331 7.5575.4300.4060.685
go dx-pog0.5306.2751.0060.314 4.4244.4291.1800.238
go sin-pog1.3705.9190.7080.479 4.0834.4591.9250.054 *
inc dx-go dx−0.5909.5721.6110.107 6.6606.825−1.5400.124
inc sin-go sin−0.7929.2990.9910.322 6.7316.384−0.4650.642
subsp-pog−3.00612.2710.3700.711 5.52311.3260.0250.980
sto-pog−2.98611.2181.7020.089 * 5.51510.175−1.8500.064 *
B-pog−1.0539.6780.1390.890 7.6495.8212.7460.006 **
*—significant at 10% level of significance, **—significant at 5% level of significance.
Table 4. Descriptive statistics of Procrustes distances computed between preoperative and postoperative point configurations.
PDTotalFemalesMales
Min0.0220.0220.049
Max0.1680.1540.168
Mean0.0930.0940.092
SD0.0340.0370.033
Median0.0900.1010.084
Table 5. Descriptive statistics of Procrustes residuals computed between preoperative and postoperative point configurations.
MinimumMeanSDMaximum
or dx0.7655.2633.40614.082
or sin0.8474.5053.34214.580
zy dx0.4125.3363.83316.187
zy sin0.3704.8244.60320.705
go dx0.8654.2173.05416.695
go sin0.2603.7622.59610.476
al dx0.7964.2793.35815.177
al sin0.3324.6724.02917.483
ns0.8244.4082.41310.336
inc0.9085.4664.78425.609
pg0.3473.4562.27210.589
gn0.4873.9302.46711.830
Table 6. Descriptive statistics for deviation metrics.
MalesFemalesTotal
RMSmeans2.0901.5821.813
SD0.3670.2200.385
min1.7191.2931.293
max2.6101.9592.610
PERC75means2.1371.7671.935
SD0.2510.2390.302
min1.9501.4571.457
max2.5332.1842.533
PDsmeans18.85915.22517.987
SD0.9331.0850.810
min14.08610.92910.929
max26.86918.69726.869
Disclaimer/Publisher’s Note: The statements, opinions and data contained in all publications are solely those of the individual author(s) and contributor(s) and not of MDPI and/or the editor(s). MDPI and/or the editor(s) disclaim responsibility for any injury to people or property resulting from any ideas, methods, instructions or products referred to in the content.

