Abstract
Liquid-phase adsorption technology has been widely applied to address environmental problems related to the removal of pollutants from aqueous streams. Simple and effective methods for determining mass transfer parameters, including intra-particle and fluid-to-solid film resistances, are crucial for designing adsorption processes. The efficient simplified diffusion technique (ES technique), based on a completely mixed batch reactor (CMBR), is proposed in this study to address these needs. In this study, we compare three diffusivity (Ds) determination methods: the rigorous diffusion technique (R technique), the simplified diffusion technique (S technique), and the ES technique. Although the simulation results from the R technique are excellent, it is a very complicated and time-consuming approach that is not convenient for practical use. The S technique provides a much simpler approach, but its results are only valid in cases where the contribution of fluid film resistance is negligible (Biot number > 40). The ES technique proposed in this study can overcome those limitations. The estimation errors of the ES technique are significantly smaller than that of the S technique when compared with the R technique. The proposed ES technique would be very useful for field applications to determine diffusivity for aqueous adsorption systems.
1. Introduction
Adsorptive separation technology has been widely applied to solve environmental problems for removing pollutants in waste streams [1,2,3,4]. The advantages of adsorption methods include lower operating costs, ease of operation, and high selectivity for pollutants [5,6]. Accurate kinetic parameters are required for the proper design of adsorption apparatus, such as fixed-bed or packed-bed adsorbers. In general, the fixed-bed (or packed-bed) breakthrough curve method is commonly used to determine the kinetic parameters of adsorption processes [7,8,9]. One of the main advantages of this method is that the experimental apparatus used in this method is similar to the full-scale fixed-bed adsorption towers applied in the industry. Both intra-particle and fluid-to-solid film (or liquid film) resistances are important for mass transfer processes [8]. In general, the mass transfer resistance within the fluid-to-solid film cannot be ignored when determining intraparticle diffusivity when using the fixed-bed breakthrough curve method. In addition, there could be a channeling effect when applying this method. One approach for the fixed-bed breakthrough curve method is the long column technique. When using that approach, the overall mass transfer resistance of the process can be estimated using a simplified mass transfer model, such as an overall mass transfer model or a linear driving force model. In these cases, the fluid-to-solid film resistance can be estimated using an empirical formula. The intra-particle diffusivity can be determined by subtracting the contribution of fluid-to-solid film resistance from the overall mass transfer resistance obtained above [2,9].
Another approach to reduce the fluid-to-solid film resistance is using the differential reactor (shallow bed) technique [10,11]. When intra-particle diffusion is controlled by surface diffusion, concentration decay curves can be estimated using an analytical solution. The intra-particle diffusivity can be determined by comparing the experimental data and theoretical concentration decay curve [12]. However, when the fluid-to-solid film resistance cannot be neglected in the experiment, the separation of intra-particle resistance and fluid-to-solid film resistance would be required to obtain accurate diffusivity values [8,13,14], and the differential reactor technique may not be valid. In addition, one of the main drawbacks of that technique is that a large volume of fluid is required for the test.
The completely mixed batch reactor (CMBR) method provides another choice for estimating the diffusivity in liquid systems. The test procedure is relatively simple and only requires a few liters of liquid, providing a much more environmentally friendly approach relative to the long column or differential reactor methods [2]. Unfortunately, the fluid-to-solid film mass transfer resistances cannot be ignored in these experiments, and an empirical formula for estimating the value of that resistance is not available. For example, Suzuki and Kawazoe (1974) investigated the adsorption rates of 2-dodecylbenzene sulfonate on four different activated carbons and proposed a simple technique based on a Linear Driving Force Diffusion (L.D.F.) Model [15]. Unfortunately, the simplicity of the model and computation technique applied in that study led to significant errors in their estimates of diffusivity. Therefore, a better diffusion model is desirable. For example, an intraparticle diffusion method has been proposed by Furuya et al. (1996) for the investigation of two phenolic compounds (p-chlorophenol (PCP) and p-nitrophenol (PNP)) onto granular activated carbon (GAC-CAL) [16]. One of the main limitations of that method is that it does not consider the resistance within the fluid-to-solid film in the CMBR, but that resistance can be important for CMBR processes. A method that considers both intraparticle diffusion and fluid-to-solid film resistances was proposed by Fujiki et al. (2010), where the intraparticle diffusivity was determined by matching the numerical concentration decay curves with the experimentally measured values [2]. Although that simulation result performs fairly well, the method is very complicated and time-consuming. In this study, the method considering both intra-particle and fluid-to-solid film resistances is referred to as the rigorous diffusion technique (R technique). If the method only considers intra-particle resistance, it is referred to as the simplified diffusion technique (S technique). In general, the results obtained from the R technique are fairly accurate. However, the R technique is a very complicated and time-consuming approach and is not convenient for practical use. The S technique provides a simpler approach, but it is only valid in cases when the contribution of fluid film resistance is negligible [17]. Therefore, the efficient simplified diffusion technique (ES technique) for the determination of surface diffusivity that relies on a completely mixed batch reactor is proposed in this study to overcome the limitations of the S technique. The estimation errors of the ES technique are significantly smaller than that of the S technique when compared with the R technique. The proposed ES technique would be useful for field applications to determine the surface diffusivity for an aqueous adsorption system.
2. Materials and Methods
The fundamental equations of the R and S techniques are listed in this section. The R technique considers both intra-particle and fluid-to-solid film resistances [2], and the S technique only considers intra-particle resistance (without fluid-to-solid film resistance) [16]. The ES technique is a modified version of the E Technique, which will be presented in the Results and Discussion sections.
2.1. Fundamental Equations of R Technique
The fundamental equations of the R technique are listed as follows:
- Intra-Particle Diffusion
- Fluid-to-Solid Film Transfer
- Interface Transfer
- Mass Balance within Vessel
- Average Amount Adsorbed
- Equilibrium Relationship
The above equations (Equations (1)–(6)) are converted into dimensionless ones (Equations (7)–(12)) by means of the dimensionless variables defined below.
Dimensionless Variables:
Dimensionless Equations:
- First Item Intra-Particle Diffusion
- Fluid-to-Solid Film Transfer
- Interface Transfer
- Mass Balance within Vessel
- Average Amount Adsorbed
- Equilibrium Relationship
The calculation method for the R technique is as follows: The core of the calculation involved solving Equation (7). The Crank–Nicolson method was used as the solution method. In this case, boundary values were required. At the boundary point, R = 0, the relational expression ∂Qm/∂R = 0 was used based on the assumption of point symmetry. At R = 1, the value of Qm was determined by solving Equations (8) and (9), and the equilibrium was determined using Equation (12). The calculation program was created using a C++ compiler.
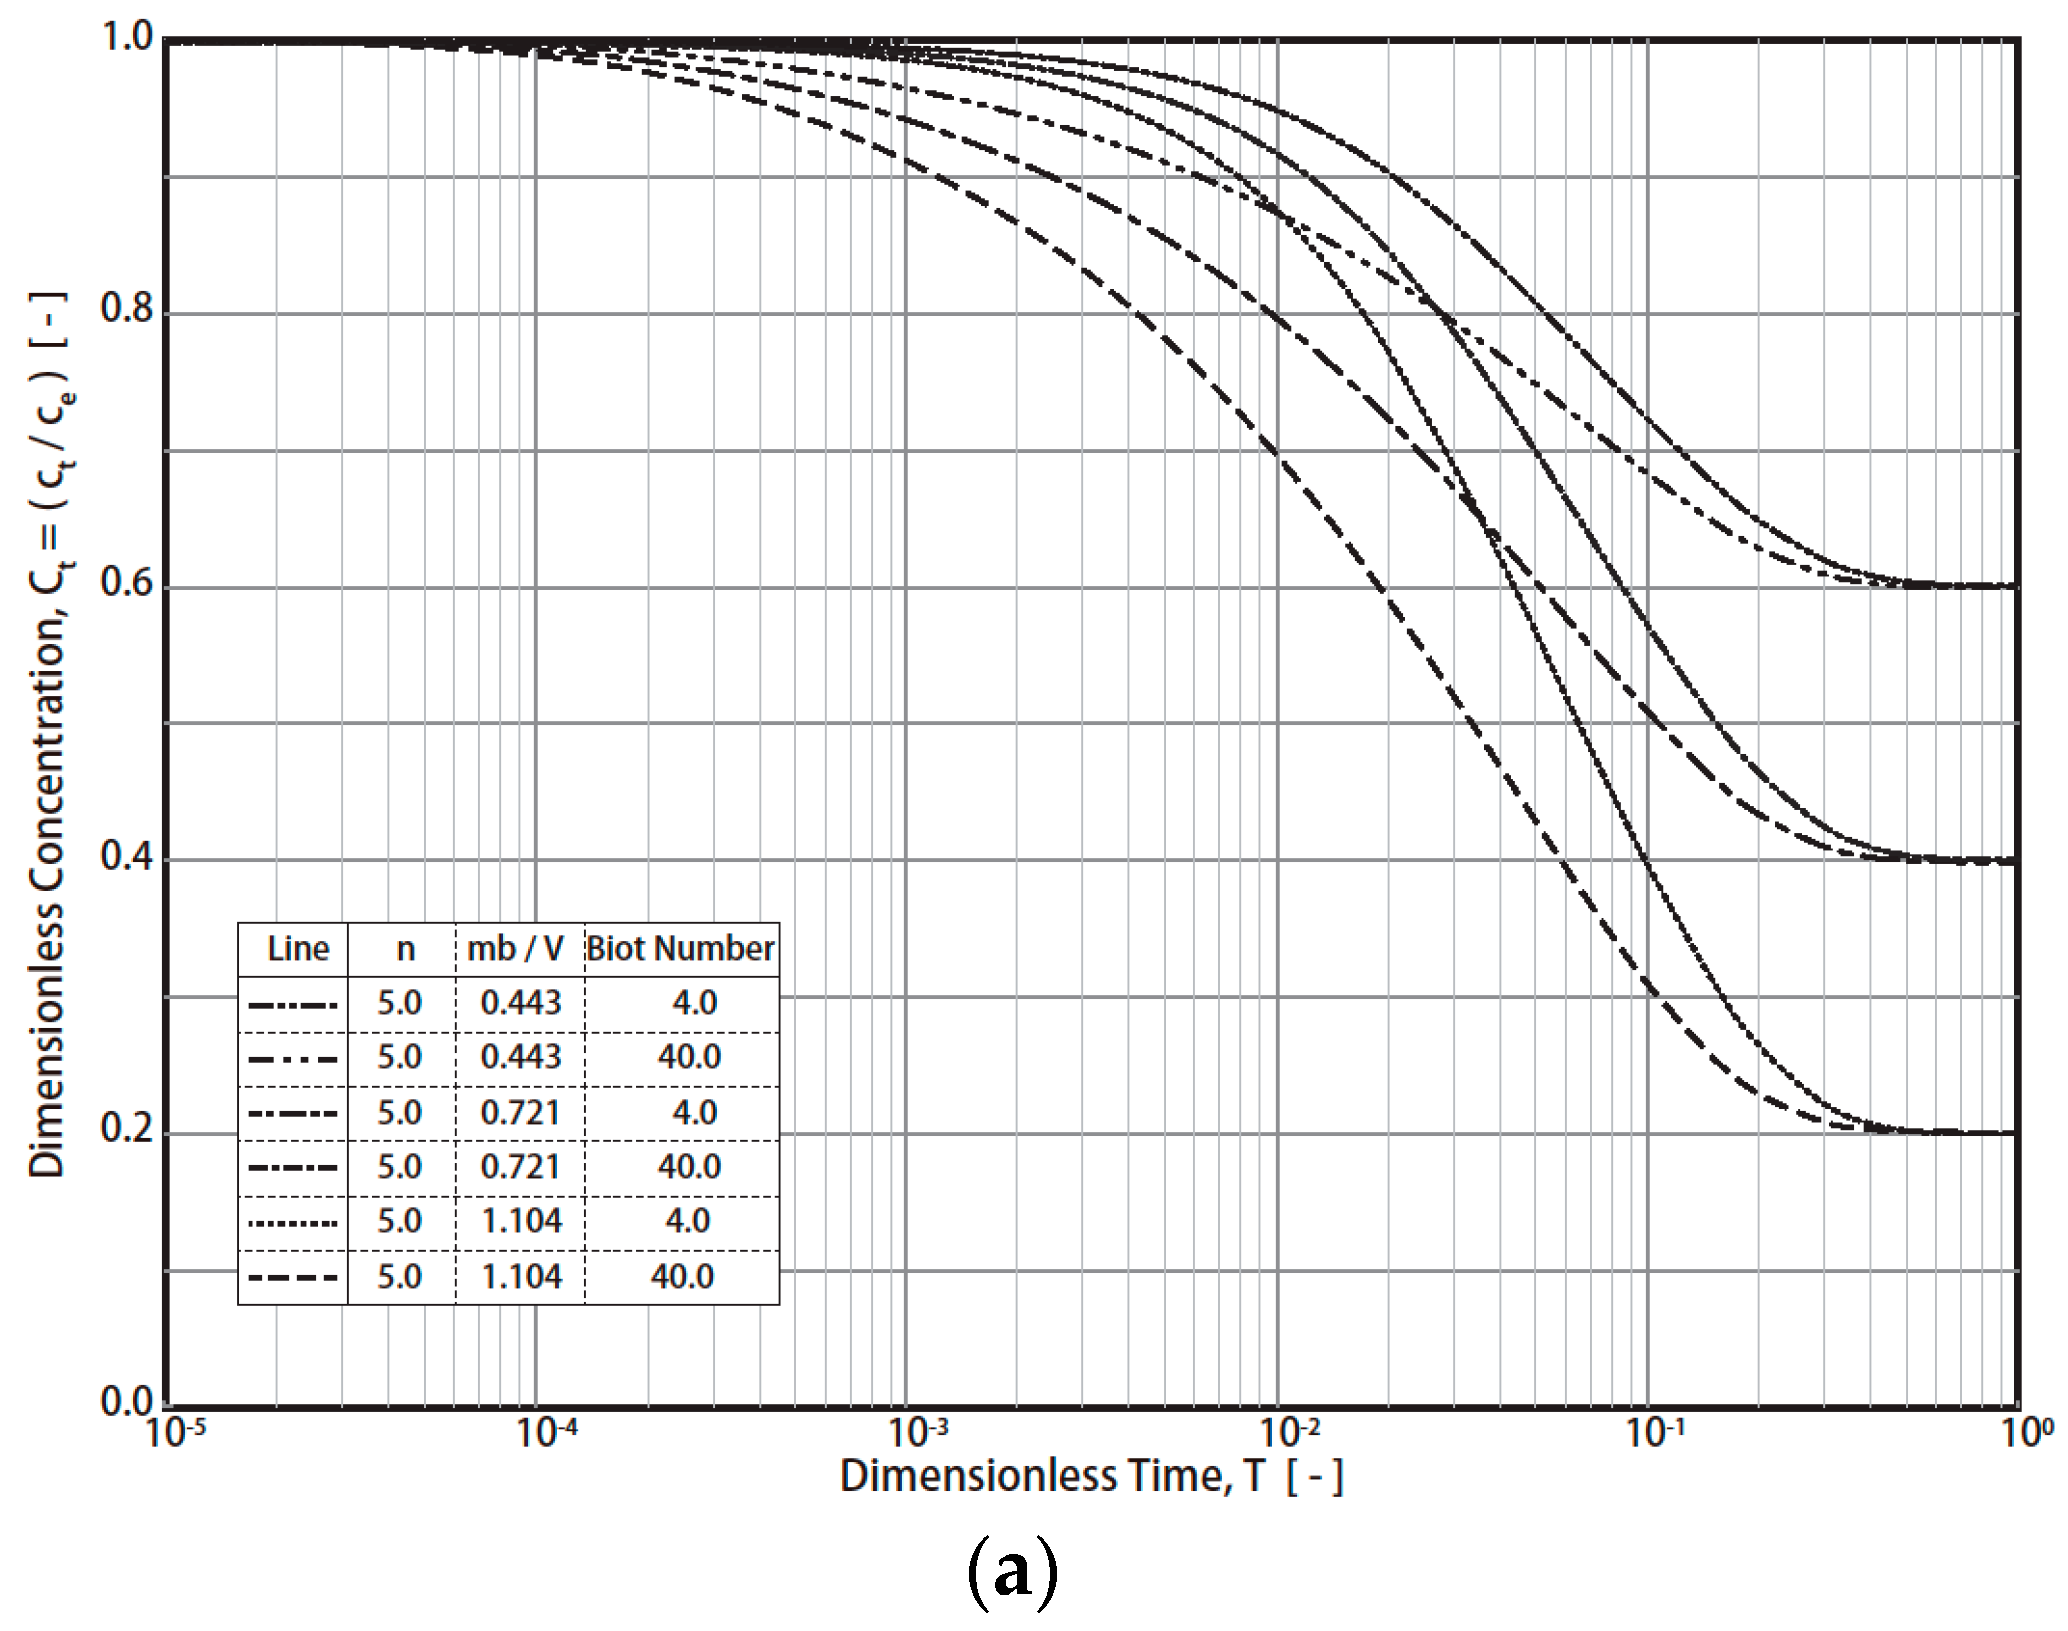
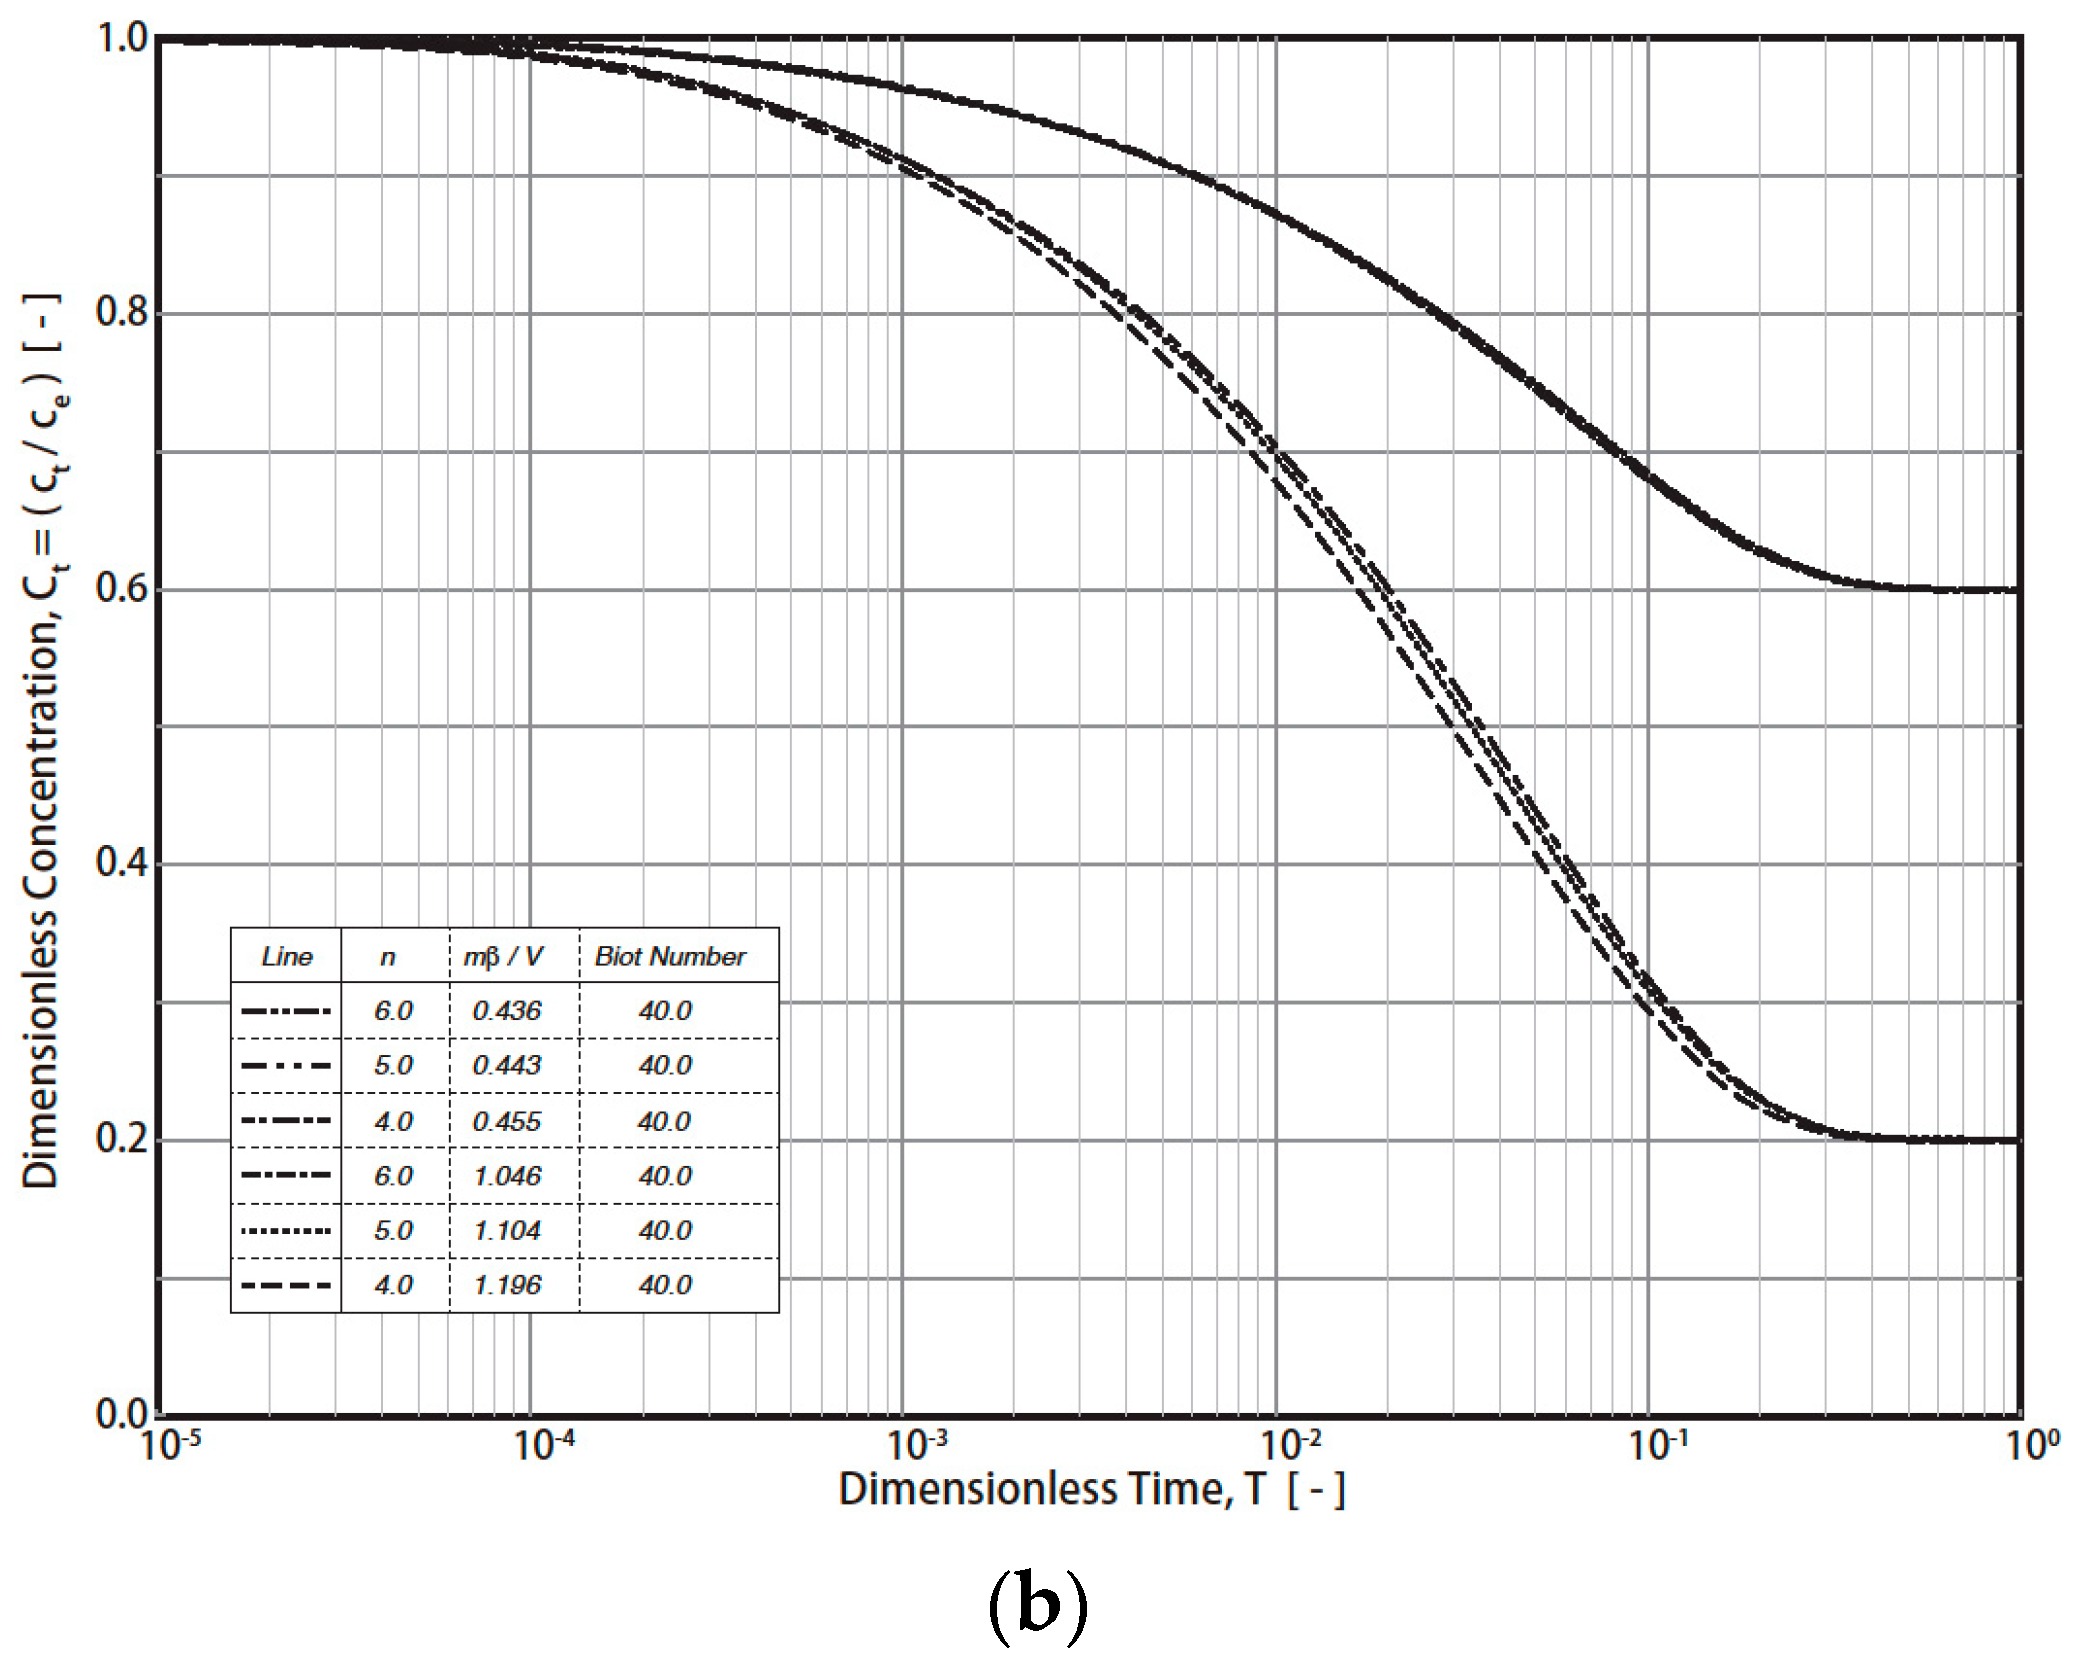
The typical simulation results of the R technique’s dimensionless concentration decay curves (RCD) based on Equations (7)–(12) under various conditions are presented in Figure 1 (Freundlich exponent n = 4, 5, 6; Biot number = 4, 40; fluid/solid ratio (mβ/V = m q0/VC0) = 0.443 − 1.196). The final RCD curve concentrations mainly depend on the values of the fluid/solid ratio (mβ/V) and the Biot number (Figure 1a). For example, the final dimensionless concentration (T = 1) values reach 0.6, 0.4, and 0.2 when the fluid/solid ratios are 0.443, 0.721, and 1.104, respectively. In addition, the effect of the Biot number on the RCD curves is much greater than that of n (4, 5, 6) (Figure 1a and Figure 1b, respectively). For industrial applications, a typical Freundich exponent (n) is in the range of 4–6. Therefore, n = 4, 5, and 6 were simulated in this study. By converting the vertical axis from CT to (CT − Ce)/(C0 − Ce), the effect of the fluid/solid ratio was reduced (Figure 2). For example, at T = 1, the dimensionless concentration (CT − Ce)/(C0 − Ce) converged into 0 (Figure 2). The impact of the Biot no. and n on the RCD curves was reduced as well. The characteristics were applied in the study of the simulation of concentration decay curves.
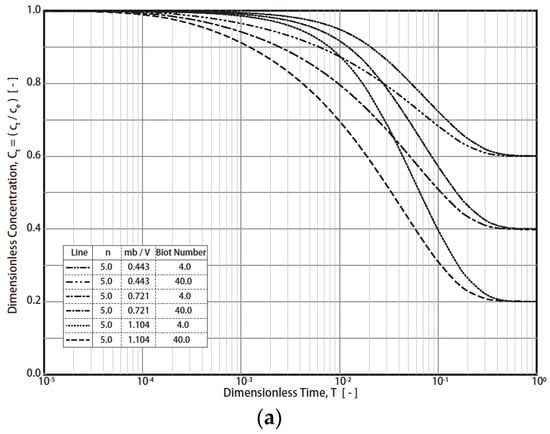
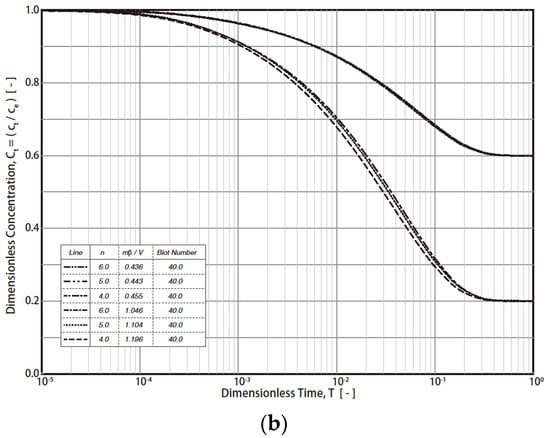
Figure 1.
Simulation results of R technique. (Freundlich exponent n = 4, 5, 6; Biot number = 4, 40; fluid/solid ratio (mβ/V = m q0/VC0) = 0.443 − 1.196). (a) Results with different Biot numbers and dimensionless solid-to-liquid ratio (mβ/V) conditions. (b) Results with different Freundlich exponents, n.
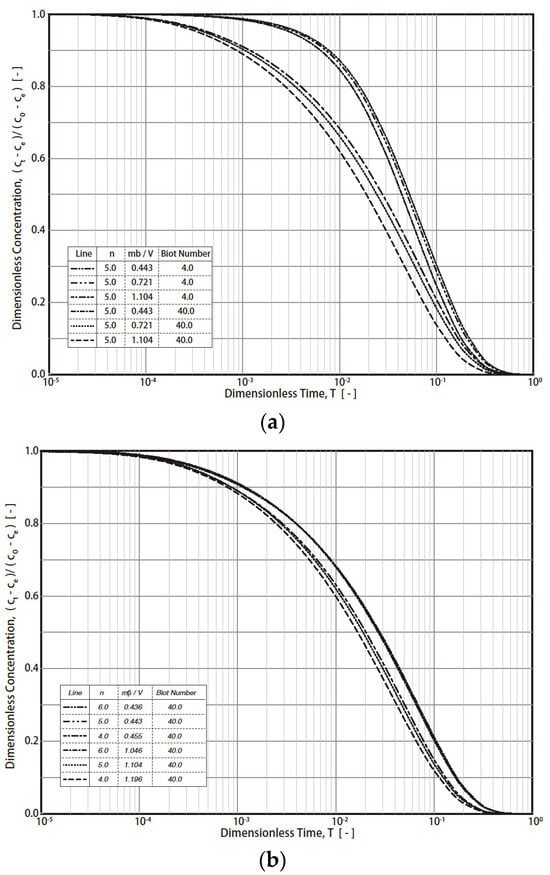
Figure 2.
RCD curves with modified dimensionless concentrations. (a) Effect of Biot number and dimensionless solid-to-liquid value. (b) Effect of Freundlich exponent, n.
2.2. Fundamental Equations of S Technique
The S technique assumes that the adsorbate concentration equilibrium is instantly established at the interface between solid and liquid phases. The S technique only considers intra-particle resistance (without fluid-to-solid film resistance), so this technique is used to analyze the experimental concentration decay curves (ECD curves); the fluid concentration at the interface between the liquid and the solid (CS) is equal to the fluid concentration (CT) within the reactor. Since the equilibrium is instantly established at the interface, Equations (8) and (9) are unnecessary, and Equation (12) is expressed as Equation (16). Finally, fundamental equations based on the S technique are shown as follows (Equations (13)–(16)):
- Intra-Particle Diffusion
- Mass Balance within Vessel
- Average Amount Adsorbed
- Equilibrium Relationship
3. Results and Discussion
The procedures and results of the three methods (R, S, and ES techniques) are presented in this section. Due to the limitations and drawbacks of the R technique and S technique, a new efficient simplified technique (ES technique) for the determination of diffusivity is proposed in this study.
3.1. R Technique
The procedures of the R technique are illustrated in Figure 3.
Figure 3.
Procedures for rigorous diffusion technique.
Step 1: Determine the fluid-to-solid ratio (mβ/V) and Freundlich exponent (1/n) from the experiments (mβ/V = 1.196 and n = 4 were obtained in this study).
Step 2: Plot the experimental concentration decay (ECD) curve (ct vs. t) and dimensionless curves ((Ct − Ce)/(C0 − Ce) vs. T). Determine the experimental time ratio t0.2/t0.8 from the plot. Please note that t0.2 and t0.8 are experimental times corresponding to concentrations (ct) at 0.2 and 0.8, respectively. t0.2 and t0.8 are equal to 3700 and 13.7 min, respectively. The experimental time ratio of t0.2/t0.8 is equal to 26.91 in this case.
Step 3: Simulate the theoretical concentration decay (RTCD) curves for various values of the Bi number (such as 1.0, 25, 10, and 40) using Equations (7)–(12). Determine the dimensionless time ratios (T0.2/T0.8) for various Bi numbers from the RTCD curves. T0.2 and T0.8 correspond to the dimensionless concentration (Ct − Ce)/(C0 − Ce)) at 0.2 and 0.8.
Step 4: Plot the Bi number and the time ratio of T0.2/T0.8 obtained in step 3. The optimum Bi number can be obtained from the plot by using T0.2/T0.8 = t0.2/t0.8 = 26.91, which was obtained in Step 1, as shown in Figure 3. The optimum Bi number is equal to 40, as indicated in the figure. A complicated computation is required in both Steps 3 and 4. Please note that T0.2/T0.8 is equal to t0.2/t0.8, which can be derived from the dimensionless variable. For example, T0.2/T0.8 = [(Ds/rp2) × t0.2]/[(Ds/rp2) × t0.8 ]= t0.2/t0.8.
Step 5. Plot both the ECD and RECD curves with an optimal Bi number (Bi = 40). T/t = 1.8 × 10⁻⁴ (min−1) was obtained in this step by matching both curves, as shown in the figure. For example, t = 1 min and T = 1.8 × 10⁻⁴, as seen in the plot.
Step 6. Determine the Ds value. For example, since T = (Ds/rp2) t, Ds = (T/t) × rp2 = 1.8 × 10⁻⁴ (min−1)/(0.1 cm)2 = 3.0 × 10⁻⁸ cm2/s. Therefore, the Ds value determined by the R method equals 3.0 × 10⁻⁸ cm2/s.
3.2. S Technique
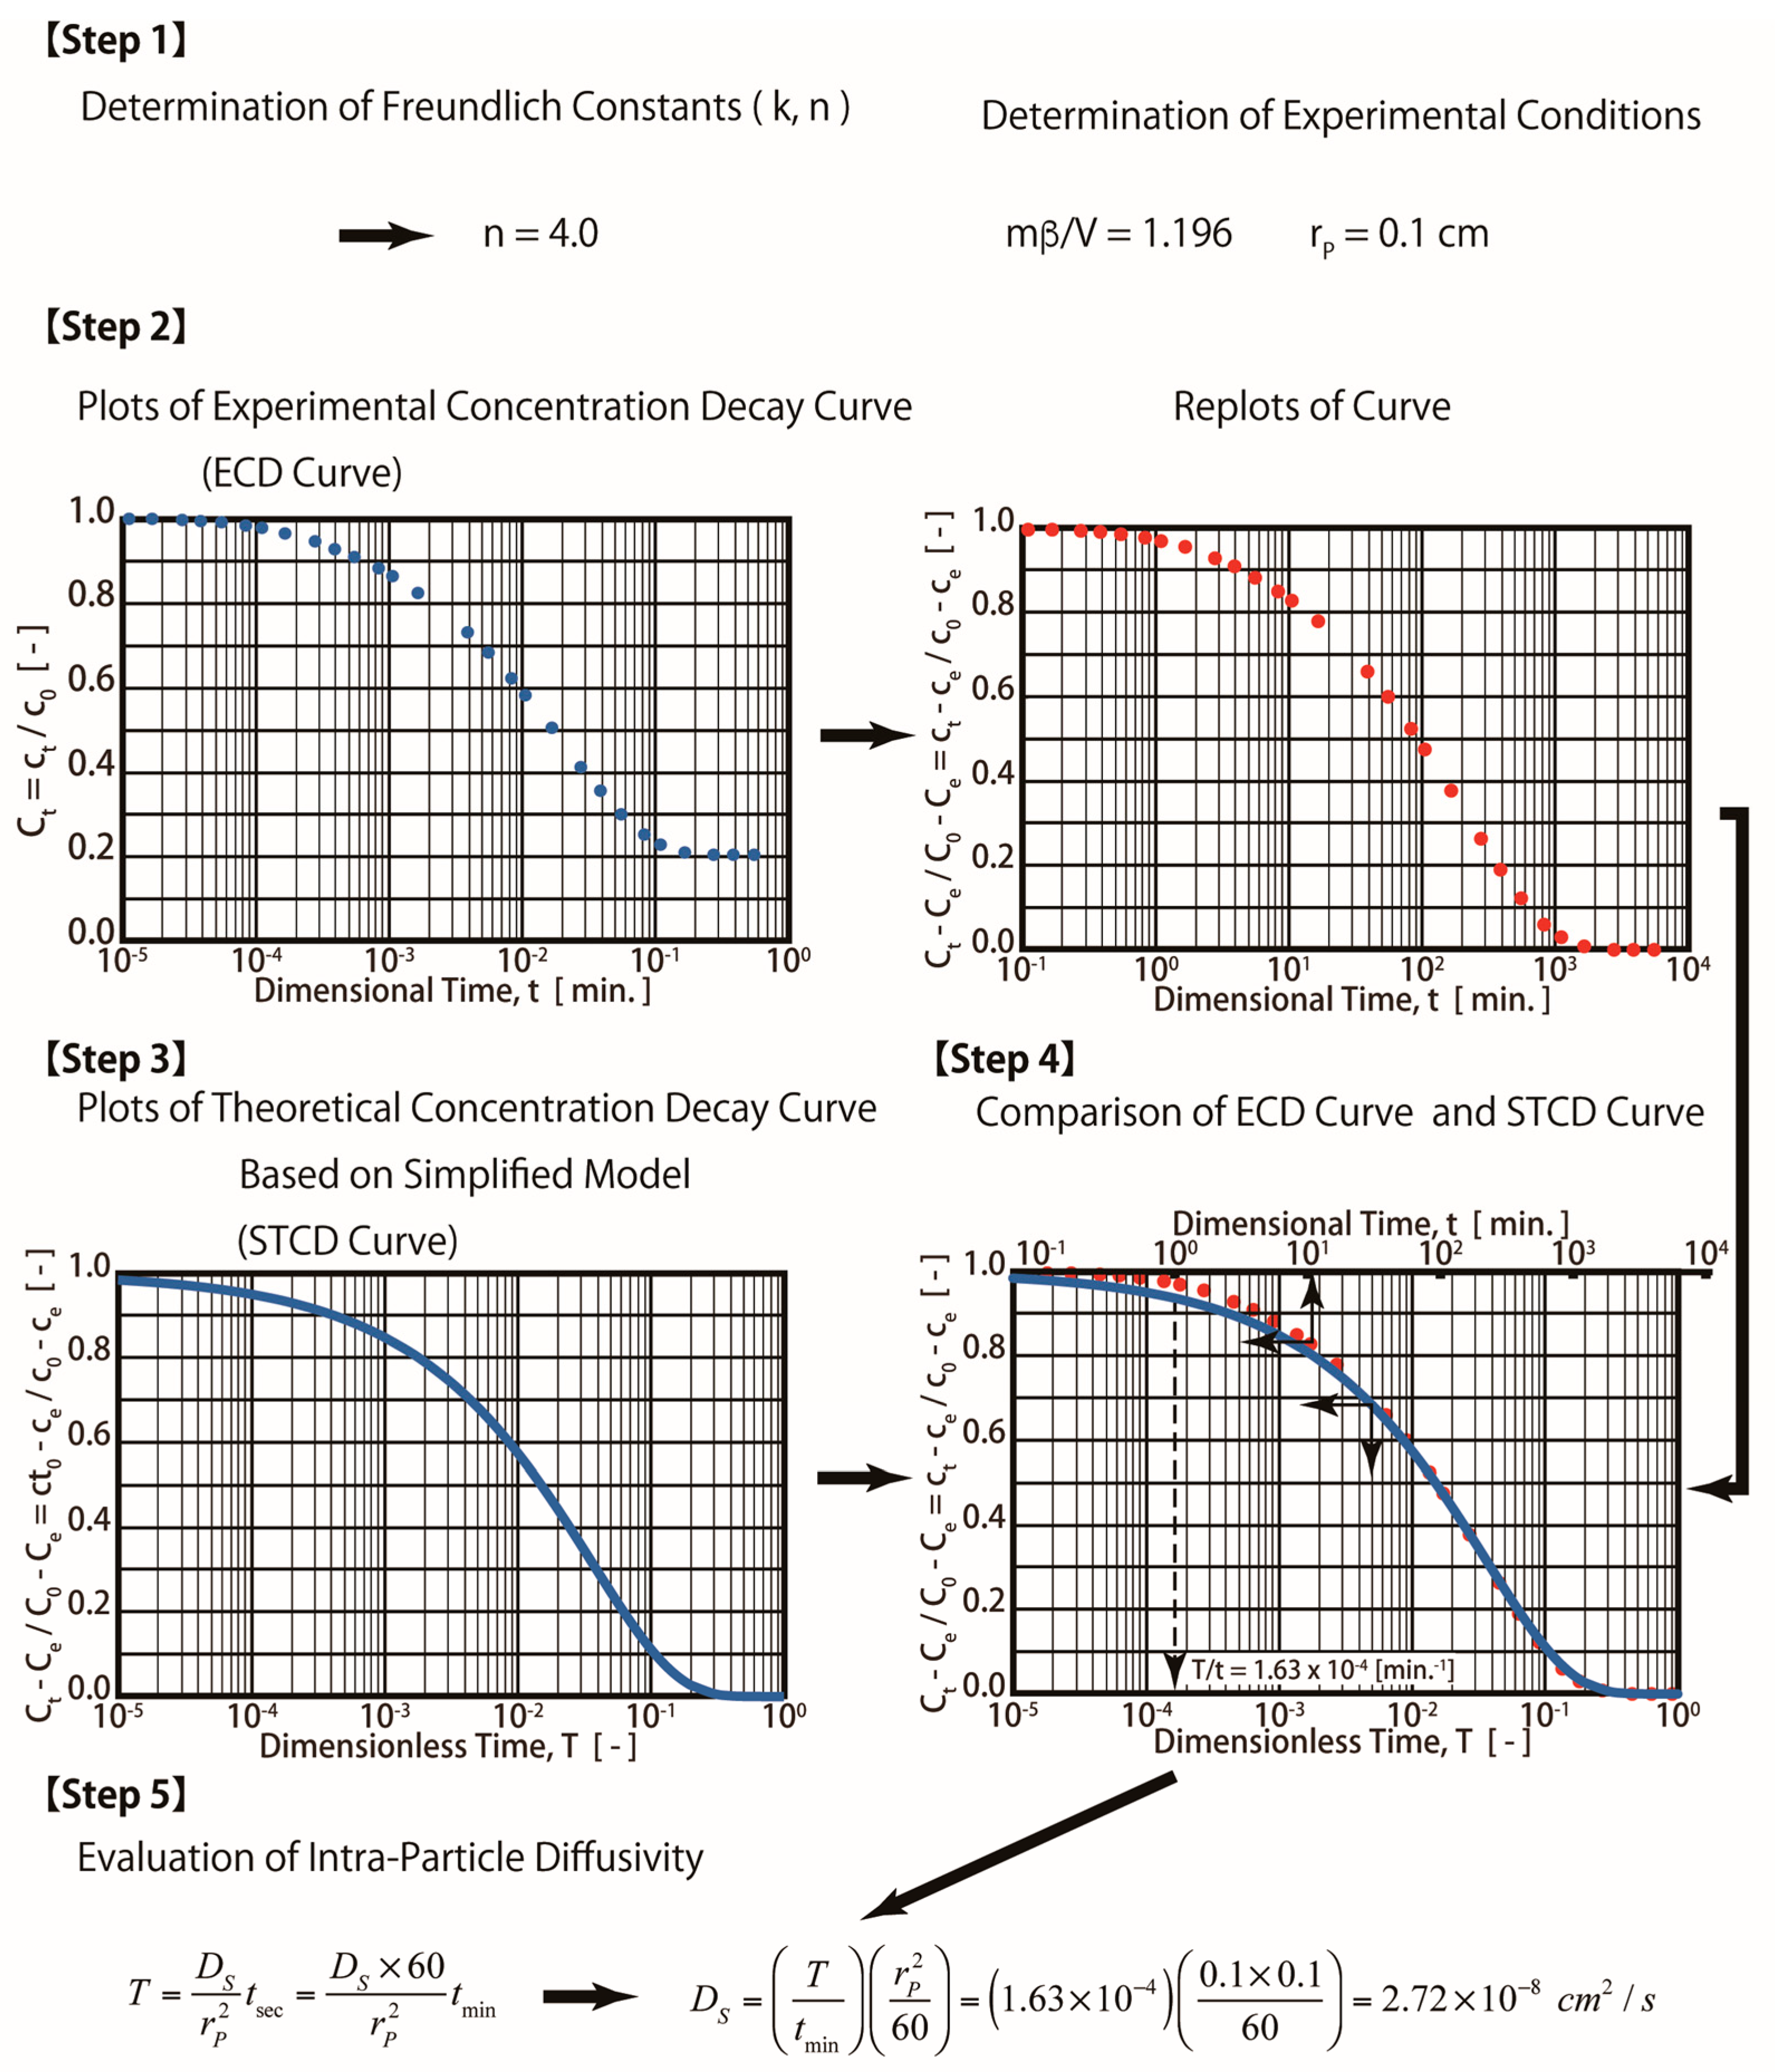
The S technique is a simpler method, and it is easy to apply. When the S technique is employed for the estimation of surface diffusivity (Ds,sim), the obtained simulated curve is referred as a simplified concentration decay curve (SCD curve) using Equations (13)–(16), as shown in the Mathematical Methods
Therefore, Steps 3 and 4 mentioned in Figure 3 (R technique) are not required. The procedures for the S technique are illustrated in Figure 4. In this technique (S technique), Steps 1 and 2 (Figure 4) are the same as those in the R technique (Figure 3). In Step 3 (Figure 4), only one simulated theoretical concentration decay curve (STCD) is required. In the S technique, it is assumed that the main diffusion resistance is intra-particle resistance. For example, when Bi = 40, it is assumed that the intra-particle resistance is much greater than that of the fluid-to-solid film resistance in the system. In this case, (Bi = 40), the time ratio (T/t) is equal to 1.63 × 10⁻⁴ min−1 by matching the ECD and STCD curves. The value of DS was determined to be 2.72 × 10⁻⁸ cm2/s, as shown in Figure 4 (Step 4). This value is slightly smaller (about 9.33%) than that of the value obtained using the R technique (Ds,rig = 3.0 × 10⁻⁸ cm2/s). The S technique only considers intra-particle resistance (without fluid-to-solid film resistance). The S technique is useful for cases when the intra-particle resistance is much greater than the fluid-to-solid film resistance. However, if the fluid-to-solid film resistance cannot be ignored or is greater than the intra-particle resistance, the S technique may not be valid. The three cases of various Bi numbers (Bi = 40, 10, and 4) estimated in this case are shown in Table 1. The value of the Bi number indicates the ratios of intra-particle resistance and fluid-to-solid film resistance. For example, Bi = 10 indicates that both resistances are important. Bi = 40 and 4 indicate that the intra-particle resistance and fluid-to-solid film resistance dominate, respectively. The simulation results are presented in Table 1 and Figure 5. When Bi = 40, 10, and 4, the estimated Ds,sim results are equal to 2.72, 1.90, and 1.08 cm2/s, respectively. Compared with the R technique, the errors are about 9.33, 36.67, and 64.00%, respectively. Therefore, the S technique should be improved to increase the estimation accuracy for conditions in which the fluid-to-solid film resistance is significant. Therefore, a new ES technique is proposed in this study, as shown in the below section.
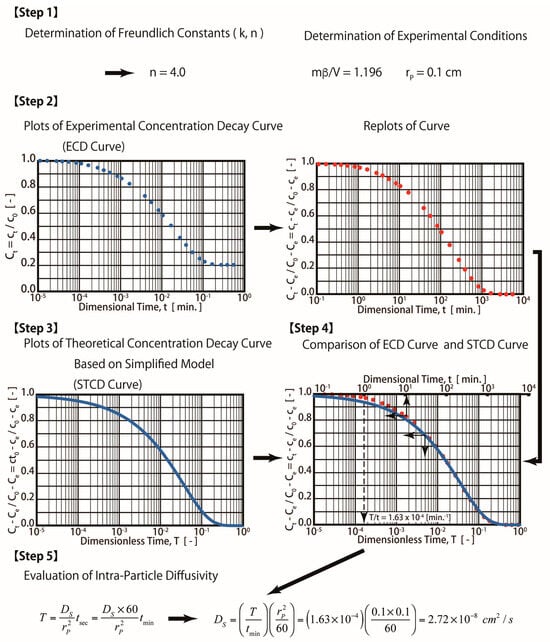
Figure 4.
Procedures for simplified diffusion technique.

Table 1.
Simulation results obtained using different techniques (rigorous, simplified, and efficient simplified techniques) under various diffusion resistance conditions (Bi = 40, 10, and 4).
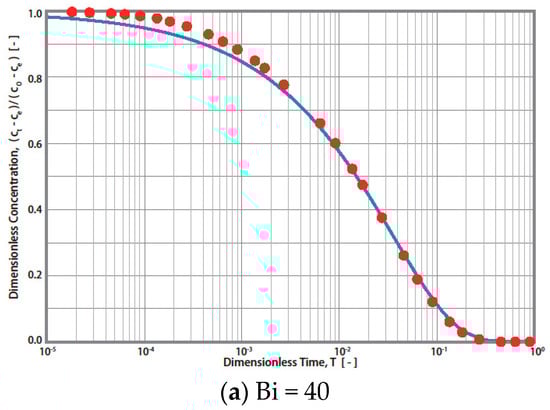
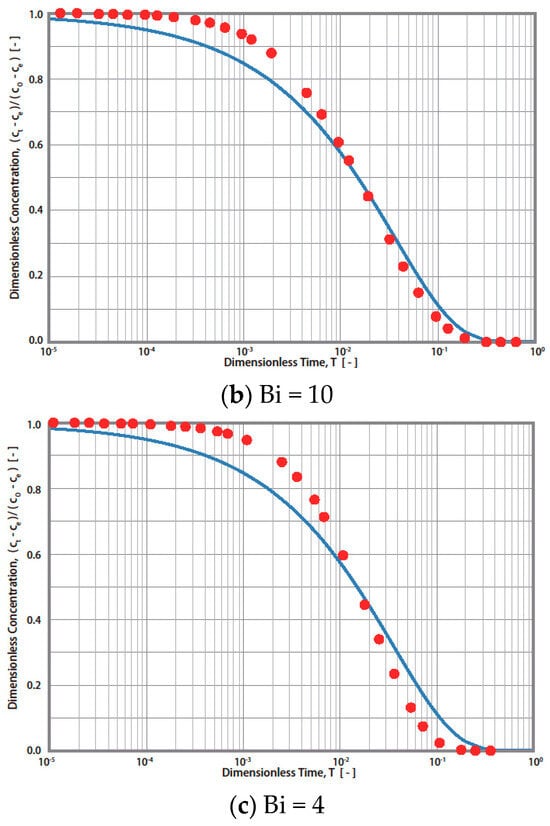
Figure 5.
Simulation results of simplified diffusion technique (-) and rigorous diffusion technique (●) for Bi = 40, 10, and 4, respectively.
3.3. ES Technique
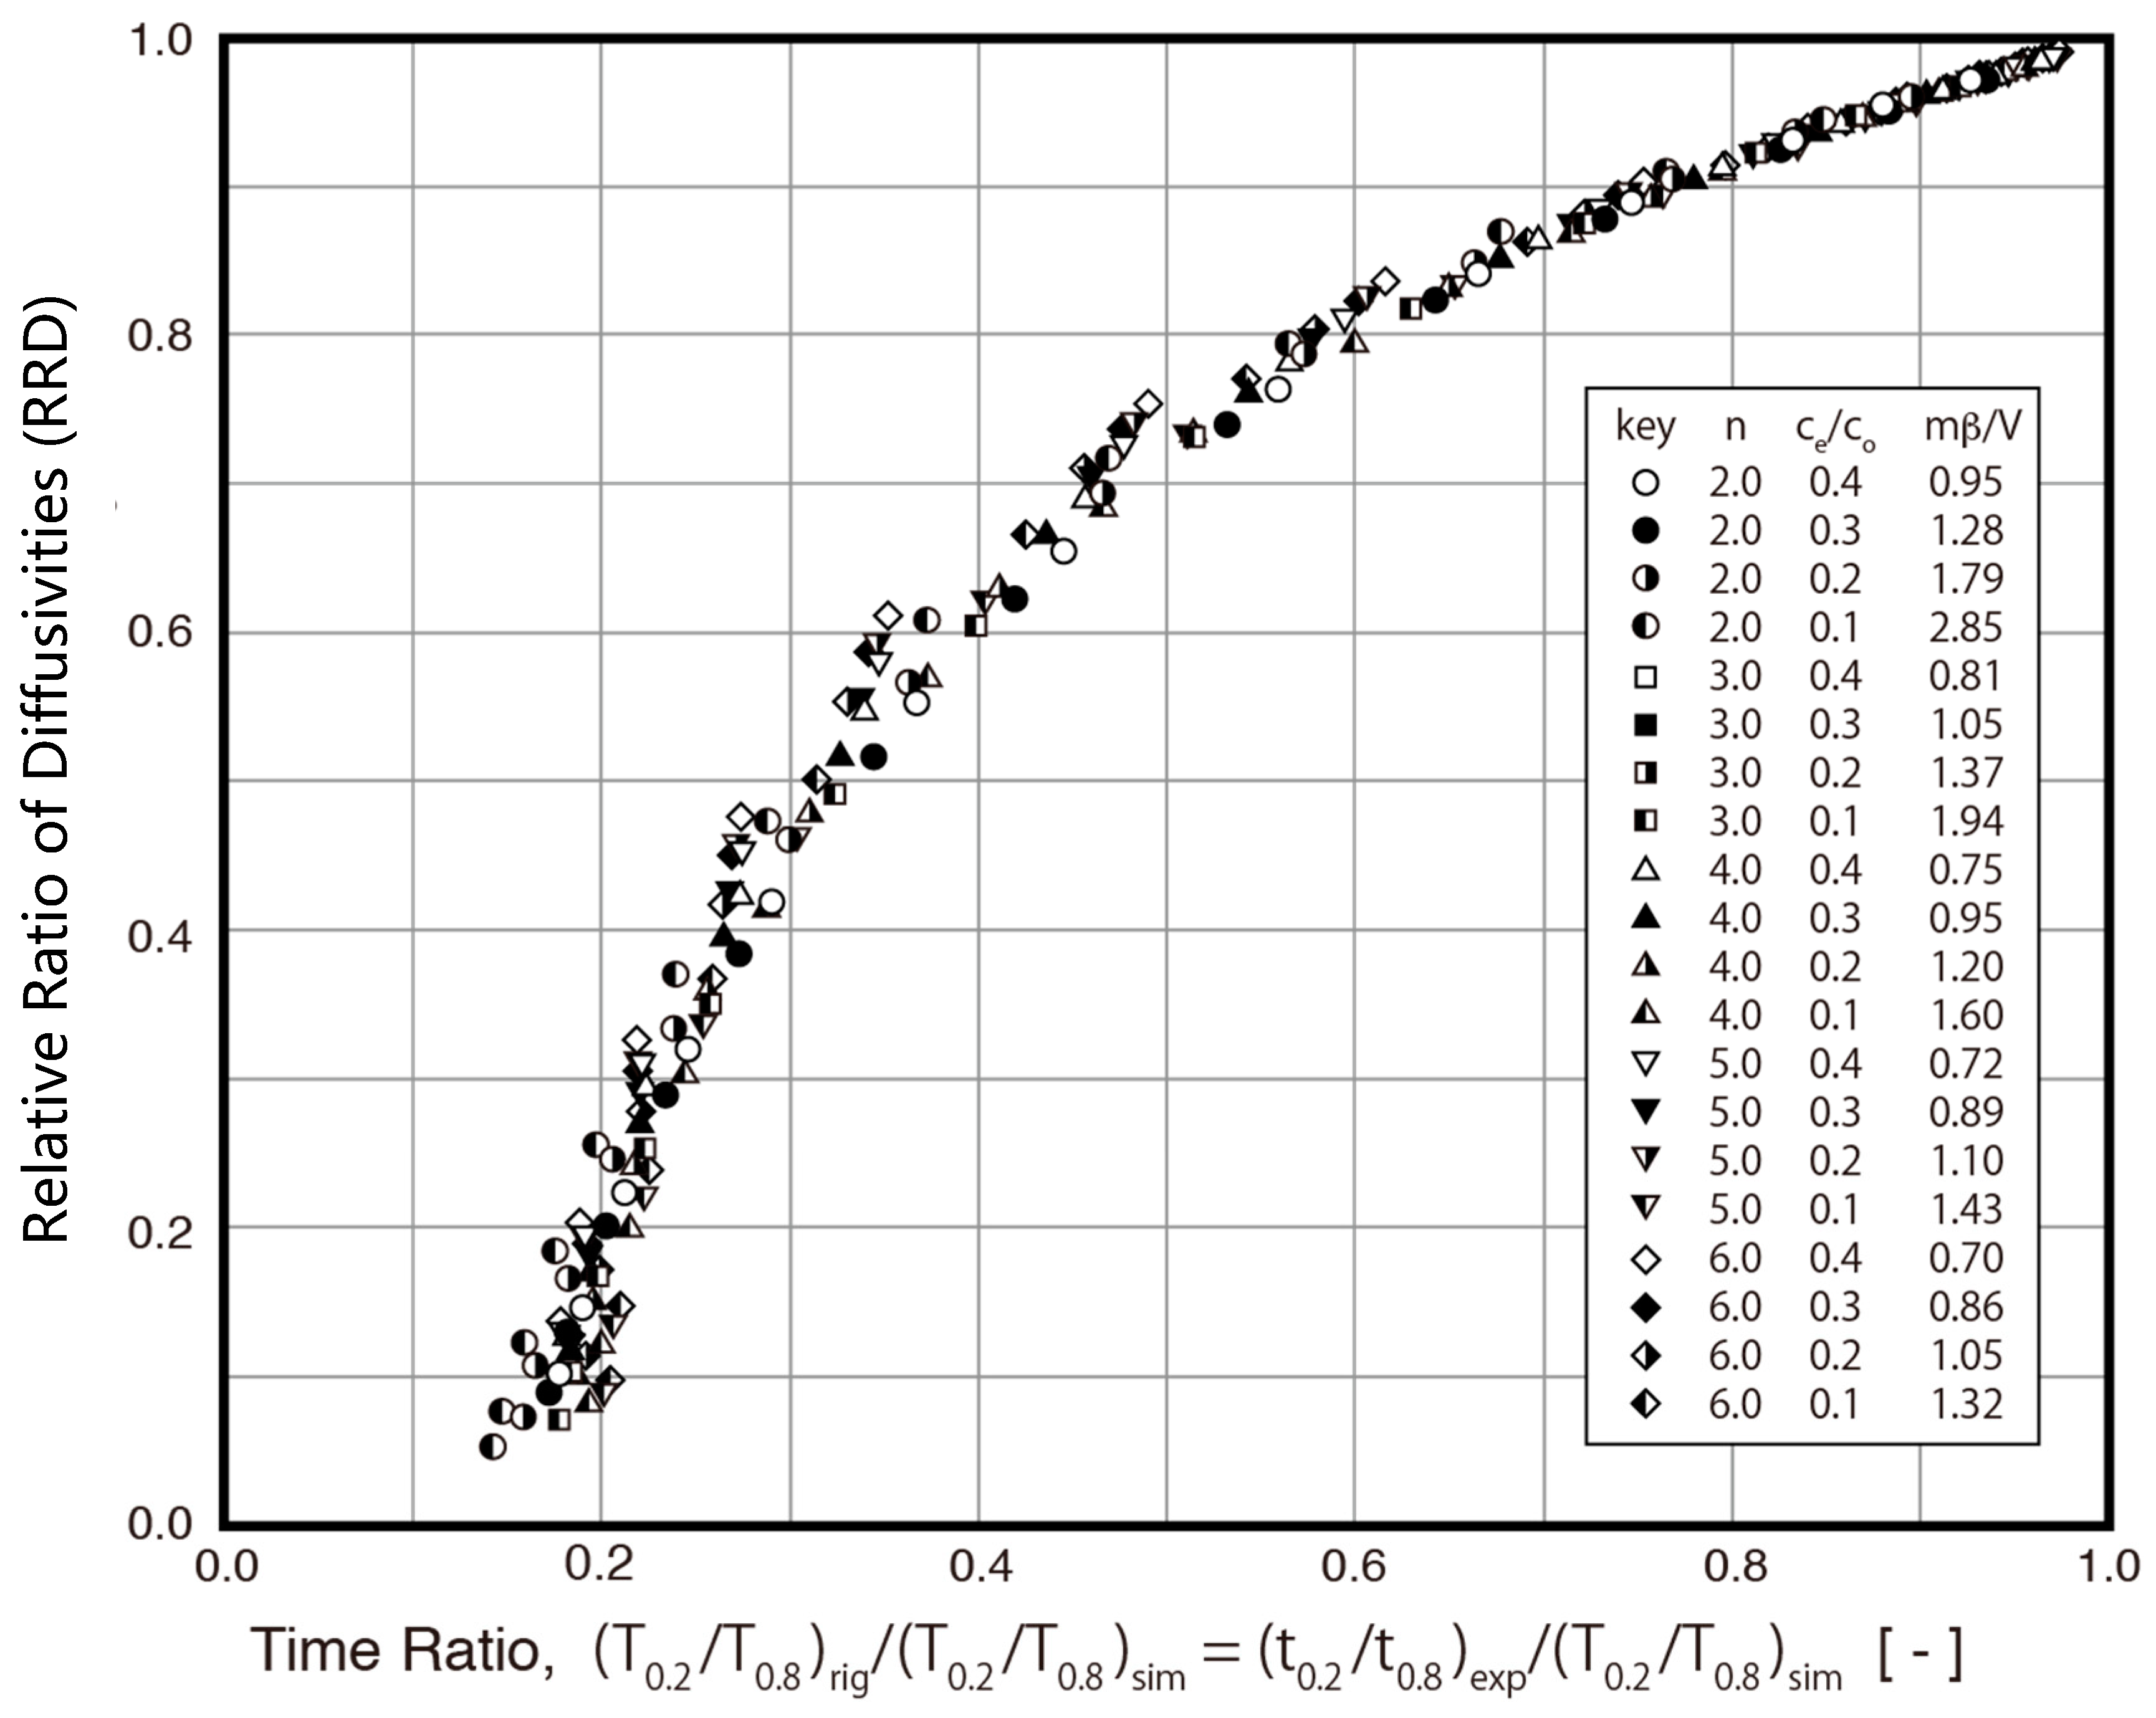
Since the S technique ignores the fraction of mass transfer resistance due to fluid-to-solid film diffusion, the overall resistance is assumed to be equal to the intraparticle diffusion resistance in the method. As a result, the value of Ds,sim is smaller than that of Ds,rig, as indicated in Table 1. Therefore, the ES technique is proposed in this study to minimize the estimation error. The relative ratio of diffusivities (RRD, Ds,sim/Ds,rig) between the S technique and R technique is evaluated under various conditions in this study. The results are presented in Figure 6 with the relative ratio of diffusivities (RRD) against the time ratio (TR, (t0.2/t0.8)exp/(T0.2/T0.8)sim). As indicated in Figure 6, the RRD is a function of the time ratio (TR). For example, when the TR is larger than 0.6, the RRD is about 0.8, which means that there is less than a 20% difference between the Ds,sim and Ds,rig. A biquadratic polynomial equation was obtained using data points, as shown in Figure 6. The correlation between the RRD and TR can be further defined in the following biquadratic polynomial equation:
RRD = −3.7784 * TR4 + 11.392 * TR3 − 13.063 * TR2 + 7.2592 * TR − 0.8163
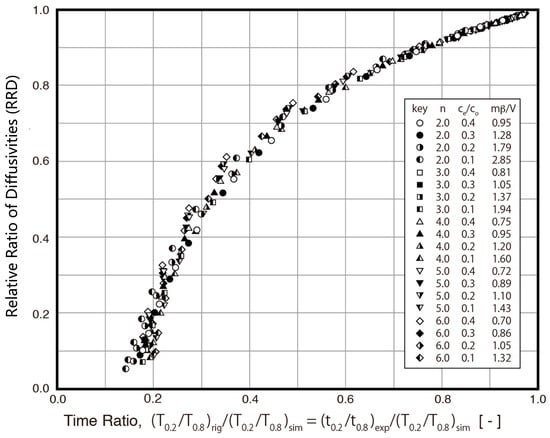
Figure 6.
Correlation between relative ratio of diffusivities (RRD) and time ratio (TR).
Since the RRD is the relative ratio of diffusivities between the S technique and R technique, it is used as a correction factor in the ES technique to obtain a much more accurate diffusivity value. The diffusivity value estimated by the ES technique uses Equation (17).
Ds,eff = Ds,sim/RRD = Ds,sim/(Ds,sim/Ds,rig) = Ds,sim/Ds,sim * Ds,rig = Ds,rig
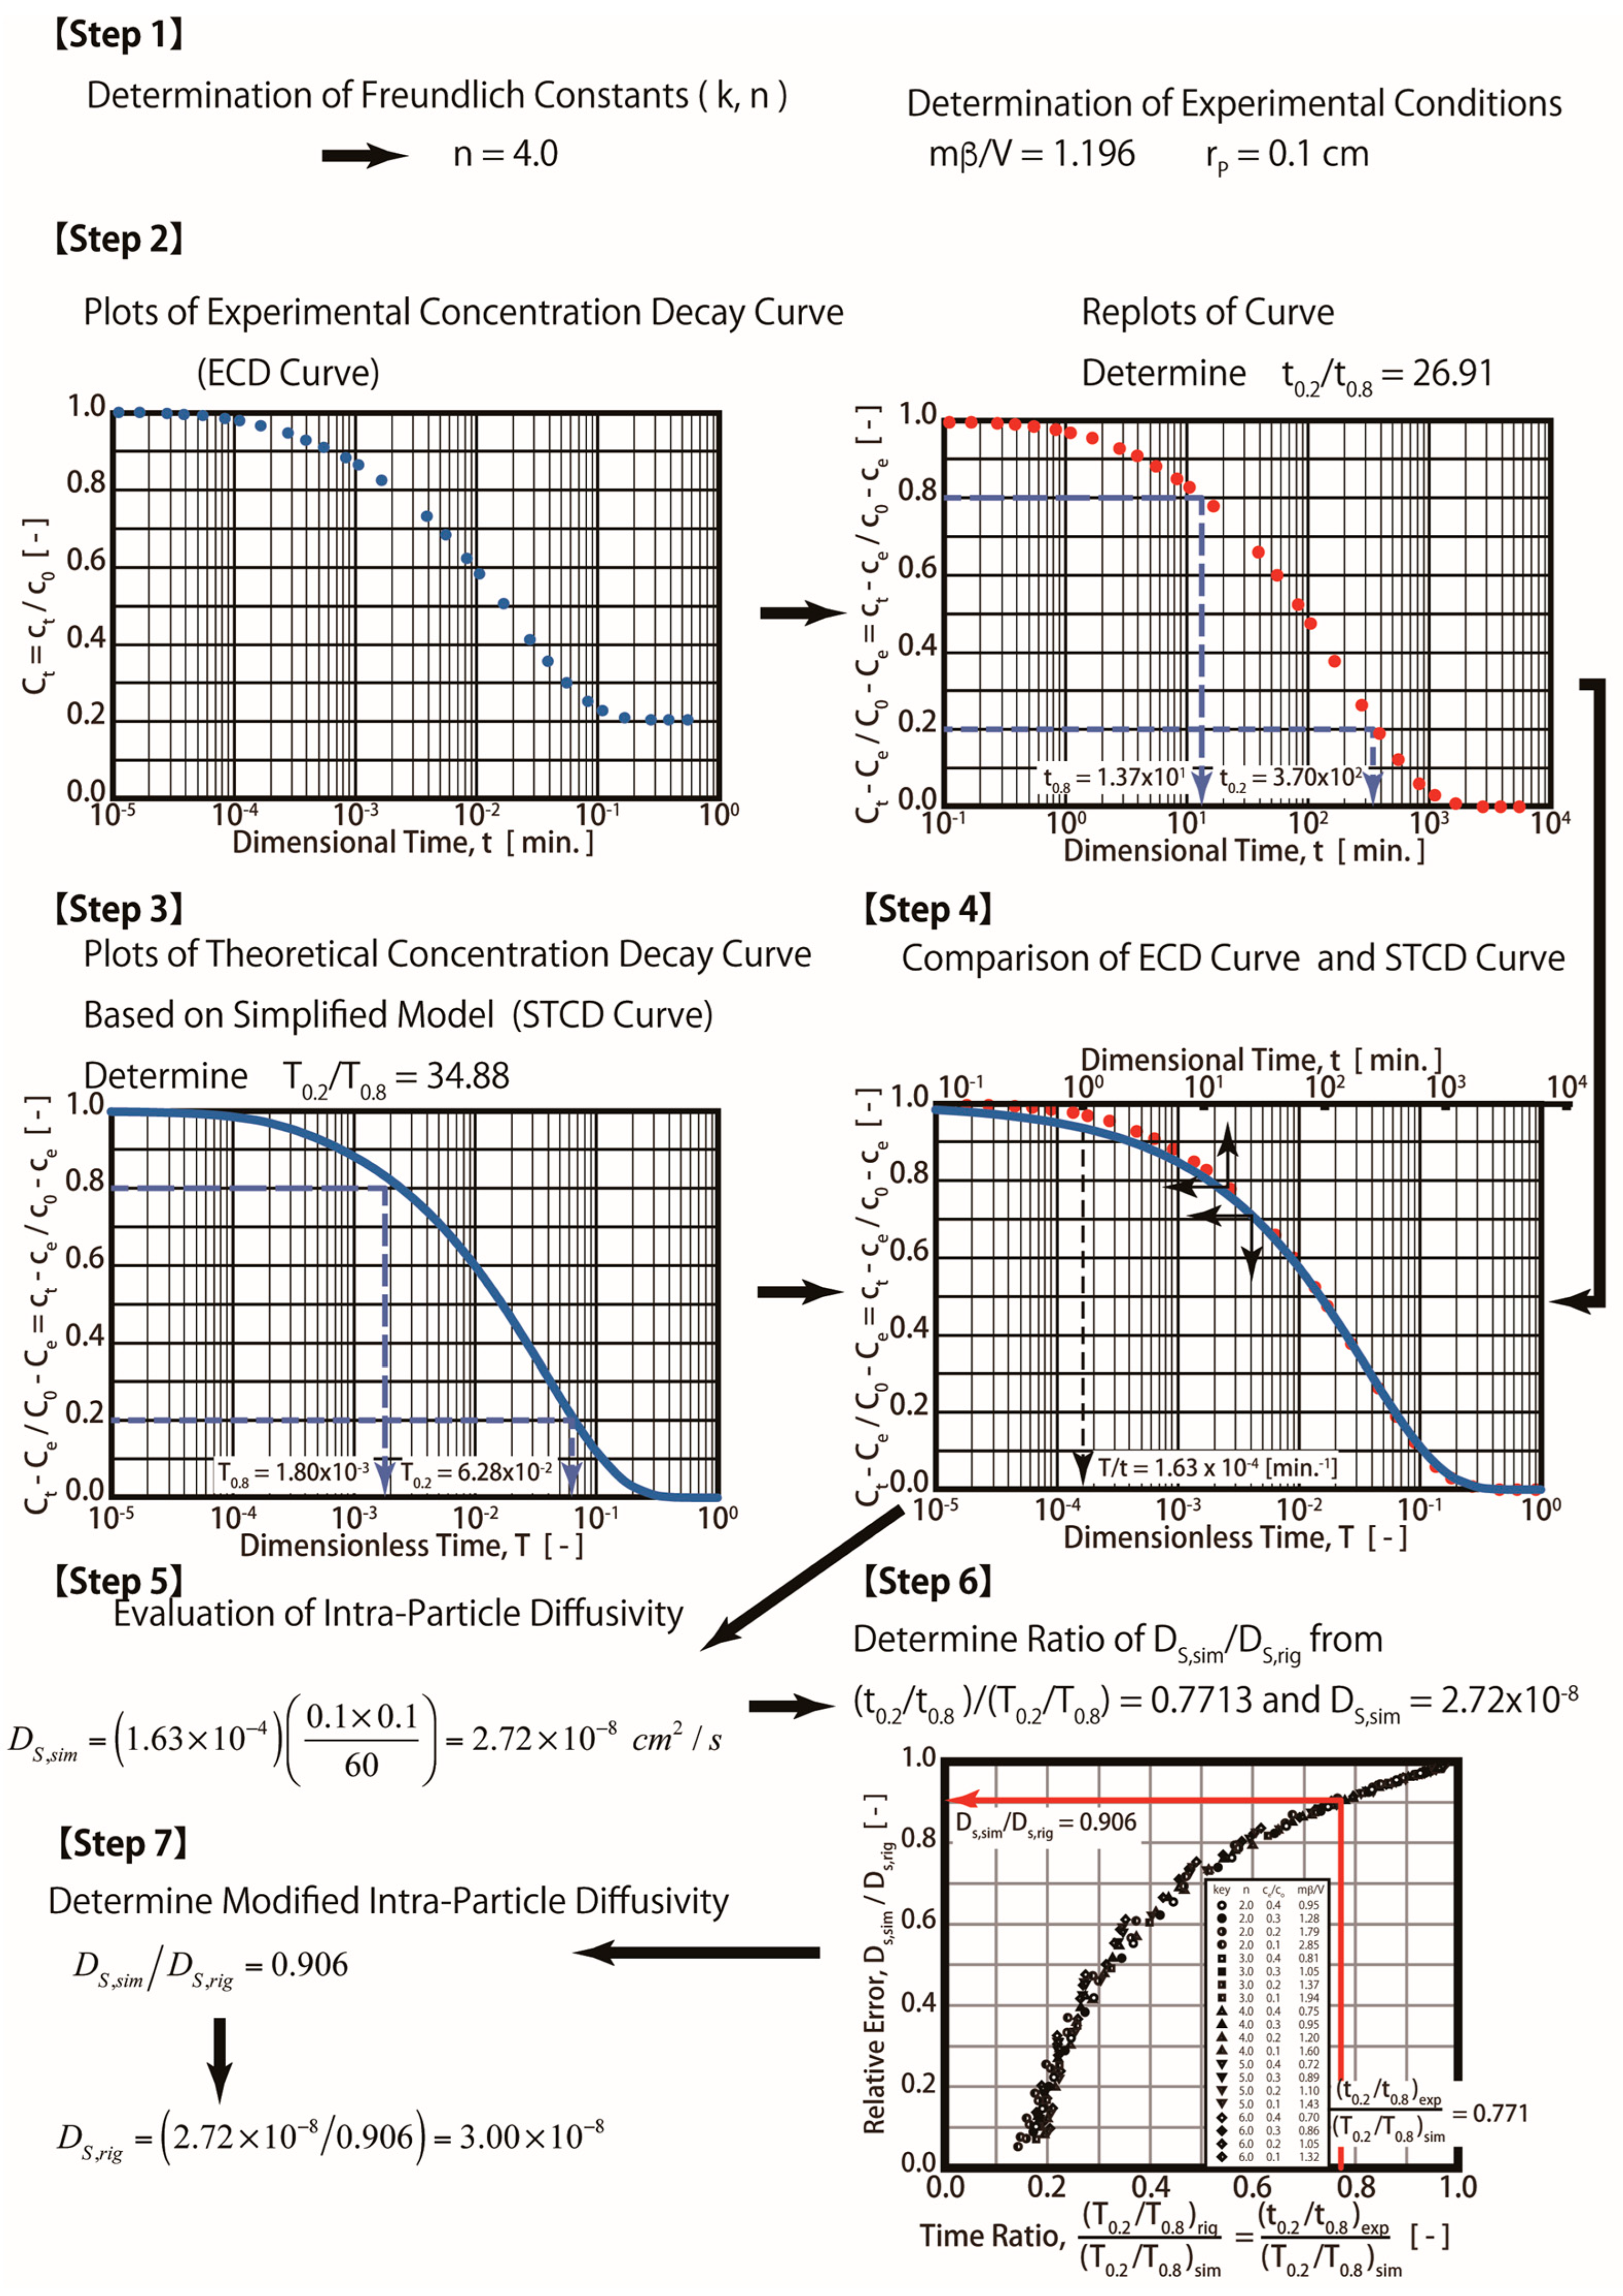
The procedures of the ES technique are shown in Figure 7. An additional two steps (Steps 6 and 7) are added in the ES technique (Figure 7) compared with the S technique (Figure 4). The time ratio (TR) (t0.2/t0.8)exp/(T0.2/T0.8)sim is determined in Step 6. For example, (t0.2/t0.8)exp/(T0.2/T0.8)sim = 26.91/34.88 = 0.7713. As seen in Figure 5, or as determined by using Equation (17), the RRD is about 0.906. As shown in Equation (17), Ds,eff = 2.72 × 10⁻⁸ (cm2/s)/0.906 = 3.00 × 10⁻⁸ (cm2/s).
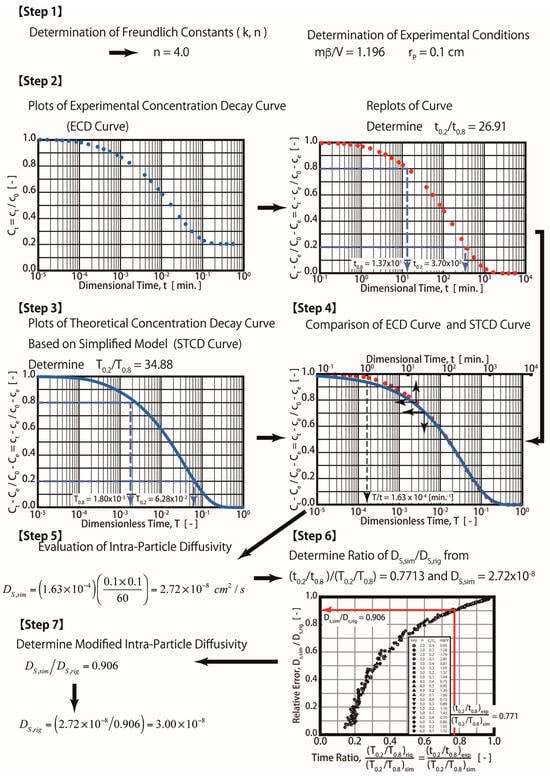
Figure 7.
Procedures for efficient simplified diffusion technique.
Three cases of different scenarios are presented in Table 1 with Biot numbers 40, 10, and 4, which correspond to negligible, medium, and significant fluid film resistance cases. As shown in Table 1, the relative estimated error of Ds,sim is significantly increased with a decreasing Biot number. For example, compared to the diffusivity (Ds,sim) results obtained using the R technique, the estimation errors obtained using the S technique are about 9.33, 36.67, and 64.00% for Biot numbers 40, 10, and 4, respectively. The S technique is only valid in cases when the contribution of fluid film resistance is negligible. In contrast, the estimated errors for those same Biot numbers are about 0.00, 3.33, and 3.33% for the ES technique, which suggests that the ES technique can be applied to a wide range of Biot numbers. In conclusion, the estimation errors of the ES technique are significantly smaller than those of the S technique.
In addition, physical parameters such as the viscosity of the liquid might significantly contribute to the description of phenomena occurring in these systems. Since this study did not have exact information regarding the impact of the viscosity of the liquid, we used Biot numbers, which encompass these factors. Future research will be performed to investigate the impact of the viscosity of the liquid in the CMBR system.
4. Conclusions
The ES technique using a completely mixed batch reactor (CMBR) is proposed in this study for the determination of diffusivity. This technique overcomes the main limitation of the S technique, which is only valid when the contribution of fluid film resistance is negligible. The relative ratio of diffusivity (RRD) is introduced as a correction factor in the ES technique to reduce the estimation error of diffusivity. The ES technique can be used under a wide range of conditions, including under conditions when both intra-particle and fluid film resistances are significant. In conclusion, the proposed ES technique would be useful for field applications to determine the surface diffusivity for an aqueous adsorption system using the completely mixed batch reactor (CMBR) approach.
Author Contributions
Conceptualization, Y.K. and Y.S.; methodology, H.-J.F., E.F. and N.S.; software, E.F.; validation, Y.K. and Y.S.; investigation, N.S. and Y.K.; data curation, Y.K.; writing—original draft preparation, Y.K., H.-J.F., Y.S. and E.F.; writing—review and editing, H.-J.F. and E.F.; supervision, H.-J.F. and E.F. All authors have read and agreed to the published version of the manuscript.
Funding
This research received no external funding.
Institutional Review Board Statement
Not applicable.
Informed Consent Statement
Not applicable.
Data Availability Statement
The data presented in this study are available on request from the corresponding author. The data are not publicly available due to privacy.
Conflicts of Interest
Author Noriyoshi Sonetaka was employed by the company Techno Media Lab, Inc. The remaining authors declare that the research was conducted in the absence of any commercial or financial relationships that could be construed as a potential conflict of interest.
Nomenclature
| Bi | Biot number, |
| aP | Surface area based on solid particle [cm2/cm3] |
| c0 | Concentration within vessel at time, 0 [mmol/cm3] |
| ce | Equilibrium concentration at time, infinity [mmol/cm3] |
| cs | Concentration at interface between solid and fluid-to-solid film [mmol/cm3] |
| Cs | Dimensionless cs, |
| ct | Concentration within vessel at time, t [mmol/cm3] |
| Ct | Dimensionless ct, |
| Ds | Effective surface diffusivity (based on solid concentration difference) [cm2/s] |
| Ds,rig | Effective surface diffusivity estimated using R technique [cm2/s] |
| Ds,sim | Effective surface diffusivity estimated using S technique [cm2/s] |
| Ds,eff | Effective surface diffusivity estimated using ES technique [cm2/s] |
| k | Freundlich constant [(mmol/g) (cm3/mmol)n] |
| kF | liquid film mass transfer coefficient [cm2/s] |
| m | Weight of adsorbent [g] |
| 1/n | Freundlich exponent [-] |
| q0 | Amount adsorbed in equilibrium with fluid concentration, c0 [mmol/g] |
| qint | Initial amount adsorbed at t = 0 [mmol/g] |
| qm | Amount adsorbed at r = r [mmol/g] |
| Qm | Dimensionless qm, |
| qt | Average amount adsorbed within a solid particle at time, t [mmol/g] |
| Qt | Dimensionless qt, |
| r | Internal radial length (length from solid center) [cm] |
| rp | Particle radius [cm] |
| R | Dimensionless internal radial length, |
| t | Time [s] |
| T | Dimensionless time, |
| V | Volume of vessel [cm3] |
References
- Fan, H.-J.; Anderson, P.R. Copper and cadmium removal by Mn oxide-coated granular activated carbon. Sep. Purif. Technol. 2005, 45, 61–67. [Google Scholar] [CrossRef]
- Fujiki, J.; Sonetaka, N.; Ko, K.P.; Furuya, E. Experimental determination of intraparticle diffusivity and fluid film mass transfer coefficient using batch contactors. Chem. Eng. J. 2010, 160, 683–690. [Google Scholar] [CrossRef]
- Al-Khateeb, L.A.; Almotiry, S.; Salam, M.A. Adsorption of pharmaceutical pollutants onto graphene nanoplatelets. Chem. Eng. J. 2014, 248, 191–199. [Google Scholar] [CrossRef]
- Dotto, G.L.; McKay, G. Current scenario and challenges in adsorption for water treatment. J. Environ. Chem. Eng. 2020, 8, 103988. [Google Scholar] [CrossRef]
- Souza, P.; Dotto, G.; Salau, N. Experimental and mathematical modeling of hindered diffusion effect of cationic dye in the adsorption onto bentonite. J. Environ. Chem. Eng. 2019, 7, 102891. [Google Scholar] [CrossRef]
- Franco, D.S.; Martinello, K.d.B.; Georgin, J.; Netto, M.S.; Foletto, E.L.; Silva, L.F.; dos Reis, G.S.; Dotto, G.L. Pore volume and surface diffusion model (PVSDM) applied for single and binary dye adsorption systems. Chem. Eng. Res. Des. 2022, 182, 645–658. [Google Scholar] [CrossRef]
- Ansari, K.B.; Danish, M.; Khatoon, A.; Rao, R.A.K.; Zaidi, S.; Aftab, R.A. A comprehensive investigation of external mass transfer and intraparticle diffusion for batch and continuous adsorption of heavy metals using pore volume and surface diffusion model. Sep. Purif. Technol. 2022, 292, 120996. [Google Scholar]
- Sonetaka, N.; Fan, H.-J.; Kobayashi, S.; Chang, H.-N.; Furuya, E. Simultaneous determination of intraparticle diffusivity and liquid film mass transfer coefficient from a single-component adsorption uptake curve. J. Hazard. Mater. 2009, 164, 1447–1451. [Google Scholar] [CrossRef] [PubMed]
- Kawakita, T.; Fan, H.-J.; Seida, Y.; Fujiki, J.; Furuya, E. A simplified technique to determine intraparticle diffusivity of macro-reticular resins. Sustain. Environ. Res. 2016, 26, 249–254. [Google Scholar] [CrossRef]
- Aguwa, A.A.; Patterson, J.W.; Haas, C.N.; Noll, K.E. Estimation of Effective Intraparticle Diffusion Coefficients with Differential Reactor Columns. J. (Water Pollut. Control Fed.) 1984, 56, 442–448. [Google Scholar]
- Kawakita, T.; Fan, H.-J.; Seida, Y.; Kinoshita, T.; Furuya, E. A simple method for the determination of adsorption kinetic parameters using circulating-type shallow bed reactor (CSBR). Desalination Water Treat. 2017, 92, 1–8. [Google Scholar] [CrossRef]
- Satoh, K.; Fan, H.-J.; Hattori, H.; Tajima, K.; Furuya, E. Simultaneous determination of intraparticle diffusivities from ternary component uptake curves using the shallow bed technique. J. Hazard. Mater. 2008, 155, 397–402. [Google Scholar] [CrossRef] [PubMed]
- Fujiki, J.; Shinomiya, T.; Kawakita, T.; Ishibashi, S.; Furuya, E. Experimental determination of fluid-film mass transfer coefficient from adsorption uptake curve. Chem. Eng. J. 2011, 173, 49–54. [Google Scholar] [CrossRef]
- Sonetaka, N.; Seida, Y.; Nakano, T.; Furuya, E. Determination of intraparticle diffusivity and fluid-to-solid mass transfer coefficient from single concentration history curve in circulated-type fixed-bed reactor. Adsorpt. Sci. Technol. 2017, 36, 571–585. [Google Scholar] [CrossRef]
- Suzuki, M.; Kawazoe, K. Batch measurement of adsorption rate in an agitated tank pore diffusion kinetics with irreversible isotherm. J. Chem. Eng. Jpn. 1974, 7, 346–350. [Google Scholar] [CrossRef]
- Furuya, E.G.; Chang, H.T.; Miura, Y.; Yokomura, H.; Tajima, S.; Yamashita, S.; Noll, K.E. Intraparticle mass transport mechanism in activated carbon adsorption of phenols. J. Environ. Eng. 1996, 122, 909–916. [Google Scholar] [CrossRef]
- Fujiki, J.; Noll, K.E.; Kawakita, T.; Nakane, Y.; Furuya, E. Simplified determination method of intraparticle diffusivity within a resin adsorbent from binary-component liquid adsorption uptake curves. Transp. Porous Media 2014, 102, 349–364. [Google Scholar] [CrossRef]


Disclaimer/Publisher’s Note: The statements, opinions and data contained in all publications are solely those of the individual author(s) and contributor(s) and not of MDPI and/or the editor(s). MDPI and/or the editor(s) disclaim responsibility for any injury to people or property resulting from any ideas, methods, instructions or products referred to in the content. |
© 2024 by the authors. Licensee MDPI, Basel, Switzerland. This article is an open access article distributed under the terms and conditions of the Creative Commons Attribution (CC BY) license (https://creativecommons.org/licenses/by/4.0/).