Abstract
The reactive strength index (RSI) is a performance measure previously used to assess lower extremity performance; however, this study addresses limitations in its interpretation that need to be readdressed. The purpose of this study is twofold: to test the correlation of a new variable denominated integral reactive strength index (IRSI) with the RSI and to compare the flight time, ground contact time, jump height, RSI, reactive capacity, and IRSI between Olympic athletes in 100 m and 400 m. Ten elite male track and field athletes who qualified for the Olympics participated in this study (age = 24.9 ± 2.42 years; height = 1.75 ± 5.0 cm). They were divided into two groups, the first with five 100 m sprinters and the second group with five 400 m sprinters. The drop jump (DJ) attempts from 0.20 m were performed with the force plate 0.10 m away from the jump box. The DJ 0.30 m and DJ 0.40 m had a 0.15 m separation, and the DJ 0.50 m and DJ 0.60 m had a 0.20 m separation. The correlation analysis showed a high correlation (r = 0.805; p = 0.02) between the RSI and the IRSI. The comparisons between 400 m sprinters versus 100 m sprinters showed that there are no significant differences between the groups for any of the reactive strength variables (p > 0.05). Coaches of these sports’ specialties should take these criteria into account when developing plyometric programs and introduce the IRSI as an accurate measurement for evaluating DJ performance.
1. Introduction
In high-level sports, measuring strength qualities independently is a fundamental tool to isolate which components need to be strengthened during training. Within the context of training, there is anecdotal testimony suggesting that 100 m and 400 m runners may require the use of different strategies for reactive strength training. However, we believe this assertion needs rigorous testing, as the current demands of a 400 m dash sprinter are not very different from those of a 100 m dash sprinter. By analyzing split times, i.e., every 100 m during the 400 m at the last World Championships (Appendix A), we observe that a 400 m athlete is essentially a sprint athlete and has a well-developed velocity characteristic.
For both groups of athletes, plyometrics should not only be a practical training method [1], but also allow to isolate the measurement of lower limb power performance [2]. Previous studies have emphasized the importance of assessing jump height (JH) [3,4] and ground contact time (GCT) [3,4] in different exercises. The combination of these two variables computes the reactive strength index (RSI) [5]. The RSI has been and is established as a valid and reliable measure of explosive qualities and capturing real-time acquisition of behavior between eccentric and concentric actions [6,7]. This variable is commonly applied in plyometric training programs and was first described [5] as reactive strength and later used as an index by several researchers [7,8,9,10]. In the original equation, the RSI is calculated by the ratio between JH and the GCT. However, in several studies, the RSI is also being calculated from flight time (FT) divided by GCT [10,11]. However, caution is warranted, as this method tends to overestimate RSI values compared to its original equation [7]. Consequently, these two approaches for calculating the RSI are not equivalent and should not be used interchangeably [12].
The evaluation of the reactive strength variables of athletes is a useful tool in most sports [2]. Hence, several anaerobic disciplines use it [13], considering these could be a key factor for sports performance [14]. There may also be other variables to consider, such as the reactive capacity (RC), even though researchers confuse it with the RSI [15], although they do not represent the same variable. The RC was first defined by Verkhoshansky [16], and like the RSI, it is provided as a particular feature of the function and work of the neuromuscular system. It can be defined as the ability to develop a maximum impulse immediately after an eccentric action during a drop jump [16]. Despite this information, how RC correlates with other reactive strength variables is still unknown.
Regarding the RSI, previous findings [3] with recreationally active individuals recommend performing plyometric training from heights not up to 0.40 m due to the biomechanical differences found in jumps with bounces from 0.20 to 0.60 m. However, this was not the case with top athletes. Another study [10] with national-level athletes, who performed training programs for drop jump (DJ) from fixed heights of 0.30 cm, found an increase in vertical jump performance but did not take into account previous criteria on neuromuscular pre-activation [9]. Similar studies [17] found differences in the RSI with power athletes (jumpers, sprinters, and throwers; RSI = 2.19 ± 0.58 cm) outperforming endurance athletes (RSI = 0.84 ± 0.39). These findings confirmed the hypotheses of the researchers. When we take a closer look at the sprinters, there are commonalities, e.g., both for 100 m and 400 m disciplines that fall into the same realm of velocity. This could be crucial in justifying comparisons between these groups. However, to date, we have found no reports comparing reactive strength variables between the two groups. To our knowledge, no published literature to date has reported the percentage of RSI loss concerning the HF for these athletes. In the available literature, we have yet to find a unified accepted criterion to stop the RSI test, after a certain height. The literature only suggests that the test should be stopped when the RSI indicator declines [1,9], but not by how much or to what extent this decline is. Another disturbing element is that the RSI does not provide a logical benchmark for the quality of the results, nor does it explain whether these are related to the FH. This criterion is fundamental for correctly defining the training intensity based on the RSI. Although this is a widely used metric, it still could present several problems that hinder its use, especially in world-class athletes with high demands for performance improvement. Establishing potential differences in reactivity values between the two groups, along with proposing more accurate variables, would assist researchers and coaches in identifying appropriate heights for reactive jump training and designing individualized training programs. Therefore, the purpose of this study is twofold: (1) to test the correlation of a new variable denominated integral reactive strength index (IRSI) with the RSI, and (2) to compare the flight time, ground contact time, jump height, RSI, reactive capacity, and IRSI between Olympic athletes in the 100 m and 400 m events.
2. Materials and Methods
2.1. Experimental Approach to the Problem
This article seeks to test the hypothesis that high-level athletes of the 100 m and 400 m dash present no differences in reactive strength variables. A repeated measures design with increasing height order (DJ20, DJ30, DJ40, DJ50, DJ60) was used for the study. The sprinter groups (100 m and 400 m) constituted the independent variable, while FT, GCT, JH, RSI, RC, and IRSI were the dependent variables.
2.2. Subjects
Ten high-level male track and field athletes served as study subjects. Table 1 shows the athletes’ age, anthropometric characteristics, and experience of training. The inclusion criteria required them to be Olympic qualification athletes with a 100 m time less than 10.05 s and a 400 m time less than 44.90 s. Other inclusion criteria were athletes who qualified on points without reaching the Olympic minimum and others who took part in the official 100 m and 400 m relays. Athletes could only participate if they did not suffer from injuries, orthopedics problems, or medical indications in the last three months. In addition, the coaches were asked not to include plyometric exercises as part of their training plans 5 days before testing. All athletes were informed of the potential risk associated with the measurements and provided written informed consent. The research was conducted following the recommendations of the latest version of the Declaration of Helsinki (October 2013) and approved by the Scientific Council and the Ethics Committee of the Faculty of Sport Sciences and Physical Education of the University of Coimbra (code-CE/FCDEF-UC/00802021 on 6 July 2021).

Table 1.
Characteristics (mean ± SD) of the Olympic dash sprinters (n = 10).
2.3. Testing Procedures
All athletes were already familiar with the DJ assessment procedure. The measurements were performed 6 weeks before the Tokyo 2020+1 Olympic Games. The jumping protocol consisted in performing three DJ attempts from increasing heights (20, 30, 40, 50, and 60 cm) until the point at which the RSI value decreased. Attempts above 60 cm were not considered to protect the athletes for the Olympic Games.
At the beginning of the testing session, data (age, sporting experience (years), anthropometric data) were obtained and the 100 m sprinters and 400 m sprinters were divided into two groups of 5 athletes each. Before performing the jumping protocol, the athletes completed a standard warm-up, which included the following: three laps of the track (400 m), 2 × 20 m skipping A, 2 × 20 m skipping A with right leg, 2 × 20 m skipping A with left leg, 2 × 20 m skipping B, 2 × 20 m skipping C, 2 × 40 m progressive sprint, and 3 jumps in counting movements. After 5 min of recovery, a test drop jump from a height fall (HF) of 20 cm was performed. Athletes were instructed to perform maximal effort, aiming for lower GCT and higher FT. Each athlete’s take-off and landing were standardized following the jump protocol [18]. Using a force plate (Kistler Model 9260 AA6, Winterthur, Switzerland), data were collected and displayed in real-time at a sampling rate of 1000 Hz with the interface box provided by the brand. The data were analyzed using Bioware version 5.3.2.9 (Winterthur, Switzerland) following the manufacturer’s instructions. Verbal stimuli were provided during all attempts. Attempts of DJ20 were performed with the force platform at a separation of 10 cm from the jump box. For the DJ30 and DJ40 cm, the force platform was 15 cm away from the jump box, while the DJ50 and DJ60 were 20 cm away. The recovery time between attempts of the same height was 1 min and between different heights 4 min. The RSI was calculated using the equation described below [8]:
where RSI is the reactive strength index, JH is the jump height, and GCT is the ground contact time.
RC was evaluated using Equation (2):
where JH is the jump height and HF is the fall height.
HF and JH have already been described above. These formulas can be considered the most practical since their evaluation can be performed with any validated jump interruption equipment or different accelerometer devices that provide this variable [19,20].
To integrate the effects of HF into the RSI formula, a new variable was developed, which we call the integral reactive strength index, obtained by the following equation:
where IRSI is the integral reactive strength index, RSI is the reactive strength index, and RC is the reactive capacity.
Anthropometric assessment: height was measured on a stadiometer close to 0.1 cm (Bodymeter 206, SECA, Hamburg, Germany). Body mass was assessed (scale provided by the platform) with an accuracy of 0.1 kg. This protocol coincided with the week of low training load with the commitment of the coaches not to perform plyometric sessions in the 5 days before the test.
2.4. Statistical Analyses
The data represent the group means ± SD of the athlete’s best performance in the three DJ trials at each of the different heights. The normality test was applied, and homogeneity was analyzed, detecting that the data did not meet the assumptions of normality and were not homogeneous. Therefore, non-parametric testing was used. Additionally, the sample size indicated the application of the Mann–Whitney test, which allowed us to detect differences between the 100 m and 400 m groups. We compared both groups on the dependent variables (i.e., FT, GCT, HJ, RSI, RC, and IRSI). The Kruskal–Wallis one-way Anova test was used to establish differences on the 10 sets of heights, i.e., 20–30; 20–40; 20–50; 20–60; 30–40; 30–50; 30–60; 40–50; 40–60; and 50–60 cm. Adjustments for multi-comparisons were performed by Bonferroni’s post hoc tests. The α level was set at p ≤ 0.05. Spearman’s correlation was also used to determine the correlation between the RC vs. RSI. Data were analyzed using the statistical package IBM SPSS Statistics version 27 and graphs were produced in GraphPad version 9.4.0.
3. Results
Table 2 shows the results on the reactive strength variables for the 100 m and 400 m sprinters. There were no statistically significant differences (p ≥ 0.005) for any of the dependent variables between both groups (Table 2). The Kruskal–Wallis one-way Anova test on 10 sets of heights revealed that with respect to FT, significant within-group differences are apparent in three sets: 100 m groups (FT20–40: p = 0.034 *; FT20–50: p = 0.009 **; FT20–60: p = 0.001 **), and 400 m groups (FT20–40: p = 0.021 *; FT20–50: p = 0.004 **; FT20–60: p = 0.007 **). In the case of GCT and the RSI, both groups show no significant differences for either set (p ≥ 0.05). With respect to RC, significant differences were observed in five sets: 100 m groups (RC20–50: p = 0.006 **; RC20–60: p = 0.001 **; RC30–50: p = 0.042 *; RC30–60: p = 0.003 **; RC40–60: p = 0.056 *) and 400 m groups (RC20–50: p = 0.006 **; RC20–60: p = 0.001 **; RC30–50: p = 0.042 *; RC30–60: p = 0.003 **; RC40–60: p = 0.056 *). Finally, the IRSI for 100 m groups showed significant differences in three sets (IRSI 20–50: p = 0.017 *; RC20–60: p = 0.001 **; RC30–60: p = 0.034 *) and 400 m groups showed significant differences in two sets (IRSI 20–50: p = 0.012 *; RC20–40: p = 0.003 *); the remaining of the sets’ comparisons did not show significant differences.
Table 2.
Reactive strength variables (mean ± SD) of 100 m and 400 m athletes.
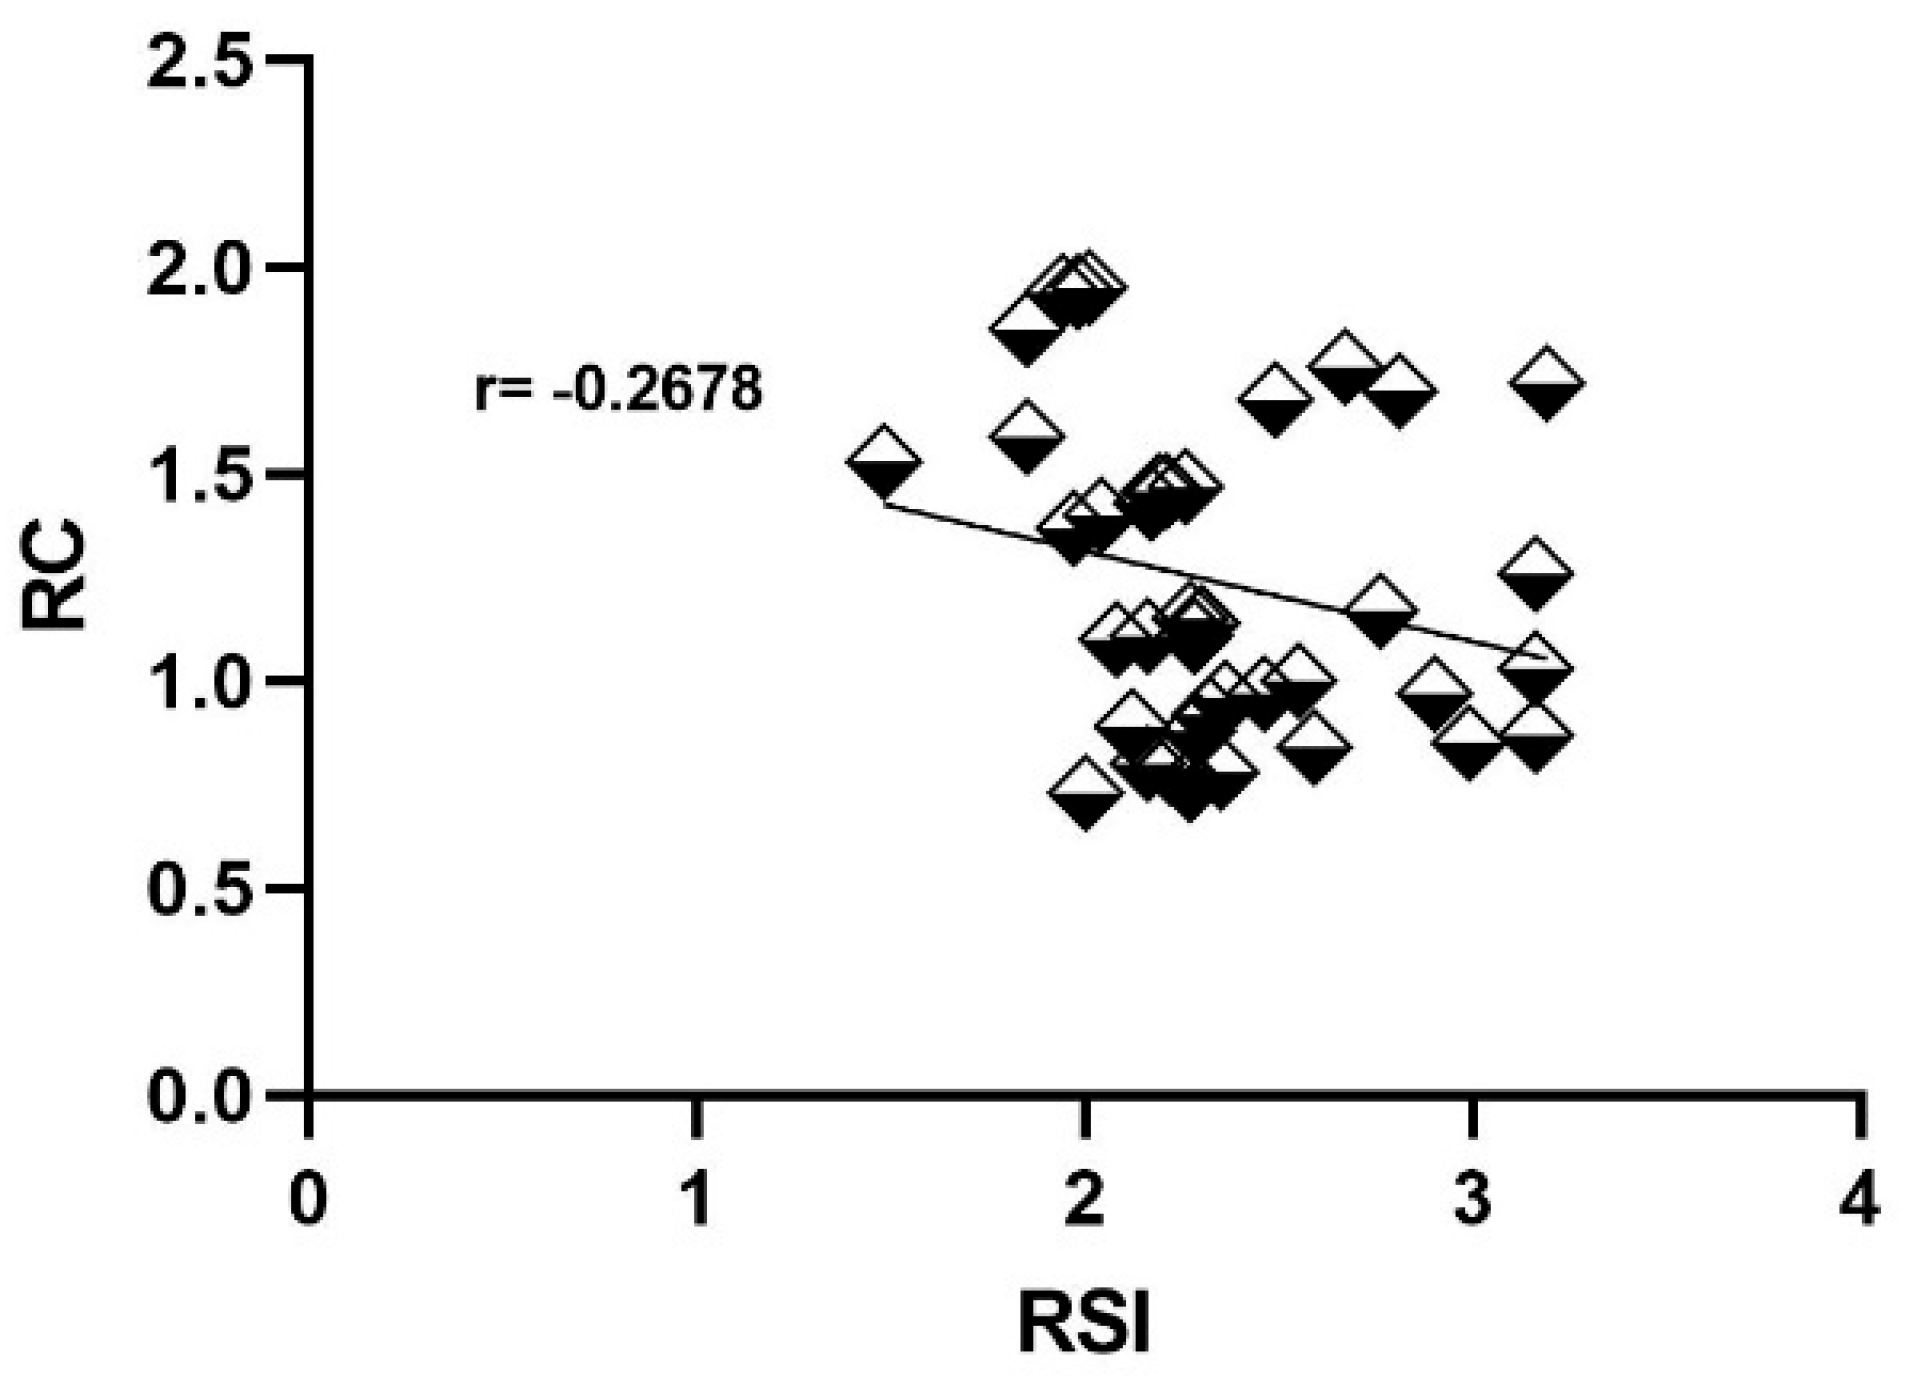
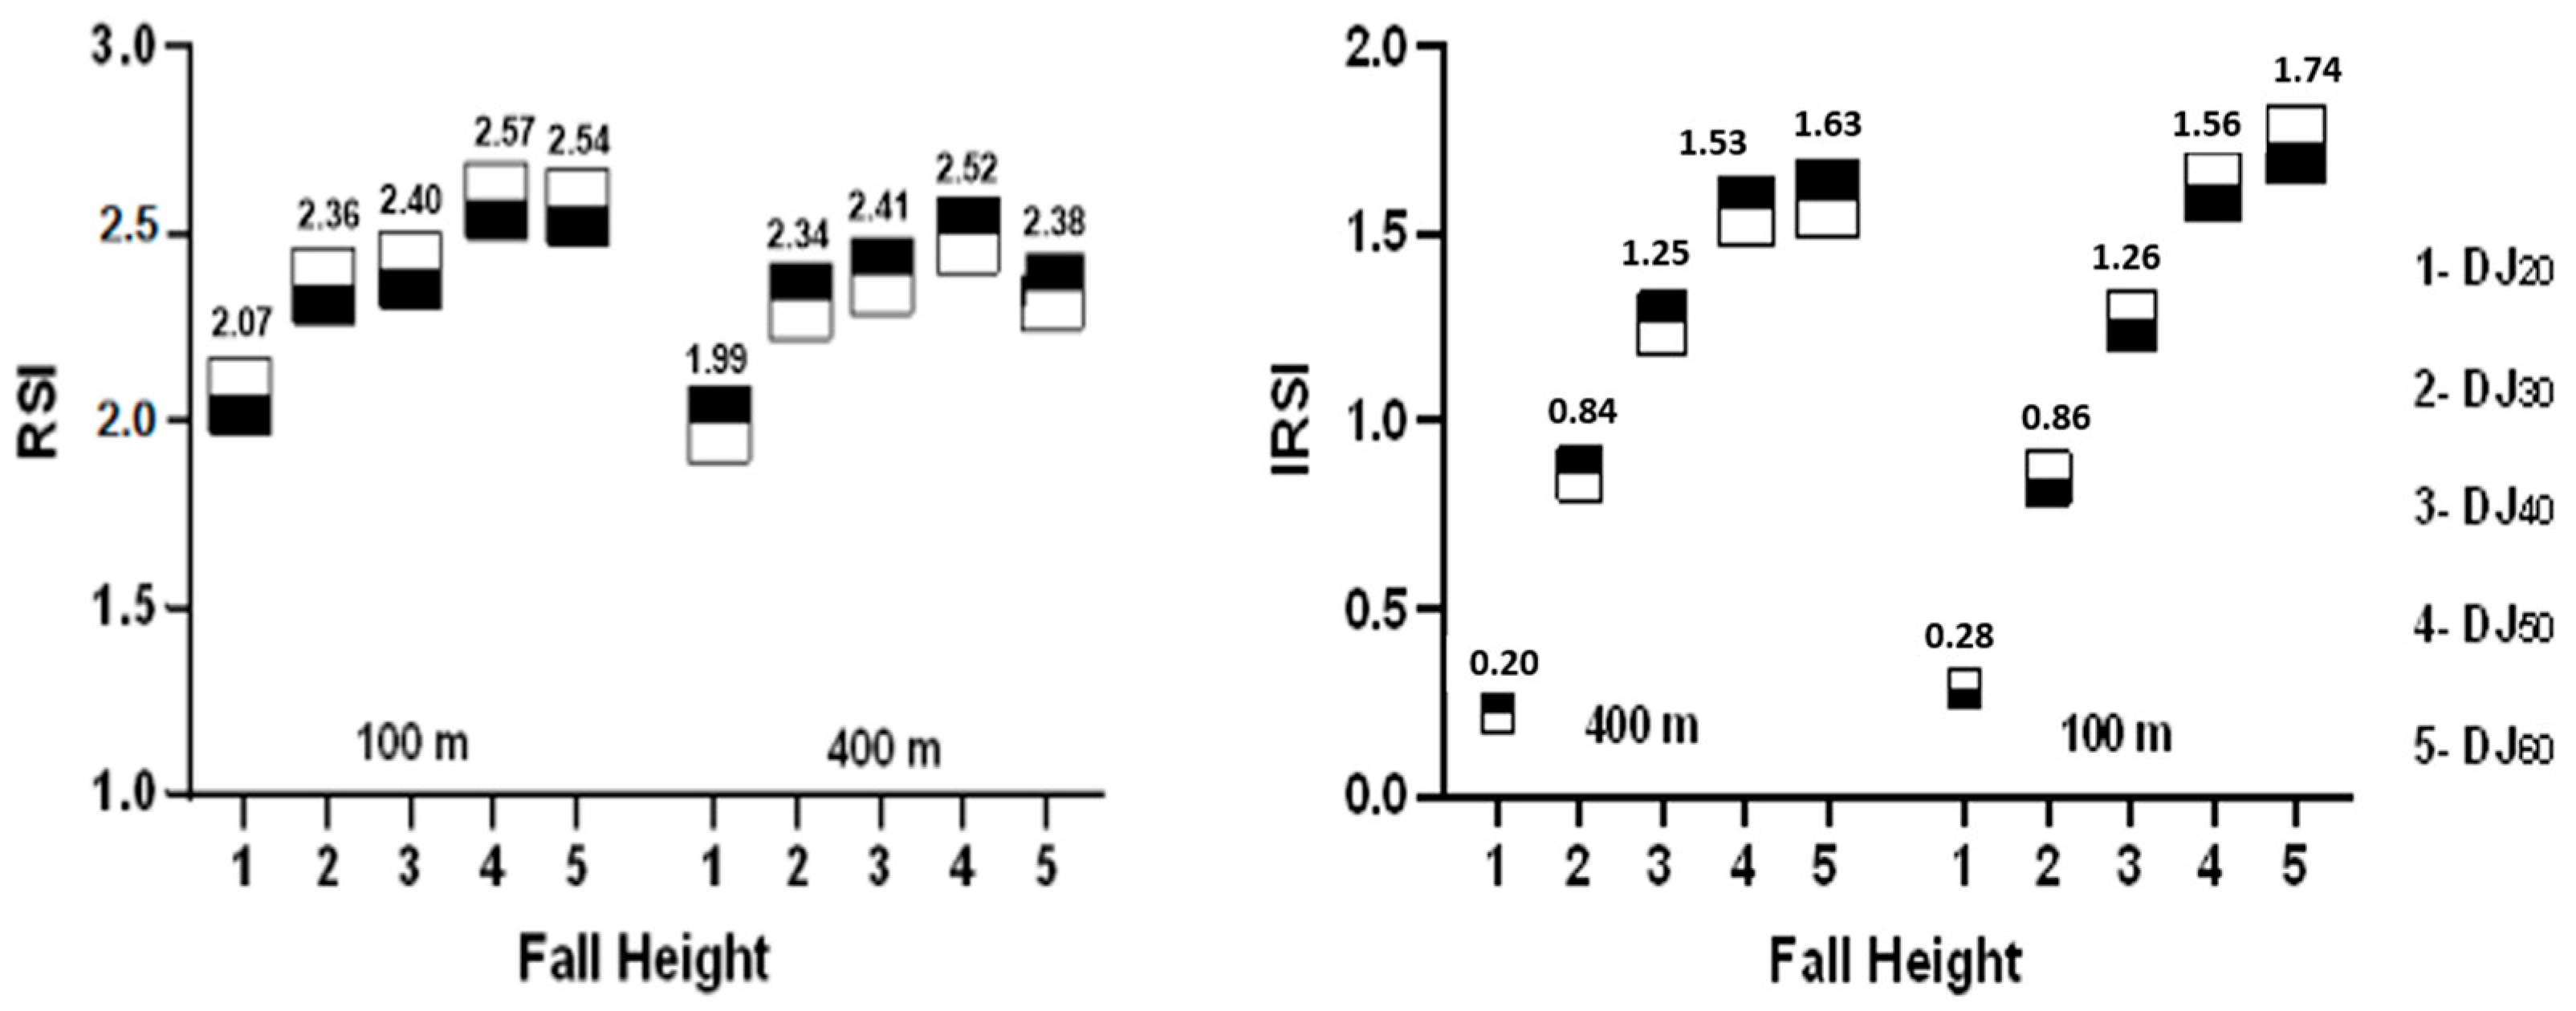
The correlation analysis showed a low correlation (r = −0.268; p = 0.04) between the RC with respect to the RSI (Figure 1), and a high correlation (r = 0.805; p = 0.02) between the RSI and the IRSI. Also, the integration of RC with the RSI allowed us to develop the IRSI, a more sensitive metric to detect changes in reactive force in relation to HF for the athletes (Figure 2).

Figure 1.
Results of Spearman’s correlation test between the RSI and RC variables. The y-axis represents the mean RC, and the x-axis represents the RSI variables.
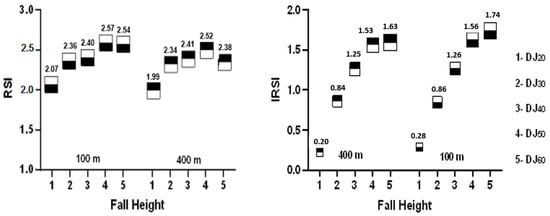
Figure 2.
The RSI (left) and IRSI (right) for each drop jump obtained in 100 m and 400 m sprinters. The y-axis represents either the mean RSI or IRSI, and the x-axis represents the different drop jumps (i.e., fall heights) for both groups.
4. Discussion
This study aimed to explore the following: (1) to test the correlation of a new variable denominated integral reactive strength index (IRSI) with the RSI, and (2) to compare the flight time, ground contact time, jump height, RSI, reactive capacity, and IRSI between Olympic athletes in 100 m and 400 m events. In the experimental approach, no differences in reactive strength variables were shown between the groups. Nevertheless, there are some differences in the magnitude of the effect size that need to be discussed. We also found a trend of RC decrease, when HF increases, as expected [16]. Although we found an inversely proportional trend of RC behavior with respect to the RSI in this study, the correlation between these variables was of small magnitude. This low correlation, and their inversely proportional trend, helped to explain the influence of RC on HF. To our knowledge, this is the first study to compare reactive strength variables from different heights in 100 m and 400 m dash sprinters.
Our data showed that it is possible to suggest the individualization of the most recommended drop heights to develop reactive strength in these sprinters, that is, those needed to maintain short ground contact times during sprinting [21]. Our results indicate that there are no differences between the groups (100 m vs. 400 m), so these sprinters could perform the same training strategies concerning reactive strength variables. This is explainable, as the current demands of a 400 m dash sprinter are not very different from those of a 100 m dash sprinter (Appendix A).
By analyzing separately the metrics that make up the reactive strength calculation (GCT and FT), we can observe that regarding FT, we found no significant differences between the groups. Even so, we observed that between DJ30–50, there is a trend that 100 m group sprinters show trivially better FT (ES ≤ 0.50) than 400 m sprinters (see Table 2). These effects tend to be slightly large between DJ50–60, where moderate effects are already observed (ES = 0.72). When examining the GCT, we also observed that between DJ30 and DJ50, the 100 m group tends to show an increment in this value relative to the 400 m group (ES DJ30 = 0.12; DJ40 = 0.33; DJ50 = 0.46, and DJ60 = 0.68). This may explain why the 100 m group improved their RSI during all HFs, while the 400 m group decreased their RSI in the DJ60.
There are criticisms of the reactive strength based on errors of measurement [2] that occurred during FT conducting to the overestimation of JH, which suggests a possible threat to the use of this marker [2]. However, due to the inherent high costs of the plyometric assessment, the reactive strength could be considered the most accessible plyometric variable for the coach monitoring plyometric performance [16]. Therefore, the 2–3 cm margin of error in JH does not limit it from being a useful control training tool, provided that the measurement methods and instruments are correctly standardized. In the same vein, although one study [10] recommends that it is impractical when working with large groups to individualize the HF and proposes a moderate HF (30 cm), this strategy may not be useful for high-level 100 m and 400 m sprinters. Accordingly, the aim of this training task variable is to show the maximum RSI associated with the highest HJ, to seek greater specificity [8] and magnitude of the adaptations [5]. The principle of specificity indicates that the way the athlete develops the plyometric activity will be decisive to the results of the athlete’s achievement [22]. Furthermore, higher HF increases neuromuscular pre-activation levels and the speed that can be generated in the eccentric phase, and thus increases the contractile potentiation mechanisms in muscles and tendons [9]. Likewise, two athletes jumping from the same HF may not be exposed to the same relative intensity [6]. These findings are consistent with other studies [3,23,24,25] that found no differences in changes in HJ and GCT variables for HFs between 30 and 60 cm.
Similarly, during the assessment of the RSI in one study [26], the researchers instructed athletes to maintain the GCT below 250 ms; otherwise, the repetition should be repeated. However, it was not considered that the RSI is highly modifiable, and it depends a lot on the technique. Athletes that showed a decrease in the contact time may compromise jump height [12,27]. This could explain the results of a study [12] with national and international sprinters that showed considerably good values for GCT but very poor values for JH and RSI performing a DJ30 (GCT = 0.170 ± 0.028; HJ = 0.340 ± 0.049; RSI = 2.06 ± 0.043). In the current study, athletes were asked to maintain the correct relationship between JH and GCT, as it was reported by others [8,27]. Following these indications, we found that both groups showed superior results in the RSI than previously reported with sprint athletes [12]. Although we did not find significant differences between the groups, the higher RSI value was founded in DJ50. We also report that, during DJ60, the 100 m group showed an RSI loss of only 0.3 m·s−1 relative to DJ50, while the 400 m group showed a loss of 0.14 m·s−1 for the same FH.
Based on two issues raised in the previous paragraphs, the following aspects obtain: (A) “To date, we have not found in the available literature a general accepted criterion to end the DJ tasks when the RSI drops in a determined value. (B) Furthermore, higher HF increases neuromuscular pre-activation levels and the speed that can be achieved in the eccentric phase, thus increasing the contractile potentiation mechanisms of muscles and tendons [9]”. In this sense, also, it may be implausible to accept that the reactive strength remains the same or relatively the same as the HF increases. The RSI orients us to stimulate the reactive strength on previously adapted zones and not on zones that could manifest a greater specificity for high-performance athletes [22]. Therefore, the integration of RC with the RSI allowed us to develop the IRSI, a more sensitive metric to detect changes in reactive force in relation to HF for the athletes (Figure 2).
It is well-known that an athlete can manifest the same RSI for different drop heights [9], and this should be taken as something other than correct. The IRSI could be an alternative solution in high-performance sports, specifically to train and measure the reactive strength during the DJ. The IRSI has its foundations in the HJ, HF, and GCT. Therefore, this variable informs about the increase in reactive strength as a function of HF. Thus, athletes who increase HF while maintaining the same GCT could slightly decrease HJ, not seeing the IRSI affected, in opposition to what occurred with the RSI. Similarly, athletes who show a slight increase in GCT but maintain HJ will not see the IRSI affected, opposite to the RSI. Between DJ50–60, the RSI can show a difference of only a 0.3 m·s−1 decline, as in the 100 m group, or a 0.14 m·s−1 decline, as in the case of the 400 m group (Table 2). There may need to be a sufficient reason to end the task when the IRSI shows that it still maintains an acceptable level of reactivity considering the HF (Figure 2). Another important issue of the IRSI use is that coaches can observe the critical zone of the reactive strength work. The critical zone of the IRSI could be established when their values are larger than 0.10 m·s−1 with a small ES, compared to the adjacent incremental HF.
In Figure 2, it is observed in each group that the DJ20–30, DJ30–40, and DJ40–50 sets present significant differences in the IRSI, and their effect sizes are large (ES > 0.80). This is not the case for DJ50–60, where in 400 m sprinters, no significant differences are observed between HF, and the effect sizes are very small (ES = 0.16). This could be considered a critical area of the IRSI. Therefore, we consider the IRSI a sensitive variable to access the decrease in reactive strength as a function of HF. The minimum loss in the values of this marker could be considered a criterion to end the task. According to our results, a minimum difference of 0.10 m·s−1 between two consecutive heights could be considered a critical point of the IRSI. However, this criterion should be further investigated in future work.
In summary, this study found no statistically significant differences between the 100 m and 400 m sprinters in reactive strength variables; nevertheless, there are some differences between the effects that trainers can consider. Furthermore, although the RSI is considered a widely used variable to measure reactive strength performance, the IRSI could be recommended as a more sensitive and accurate measure of reactive strength during the DJ to be applied in the training of elite sprinters.
Our work is not without limitations. The study was conducted solely with high-level competitive sprint athletes, and we acknowledge that these results may vary in other populations. Additionally, this study did not include data from female athletes; therefore, future researchers may be able to make such comparisons. Despite these limitations, we consider these comparisons of reactive strength variables with Olympic-level athletes to be a strength of our research, not only to increase the quality of the sample, but also to provide practical information to top-level coaches. Future lines of research can create criteria for the IRSI and create training programs that compare IRSI-based training versus traditional RSI programs.
5. Conclusions
The results of this study showed that there are no statistically significant differences in the reactive strength variables (FT, CGT, HJ, RC, RSI, and ISRI) between male 100 m and 400 m dash sprinters. Coaches of these sports’ specialties should take these criteria into account when developing plyometric programs and break the myth that 400 m athletes might be less reactive due to their specialty. These criteria could be manifested at another level of sports training, but this study refutes these criteria for high-level athletes in 100 m and 400 m dash sprinters. In addition, coaches and sports specialists could use the IRSI as a more comprehensive measure to detect changes in DJ training. The IRSI is a key variable in reactive strength because the higher the HF, the higher the landing speed, the greater the neuromuscular pre-activation, and the greater the dynamic load applied at the start of the eccentric phase. This measure tends to be more sensitive in detecting possible increases or decreases in reactive strength during the DJ, as it includes the HF effect.
Author Contributions
Conceptualization, R.M.-B. and L.R.; methodology, R.M.-B., L.R. and H.S.; validation, M.T.E.-G., H.S. and R.M.-B.; formal analysis, R.M.-B., L.R., A.C. and P.M.S.; investigation, R.M.-B.; resources, R.M.-B.; data curation, M.T.E.-G., A.C. and P.M.S.; writing—original draft preparation, R.M.-B.; writing—review and editing, L.R. and M.T.E.-G.; visualization, L.R. and M.T.E.-G.; supervision, L.R. All authors have read and agreed to the published version of the manuscript.
Funding
This research received no external funding.
Institutional Review Board Statement
The study was conducted following the Declaration of Helsinki (October 2013) and approved by the Institutional Ethics Committee of the Faculty of Sport Sciences and Physical Education of the University of Coimbra (code-CE/FCDEF-UC/00802021 6 July 2021) for studies involving humans.
Informed Consent Statement
Written informed consent has been obtained from the athletes to publish this paper.
Data Availability Statement
The datasets presented in this article are not readily available because they are strictly protected because they involve athletes in preparation for the Paris 2024 Olympic Games. Requests to access the datasets should be directed to author.
Acknowledgments
R.M-B. and L.R. are research members of CIDAF, and are grateful for the support of the Fundação para a Ciência e a Tecnologia (DOI 10.54499/UIDP/04213/2020).
Conflicts of Interest
The authors declare no conflicts of interest.
Appendix A
Table A1.
Times per 100 m of the 400 m runners in the last athletics World Championships.
Table A1.
Times per 100 m of the 400 m runners in the last athletics World Championships.
| Athlete | 100 m | 200 m | 300 m | 400 m |
|---|---|---|---|---|
| Top1 | 11.16 | 10.13 | 11.05 | 12.31 |
| Top2 | 11.45 | 10.30 | 10.98 | 12.04 |
| Top3 | 11.25 | 10.21 | 11.49 | 11.89 |
| Top4 | 11.10 | 10.29 | 11.10 | 12.39 |
| Top5 | 11.33 | 10.28 | 11.18 | 12.25 |
| Top6 | 11.63 | 10.72 | 11.51 | 11.84 |
| Top7 | 11.66 | 10.82 | 11.37 | 12.06 |
References
- Potach, D.H.; Chu, D.A. Essentials of strength training and conditioning. In Plyometric Training, 3rd ed.; Baechle, T.R., Earle, R.W., Eds.; Human Kinetics: Champaign, IL, USA, 2008; pp. 413–456. [Google Scholar]
- Zatsiorsky, V.M.; Kraemer, W.J.; Fry, A.C. Science and Practice of Strength Training, 3rd ed.; Human Kinetics: Champaign, IL, USA, 2021. [Google Scholar]
- Bobbert, M.F.; Huijing, P.A.; van Ingen Schenau, G.J. Drop jumping. II. The influence of dropping height on the biomechanics of drop jumping. Med. Sci. Sports Exerc. 1987, 19, 339–346. [Google Scholar] [CrossRef]
- Bobbert, M.F.; Huijing, P.A.; van Ingen Schenau, G.J. Drop jumping. I. The influence of jumping technique on the biomechanics of jumping. Med. Sci. Sports Exerc. 1987, 19, 332–338. [Google Scholar] [CrossRef]
- Young, W. Laboratory strength assessment of athletes. New Stud. Athl. 1995, 10, 89. [Google Scholar]
- Byrne, D.J.; Browne, D.T.; Byrne, P.J.; Richardson, N. Interday Reliability of the Reactive Strength Index and Optimal Drop Height. J. Strength Cond. Res. 2017, 31, 721–726. [Google Scholar] [CrossRef]
- Flanagan, E.P.; Ebben, W.P.; Jensen, R.L. Reliability of the Reactive Strength Index and Time to Stabilization during Depth Jumps. J. Strength Cond. Res. 2008, 22, 1677–1682. [Google Scholar] [CrossRef] [PubMed]
- Ebben, W.P.; Petushek, E.J. Using the reactive strength index modified to evaluate plyometric performance. J. Strength Cond. Res. 2010, 24, 1983–1987. [Google Scholar] [CrossRef] [PubMed]
- Flanagan, E.P.; Comyns, T.M. The Use of Contact Time and the Reactive Strength Index to Optimize Fast Stretch-Shortening Cycle Training. Strength Cond. J. 2008, 30, 32–38. [Google Scholar] [CrossRef]
- Ramirez-Campillo, R.; Alvarez, C.; Garcia-Pinillos, F.; Sanchez-Sanchez, J.; Yanci, J.; Castillo, D.; Loturco, I.; Chaabene, H.; Moran, J.; Izquierdo, M. Optimal Reactive Strength Index: Is It an Accurate Variable to Optimize Plyometric Training Effects on Measures of Physical Fitness in Young Soccer Players? J. Strength Cond. Res. 2018, 32, 885–893. [Google Scholar] [CrossRef]
- Haynes, T.; Bishop, C.; Antrobus, M.; Brazier, J. The validity and reliability of the My Jump 2 app for measuring the reactive strength index and drop jump performance. J. Sports Med. Phys. Fit. 2019, 59, 253–258. [Google Scholar] [CrossRef]
- Healy, R.; Kenny, I.C.; Harrison, A.J. Reactive Strength Index: A Poor Indicator of Reactive Strength? Int. J. Sports Physiol. Perform. 2018, 13, 802–809. [Google Scholar] [CrossRef]
- Brumitt, J.; Heiderscheit, B.C.; Manske, R.C.; Niemuth, P.E.; Rauh, M.J. Off-season training habits and preseason functional test measures of division iii collegiate athletes: A descriptive report. Int. J. Sports Phys. Ther. 2014, 9, 447–455. [Google Scholar]
- Arnason, A.; Sigurdsson, S.B.; Gudmundsson, A.; Holme, I.; Engebretsen, L.; Bahr, R. Physical fitness, injuries, and team performance in soccer. Med. Sci. Sports Exerc. 2004, 36, 278–285. [Google Scholar] [CrossRef] [PubMed]
- Louder, T.; Thompson, B.J.; Banks, N.; Bressel, E. A Mixed-Methods Approach to Evaluating the Internal Validity of the Reactive Strength Index. Sports 2019, 7, 157. [Google Scholar] [CrossRef] [PubMed]
- Verkhoshansky, Y. Todo Sobre el Metodo Pliométrico; Paidotribo: Barcelona, Spain, 2006; p. 187. [Google Scholar]
- Loturco, I.; Gil, S.; Laurino, C.F.D.; Roschel, H.; Kobal, R.; Abad, C.C.C.; Nakamura, F.Y. Differences in Muscle Mechanical Properties between Elite Power and Endurance Athletes: A Comparative Study. J. Strength Cond. Res. 2015, 29, 1723–1728. [Google Scholar] [CrossRef] [PubMed]
- Ramirez-Campillo, R.; Meylan, C.; Alvarez, C.; Henriquez-Olguin, C.; Martinez, C.; Canas-Jamett, R.; Andrade, D.C.; Izquierdo, M. Effects of In-Season Low-Volume High-Intensity Plyometric Training on Explosive Actions and Endurance of Young Soccer Players. J. Strength Cond. Res. 2014, 28, 1335–1342. [Google Scholar] [CrossRef]
- Montoro-Bombú, R.; de la Paz Arencibia, L.; Buzzichelli, C.; Miranda-Oliveira, P.; Fernandes, O.; Santos, A.; Rama, L. The Validity of the Push Band 2.0 on the Reactive Strength Index Assessment in Drop Jump. Sensors 2022, 22, 4724. [Google Scholar] [CrossRef] [PubMed]
- Montoro-Bombu, R.; Field, A.; Santos, A.C.; Rama, L. Validity and reliability of the Output sport device for assessing drop jump performance. Front. Bioeng. Biotechnol. 2022, 10, 1015526. [Google Scholar] [CrossRef] [PubMed]
- Healy, R.; Smyth, C.; Kenny, I.C.; Harrison, A.J. Influence of Reactive and Maximum Strength Indicators on Sprint Performance. J. Strength Cond. Res. 2019, 33, 3039–3048. [Google Scholar] [CrossRef] [PubMed]
- Walshe, A.D.; Wilson, G.J.; Ettema, G.J. Stretch-shorten cycle compared with isometric preload: Contributions to enhanced muscular performance. J. Appl. Physiol. 1998, 84, 97–106. [Google Scholar] [CrossRef]
- Read, M.M.; Cisar, C. The influence of varied rest interval lengths on depth jump performance. J. Strength Cond. Res. 2001, 15, 279–283. [Google Scholar]
- Walsh, M.; Arampatzis, A.; Schade, F.; Bruggemann, G.P. The effect of drop jump starting height and contact time on power, work performed, and moment of force. J. Strength Cond. Res. 2004, 18, 561–566. [Google Scholar] [PubMed]
- Kipp, K.; Kiely, M.T.; Giordanelli, M.D.; Malloy, P.J.; Geiser, C.F. Biomechanical Determinants of the Reactive Strength Index During Drop Jumps. Int. J. Sports Physiol. Perform. 2018, 13, 44–49. [Google Scholar] [CrossRef] [PubMed]
- Ramirez-Campillo, R.; Moran, J.; Drury, B.; Williams, M.; Keogh, J.W.; Chaabene, H.; Granacher, U. Effects of Equal Volume But Different Plyometric Jump Training Intensities on Components of Physical Fitness in Physically Active Young Males. J. Strength Cond. Res. 2019, 35, 1916–1923. [Google Scholar] [CrossRef] [PubMed]
- Newton, R.U.; Dugan, E. Application of strength diagnosis. Strength Cond. J. 2002, 24, 50–59. [Google Scholar] [CrossRef]
Disclaimer/Publisher’s Note: The statements, opinions and data contained in all publications are solely those of the individual author(s) and contributor(s) and not of MDPI and/or the editor(s). MDPI and/or the editor(s) disclaim responsibility for any injury to people or property resulting from any ideas, methods, instructions or products referred to in the content. |
© 2024 by the authors. Licensee MDPI, Basel, Switzerland. This article is an open access article distributed under the terms and conditions of the Creative Commons Attribution (CC BY) license (https://creativecommons.org/licenses/by/4.0/).