Article

Spatio-Temporal Analysis of Surface Urban Heat Island and Canopy Layer Heat Island in Beijing

School of Geosciences and Surveying and Mapping Engineering, China University of Mining and Technology (Beijing), Beijing 100083, China
*
Author to whom correspondence should be addressed.
Appl. Sci. 2024, 14(12), 5034; https://doi.org/10.3390/app14125034
Submission received: 3 April 2024 / Revised: 30 May 2024 / Accepted: 7 June 2024 / Published: 10 June 2024
(This article belongs to the Section Applied Thermal Engineering)

Abstract

:
Studying urban heat islands holds significance for the sustainable development of cities. This comprehensive study analyzed the temporal characteristics of a Surface Urban Heat Island and Canopy Layer Heat Island by employing Moderate-Resolution Imaging Spectroradiometer image data spanning from 2003 to 2020 over Beijing, China. Leveraging the Gaussian capacity model, the geometrical characteristics of the Surface Urban Heat Island and Canopy Layer Heat Island, such as intensity, center, direction, and range, were examined among three different timescales of day, month, and year. Results indicate that the intensities of the Surface Urban Heat Island and Canopy Layer Heat Island tend to have bigger seasonal variations during winter nights and summer daytime. In addition, at night the centers of Surface Urban Heat Island and Canopy Layer Heat Island are mainly concentrated in the range of 116.3°~116.4° E in longitude and 39.90°~39.95° N in latitude, while during the daytime they are more scattered, mainly in the range of 116.2°~116.5° E in longitude and 39.7°~40.0° N in latitude. In the hot season, the center of the heat island moves east to north, while in the cold season it moves west to south. Monthly average ellipse areas of Surface Urban Heat Island and Canopy Layer Heat Island vary more during the day than that at night, the maximum daytime differences were 2662 km2 and 2293 km2, while the maximum nighttime differences were 484 km2 and 265 km2. Overall, the average area is increasing, with the heat island center moving eastward and deflecting towards the northeast-southwest direction. The expansion of urban areas will continue to influence the movement and extent of heat islands. The study offers insights to inform strategies for mitigating urban heat islands.

1. Introduction

With the rapid development of cities, the heat island effect [1,2] is becoming increasingly significant and endangering people’s health [3,4]. With urban residents’ living standards improving, people are demanding a healthy living environment. The heat island effect is therefore an increasingly important issue in the process of urban development. Studying the temporal and spatial distribution characteristics of the urban heat islands can provide guidance for the construction of the urban public environment. This information can be used to inform the future city planning for a sustainable and healthy development.
Remote sensing has the advantages of continuous monitoring of heat island effects over both time and large-scale space with finer and finer spatial details. The radiant brightness temperature measured at the thermal infrared wavelength is usually combined with surface-specific emissivity and other parameters to obtain accurate surface temperature products. Currently, Surface Urban Heat Islands (SUHIs) and Canopy Layer Heat Islands (CLHIs) have been widely studied relative to the surface temperature over city areas [5,6,7,8]. The SUHI, which characterizes temperature variations at the surface, exhibits a profound correlation with material types and urban surface orientation relative to the sun. On the other hand, the CLHI pertains to the warming of urban air specifically within the layer extending from the ground to the rooftops of buildings and city trees. When assessing its impact on health, ambient temperature may emerge as a more crucial factor compared to surface temperature [9,10]. From the two types of data sources of the urban heat island, the CLHI is usually calculated based on the temperature data obtained from weather stations or mobile temperature measurement vehicles, while the SUHI is studied through the surface temperature obtained by inverting remote sensing data. In terms of the correlation between the two types of temperature data, in addition to comparative studies, researchers have also proposed various methods for estimating temperature using satellite remote sensing data [11,12,13].
In terms of the formation of CLHIs and SUHIs, surface temperature has an important impact on the air temperature at the height of the shutter. The fundamental difference between air temperature and surface temperature is that surface temperature is the temperature at the surface and the atmosphere, that is, the solid–gas interface, while air temperature is pure gas phase temperature. The calculation of heat island intensity is usually obtained by the difference in temperature. The difference between surface temperature and air temperature leads to the difference between an SUHI and CLHI [14,15]. The spatial structure of urban heat islands is one of the main research topics in remote sensing applications. Many scholars have analyzed the pattern and form [16,17], change process [16,18], and influencing factors [19,20] of urban heat islands through observations from remote sensing sensors of Advanced Very High Resolution Radiometer (AVHRR), Moderate-Resolution Imaging (MODIS), Enhanced Thematic Mapper Plus (ETM+), and so on. Studies on the spatial changes of urban heat islands have mainly used correlation analysis [21], the section line method [22], the triangle method [23], and the fractal method [24]. Streutker [25] fitted the spatial distribution of urban heat islands to a Gaussian surface and found that urban heat island size was negatively correlated with rural temperature, but the spatial extent was independent of both levels, providing new perspectives for exploring the spatial trend and continuity of urban heat islands. In subsequent research, this method was called the Gaussian capacity model. Through the Gaussian capacity model, urban heat island research can be carried out in respect of the strength, center, range, and direction of heat islands, and it can quantitatively analyze and describe the change characteristics of urban heat islands through model parameters. For example, Okumus, D. E. and F. Terzi [7] established a heat island capacity model based on MODIS data and found that no obvious heat islands were documented during the season of spring, autumn, and winter. The heat island phenomenon was more significant at night, and it was most pronounced in winter. The effect was weakest in summer; the summer heat island phenomenon was more pronounced during the day than at night. Quan et al. [8] used MODIS data to study SUHIs in Beijing from 2000 to 2012 based on the Gaussian capacity model and analyzed the temporal and spatial variation in the intensity and center of SUHIs over a long time-series. Based on MODIS data, Pichierri et al. [26] studied CLHIs in Milan during the summer of 2007–2010 and found that the CLHI intensity was 3–4 K at night and weaker during the day, and the authors concluded that vegetation effectively reduced the urban heat island effect. Anniballe et al. [27] used MODIS data to compare SUHIs and CLHIs in Milan from 2007 to 2010 in terms of heat island intensity, range, and direction. They found that, during the day, the peak of SUHI intensity reached 9–10 K, while CLHI mostly did not. At night, the SUHI and CLHI intensities were both 3–4 K and showed similar features. The distributions of SUHIs and CLHIs were both negatively correlated with Normalized Vegetation Index (NDVI), indicating that the urban heat island effect was effectively weakened in areas with high vegetation coverage.
Up to now, a lot of studies have focused on estimating canopy heat island and surface heat island on a large scale, but the comparison between canopy and surface islands is relatively scarce. Beijing, as the capital of China, is also one of the cities with the highest level of urbanization in China. The separate studies on canopy heat islands and surface heat islands in Beijing have also experienced a long period of development, but there is still a blank in the field of the comparison of the two types of heat island [28,29].
Accordingly, this study focuses on Beijing, employing MODIS geo-temperature image data spanning from 2003 to 2020. The Gaussian capacity model was then utilized to meticulously analyze the data, modeling the heat islands. A comprehensive comparison of the model parameters was conducted to assess changes in the intensity, center, direction, and range of both SUHI and CLHI across three timescales: day, month, and year.
The objective of this study is threefold. First, the aim is to identify and analyze the temporal characteristics of the SUHI and CLHI in Beijing. Secondly, we attempt to compare and contrast the changes in these heat islands over the period 2003–2020, highlighting any significant trends or differences. Finally, we aim to inform construction strategies for mitigating the adverse effects of urban heat islands and urban development.

2. Materials and Methods

2.1. Study Area and Data

Beijing is located in the northern part of the North China Plain with a total area of 16,410.54 km2, corresponding to a bounding box from 115.7° to 117.4° E and from 39.4° to 41.6° N. The terrain DEM is higher in the northwest than that in the southeast. The elevation is 20–60 m with an average of 43 m; the area has a typical northern temperate semi-humid continental monsoon climate, with a high temperature and rain in summer, a cold and dry winter, and a short duration of spring and autumn.
In this study, MODIS surface temperature images (MOD11A1 and MYD11A1) were mainly used from 2003 to 2020 with a spatial resolution of 1 km, and a total of 12 observational variables, including diurnal and nocturnal surface temperature data, quality assessment data, date of observation, and temperature products were used. The NDVI data were used with the MODIS (MYD13Q1) data, and the land use data with data derived from the China Land Cover Dataset (CLCD) (10.5194/essd-13-3907-2021).

2.2. Methodology

To better measure the range and intensity of heat islands and to visualize the changes of heat islands, this paper established a Gaussian model to obtain the intensity and spatial range of urban heat islands through the remote sensing measurements. In this paper, the heat island of Beijing was mainly analyzed over urban and suburban areas. According to the definition of an urban heat island, the pixel threshold of the heat island was taken as the average surface temperature of the suburban area plus 1 °C [17]. For the measurement of urban heat island parameters, the least squares method was used to approximate the heat island surface to a Gaussian surface [25]. In this paper, IDL (Interactive Data Language) programming was used to build the model with the following Equation (1):
T x , y = T 0 x , y + a 0 exp x x 0 c o s + y y 0 s i n 2 2 a x 2 x x 0 s i n y y 0 c o s 2 2 a y 2
where x , y represents the latitude and longitude at a certain location; T x , y and T 0 x , y represent the urban temperature and background temperature, respectively; a 0 represents the maximum temperature difference between the urban and suburban areas; x 0 , y 0 represents the latitude and longitude of the center of the heat island footprint ellipse; a x and a y represent the semi-major and semi-minor axes of the heat island footprint ellipse; and is the acute angle between the direction of the major semi-axis of the heat island footprint ellipse and the positive direction of the x-axis, which represents the heat island direction.
The Gaussian surface and the background temperature surface form a closed body, and the geometric center of gravity of the closed body is defined as the center of gravity of the heat island. Considering the symmetry of the Gaussian surface, the coordinates of the geometric center of gravity of the closed body projected onto the horizontal plane are x 0 , y 0 , the z-axis z 0 ( x 0 _, y 0 _) of the center of gravity of the heat island, and the direction of the heat island is . The z-axis coordinate z 0 is not related to the plane coordinates x 0 , y 0 . Therefore, in order to facilitate the calculation of the z-axis coordinate z 0 of the center of gravity of the heat island, the Gaussian capacity model is simplified to Equation (2), and the calculation equation of z 0 is shown in Equation (3) [8]:
z x , y = a 0 exp x 2 2 a x 2 y 2 2 a y 2
z 0 = Ω z ρ d v Ω ρ d v
Combined with Formula (1), the parameters to be calculated in the Gaussian capacity model are a 0 , x 0 , y 0 , a x , a y , , and z 0 , which are obtained by least-squares fitting through IDL programming. z 0 is defined as the heat island intensity of the Gaussian capacity model, and x 0 , y 0 , z 0 represents the center of gravity of the heat island (longitude, latitude, and heat island intensity).

3. Results and Analysis

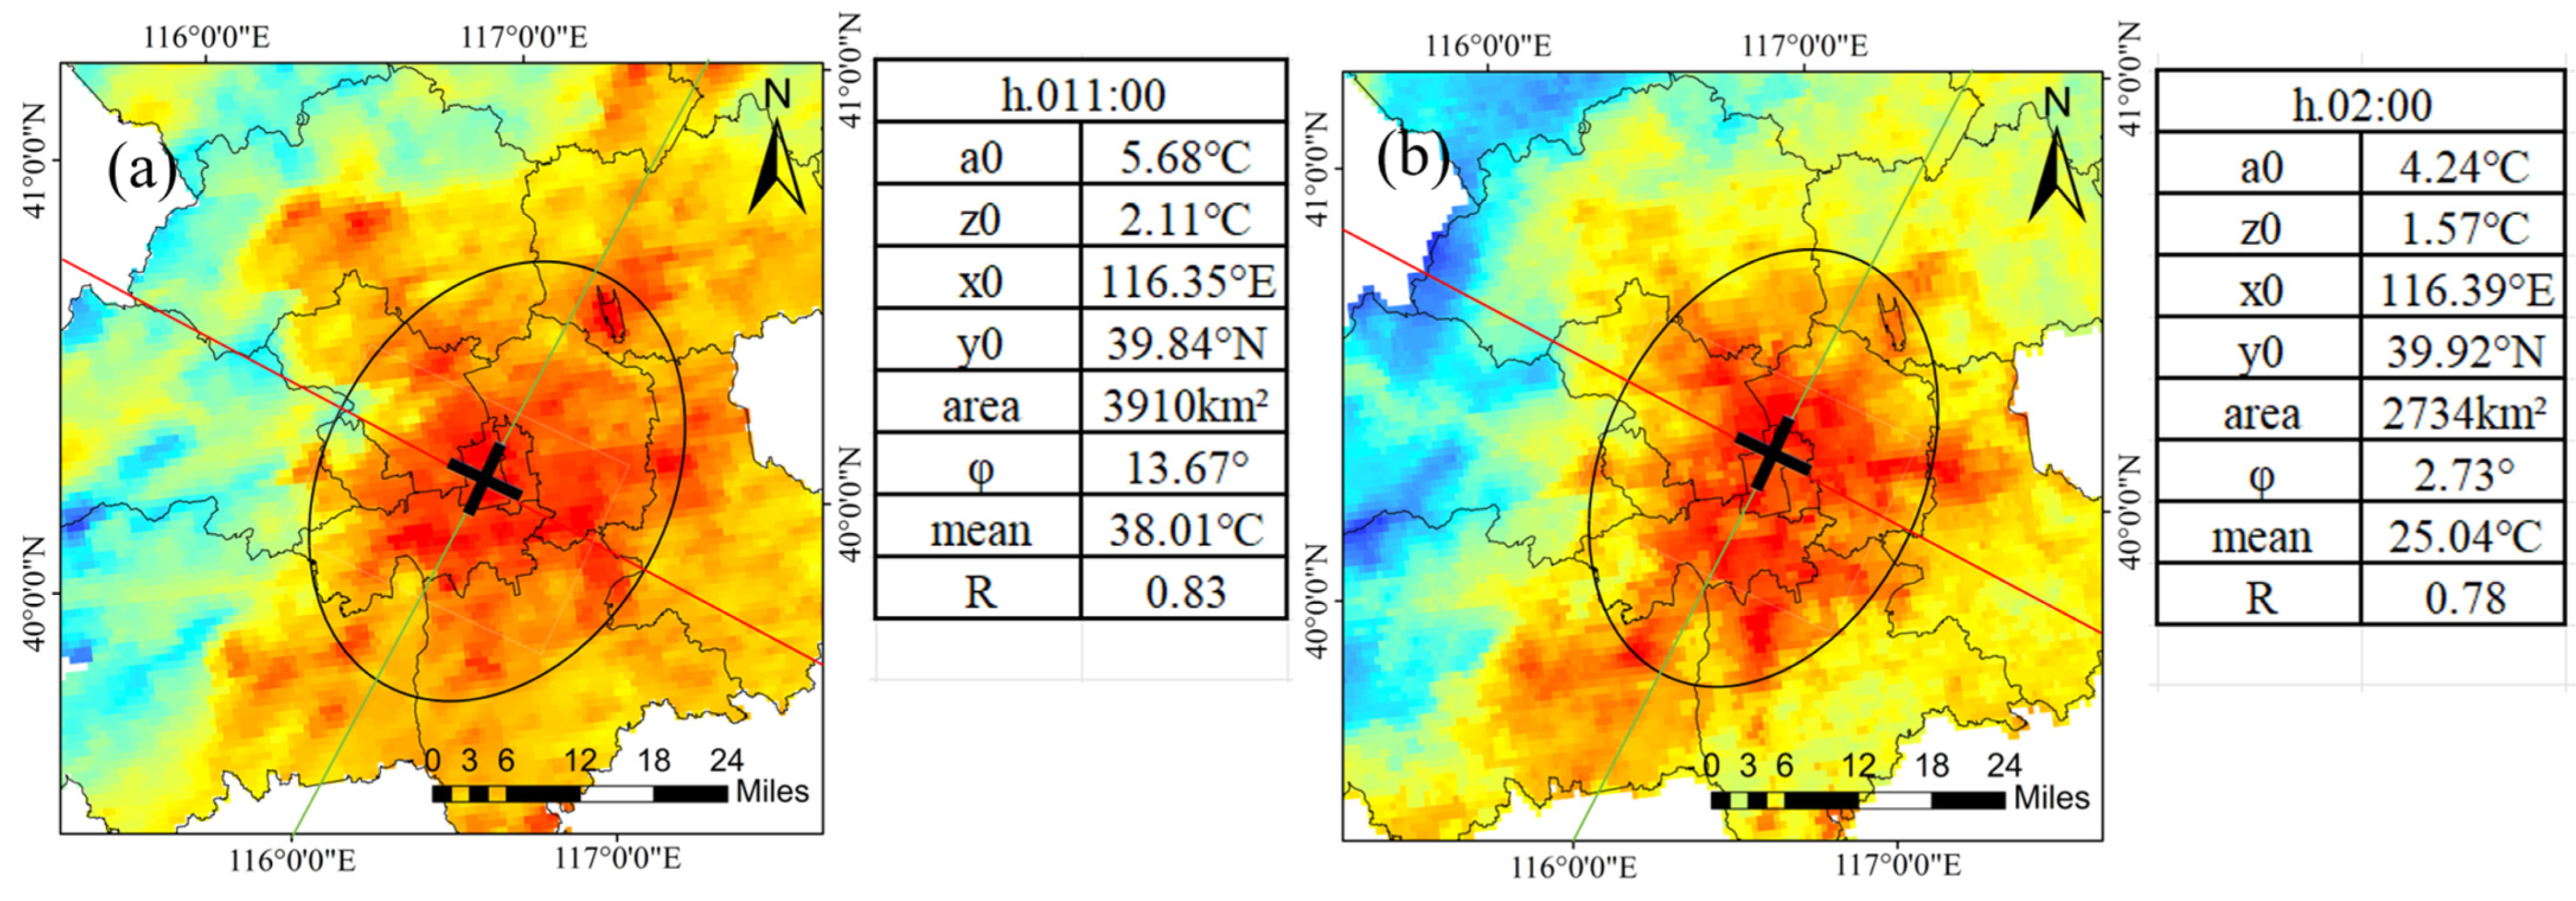
3.1. Gaussian Capacity Modeling Results

Using the above Gaussian flux model equation, land surface temperature and air temperature images captured on 5 September 2020 were used in this study. The SUHI and CLHI distribution maps at typical times of day and night were drawn, and their Gaussian capacity model parameters (at 11:00 in the day and 02:00 at night as examples) were determined. The results are shown in Figure 1 and Figure 2.
In the heat island distribution map, red indicates a higher temperature, while blue indicates lower temperatures. To facilitate a more intuitive understanding of the inversion results of the Gaussian capacity model, the heat island center x 0 , y 0 is taken as the center, a x and a y are the major semi-axis (red line) and minor semi-axis (green line), and is the major semi-axis. The heat island footprint ellipse is drawn in the heat island distribution diagram at an angle with the horizontal direction. Figure 1 and Figure 2 show that (1) the intensity of the SUHI and CLHI is strong during the daytime and relatively weak at night, and this pattern is also consistent with the suburban background temperatures of the SUHI and CLHI at the same transit time. (2) The centers of the heat islands of the SUHI and CLHI are closer at night and differ more during the day; the elliptical areas of the heat island footprints of the two also show the same pattern, which are larger during the day than at night. (3) The directions of the heat islands of the SUHI and CLHI are closer at the same transit time because the temperature mainly comes from the surface radiation. Although there are some differences in the parameters of the Gaussian capacity models of the SUHI and CLHI, the two are not very different and are close to each other, which is in consistent with the general rule.

3.2. Analysis of the Characteristics of Urban Heat Island Changes

3.2.1. Daily Time Scale

The daily intensities of the SUHI and CLHI, as well as the distribution of the heat island center’s latitude and longitude at the four transit times from 2003 to 2020, are depicted in Figure 3. It can be observed from Figure 3 that the nighttime intensity of the SUHI and CLHI is strongest in winter and the daytime in summer. The intensity of the SUHI and CLHI at night is mainly distributed in the range of 1.0–3.0 °C; the daytime intensity of the SUHI is distributed in the range of 1.0–3.3 °C, and that of the CLHI is distributed in the range of 0.5–2.1 °C, indicating that the daytime intensity of the SUHI is stronger than that of the CLHI. Moreover, the longitude and latitude of the footprint ellipse centers of the daytime SUHI and CLHI from 2003 to 2020 are relatively scattered. The longitude is mainly distributed in 116.2–116.4° E, and the latitude is mainly distributed in 39.7–40.0° N. At night, the longitude and latitude of the center of the heat island footprint ellipse are more concentrated, and the range of change is smaller than in the day. The longitude is mainly distributed in 116.3–116.4° E, and the latitude is mainly distributed in 39.90–39.95° N. At the same transit times, the standard deviations of the latitudes of the ellipse centers of SUHI and CLHI are both smaller than those of the longitude, indicating that the changes in the centers of the ellipses of SUHI and CLHI in the east–west direction were greater than those in the north–south direction between 2003 and 2020. This may be attributed to the influence of the sun rising in the east and setting in the west.
The distribution of the daily SUHI and CLHI footprint ellipse area and direction from 2003 to 2020 are shown in Figure 4. The results show that the elliptical area and direction of the SUHI and CLHI footprints vary greatly during the day. The area of the heat island footprint ellipse is distributed in the range 1000–5000 km2, and the direction of the heat island is between −20° and 40°. At night, the ellipse area of the heat island footprint and the direction of the heat island are more concentrated. The ellipse area is mainly 1000–2000 km2, and the direction of the heat island is mainly between −20° and 20°.

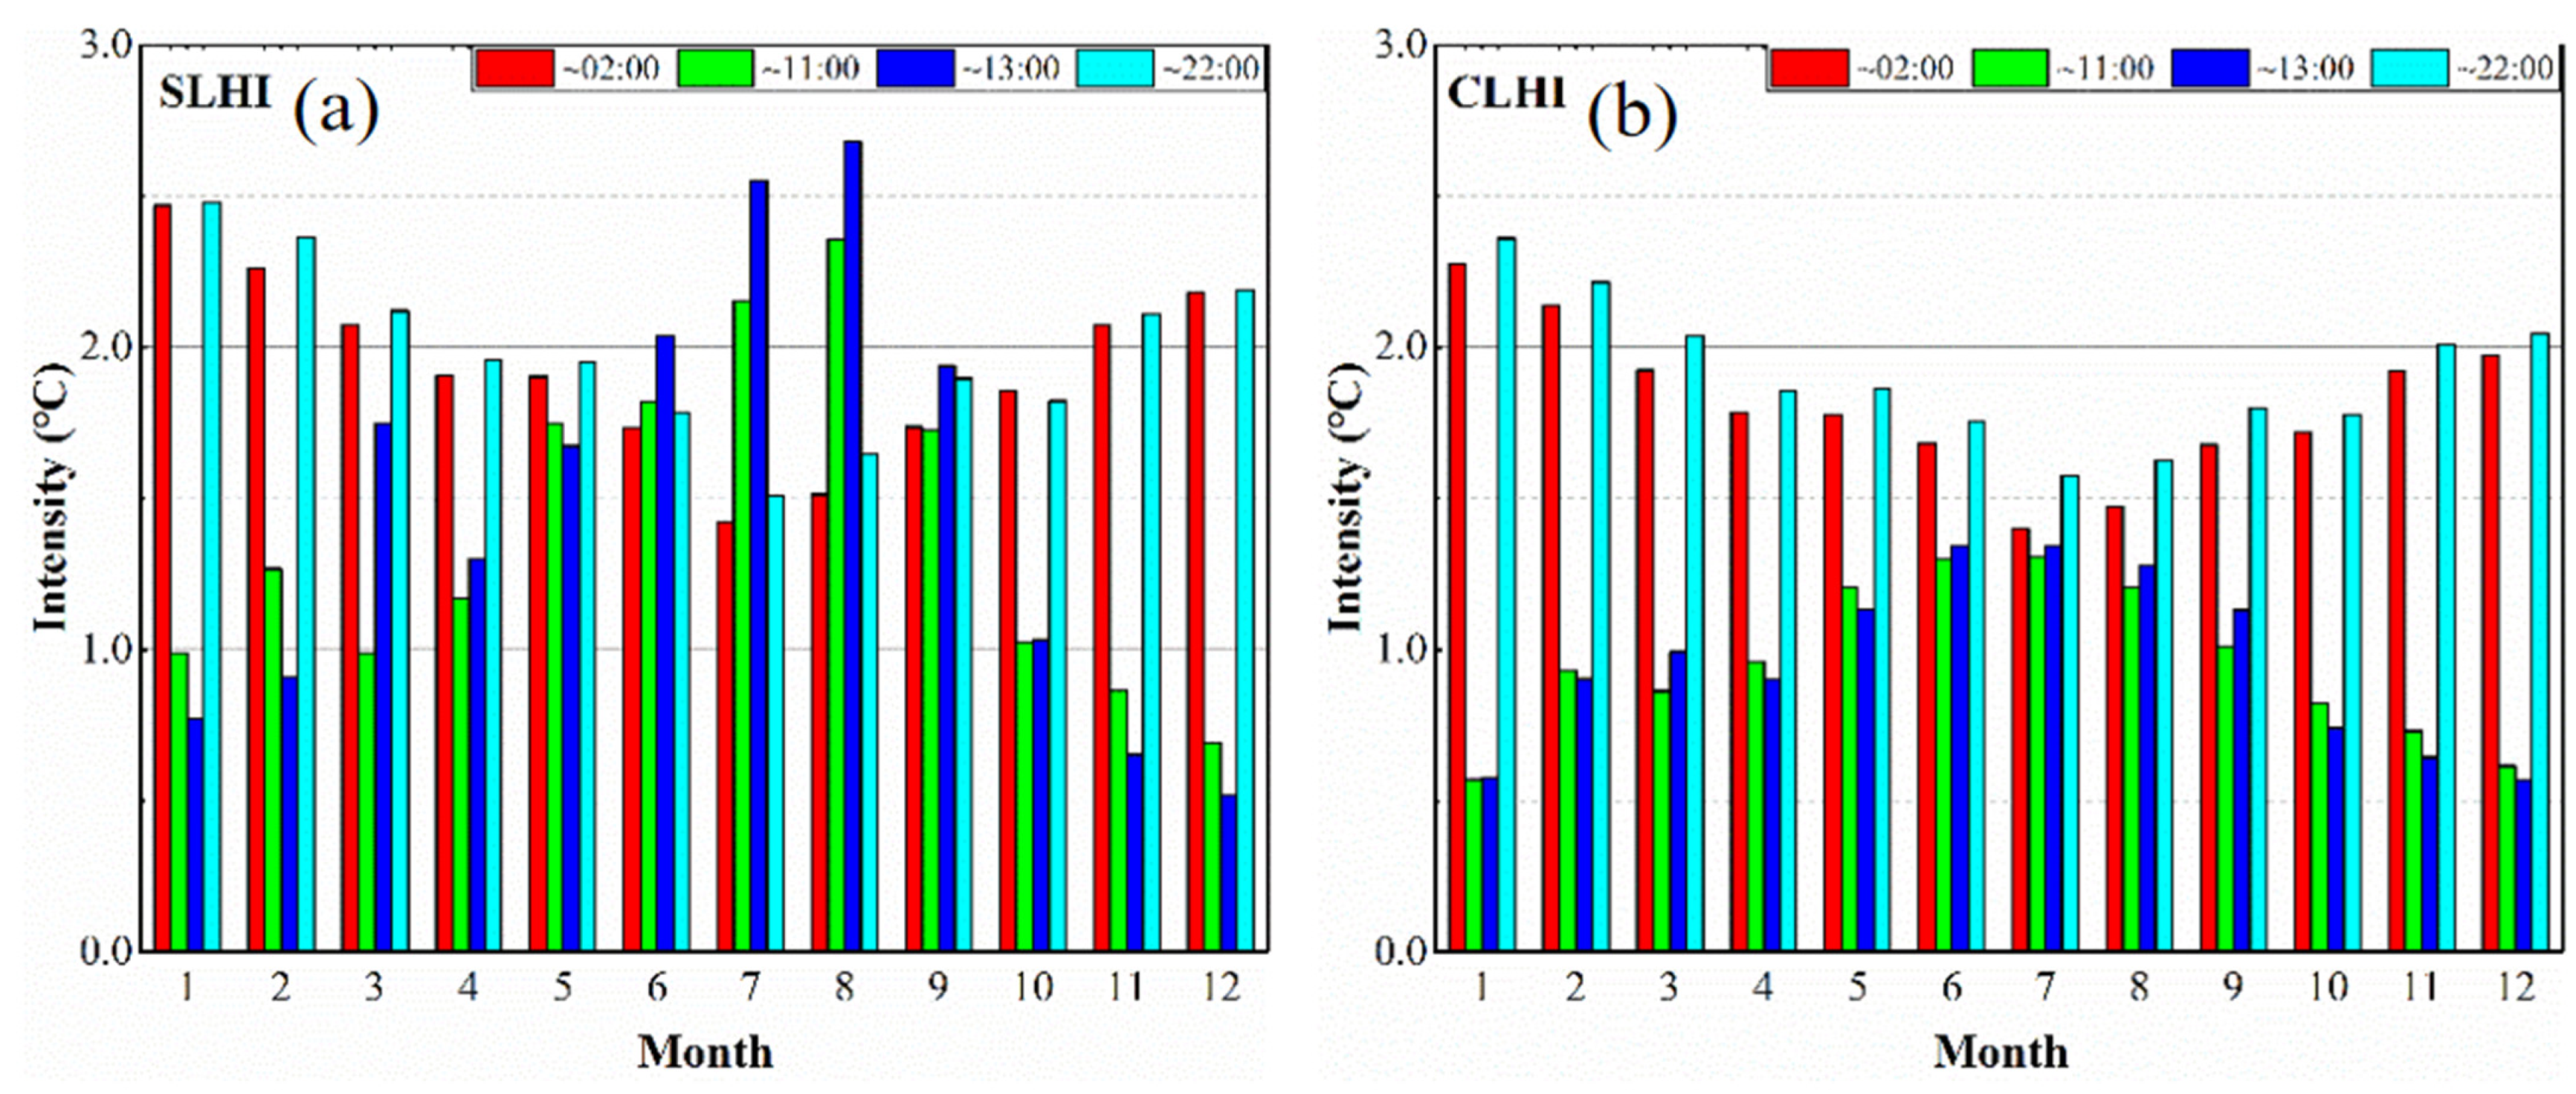
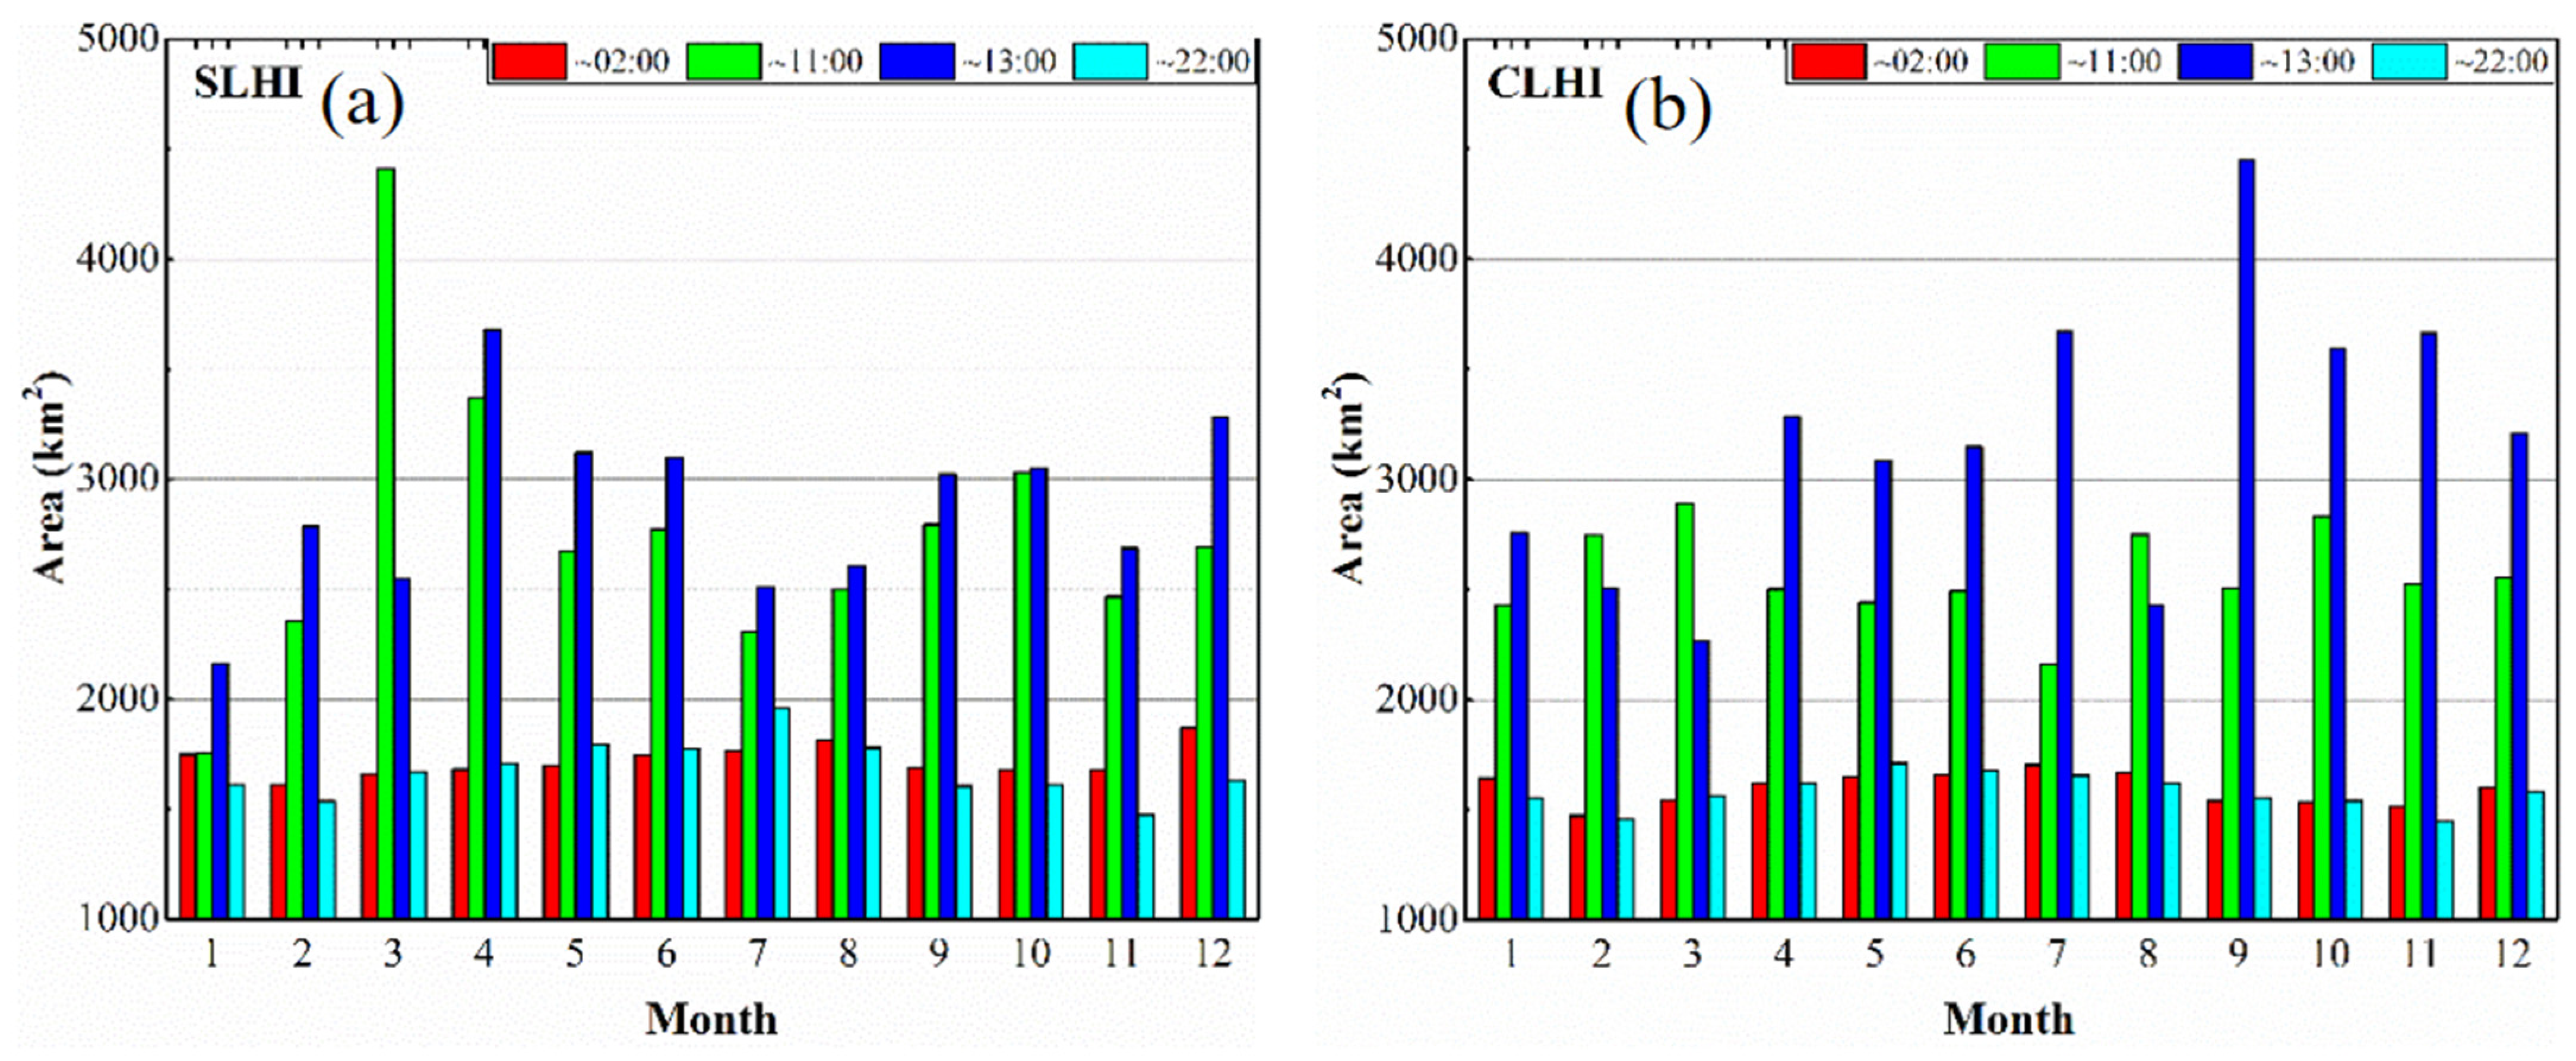
3.2.2. Monthly Time Scale

The distribution of the monthly average intensity of SUHI and CLHI during the four transit times from 2003 to 2020 is shown in Figure 5. The results show that the monthly mean heat island intensities of both SUHI and CLHI show a ‘V’ distribution at night and an inverted ‘V’ distribution during the day; i.e., the intensity of SUHI and CLHI is strongest in winter and weakest in summer, which is probably the same as the results of the daily scale analysis. The monthly average intensity of SUHI is considerably greater than that of CLHI during the day and is basically the same at night. The monthly average intensities of SUHI and CLHI have a maximum difference of 1.40 °C during the day (in August) and 0.21 °C at night (in December).
The distribution of the monthly average SUHI and CLHI footprint ellipse areas during the four border crossings from 2003 to 2020 is shown in Figure 6. The results show that the monthly average nighttime SUHI and CLHI elliptical area varies slightly among months: the corresponding mean values are 1700 km2 and 1589 km2, and the corresponding maximum differences are 484 km2 and 265 km2. The monthly average ellipse area of daytime SUHI and CLHI varies greatly among months: the corresponding mean values are 2820 km2 and 2871 km2, and the corresponding maximum differences are 2662 km2 and 2293 km2. Overall, the monthly average SUHI and CLHI footprint ellipse area is larger at 13:00 than at 11:00. This is because solar radiation is stronger at 13:00 than at 11:00. As a result, the surface and air temperatures are closer to the highest value in the day, which expands the range of SUHI and CLHI.

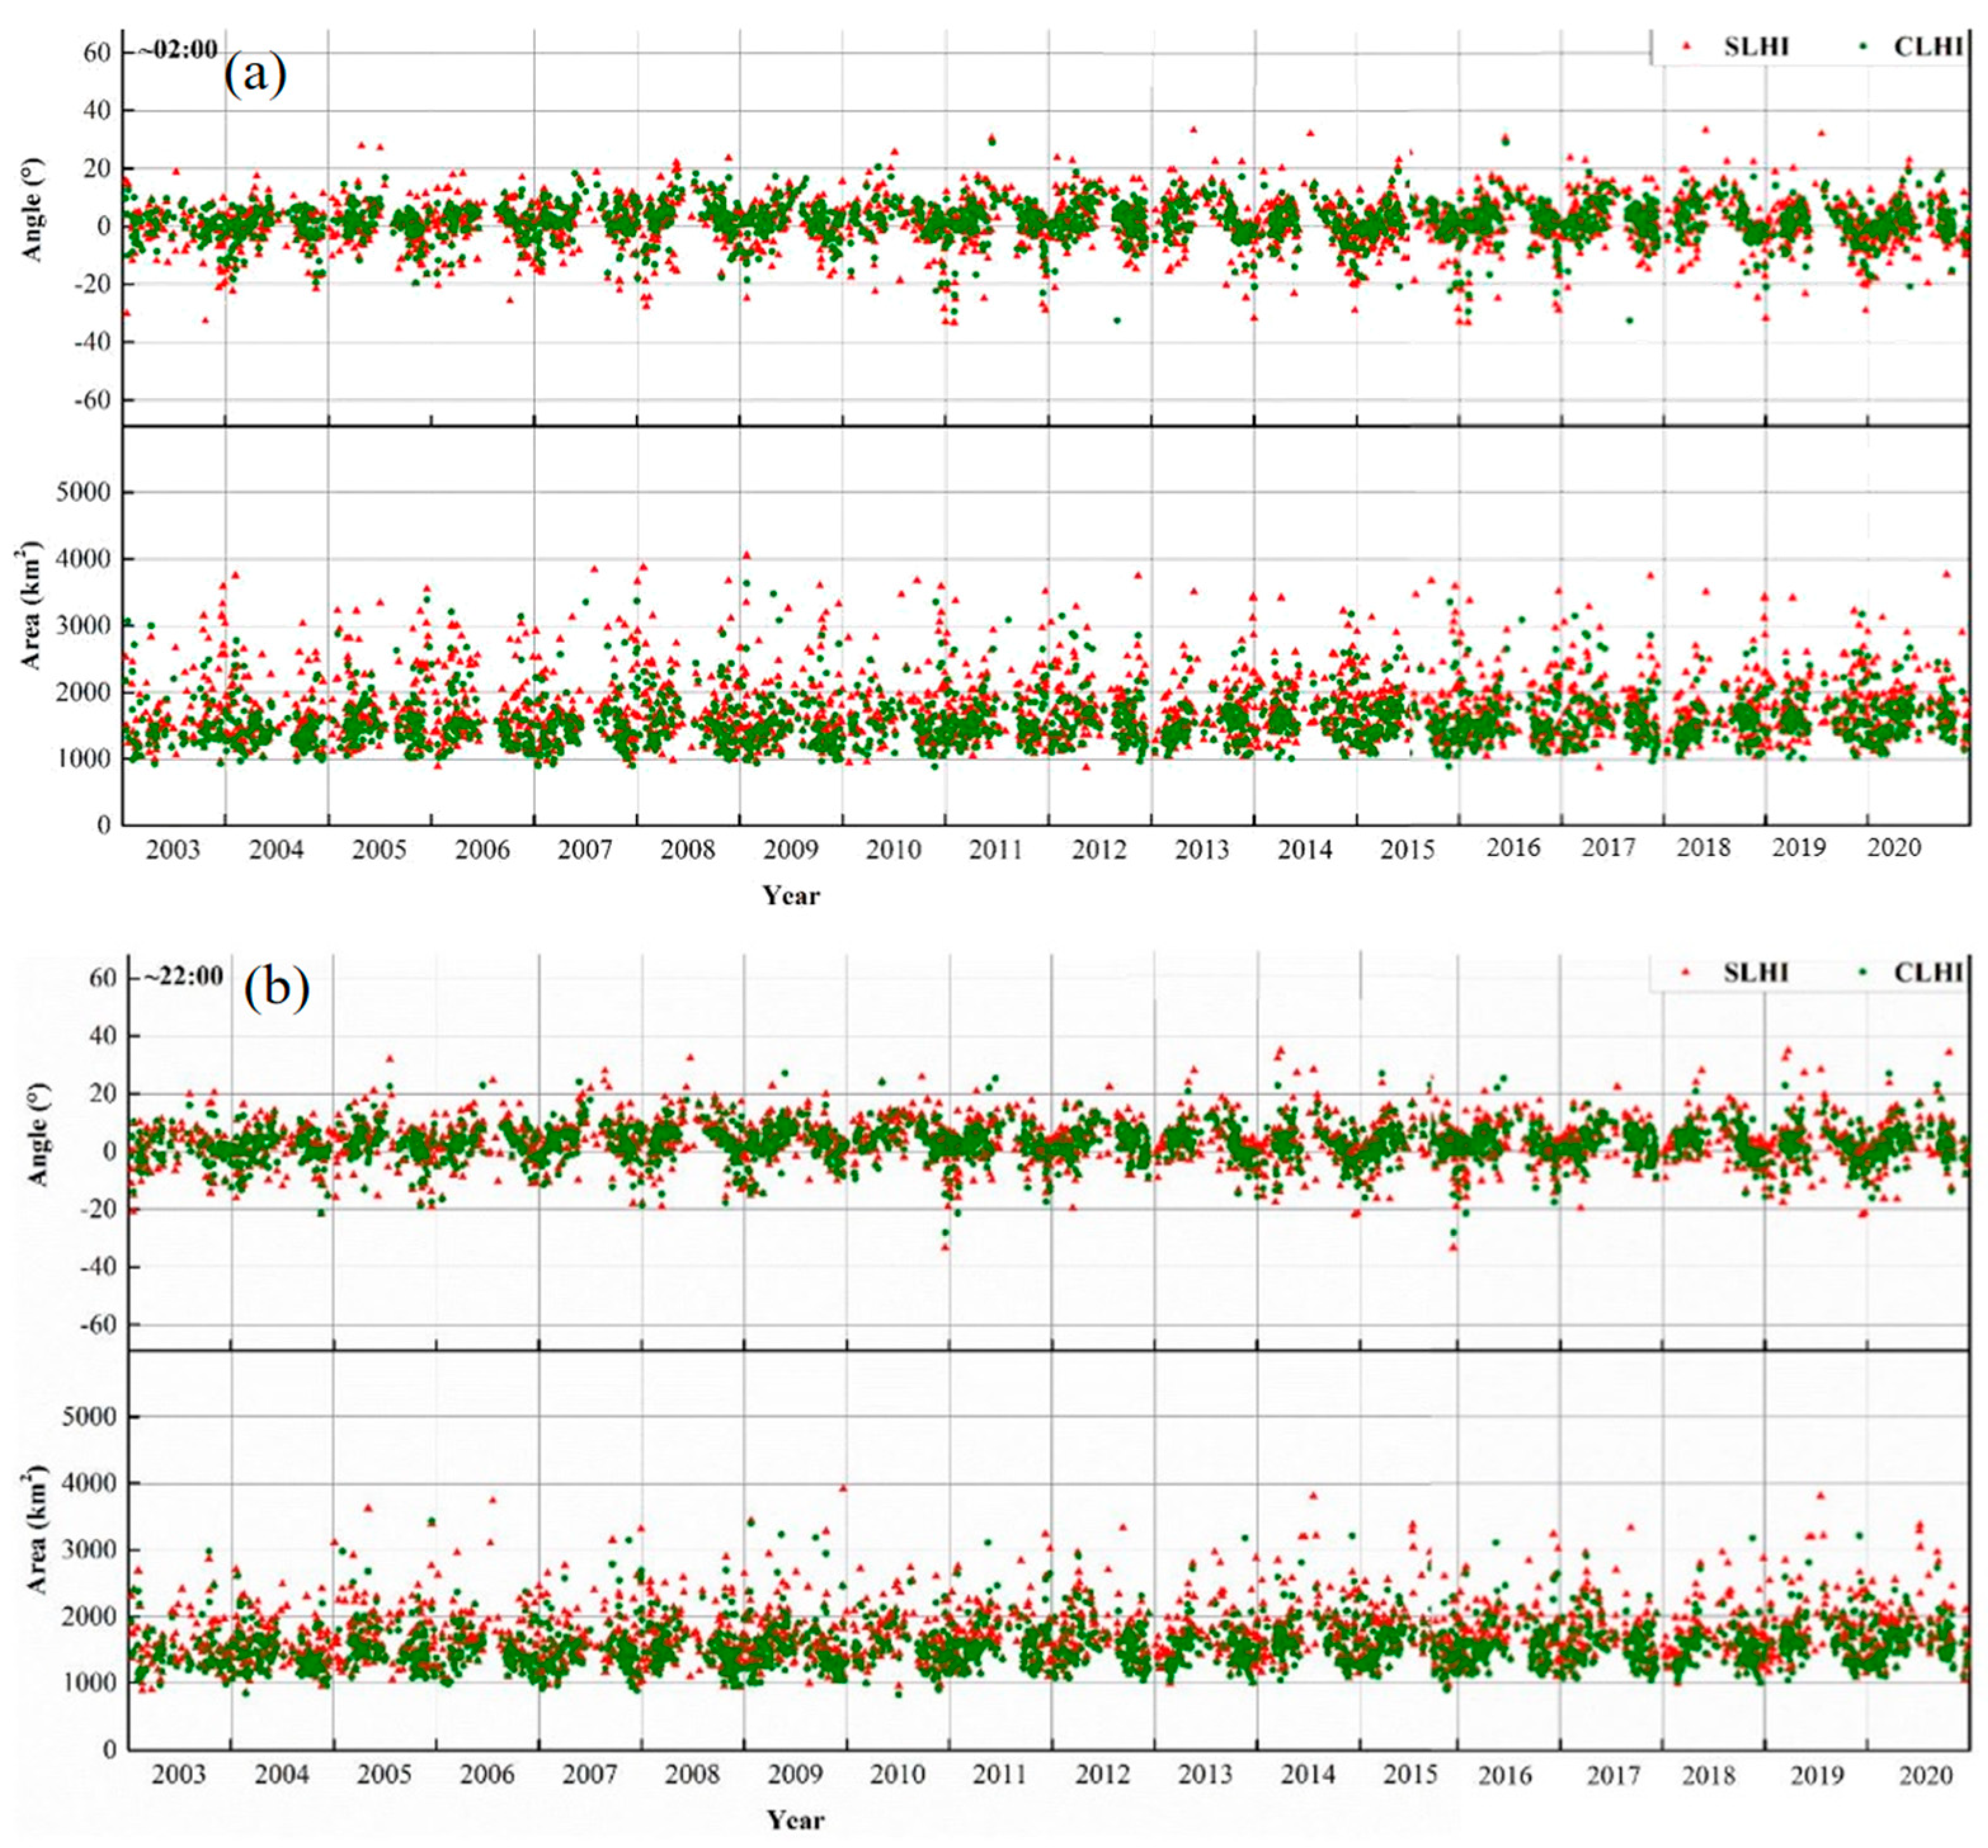
3.2.3. Annual Timescale

The annual average intensity of SUHI and CLHI during the four transit times from 2003 to 2020 is shown in Figure 7. The results show that (1) the overall intensity of SUHI and CLHI shows a slight downward trend over time, indicating that the urban heat island phenomenon is slowly diminishing each year. (2) Unlike SUHI, CLHI significantly differs between day and night. The average annual average heat island intensity is close to 2 °C at night and about 1 °C during the day. (3) From 2003 to 2020, the annual average centers of SUHI and CLHI moved eastward over time, and the north–south changes were relatively insignificant.
The annual average footprint ellipse area and direction of the SUHI and CLHI from 2003 to 2020 are shown in Figure 8. The results show that the annual average area of the SUHI and CLHI has a trend of steadily increasing over time. On an annual time scale, the direction values of the SUHI and CLHI show an increasing trend over time; that is, the heat island direction slowly deflects to the northeast–southwest direction each year.

4. Discussion

In this study, the intensity, center, direction and extent of the SUHI and CLHI in Beijing from 2003 to 2020 were compared based on the Gaussian capacity model using MODIS surface temperature products, providing an important perspective for understanding the seasonal changes, spatial distribution and development trend of the urban heat island effect.

4.1. Analysis of Changes in Intensity and Center of SUHI and CLHI

Firstly, as shown in Figure 5 and Figure 6, from a seasonal perspective, the intensity of SUHI and CLHI showed obvious seasonal variations, and we noticed that the intensity of nighttime SUHI and CLHI was stronger in the cold season and weaker in the hot season, while during the daytime was obvious in the hot season and weakened in the cold season, which is consistent with the results of existing studies [30]. It has been shown that NDVI and albedo are the main drivers of heat islands; however, the factors that primarily influence heat islands vary by land use type [31,32]. For example, higher evapotranspiration values associated with vegetation and water bodies result in lower heat island intensities [33]. As shown in Figure 9, During the cool season, NDVI values may be relatively low due to lower temperatures and slower vegetation growth. This indicates a decrease in vegetation cover and an increase in surface exposure as in Figure 10d, which may lead to an increase in surface albedo, as exposed to surfaces which usually have a higher albedo. On the contrary, during the hot season, vegetation growth is vigorous, NDVI values are high, vegetation cover increases, and surface albedo decreases, as in Figure 10b. Albedo is the ability of the surface to reflect solar radiation. Higher albedo means that the surface reflects more solar radiation and therefore the surface temperature may be lower. During the day, solar radiation is the main source of surface temperature [34]. Since urban areas usually have higher building densities and less vegetation cover, they absorb and store more solar radiation, resulting in higher intensities of SUHI and CLHI during the day. In the cool season, more solar radiation is reflected back into space due to the higher albedo of surface cover (e.g., bare soil, snow and ice, etc.) [35,36,37], resulting in less heat being absorbed by the surface as in Figure 10d, but at night, less heat is also released from these areas, and thus the nighttime heat island effect may be stronger. During the hot season, areas of lower surface albedo (e.g., vegetated areas) absorb more solar radiation and release heat during the day, leading to a stronger daytime heat island effect.
One year (e.g., 2020) was selected to perform the correlation analysis between the monthly average NDVI and albedo distributions in June and July and the surface temperature, the relationship between the surface temperature and NDVI and albedo was depicted by scatter plots, and the results are shown in Figure 11a–d. Combining the scatter plots of surface temperature distribution with NDVI and albedo and their correlation coefficients for June and July 2020, it can be seen that the surface temperature distribution is negatively correlated with NDVI and albedo, which echoed the prior study [38], with correlation coefficients of Figure 11a,b being around 0.8, and those of Figure 11c,d being around 0.6, indicating that the that the heat island effect is attenuated in regions with high vegetation cover and high albedo.
NDVI measures the growth and density of vegetation, thus indirectly reflecting the green space coverage in the city. Green spaces have higher transpiration and lower surface temperatures, which can help mitigate the SUHI and CLHI effects. At night, green spaces have lower temperatures due to less heat being absorbed and stored during the day, which may result in the center of SUHI and CLHI being concentrated in less vegetated areas [39]. During the daytime, the temperature difference between the green space and the surrounding areas decreases due to the heating effect of solar radiation, leading to a relative dispersion of SUHI and CLHI phenomena during the day. However, in the hot season, the higher intensity of solar radiation, even the surface with higher albedo to warm up faster due to prolonged exposure to solar radiation, leading to the movement of SUHI and CLHI towards the east and north. This is related to the four-seasonal NDVI changes in Beijing, and to the land use types. Figure 10 represents the NDVI changes in Beijing in summer, and it can be seen that from June to July, the NDVI gradually increases in the northwest and southwest directions of Beijing, which is opposite to the direction of the heat island movement. Land use can reflect the types and distribution of land use within the city, such as residential areas, industrial areas, and green areas. Different types of land use have different impacts on the SUHI and CLHI. For example, industrial areas usually have higher surface temperatures and lower vegetation cover, which may lead to a concentration of the center of the SUHI and CLHI near industrial areas, whereas an increase in green spaces can help mitigate SUHI and CLHI effects.
In order to better reflect the effect of NDVI and solar albedo on surface temperature, we analyzed the discussion of the effect of NDVI on latent heat flux (LHF) and albedo on net solar radiation (NSR) in the year 2020, as shown in Figure 12 and Figure 13. From the figure it can be seen that NRS is significantly negatively correlated with albedo and LHF is significantly positively correlated with NDVI. The positive correlation between LHF and NDVI is around 0.5, and this positive correlation makes NDVI an important parameter for analyzing evaporative cooling caused by higher latent heat values [40].
In previous studies, we explored the effects of NDVI, albedo, and other factors on surface temperature, and these analyses have provided important clues to our understanding of the heat island effect. However, in order to reveal the intrinsic mechanism of heat island changes more comprehensively, we need to further analyze the correlation between surface temperature and latent heat and net radiation, as shown in Figure 14, where latent heat is negatively correlated with surface temperature and net radiation is positively correlated with surface temperature.

4.2. Analysis of Changes in SUHI and CLHI Ellipsoids

NDVI reflects the growth status and density of vegetation. During the growing season (e.g., spring and summer), when the vegetation is lush and the NDVI value is high, green spaces can provide a better cooling effect, thus reducing the intensity of SUHI and CLHI. At this time, the elliptical area of daytime SUHI and CLHI may be relatively small. In contrast, during the non-growing seasons (e.g., autumn and winter), when vegetation fades and NDVI values decrease, the cooling effect of green spaces is reduced, which may lead to an increase in the elliptical areas of SUHI and CLHI. Albedo is influenced by the type of ground cover, such as water bodies, vegetation, bare soil, and buildings. In the summer, high-albedo surfaces (e.g., bare soil and building roofs) may absorb more heat due to the higher intensity of solar radiation [41], resulting in higher surface temperatures, which may exacerbate SUHI and CLHI phenomena. This may lead to an increase in the elliptical area of SUHI and CLHI during daytime. In winter, on the other hand, solar radiation is weaker and the effect of albedo on surface temperature is relatively small, so the change in the elliptical area of SUHI and CLHI may not be as significant as in summer. The land use data reflect the functions and characteristics of different areas within the city. During the summer months, the SUHI and CLHI phenomena may be exacerbated by the extensive use of equipment such as air conditioners, which may generate more heat in commercial and residential areas. This may lead to an increase in the elliptical area of SUHI and CLHI during the daytime. In winter, industrial areas may become the main source of heat due to increased heating demand, leading to variations in the elliptical areas of SUHI and CLHI in different areas [42].
The increase in the average annual area of the SUHI and CLHI indicates (as shown in Figure 8) that the hot areas in the city are expanding. This is mainly due to the urbanization process [43], where a large number of impermeable surfaces (e.g., buildings, roads, etc.) have replaced the original vegetation and soil, as shown in Figure 15, resulting in an increase in the reflectivity of the urban surface, which makes it less easy for heat to escape, thus creating a heat island effect.

4.3. Analysis of Changes in Center and Direction of SUHI and CLHI

The analysis of the projected shifting center of gravity of land use types and construction land use standards shows that Beijing has experienced significant urbanization during this period. Agricultural land decreased and land for construction, transport and water facilities continued to increase, leading to an increase in the area of impervious surfaces. This shift in land use type reduced the vegetation cover on the surface and exacerbated the heat island effect.
The increase in built-up land mainly occurs in the city center and eastern region, as shown in Figure 15 and Figure 16, which may be related to Beijing’s urban planning and economic development strategies [44]. As the city expands to the east, the population and industries gradually gather to the east, leading to the eastward shift of the heat island center. This is consistent with the direction of shift of the center of gravity of the ellipse of the construction site in Figure 16. The direction of the heat island towards the northeast-southwest may be related to a variety of factors such as Beijing’s topography, wind direction and urban planning. Beijing’s topography is higher in the northwest and lower in the southeast, and the dominant wind direction in summer is southeast, which may have influenced the direction of the heat island effect. In addition, the distribution of green space, road network, and building layout in urban planning may also have an impact the distribution of the heat island effect.

5. Conclusions

Based on the Gaussian capacity model, we used MODIS surface temperature products for Beijing from 2003 to 2020 to compare and analyze the intensity, center, direction, and range of SUHI and CLHI in Beijing through model parameters. The main conclusions are as follows:
(1)
The monthly mean heat island intensities of SUHI and CLHI show a V-shaped distribution at night, with the strongest intensity in winter and the weakest in summer, and an inverted V-shaped distribution during the day, with the strongest intensity in summer and the weakest in winter.
(2)
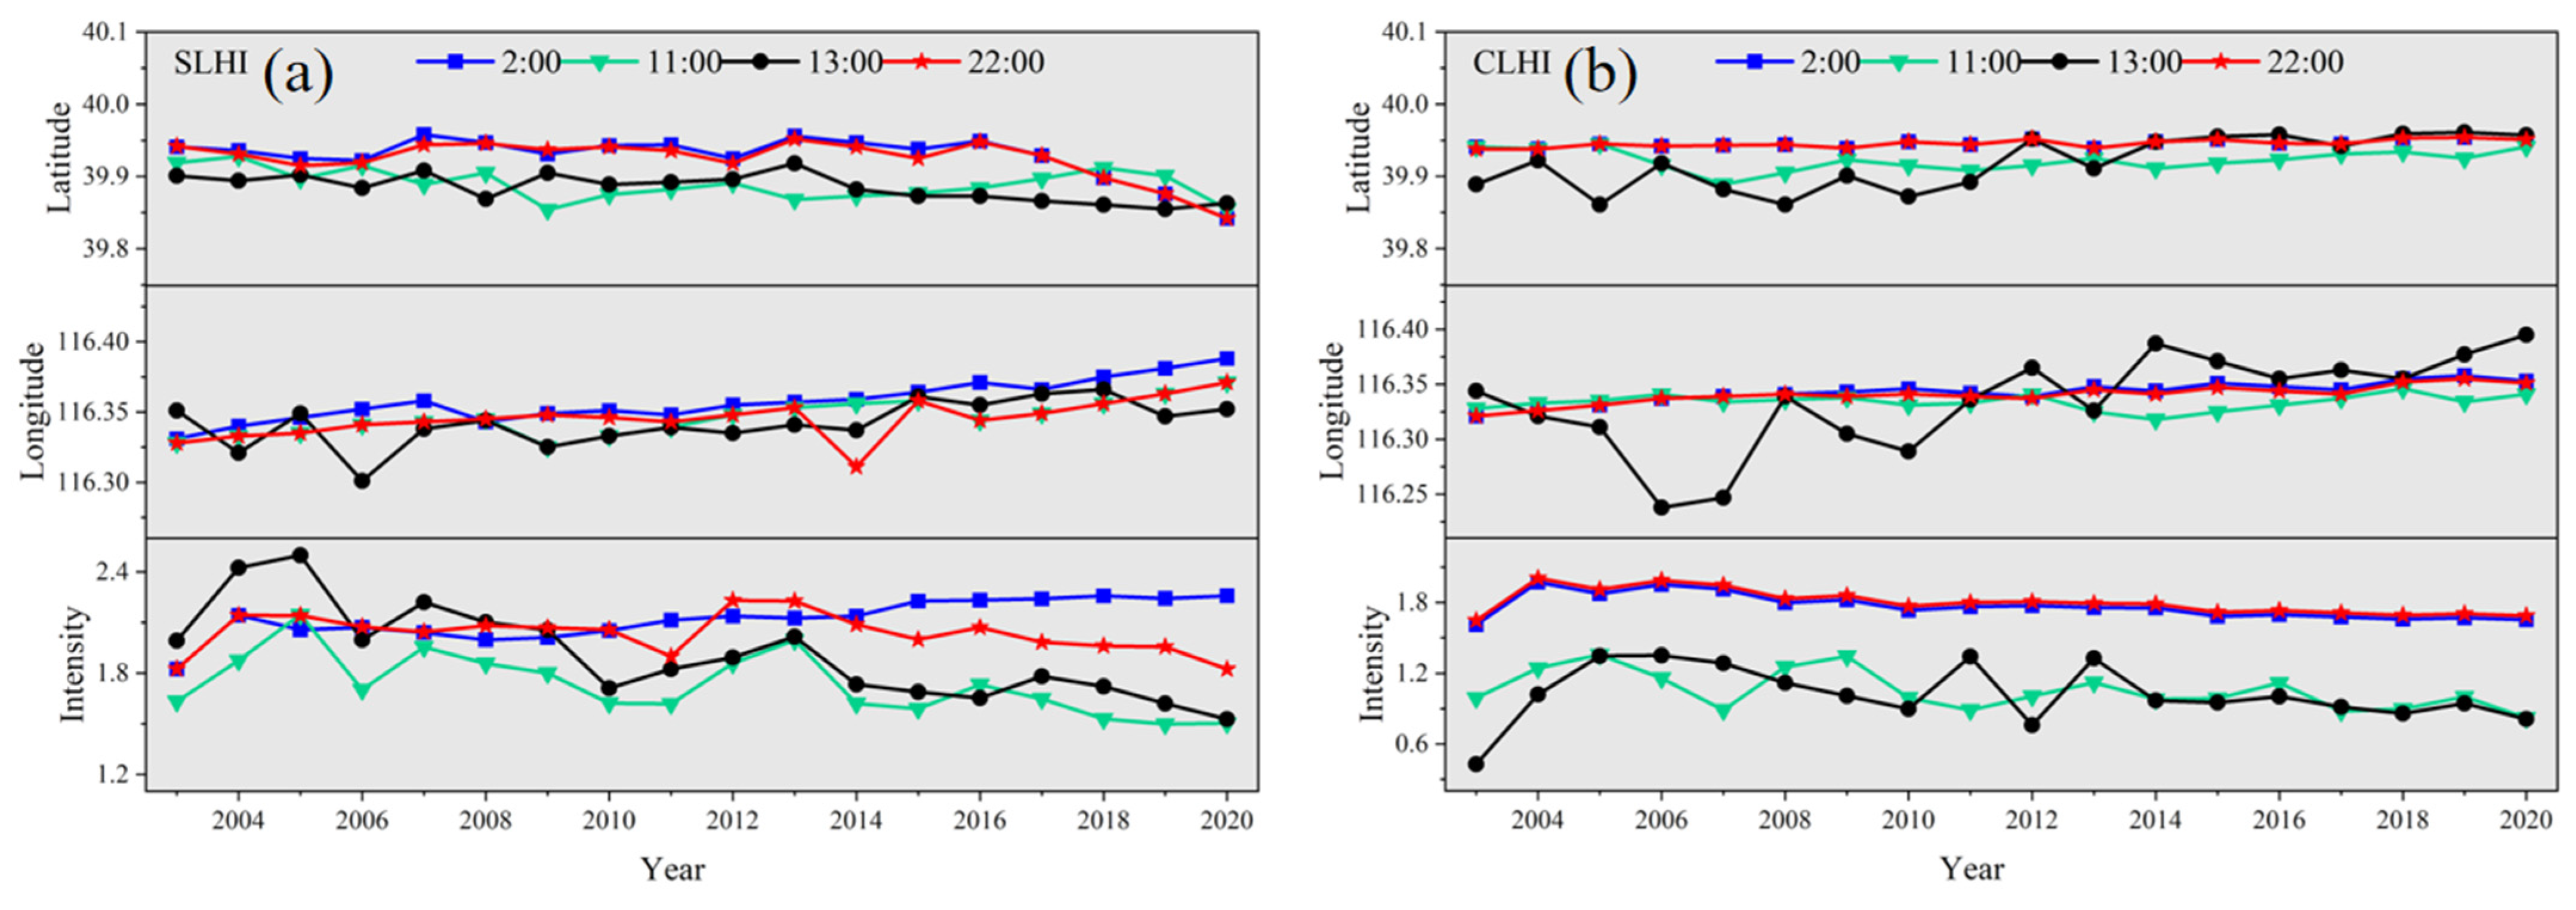
The centers of SUHI and CLHI are concentrated at night, with longitude mainly in the range of 116.3°~116.4° E, and the latitude mainly in the range of 39.90°~39.95° N; they are scattered during the day, with longitude mainly in the range of 116.2°~116.5° E, and latitude mainly in the range of 39.7°~40.0° N. They move eastward and northward during hot seasons, and they move westward and southward during cold seasons.
(3)
The monthly average ellipse area of daytime SUHI and CLHI varies greatly among months; the corresponding maximum differences are 2662 km2 and 2293 km2, respectively. Meanwhile, nighttime values vary slightly; the corresponding maximum differences are 484 km2 and 265 km2, respectively.
(4)
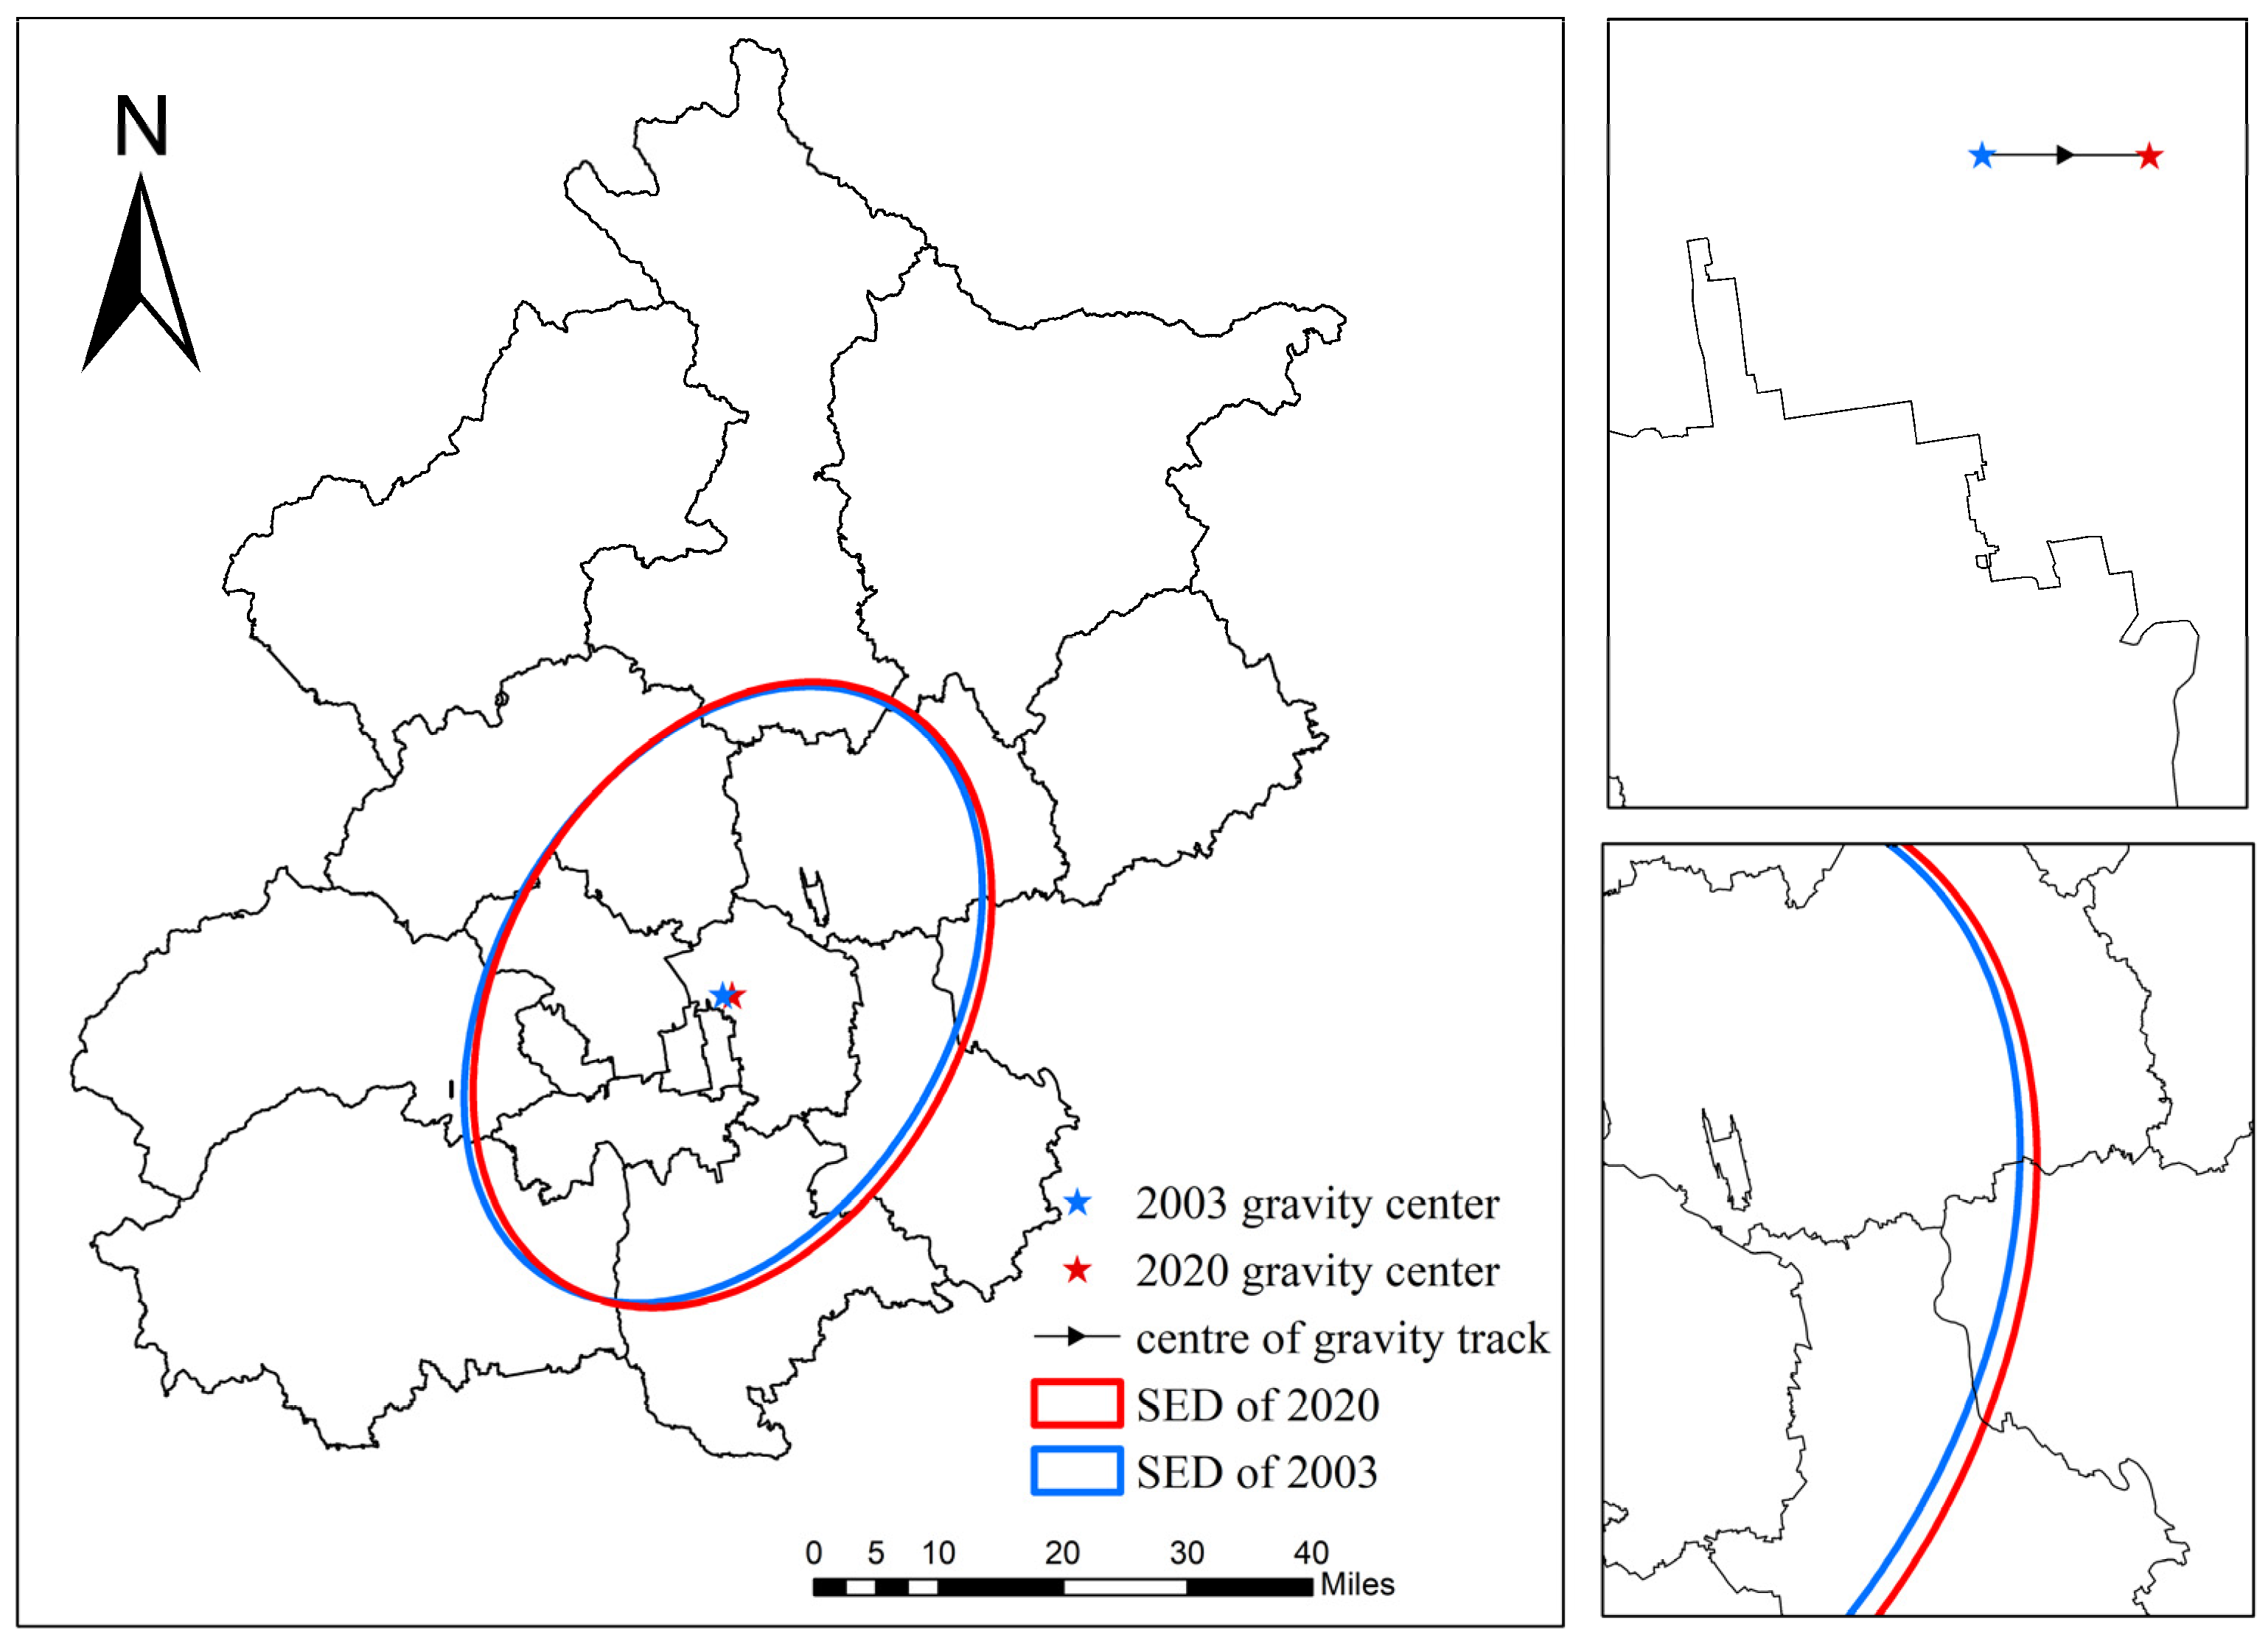
The average area as a whole is on the rise. The annual average area of SUHI and CLHI has steadily increased over time; every year, the center of the heat island has moved eastward, and the direction of the heat island has gradually shifted towards the northeast–southwest direction.
The expansion direction and scope of the urban area will continue to affect the movement and extent of the heat island center. It is expected that with the further development of the city, the urban heat island center will continue to move to the southeast, and the heat island scope will further expand. This study examined the urban heat island effect at both the surface and canopy levels using remote sensing data and Gaussian capacity modeling, offering insights for mitigating this phenomenon. However, it is important to note that our analysis only considers the characteristics of the heat island effect from a remote sensing perspective. Future research should integrate multiple sources of information, including ground observation data, meteorological data, and socio-economic data, to comprehensively elucidate the formation mechanism and influencing factors of the urban heat island effect. Additionally, attention should be given to variations between different cities in order to develop targeted strategies for mitigating the urban heat island.

Author Contributions

Conceptualization, D.Y.; methodology, D.Y., L.Z. and W.S.; software, Y.F.; validation, D.Y. and Y.F.; formal analysis, D.Y., L.Z. and D.F.; investigation, D.Y.; resources, data curation, W.S.; writing—original draft preparation, D.Y., L.Z. and Y.F.; writing—review and editing, D.F. and X.Z.; visualization, supervision, project administration, funding acquisition, D.Y. All authors have read and agreed to the published version of the manuscript.

Funding

This research was funded by Hebei Natural Science Foundation Ecological Smart Mine Joint Fund (No. E2020402086) and the National Natural Science Foundation of China (No. 52174160).

Institutional Review Board Statement

Not applicable.

Informed Consent Statement

Not applicable.

Data Availability Statement

The data presented in this study are avalable on request from the corresponding author. The data are not publicly available due to privacy.

Conflicts of Interest

The authors declare no conflicts of interest.

Abbreviations

Full NameAbbreviation
Surface Urban Heat IslandSUHI
Canopy Layer Heat IslandCLHI
Moderate-Resolution Imaging SpectroradiometerMODIS
Advanced Very High Resolution RadiometerAVHRR
Enhanced Thematic Mapper PlusETM+
Normalized Vegetation IndexNDVI
Standard Deviation EllipseSED
Latent Heat FluxLHF
Net Solar RadiationNSR

References

  1. Zheng, Y.; Ren, C.; Shi, Y.; Yim, S.H.L.; Lai, D.Y.F.; Xu, Y.; Fang, C.; Li, W. Mapping the Spatial Distribution of Nocturnal Urban Heat Island Based on Local Climate Zone Framework. Build. Environ. 2023, 234, 110197. [Google Scholar] [CrossRef]
  2. Feng, J.-L.; Cai, X.-M.; Chapman, L. Impact of Atmospheric Conditions and Levels of Urbanization on the Relationship between Nocturnal Surface and Urban Canopy Heat Islands. Q. J. R. Meteorol. Soc. 2019, 145, 3284–3299. [Google Scholar] [CrossRef]
  3. Wang, Y.; Zhan, Q.; Ouyang, W. How to Quantify the Relationship between Spatial Distribution of Urban Waterbodies and Land Surface Temperature? Sci. Total Environ. 2019, 671, 1–9. [Google Scholar] [CrossRef]
  4. Yang, M.; Yang, G.; Wang, Y.; Zhang, Y.; Zhang, Z.; Sun, C. Remote Sensing Analysis of Temporal-Spatial Variations of Urban Heat Island Effect over Beijing. Remote Sens. Land Resour. 2018, 30, 213–223. [Google Scholar] [CrossRef]
  5. Chen, Y.; Zhan, W. Comparing surface- and canopy-layer urban heat islands over Beijing using MODIS data. Int. J. Remote Sens. 2015, 36, 5448–5465. [Google Scholar] [CrossRef]
  6. Zhi, Q.; Guangjin, T. Dynamic Monitoring of the Footprint and Capacity for Urban Heat Island in Beijing between 2001 and 2012 Based on MODIS. Int. J. Remote Sens. 2021, 19, 476–484. [Google Scholar] [CrossRef]
  7. Erdem Okumus, D.; Terzi, F. Evaluating the Role of Urban Fabric on Surface Urban Heat Island: The Case of Istanbul. Sustain. Cities Soc. 2021, 73, 103128. [Google Scholar] [CrossRef]
  8. Quan, J.; Chen, Y.; Zhan, W.; Wang, J.; Voogt, J.; Wang, M. Multi-Temporal Trajectory of the Urban Heat Island Centroid in Beijing, China Based on a Gaussian Volume Model. Remote Sens. Environ. 2014, 149, 33–46. [Google Scholar] [CrossRef]
  9. Saaroni, H.; Ben-Dor, E.; Bitan, A.; Potchter, O. Spatial Distribution and Microscale Characteristics of the Urban Heat Island in Tel-Aviv, Israel. Landsc. Urban Plan. 2000, 48, 1–18. [Google Scholar] [CrossRef]
  10. Nichol, J.E.; Fung, W.Y.; Lam, K.; Wong, M.S. Urban Heat Island Diagnosis Using ASTER Satellite Images and ‘in Situ’ Air Temperature. Atmos. Res. 2009, 94, 276–284. [Google Scholar] [CrossRef]
  11. Ben-Dor, E.; Saaroni, H. Airborne Video Thermal Radiometry as a Tool for Monitoring Microscale Structures of the Urban Heat Island. Int. J. Remote Sens. 1997, 18, 3039–3053. [Google Scholar] [CrossRef]
  12. Caselles, V.; Lopez Garcia, M.J.; Melia, J.; Perez Cueva, A.J. Analysis of the Heat-Island Effect of the City of Valencia, Spain, through Air Temperature Transects and NOAA Satellite Data. Theor. Appl. Climatol. 1991, 43, 195–203. [Google Scholar] [CrossRef]
  13. Hachem, S.; Duguay, C.R.; Allard, M. Comparison of MODIS-Derived Land Surface Temperatures with Ground Surface and Air Temperature Measurements in Continuous Permafrost Terrain. Cryosphere 2012, 6, 51–69. [Google Scholar] [CrossRef]
  14. Hu, Y.; Hou, M.; Jia, G.; Zhao, C.; Zhen, X.; Xu, Y. Comparison of Surface and Canopy Urban Heat Islands within Megacities of Eastern China. ISPRS J. Photogramm. Remote Sens. 2019, 156, 160–168. [Google Scholar] [CrossRef]
  15. Sun, T.; Sun, R.; Chen, L. The Trend Inconsistency between Land Surface Temperature and Near Surface Air Temperature in Assessing Urban Heat Island Effects. Remote Sens. 2020, 12, 1271. [Google Scholar] [CrossRef]
  16. Venter, Z.S. Crowdsourced air temperatures contrast satellite measures of the urban heat island and its mechanisms. Sci. Adv. 2021, 7, eabb9569. [Google Scholar] [CrossRef] [PubMed]
  17. Streutker, D.R. Satellite-Measured Growth of the Urban Heat Island of Houston, Texas. Remote Sens. Environ. 2003, 85, 282–289. [Google Scholar] [CrossRef]
  18. Han, L.; Zhao, J.; Gao, Y.; Gu, Z. Prediction and Evaluation of Spatial Distributions of Ozone and Urban Heat Island Using a Machine Learning Modified Land Use Regression Method. Sustain. Cities Soc. 2022, 78, 103643. [Google Scholar] [CrossRef]
  19. Jia, W.; Wei, Z.; Jing, W. Time-Series Analysis Reveals Intensified Urban Heat Island Effects but without Significant Urban Warming. Remote Sens. 2019, 11, 2229. [Google Scholar] [CrossRef]
  20. Guan, Q.; Yao, Y.; Ma, T.; Hong, Y.; Bie, Y.; Lyu, J. Under the Dome: A 3D Urban Texture Model and Its Relationship with Urban Land Surface Temperature. Ann. Am. Assoc. Geogr. 2022, 112, 1369–1389. [Google Scholar] [CrossRef]
  21. Zhang, H.; Yin, Y.; An, H. Surface urban heat island and its relationship with land cover change in five urban agglomerations in China based on GEE. Environ. Sci. Pollut. Res. 2022, 29, 82271–82285. [Google Scholar] [CrossRef] [PubMed]
  22. Peng, J.; Xie, P.; Liu, Y.; Ma, J. Urban Thermal Environment Dynamics and Associated Landscape Pattern Factors: A Case Study in the Beijing Metropolitan Region. Remote Sens. Environ. 2016, 173, 145–155. [Google Scholar] [CrossRef]
  23. Gillies, R.R.; Kustas, W.P.; Humes, K.S. A Verification of the “triangle” Method for Obtaining Surface Soil Water Content and Energy Fluxes from Remote Measurements of the Normalized Difference Vegetation Index (NDVI) and Surface e. Int. J. Remote Sens. 1997, 18, 3145–3166. [Google Scholar] [CrossRef]
  24. Hao, C.Y.; Jun, S.P.; Bing, L.X.; Yang, H.C. Research on Urban Spatial Thermal Environment Using Remote Sensing Image—Fractal Measurement of Thermal Field Structure & Its Change. Acta Geod. Cartogr. Sin. 2002, 31, 322–326. [Google Scholar] [CrossRef]
  25. Streutker, D.R. A remote sensing study of the urban heat island of Houston, Texas. Int. J. Remote Sens. 2002, 23, 2595–2608. [Google Scholar] [CrossRef]
  26. Pichierri, M.; Bonafoni, S.; Biondi, R. Satellite Air Temperature Estimation for Monitoring the Canopy Layer Heat Island of Milan. Remote Sens. Environ. 2012, 127, 130–138. [Google Scholar] [CrossRef]
  27. Anniballe, R.; Bonafoni, S.; Pichierri, M. Spatial and Temporal Trends of the Surface and Air Heat Island over Milan Using MODIS Data. Remote Sens. Environ. 2014, 150, 163–171. [Google Scholar] [CrossRef]
  28. Qiao, Z.; Tian, G.; Xiao, L. Diurnal and Seasonal Impacts of Urbanization on the Urban Thermal Environment: A Case Study of Beijing Using MODIS Data. ISPRS J. Photogramm. Remote Sens. 2013, 85, 93–101. [Google Scholar] [CrossRef]
  29. Meng, Q.; Zhang, L.; Sun, Z.; Meng, F.; Wang, L.; Sun, Y. Characterizing Spatial and Temporal Trends of Surface Urban Heat Island Effect in an Urban Main Built-up Area: A 12-Year Case Study in Beijing, China. Remote Sens. Environ. 2018, 204, 826–837. [Google Scholar] [CrossRef]
  30. Yang, C.; Yan, F.; Zhang, S. Comparison of Land Surface and Air Temperatures for Quantifying Summer and Winter Urban Heat Island in a Snow Climate City. J. Environ. Manag. 2020, 265, 110563. [Google Scholar] [CrossRef]
  31. Xi, Y.; Wang, S.; Zou, Y.; Zhou, X.; Zhang, Y. Seasonal Surface Urban Heat Island Analysis Based on Local Climate Zones. Ecol. Indic. 2024, 159, 111669. [Google Scholar] [CrossRef]
  32. Xie, J.; Zhou, S.; Chung, L.C.H.; Chan, T.O. Evaluating Land-Surface Warming and Cooling Environments across Urban–Rural Local Climate Zone Gradients in Subtropical Megacities. Build. Environ. 2024, 251, 111232. [Google Scholar] [CrossRef]
  33. Chen, L.; Dirmeyer, P.A. Dirmeyer Adapting Observationally Based Metrics of Biogeophysical Feedbacks from Land Cover/Land Use Change to Cli mate Modeling. Environ. Res. Lett. 2016, 11, 034002. [Google Scholar] [CrossRef]
  34. Li, K.; Lyu, D.; Chen, Y.; Jiang, J. Classifying Seasonal Patterns of Clear-Sky Surface Urban Heat Island Worldwide and Investigating Impacts from Surface Energy Variations. Sustain. Cities Soc. 2024, 106, 105367. [Google Scholar] [CrossRef]
  35. Armstrong, R.L.; Brun, E. (Eds.) Snow and Climate: Physical Processes, Surface Energy Exchange and Modeling; Cambridge University Press: Cambridge, UK, 2008. [Google Scholar]
  36. Lee, W.Y.; Gim, H.-J.; Park, S.K. Parameterizations of Snow Cover, Snow Albedo and Snow Density in Land Surface Models: A Comparative Review. Asia-Pac. J. Atmos Sci. 2024, 60, 185–210. [Google Scholar] [CrossRef]
  37. Blok, D.; Schaepman-Strub, G.; Bartholomeus, H.; Heijmans, M.M.P.D.; Maximov, T.C.; Berendse, F. The Response of Arctic Vegetation to the Summer Climate: Relation between Shrub Cover, NDVI, Surface Albedo and Temperature. Environ. Res. Lett. 2011, 6, 035502. [Google Scholar] [CrossRef]
  38. Mazhar, U.; Jin, S.; Hu, T.; Bilal, M.; Ali, M.A.; Atique, L. Long-Time Variation and Mechanism of Surface Energy Budget Over Diverse Geographical Regions in Pakistan. IEEE J. Sel. Top. Appl. Earth Obs. Remote Sens. 2022, 15, 5203–5213. [Google Scholar] [CrossRef]
  39. Oke, T.R.; Fuggle, R.F. Comparison of Urban/Rural Counter and Net Radiation at Night. Bound. Layer Meteorol 1972, 2, 290–308. [Google Scholar] [CrossRef]
  40. Keith, C.J.; Repasky, K.S.; Lawrence, R.L.; Jay, S.C.; Carlsten, J.L. Monitoring Effects of a Controlled Subsurface Carbon Dioxide Release on Vegetation Using a Hyperspectral Imager. Int. J. Greenh. Gas Control 2009, 3, 626–632. [Google Scholar] [CrossRef]
  41. Shen, P.; Zhao, S. 1/4 to 1/3 of Observed Warming Trends in China from 1980 to 2015 Are Attributed to Land Use Changes. Clim. Change 2021, 164, 59. [Google Scholar] [CrossRef]
  42. Kamma, J.; Manomaiphiboon, K.; Aman, N.; Thongkamdee, T.; Chuangchote, S.; Bonnet, S. Urban Heat Island Analysis for Bangkok: Multi-Scale Temporal Variation, Associated Factors, Directional Dependence, and Cool Island Condition. ScienceAsia 2020, 46, 213–223. [Google Scholar] [CrossRef]
  43. Darmanto, N.S.; Varquez, A.C.G.; Kawano, N.; Kanda, M. Future Urban Climate Projection in a Tropical Megacity Based on Global Climate Change and Local Urbanization Scenarios. Urban Clim. 2019, 29, 100482. [Google Scholar] [CrossRef]
  44. Hu, T.; Hu, Y.; Qi, K. Dynamic Evolution of Surface Urban Heat Island in Beijing. In Proceedings of the IGARSS 2019-2019 IEEE International Geoscience and Remote Sensing Symposium, Yokohama, Japan, 28 July–2 August 2019; pp. 4391–4394. [Google Scholar] [CrossRef]
Figure 1. Distribution map of SUHI (a) in the day and (b) at night in Beijing on 5 September 2020.
Applsci 14 05034 g001
Figure 2. Distribution map of CLHI (a) in the day and (b) at night in Beijing on 5 September 2020.
Applsci 14 05034 g002
Figure 3. The daily distribution map of the intensity of heat islands and the longitude and latitude of the center of the SUHI and CLHI from 2003 to 2020 at the times of three border crossings (a) 2:00, (b) 13:00 and (c) 22:00.
Applsci 14 05034 g003
Figure 4. The daily distribution of SUHI and CLHI area and direction at the times of four border crossings from 2003 to 2020 (a) 2:00 and (b) 22:00.
Applsci 14 05034 g004
Figure 5. Distribution map of monthly average intensity of (a) SUHI and (b) CLHI at the times of four border crossings from 2003 to 2020.
Applsci 14 05034 g005
Figure 6. Distribution map of monthly average area of (a) SUHI and (b) CLHI at the times of four border crossings from 2003 to 2020.
Applsci 14 05034 g006
Figure 7. The broken line graph of annual mean intensity, longitude and latitude of (a) SUHI and (b) CLHI at the times of four border crossings from 2003 to 2020.
Applsci 14 05034 g007
Figure 8. The distribution map of the annual average area and direction of (a) SUHI and (b) CLHI at the times of four crossings from 2003 to 2020.
Applsci 14 05034 g008
Figure 9. Monthly time series of NDVI in Beijing from (a) 2003 to (b) 2020.
Applsci 14 05034 g009
Figure 10. Spring, summer, autumn and winter distribution of (a,c,e,g) NDVI and (b,d,f,h) albedo.
Applsci 14 05034 g010
Figure 11. Scatter plot of surface temperature distribution versus (a,b) NDVI and (c,d) albedo for June and July 2020.
Applsci 14 05034 g011
Figure 12. Scatterplot of NDVI distribution versus LHF for (a) June and (b) July 2020.
Applsci 14 05034 g012
Figure 13. Scatterplot of albedo distribution versus NSR for (a) June and (b) July 2020.
Applsci 14 05034 g013
Figure 14. Scatter plots of surface temperature distribution versus (a,b) HHF and (c,d) NSR for June and July 2020.
Applsci 14 05034 g014
Figure 15. Spatial distribution of land use types in Beijing from (a) 2003 to (b) 2020.
Applsci 14 05034 g015
Figure 16. Distribution of standard deviation ellipses and center of gravity offset trajectories for construction sites.
Applsci 14 05034 g016
Disclaimer/Publisher’s Note: The statements, opinions and data contained in all publications are solely those of the individual author(s) and contributor(s) and not of MDPI and/or the editor(s). MDPI and/or the editor(s) disclaim responsibility for any injury to people or property resulting from any ideas, methods, instructions or products referred to in the content.

