Article

Analysis of the Dihedral Corner Reflector’s RCS Features in Multi-Resource SAR

1
Global Navigation Satellite System (GNSS) Research Centre, Wuhan University, Wuhan 430079, China
2
School of Geodesy and Geomatics, Wuhan University, Wuhan 430079, China
*
Author to whom correspondence should be addressed.
Appl. Sci. 2024, 14(12), 5054; https://doi.org/10.3390/app14125054
Submission received: 23 March 2024 / Revised: 1 June 2024 / Accepted: 4 June 2024 / Published: 10 June 2024
(This article belongs to the Special Issue Latest Advances in Radar Remote Sensing Technologies)

Abstract

:
Artificial corner reflectors are widely used in the vegetated landslide for time series InSAR monitoring due to their permanent scattering features. This paper investigated the RCS features of a novel dihedral CR under multi-resource SAR datasets. An RCS reduction model for the novel dihedral corner reflector has been proposed to evaluate the energy loss caused by the deviation between the SAR incident angle and the CR’s axis. On the Huangtupo slope, Badong county, Hubei province, tens of dihedral CRs had been installed and the TSX–spotlight and Sentinel-TOPS data had been collected. Based on the observation results of CRs with more than ten deviation angles, the proposed reduction model was tested with preferable consistency under a real dataset, while 2 dBsm of systematic bias was verified in those datasets. The maximum incident angle deviation in the Sentinel data overlapping area is over 12°, which leads to a 2.4 dBsm RCS decrease for horizontally placed dihedral CRs estimated by the proposed model, which has also been testified by the observed results. The testing results from the Sentinel data show that in high, vegetation-covered mountain areas like the Huangtupo slope, the dihedral CRs with a 0.4 m slide length can be achieve 1 mm precision accuracy, while a side length of 0.2 m can achieve the same accuracy under TSX–spotlight data.

1. Introduction

The artificial corner reflector (CR) has been effectively applied in SAR calibration and deformation monitoring of Synthetic Aperture Radar (SAR) images for decades [1,2,3,4]. Owing to their exceptional scattering properties and precise coordinates, CRs play a crucial role in accurately determining SAR antenna patterns and absolute radiation calibration constants [1,5]. Additionally, they serve as precise control points for detecting geometric offsets in SAR images caused by satellite orbit deviations, geodynamic signals and so on [3,6,7]. CRs provide indispensable support for SAR sensor geometric and radiometric calibration, as well as the quality analysis of SAR images.
In 2007, Ferriti et al. demonstrated the millimeter-level precision achievable in deformation monitoring using artificial permanent scatterers through a mobile dihedral CR and Permanent Scatterer Interferometric SAR (PSInSAR) [8]. Xing et al. [9] and Xia et al. [10] identified millimeter-level deformation trends in highway areas and landslides, respectively, by employing CRs. Liu et al. [11] and Jauvin et al. [12] employed CR offset-tracking technology within mining areas and glacier monitoring, respectively. In both studies, significant meter-level deformation information was successfully extracted. Moreover, CRs have been applied in studies related to absolute positioning [13,14] and scatterer localization [15,16] in SAR images, showing significant potential for various applications.
The analysis of the Radar Cross Section (RCS) of CRs holds significant importance in SAR calibration, CR design and the assessment of monitoring accuracy [17]. The triangular CR is widely employed due to its stable structure and large angle of 3 dB RCS reduction in the azimuth direction. Extensive theoretical analysis and experimental research on the RCS of triangular CRs have been conducted [18,19,20,21]. Matthew et al. [20] deployed over 40 triangular CRs in Gunning, Australia, and studied the factors contributing to RCS loss of triangular CRs under multi-resource SAR data. They also provided size selection and installation recommendations for triangular CRs under different bands. In comparison to the triangular CR, the dihedral CR is characterized by a simpler structure and stronger scattering signal under the same size. However, due to the high sensitivity in azimuthal alignment deviations, there has been limited research on RCS measurements and deformation monitoring applications related to the dihedral CR.
Currently, the RCS analysis of dihedral CRs is primarily focused on theoretical simulation. Wang et al. [22] and Timothy et al. [23], based on physical optics and diffraction theory, have derived a model for the RCS reduction of dihedral CRs at any viewing angle. Anderson et al.’s study indicates that a 5° vertical angle discrepancy between two panels results in approximately 6 dB RCS reduction [24]. Timothy et al. [25] and Lu et al. [26] analyzed the impact of a dielectric constant and the coating of absorptive materials to the RCS of dihedral CRs. The result indicates that a normalized surface impedance coefficient of 0.2 leads to an approximate 5 dBsm loss in scattered energy. The theoretical RCS formulas in previous studies take into account the incident angles, the included angle between the two panels and the dielectric constant. However, it was excessively complicated when these formulas were applied to the panel dimension and tilt angle design of dihedral CRs for SAR deformation monitoring applications.
Due to the novel design of the dihedral CR in this paper and numerous commercial SAR satellites with different incident angles, the CR’s axis will misalign with the SAR incident signal, resulting in RCS reduction and deformation monitoring accuracy discrepancy. Furthermore, testing the dihedral CR’s performance in real SAR data is essential for the CR design in the landslide monitoring project. This paper proposes a simplified model for the RCS calculation of the dihedral CR considering both the panel size and the SAR local incidence angle change. Based on the CR array with varying tilted angles and sizes on the Huangtupo slope, Badong county, Hubei province, China, overlapping Sentinel data and TSX data with ascending and descending tracks, we conduct empirical research on the RCS reduction of dihedral CR arrays and evaluate the deformation monitoring accuracy. Finally, we provided design recommendations for CR size based on the experimental results.

2. The RCS Calculation Model for Dihedral CR

2.1. The Standard RCS Model of Dihedral CR

The RCS characterizes the energy of a ground target for scattering the radar signal, which can be calculated using the following formula:
σ = 4 π · S e 2 λ 2
where λ represents the radar wavelength and S e denotes the radar effective scattering area.
For the RCS calculation of an ideal triangular CR and dihedral CR, there are standard calculation formulas in radar applications [8,20]. They assume that the CR axis is aligned with the incident direction of the SAR signal. However, due to the different incident angles of multi-SAR satellites, when the corner reflector adapts to the incident angle of one satellite, its axis would deviate from the incident angle of other satellites. This paper proposes a model for estimating the RCS reduction caused by the deviation between the incident angle and the CR’s axis, without considering the influence of the panel’s dielectric constant [25,26].
Taking the dihedral CR with a square panel of side length L as an example, when the CR axis coincides with the radar incident light, its theoretical RCS calculation formula is as follows [8]:
σ D = 8 π L 4 λ 2
Figure 1b shows the three-dimensional schematic diagram of the effective scattering area, and the corresponding cross-section is shown by the green dotted line in Figure 1a.

2.2. A Simplified RCS Model for a Dihedral CR Considering the Incident Angle Changes

Regardless of the type of corner reflector, the RCS of the CR is directly related to its effective scattering area, which changes with the CR’s size and the direction of the SAR incident beam. In this paper, we analyze the reduction of the effective scattering area S e with a deviation angle β between the SAR incident angle and the CR axis. Figure 1a illustrates the cross section of a dihedral CR with a square panel, in which η   and α represent the SAR local incident angle and the CR’s tilt angle, respectively. When the deviation angle β exists, the effective scattering area S e (shown in Figure 1b) is smaller than the case when the CR axis is aligned to the SAR incident angle.
According to the geometry, S e can be derived by S e with a deviation angle β:
S e = 2 s i n 45 β S e
Combining Equations (1) and (3), this paper proposes a simplified estimation model of RCS reduction of the dihedral CR that takes into account the deviation angle. When there is a deviation angle β, the RCS reduction of a dihedral CR with a square panel is as follows:
σ D q = 16 π L 4 s i n 2 ( 45 | β | ) λ 2
In the same way, the RCS reduction of a dihedral CR with a semicircular panel is as follows:
σ D c = π 3 R 4 s i n 2 ( 45 | β | ) 4 λ 2
where R represents the diameter of the semicircular pane.

2.3. The RCS Feature Comparison of Triangular and Dihedral CRs

To evaluate the relationship between side length and corner reflector RCS, Figure 2a shows the RCS curve with the panel side length change of the dihedral CR (Equation (4)) and the triangular CR [27] under a C-band SAR sensor. The scattering energy of the dihedral CR is about 8 dBsm higher than the triangular CR under the same side length. Due to the return orbit design characteristics of most spaceborne SARs, the heading angle in a certain area is maintained at a fixed angle. If the azimuth alignment accuracy of the dihedral CR can be guaranteed during the installation, the RCS of the dihedral CR with the same side length will be significantly better than that of the triangular CR.
Figure 2b illuminates the RCS reduction curve caused by the deviation angle. The side lengths of the dihedral CR with the square panel and the triangular CR are set as 0.7 m. Referring to Equation (4), we calculated the RCS reduction of these two corner reflectors as the deviation angle increases. The RCS reduction of the dihedral CR reaches 3 dB with a deviation angle of 16°, while the triangular reflector is approximately 20°. The deviation angles of the dihedral CR in our study are about 1~3° and 9~14° under Sentinel data. The maximum deviation angle of the same reflector reaches 12°, which leads to an RCS reduction of 2.4 dBsm.

3. The Novel Dihedral CR and SAR Data Set

3.1. The Novel Dihedral CR Design and Location

The Huangtupo slope, located in Badong city, Hubei province, China, was designated as a national field scientific observation and research station by the Ministry of Science and Technology in 2020. Since 2019, Wuhan University and China University of Geosciences (Wuhan) have collaborated to install over 20 artificial corner reflectors with varying tilt angles and panel sizes on the Huangtupo slope, as depicted in Figure 3. These CRs are mounted on pre-constructed cement piers, and their coordinates are accurately measured using GNSS with a centimeter-level. The orientation of the CRs is accurately aligned with the satellite heading angle utilizing GNSS directional instruments by PandaGNSS company in Wuhan, China.
This article introduces a novel dihedral CR (illustrated in Figure 4), with its core component being a trapezoidal connecting platform (refer to Figure 4b,d). The angles of the trapezoidal platform are specifically designed to align with the heading direction of SAR satellites, while the inclinations on both sides are designed to match the SAR local incidence angle. Its symmetrical structure enables observation from both ascending and descending satellite orbits.
Taking the example of a dihedral CR with a semicircular panel with a diameter of 0.6 m, as illustrated in Figure 4a, the bottom semicircular panel is inclined at 15° with respect to the horizontal plane. The central axis of the CR aligns with the SAR local incidence angle of 30°, resulting in the trapezoidal platform sides being inclined at 75°. In Figure 4c, a dihedral CR with a square panel whose side length on each side is 0.4-m is depicted, specifically designed for a SAR satellite with a 45° local incidence angle.

3.2. The Multi-Resource SAR Data

Figure 3c shows the TSX and Sentinel dataset on the Huangtupo slope, as well as the installation time and on-site photos of various CR types. The imaging parameters of multi-satellite SAR data are presented in Table 1. The local incident angles for the ascending and descending TSX–spotlight data are 38° and 29°, respectively. For the Sentinel data on the Huangtupo slope, there is an overlap between the third swath in the 084 track and the first swath in the 011 track. The local incident angles of these two tracks are 44° and 32°, respectively.
Figure 5 illustrates the average intensity of the image of the CR array on the Huangtupo slope with the Sentinel and TSX data. Since most CRs are installed in vegetation-covered areas with low reflection energy, the CR targets can be visually identified. In general, CRs appear in radar images as approximately 2 × 2 or 3 × 3 pixels in the Sentinel data. In the overlapping Sentinel data or the ascending and descending TSX data, the maximum difference between the deviation angles under two tracks is approximately 12°, resulting in nearly 3 dB pixel intensity difference.

3.3. The Deviation Angles of the CR Array

The misalignment of the CR’s axis with the SAR incident angle affects the CR’s scattering intensity. The accurate RCS reduction curve of the CR, based on the deviation angle, can be determined from the observed results under real SAR data. This information, combined with the required deformation monitoring accuracy, can be used to guide the design of the CR’s size and inclination.
The CRs on the Huangtupo slope are completely symmetrical under the ascending and descending SAR data. The two panels are also completely symmetrical. The RCS reduction by the deviation angle differences under different SAR tracks weakens the influence of system errors, such as the panel dielectric constant or sensor thermal noise, which can more accurately evaluate the RCS reduction caused by the change of incident angle. Additionally, it aids in assessing the quality of the CR product or the impact of the installation environment.
One the Huangtupo slope, three types of dihedral CR with different horizontal tilt angles have been installed. The CRs with the square panels cannot tilt upwards, and their tilt angle is 0°. The dihedral CRs with the semi-circular panels are not only horizontally positioned but also available in two inclined configurations with tilts of 10° and 15°. Table 2 presents the deviation angles corresponding to the ascending and descending TSX data and overlapped Sentinel data for each type of CR. Each CR has two deviation angles in the TSX or Sentinel data.
We define the deviation angle difference between the two deviation angles as follows:
Δ β = β 1 β 2
where Δβ represents the deviation angle difference. The deviation angles for the CR under the ascending and descending TSX or overlap Sentinel data are denoted as β₁ and β₂.
From Table 2, it can be observed that the CRs with three different tilt angles exhibit six deviation angles under the ascending and descending TSX data or overlap Sentinel data. These deviation angles range from 1° to 16°, resulting in six deviation angle differences, distributed between 3° and 12°. In actual observations, the deviation angle is less than 20° because the SAR incident angles generally range from 25° to 45°. The CR array in Huangtupo could provide comprehensive sampling for validating the RCS reduction with the misalignment.

4. The RCS Features of the CR Array in Multi-Resource SAR

4.1. The RCS Reduction Trend and Systematic Bias Analysis

Experimentally measuring the RCS reduction with respect to the deviation angle under real SAR data provides more realistic results compared to theoretical derivations. However, challenges may still exist, such as stringent experimental conditions and environmental background noise. The measured RCS in SAR data is typically calculated using the integration method [20]. Figure 5a,c illustrate the RCS mean and variance of the CR array calculated using the integration method under the Sentinel and TSX data. a few values that are influenced by environmental influences or alignment deviations are excluded. Figure 5a,c also depict the RCS reduction with the deviation angle β, and the solid lines represent the values calculated by the proposed model.
The model proposed does not consider factors like the panels’ dielectric constants, leading to the slight overestimation of the RCS. Figure 6b,d illustrate the difference between the measured RCS and model values under the Sentinel and TSX data. The system deviations of most CRs (nearly 70%) are concentrated within 0.5~2 dBsm, and there is no significant difference observed among CRs with different panel types. Overall, the RCS reduction trends in the measured results align with the trends from the model.
In the Sentinel data, the variance of the RCS increases with the reduction in the CRs’ panel size. The variances of the dihedral CR with the semi-circular panel with side lengths of 0.6 m and 0.8 m are approximately 2 and 1 dBsm, respectively. It means smaller-sized CRs experience larger impacts from environmental noise due to a relatively lower signal-to-clutter ratio (SCR). The observed discrepancy between the measured and modeled RCS follows the same pattern with RCS variance.
For the TSX data, the CR’s panel size change has minimal impact on RCS variance and the disparities between the measured and modeled values. Most CRs exhibit RCS variances within 0.5 dBsm, attributed to the high signal-to-noise ratio in the TSX spotlight mode. The SCR for the dihedral CR with a 0.6 m panel size can reach 30 dB maximumly. Consequently, the discrepancies between the measured and modeled RCSs are more likely attributed to the CRs’ inherent qualities or environmental influences. For instance, the dihedral CR with a semi-circular panel of 0.8 m loses signal in descending TSX data, and the remaining two observations in ascending TSX data exhibit 2.5~5 dBsm discrepancies compared to theoretical values. Additionally, the measured RCS of DR4 in both ascending and descending TSX data shows substantial disparities with theoretical values, exceeding 5 dBsm in this case. These discrepancies may arise from environmental influences or alignment deviations during CR installation [8,22].

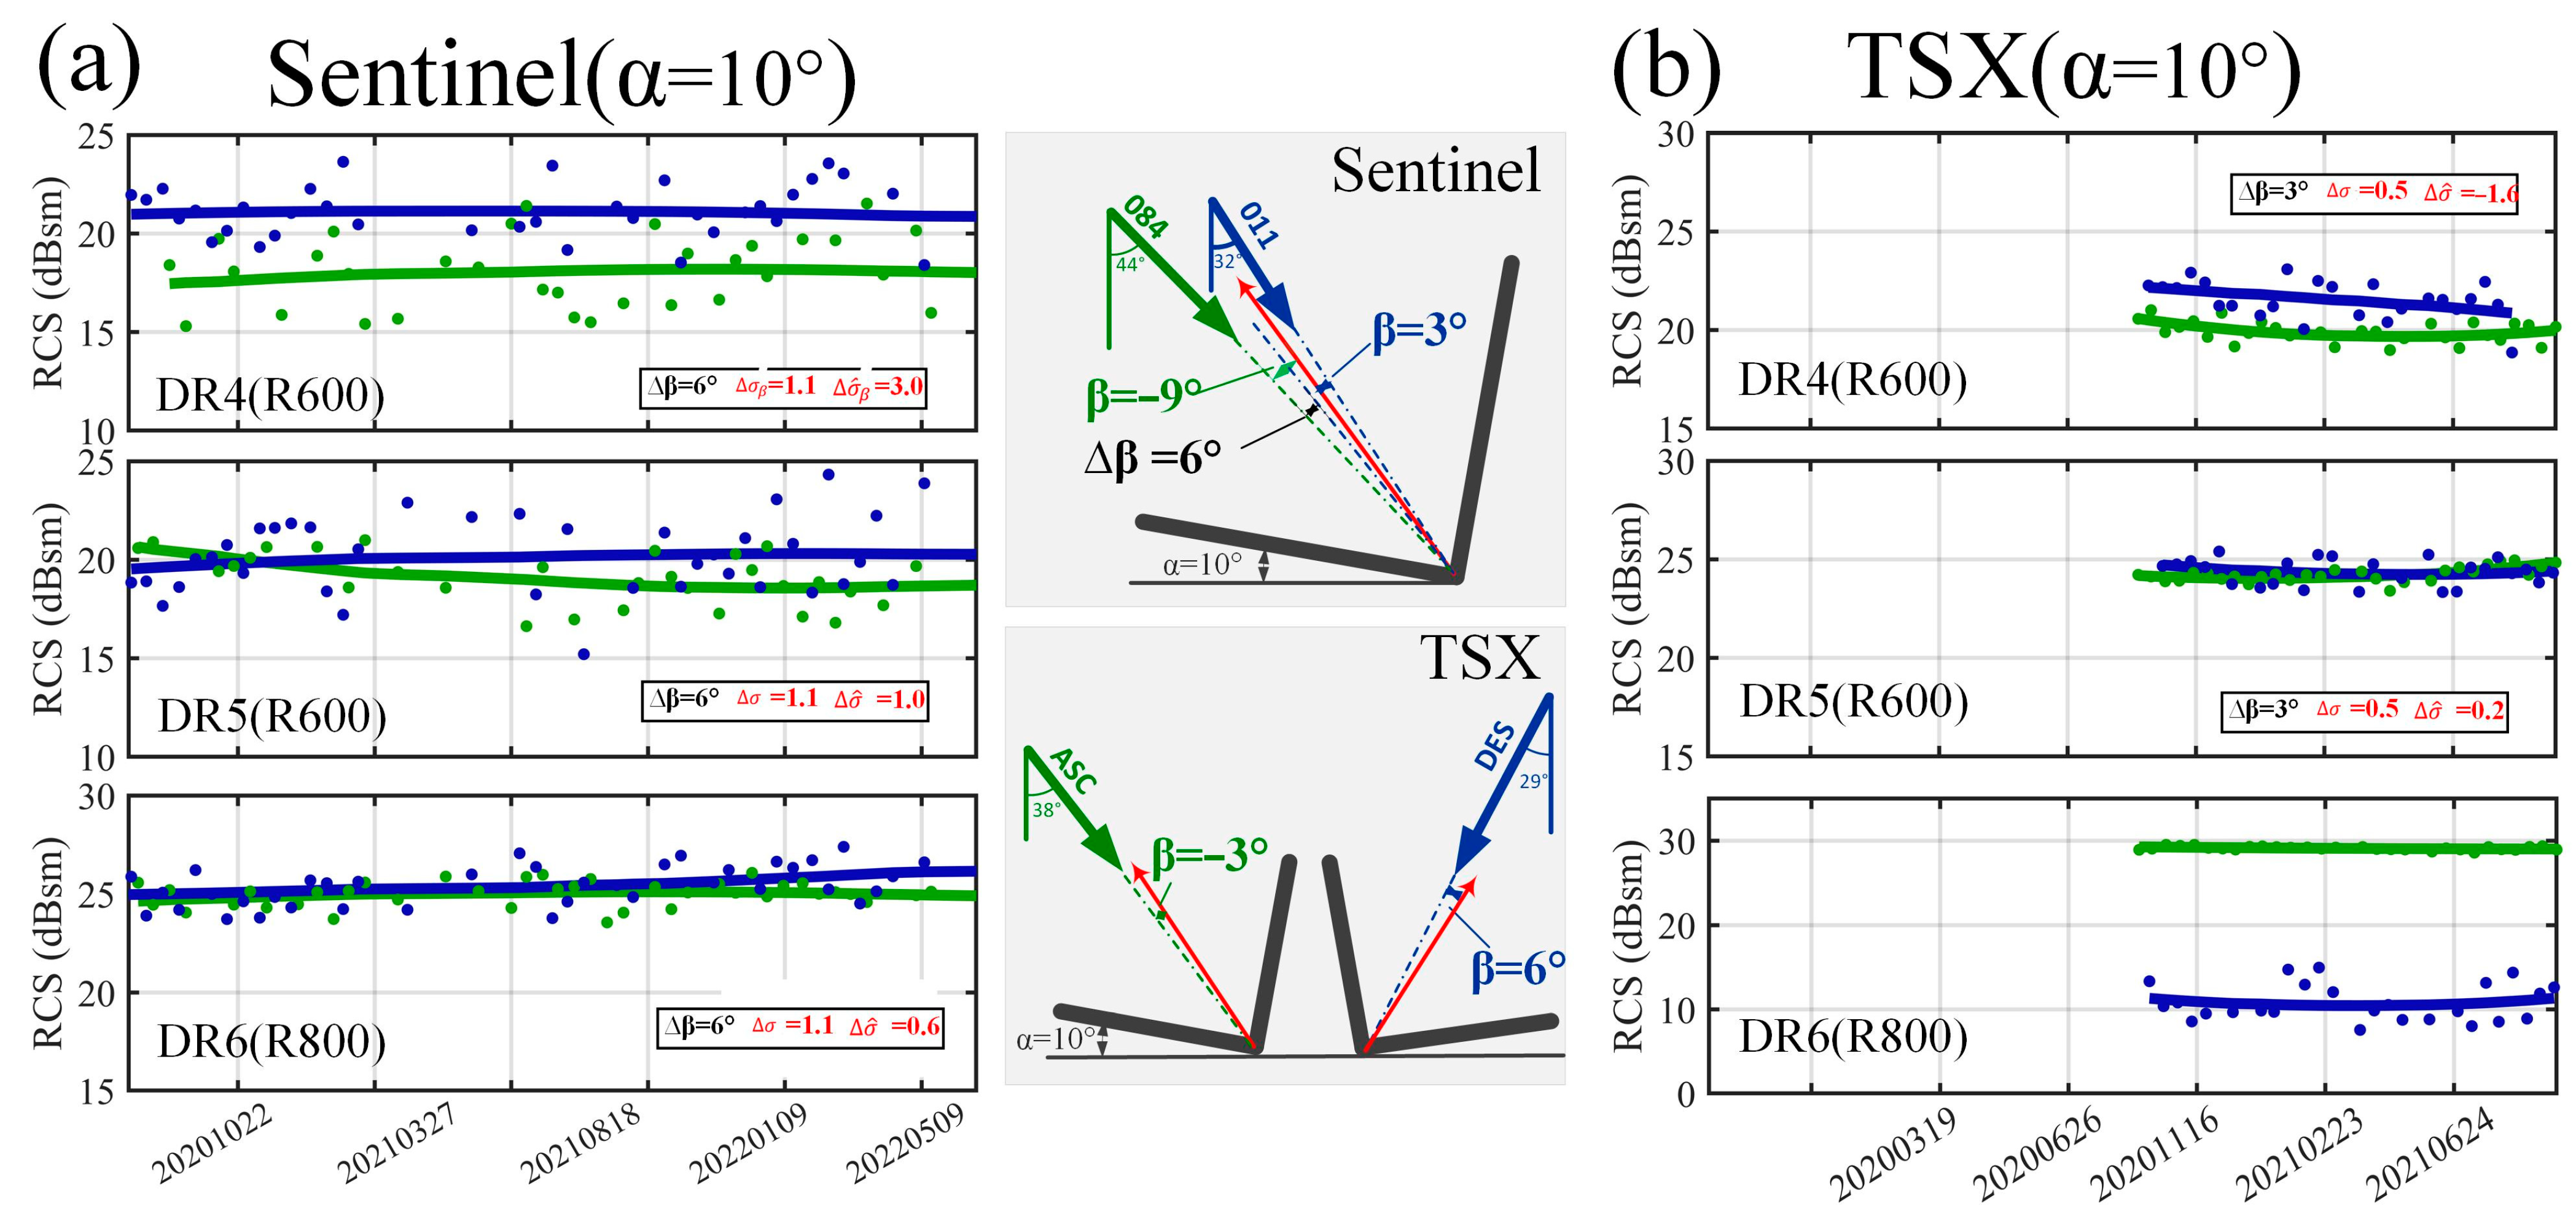
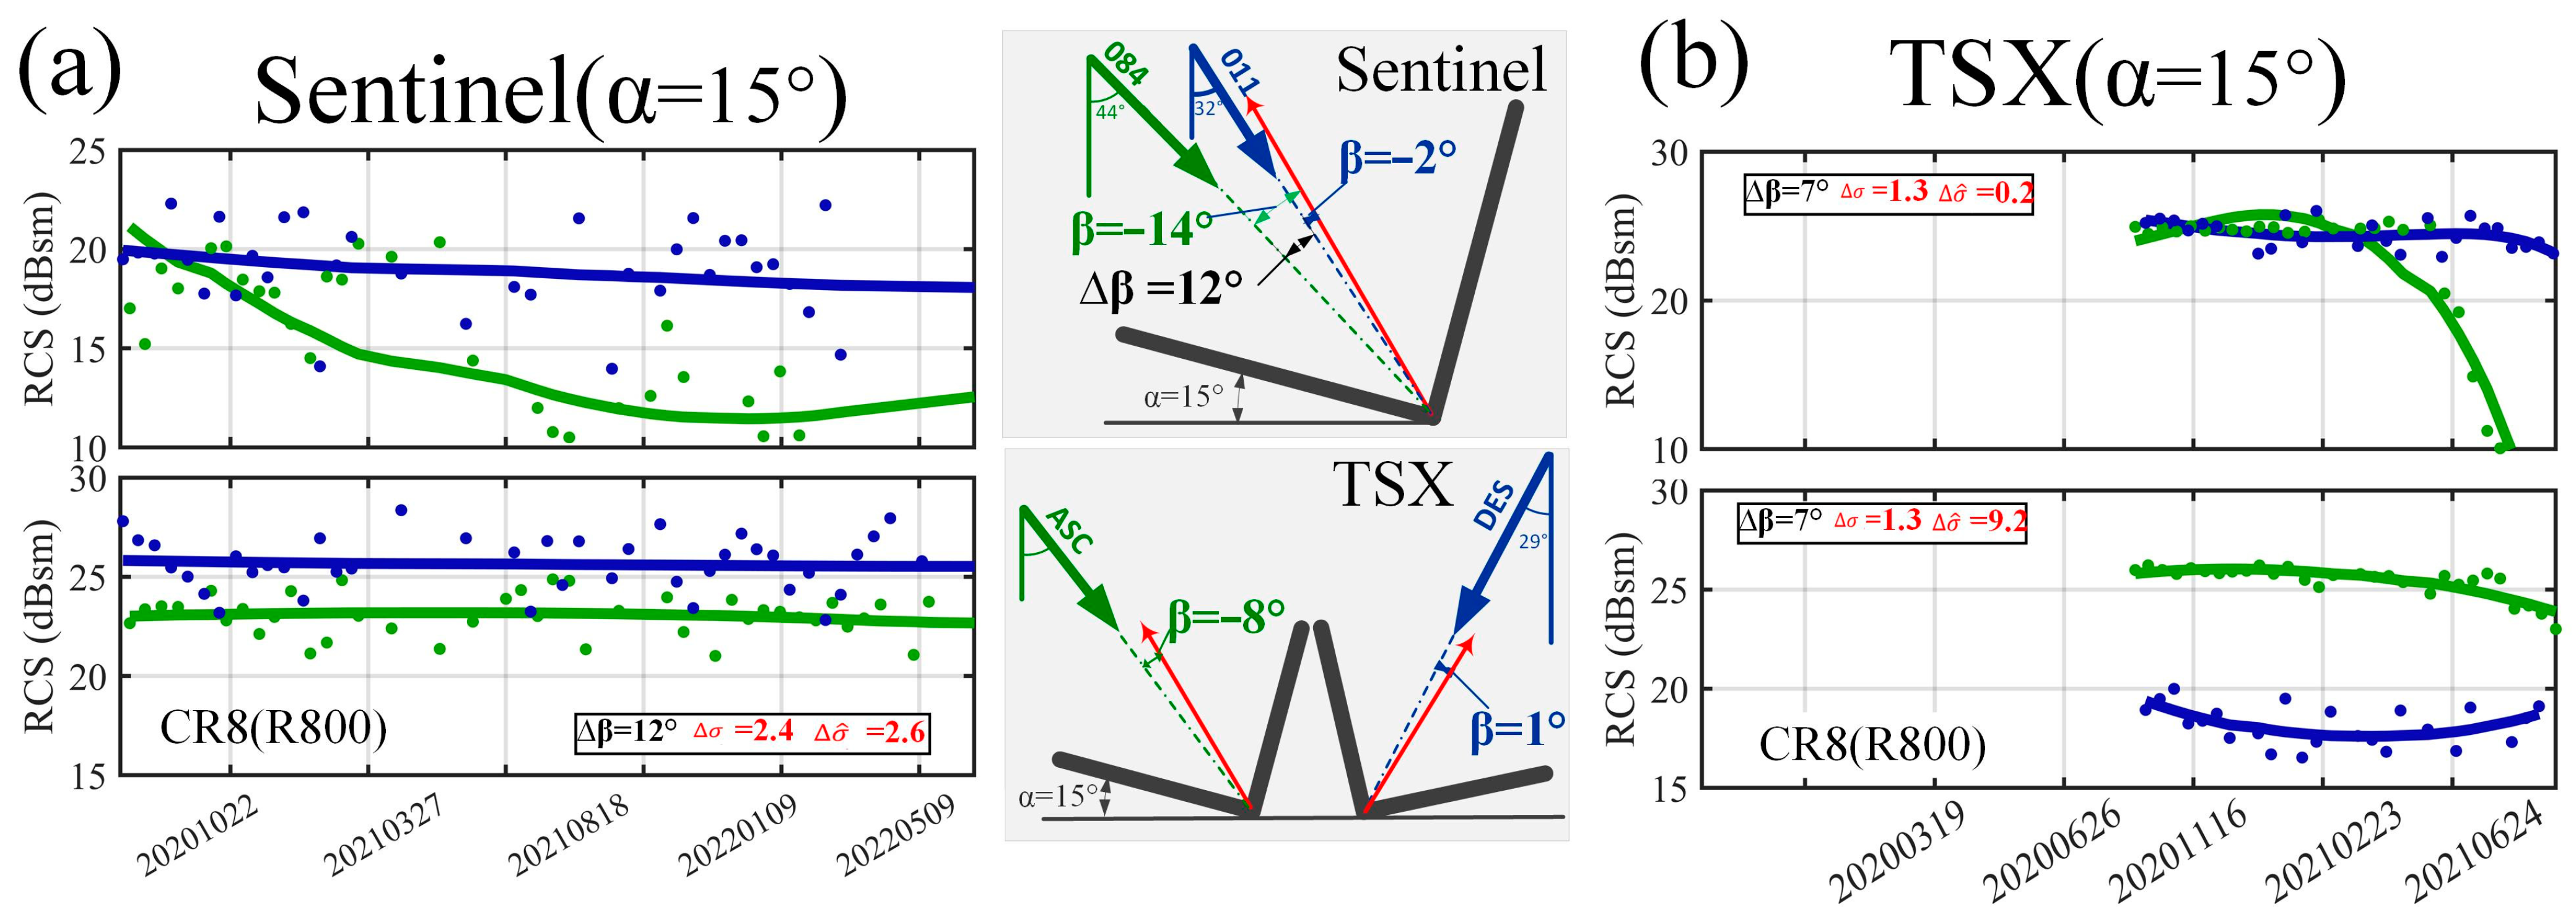
4.2. The RCS Reduction Difference of CRs with Different Tilt Angles

In this section, a comparative analysis was conducted on the RCS reduction difference of CRs under TSX and Sentinel data, including observed and modeled results. The observation of the RCS reduction difference helps mitigate the impact of systematic biases caused by CR manufacturing processes or panel dielectric constants, providing a better assessment of RCS reductions induced by the changes of incident angles.
Figure 7, Figure 8, Figure 9 and Figure 10 depict the RCS time series for the triangular CRs and dihedral CRs with 0°, 10°, and 15° horizontal tilt angles under TSX and Sentinel data. In these figures, the green and blue curves represent the measured RCS results in different orbits. The bottom right corner indicates the deviation angle difference (∆β) between the two tracks. The terms σ and σ ^ represent the RCS reduction difference caused by ∆β from the model calculations and measurements, respectively.
The horizontal tilt angle of the triangular CR under investigation is 20°. In the overlapping Sentinel data, there is a deviation angle difference of 6°, leading to a 0.4 dBsm and 0.7~0.9 dBsm RCS reduction difference in the model and the measurement, respectively. In the TSX data, the deviation angle difference under the ascending and descending orbits is 3°. The RCS reduction difference calculated from the model and the measurement are 0.1 dBsm and 0.3~0.4 dBsm, respectively. This indicates that the RCS reduction resulting from the deviation angle difference within 6 degrees for the triangular CR is minimal. The discrepancies between the measured and modeled RCS reduction differences under Sentinel and TSX are within the range of 0.5 dBsm and 0.3 dBsm, respectively. These deviations may be attributed to the thermal noise in the radar system or signal truncation losses caused by sampling. However, the overall small differences indicate a generally high quality of triangular CR. The observed RCS time series results demonstrate the stability and reliability of the triangular CR.
Figure 8 illustrates the RCS time series for horizontally placed dihedral CRs. It exhibits large deviation angles under Sentinel and TSX data, reaching up to 12° and 9°, respectively. The modeled RCS discrepancies are 2.4 dBsm and 2 dBsm, respectively.
Based on measurements from the Sentinel data, the ( σ ^ ) by deviation angle differences of DR1 and DR3 show close agreement between the measured and modeled values, ranging from 2.9 to 3.3 dBsm. The measured results indicate that a 12° deviation angle leads to half energy loss. This highlights the significance of aligning the CR axis with the radar’s incident angle during the design of the CR tilt angle. By utilizing the pronounced RCS features of the dihedral CR, crucial standards can be established for identifying targets, such as dihedral reflection structures (e.g., walls), within the overlapping area of Sentinel images.
For the TSX data, the measured RCS reduction differences ( σ ^ )   for DR2 and DR3 show negligible deviations from the modeled values, with differences within 0.5 dBsm. However, the measured RCS reduction difference for DR1 reaches 7.1 dBsm. Considering the fluctuation of the RCS time series for DR1 in the descending TSX data, it becomes evident that the scattering energy of DR1 is unstable. Following an on-site investigation, it was discovered that the issue stemmed from misalignment towards the ascending orbit during azimuth alignment. This resulted in a deviation of a few degrees for the panels in descending orbit with respect to the radar beam.
Figure 9 depicts the RCS time series of a dihedral CR with a 10° horizontal tilt angle in multi-resource SAR data. The incident angles for both SAR datasets fall within the range of 29~44°, resulting in relatively small deviation angles and differences for the CR with a 10° tilt angle under both SAR datasets.
In the Sentinel data, the modeled and measured RCS reduction differences resulting from the deviation angle difference (∆β) for DR5 and DR6 are relatively small, within 0.5 dBsm. DR4 shows an RCS reduction difference ( σ ^ ) of 2 dBsm, and its RCS in the TSX data is approximately 3 dBsm lower than that of an equivalent-sized CR. The observed RCS reduction difference ( σ ^ ) in the ascending and descending TSX data differs by about 2.1 dBsm from the model values, indicating a slight obstruction caused by surrounding trees. Additionally, in the descending TSX data, the reflection from DR6 has attenuated by nearly 20 dBsm compared to the ascending TSX data, attributed to the same reasons as observed in DR1. In conclusion, except for CRs with noticeably attenuated reflection, the measured and modeled RCS reduction differences for other CRs in the Sentinel and TSX data are quite consistent, with deviations within 0.5 dBsm. This analysis also indicates that the examination of RCS reduction and RCS reduction difference can serve as a reference for CR quality inspection.
Figure 10 illustrates the RCS time series of a dihedral CR with 15° tilt angle, resulting in incident deviation angles of 12° and 7° in the Sentinel and TSX data, respectively. In the Sentinel data, the measured RCS reduction difference of DR8 deviates by 0.2 dBsm from the theoretical value. In the TSX data, the RCS experiences a nearly 9 dBsm decrease in the descending orbit compared to the ascending orbit, with the same underlying cause as DR1. In the ascending orbit, DR7’s RCS has been gradually declining since March 2021. This phenomenon is evident in both the Sentinel and TSX data and is attributed to gradual obstruction due to the growth of thatch on the ascending orbit side.
In this section, a comparative analysis of the measured and modeled RCS reduction differences for CRs under different orbits has revealed that certain CRs may encounter issues such as panel quality, alignment deviations during installation and obstructions in the surrounding environment. This suggests that analyzing RCS reduction differences can serve as a basis for assessing the reliability of CR production or installation.

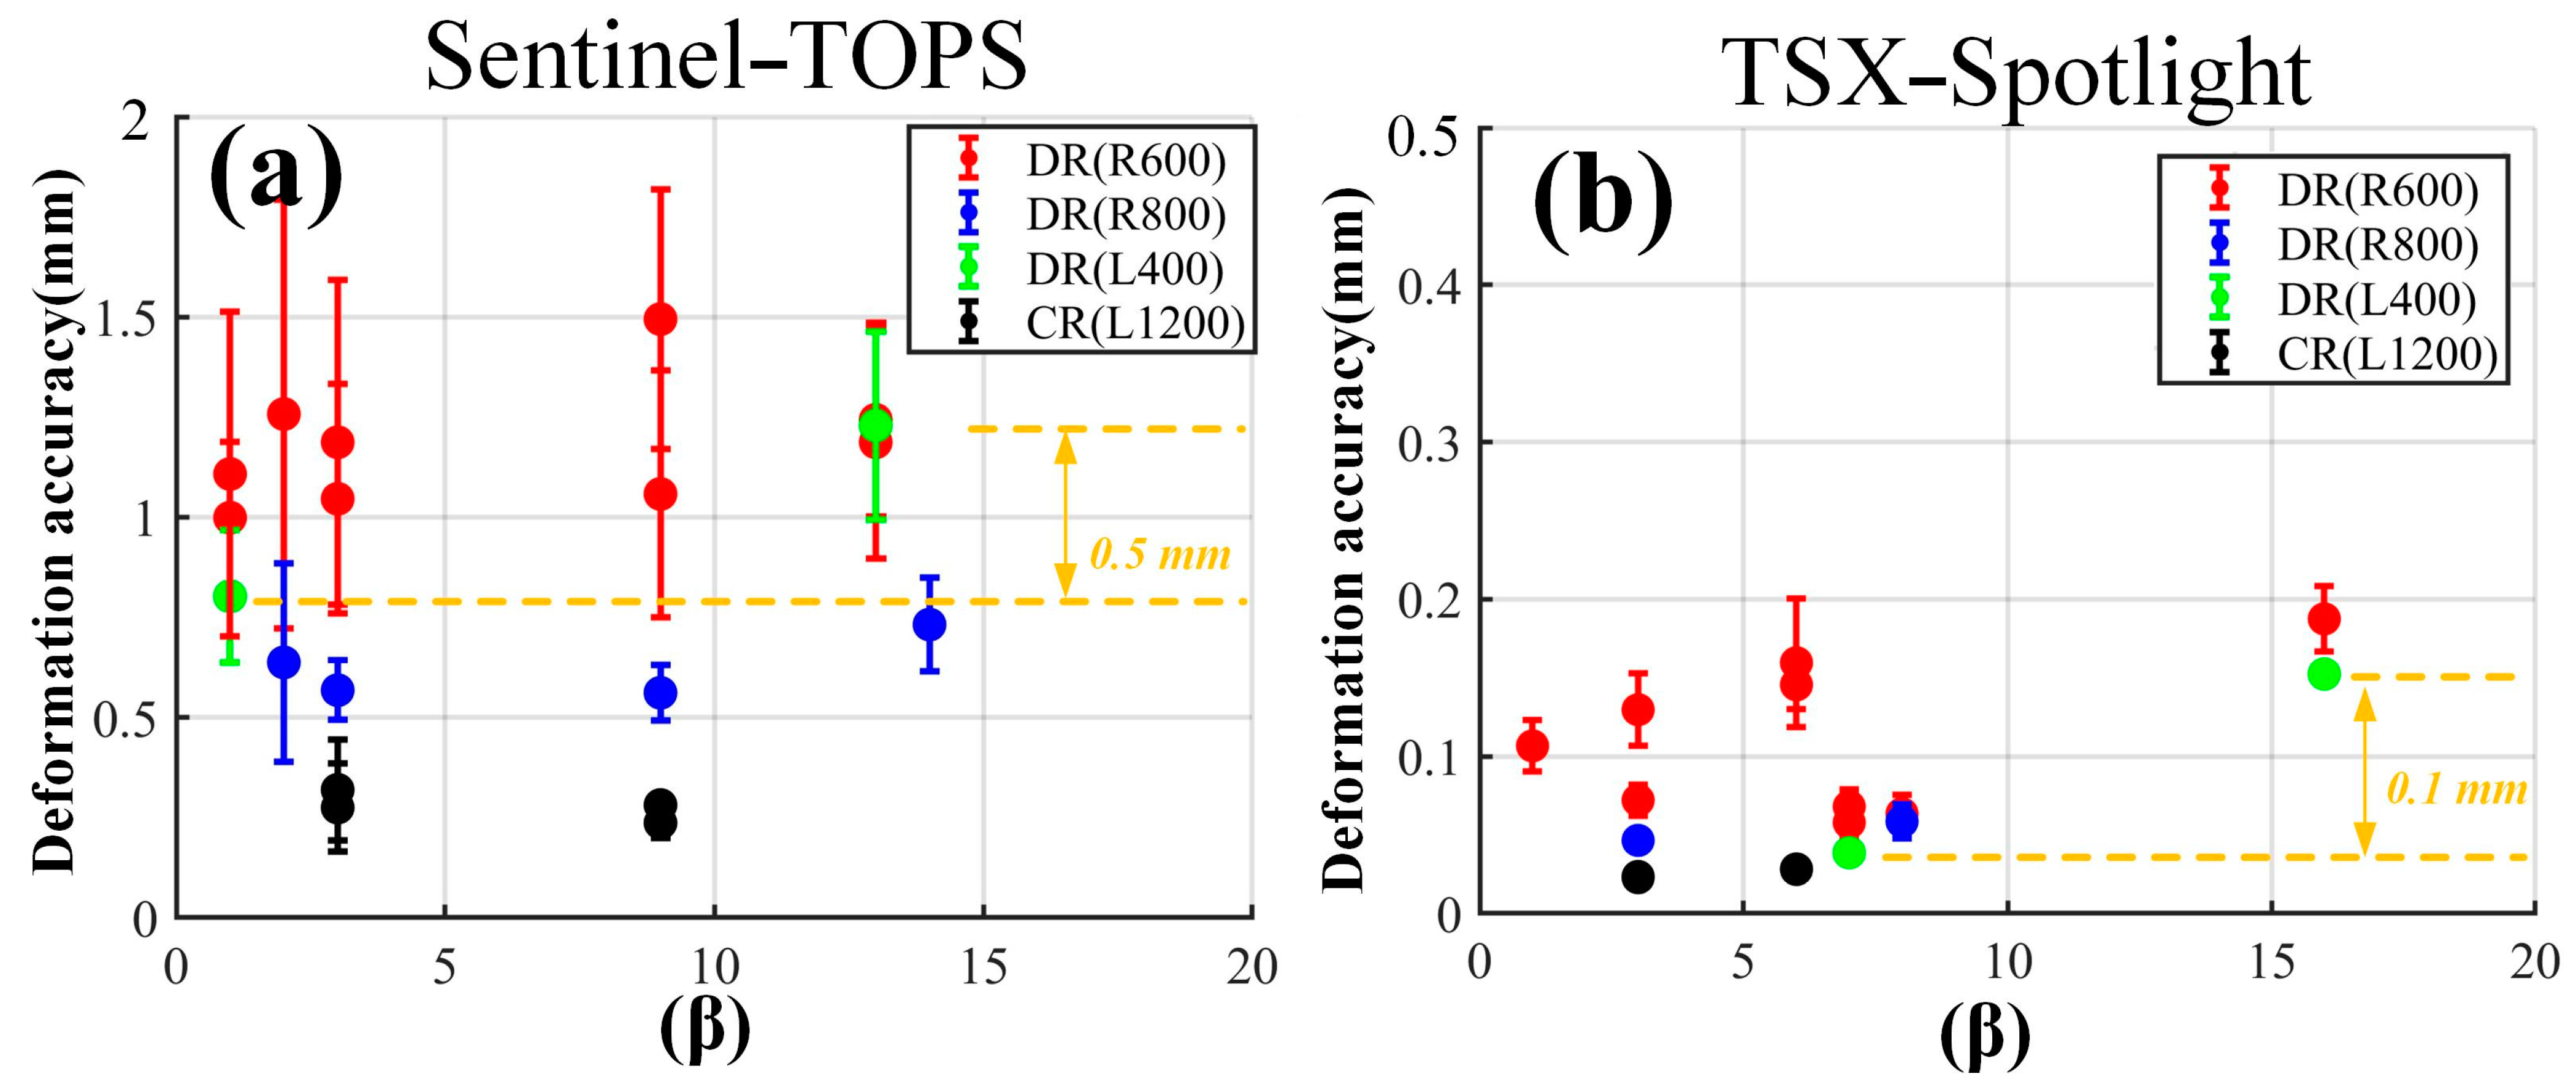
4.3. The Theoretical Deformation Monitoring Accuracy in the Theory of the CR Array

SCR is the key to estimating the theoretical deformation monitoring accuracy [19,28], which is commonly used in PSInSAR time-series analyses to assess the deformation monitoring capabilities achievable for permanent scatterers. The deformation monitoring accuracy is calculated using the following equation:
d e λ 4 π × 1 S C R
In engineering applications, achieving a deformation monitoring accuracy of 1 mm necessitates the design of appropriate panel dimensions and tilt angles. This can be accomplished by considering both the background energy and the RCS values of CRs. Figure 11 illustrates the theoretical deformation monitoring accuracy of CRs corresponding to the SCR value under the Sentinel and TSX data in this study.
In the Sentinel data (refer to Figure 11a), the theoretical deformation monitoring accuracy by the measured SCR corresponding to the dihedral CR with a semicircular panel with a diameter of 0.6 m fluctuates within the range of 1 to 1.5 mm. The dihedral CR square panel with a side length of 0.4 m has a slightly larger effective reflective area compared to the dihedral CR with semicircular panels with a diameter of 0.6 m. An increase of the deviation angle to 12° leads to a maximum reduction in accuracy by nearly 0.5 mm, highlighting the significant impact of the deviation angle on monitoring precision, particularly in CRs with smaller panel sizes. The dihedral or triangular CRs with larger panel sizes, such as those 0.8 m in diameter, meet the demands for millimeter-level deformation monitoring across different deviation angles.
In the TSX data (refer to Figure 11b), the measured SCR for the smallest-sized dihedral CR with semicircular panels with a diameter of 0.6 m is around 25 dB, corresponding to a theoretical deformation monitoring accuracy of 0.14 mm. The accuracy of all corner reflectors is within 0.2 mm, with negligible influence on the deviation angle change. The statistical analysis of deformation monitoring accuracy across various types of CRs indicates that on a slope, the dimensions of the CR can be further reduced for TSX data for millimeter deformation accuracy. According to the proposed RCS model (Equation (4)) and SCR formula (Equation (7)), and considering the background scatter intensity of the Huangtupo slope, an SCR of 10 dB is enough to reach millimeter deformation level, which means a dihedral CR with square panel with a side length of 0.2 m or semicircular panel with a diameter of 0.3 m for dihedral CRs can achieve deformation monitoring accuracy at the 1 mm level.

5. Conclusions

In this paper, we analyze the RCS performance and deformation monitoring accuracy of a novel dihedral CR array under multi-resource SAR data. A simplified model for estimating the RCS reduction caused by the deviation angle between the SAR incident angle and the CR’s axis is presented. Through verification using multi-resource SAR data and various types of CR on the Huangtupo slope, it was found that the proposed model introduces a systematic overestimation bias of approximately 2 dBsm with the neglecting of panel dielectric constants and related parameters. Through a comparative analysis of RCS time series derived from the proposed model and the actual measurements, it was identified that certain dihedral CRs exhibit environmental obstructions and installation defects. The methodology presented in this paper could be used to assess the CRs’ product quality and the environment condition around CRs.
The analysis of the RCS time series results from overlapping Sentinel data indicates that for the horizontally placed dihedral CR, the deviation angle difference is approximately 12°. This leads to a reduction of about 3 dBsm in the RCS of the horizontally placed dihedral CR with a side length of 0.4, which may result in maximum 0.5 mm deformation accuracy loss in the Sentinel data. This characteristic will serve as a vital reference for extracting homogenous strong scatterers, such as building walls, in the overlapping regions under Sentinel data.
Based on the observed result of the theoretical deformation monitoring accuracy of the CR array on the Huangtupo slope, it is evident that the compactly designed CRs in this study were capable both with ascending and descending multi-resource SAR data. Our results show that for Sentinel data, a square panel with a side length of 0.4 m can achieve 1 mm deformation monitoring accuracy, and for X–band spotlight mode data, the size can be reduced to 0.2 m.
In the future, establishing CR arrays with larger scales could provide more accurate models for the RCS reduction by deviation angles through empirical measurement results.

Author Contributions

Conceptualization, T.L.; Methodology, J.L. and S.M.; Validation, Y.X.; Formal analysis, S.M. and Y.X.; Resources, T.L.; Writing—original draft, J.L.; Writing—review & editing, T.L., Y.W. and and G.N.; Supervision, and G.N.; Funding acquisition, T.L. All authors have read and agreed to the published version of the manuscript.

Funding

This research is supported by the National Natural Science Foundation of China (NSFC), grant number 42074031, U2340228, 41674032.

Data Availability Statement

The TSX datasets presented in this article are not readily available because the data are part of an ongoing study. Requests to access the datasets should be directed to the corresponding author.

Conflicts of Interest

The authors declare no conflict of interest.

References

  1. Zhang, G.; Jiang, Y.; Li, L.; Deng, M.; Zhao, R. Research progress of high-resolution optical/SAR satellite geometric radiometric calibration. Acta Geod. Cartogr. Sin. 2019, 48, 1604–1623. [Google Scholar]
  2. Li, T.; Tang, X.M.; Gao, X.M.; Chen, Q.F.; Zhang, X. Analysis and outlook of the operational topographic surveying and mapping capability of the SAR satellites. Acta Geod. Cartogr. Sin. 2021, 50, 891–904. [Google Scholar]
  3. Freeman, A. SAR calibration: An overview. IEEE Trans. Geosci. Remote Sens. 1992, 30, 1107–1121. [Google Scholar] [CrossRef]
  4. Xu, C.J.; He, P.; Wen, Y.M.; Yang, Y.L. Crustal Deformation Monitoring of Xianshuihe Fault by CR-InSAR. Geomat. Inf. Sci. Wuhan Univ. 2012, 37, 302–305. [Google Scholar]
  5. Huang, Q.; Zhang, F.; Li, L.; Liu, X.; Jiao, Y.; Yuan, X.; Li, H. Quick Quality Assessment and Radiometric Calibration of C-SAR/01 Satellite Using Flexible Automatic Corner Reflector. Remote Sens. 2023, 15, 104. [Google Scholar] [CrossRef]
  6. Shimada, M.; Isoguchi, O.; Tadono, T.; Isono, K. PALSAR Radiometric and Geometric Calibration. IEEE Trans. Geosci. Remote Sens. 2009, 47, 3915–3932. [Google Scholar] [CrossRef]
  7. Zhao, R.; Zhang, G.; Deng, M.; Yang, F.; Chen, Z.; Zheng, Y. Multimode Hybrid Geometric Calibration of Spaceborne SAR Considering Atmospheric Propagation Delay. Remote Sens. 2017, 9, 464. [Google Scholar] [CrossRef]
  8. Ferretti, A.; Savio, G.; Barzaghi, R.; Borghi, A.; Musazzi, S.; Novali, F.; Prati, C.; Rocca, F. Submillimeter Accuracy of InSAR Time Series: Experimental Validation. IEEE Trans. Geosci. Remote Sens. 2007, 45, 1142–1153. [Google Scholar] [CrossRef]
  9. Xing, X.M.; Zhu, J.J.; Wang, C.C.; Yi, H. A New Method for CR Point Identification and It’s Application to Highway Deformation Monitoring. Geomat. Inf. Sci. Wuhan Univ. 2011, 36, 699–703. [Google Scholar]
  10. Xia, Z.G.; Motagh, M.; Li, T. Performance Analysis of Dihedral Corner Reflectors for Slope Movements: A Case Study From Aniangzhai Landslide in China. IEEE Geosci. Remote Sens. Lett. 2022, 19, 1–5. [Google Scholar] [CrossRef]
  11. Liu, Z.; Bian, Z.; Liu, W. Monitoring of large and inconsistent deformation in coal mining area using point-like target offset tracking. Int. J. Remote Sens. 2022, 43, 1157–1177. [Google Scholar] [CrossRef]
  12. Jauvin, M.; Yan, Y.; Trouvé, E.; Fruneau, B.; Gay, M.; Girard, B. Integration of Corner Reflectors for the Monitoring of Mountain Glacier Areas with Sentinel-1 Time Series. Remote Sens. 2019, 11, 988. [Google Scholar] [CrossRef]
  13. Song, R.; Wu, J.; Ma, M.; Zhang, X.; Li, T. Absolute Geolocation of Corner Reflectors Using High-Resolution Synthetic Aperture Radar Images. J. Tongji Univ. (Nat. Sci.) 2021, 49, 1202–1210. [Google Scholar]
  14. Gisinger, C.; Balss, U.; Pail, R.; Zhu, X.X.; Montazeri, S.; Gernhardt, S.; Eineder, M. Precise Three-Dimensional Stereo Localization of Corner Reflectors and Persistent Scatterers With TerraSAR-X. IEEE Trans. Geosci. Remote Sens. 2014, 53, 1782–1802. [Google Scholar] [CrossRef]
  15. Yang, M.; López-Dekker, P.; Dheenathayalan, P.; Liao, M.; Hanssen, R.F. On the value of corner reflectors and surface models in InSAR precise point positioning. ISPRS J. Photogramm. Remote Sens. 2019, 158, 113–122. [Google Scholar] [CrossRef]
  16. Yang, M.; Dheenathayalan, P.; López-Dekker, P.; van Leijen, F.; Liao, M.; Hanssen, R.F. On the influence of sub-pixel position correction for PS localization accuracy and time series quality. ISPRS J. Photogramm. Remote Sens. 2020, 165, 98–107. [Google Scholar] [CrossRef]
  17. Weng, Y.K.; Li, S.; Yang, J.L.; Yi, H.; Wang, H.; Ma, Y. Fast Solution to the RCS of Corner Reflector for the SAR Radiometric Calibration. Geomat. Inf. Sci. Wuhan Univ. 2015, 40, 1551–1556. [Google Scholar] [CrossRef]
  18. Banyai, L.; Nagy, L.; Hooper, A.; Bozso, I.; Szucs, E.; Wesztergom, V. Investigation of Integrated Twin Corner Reflectors Designed for 3-D InSAR Applications. IEEE Geosci. Remote Sens. Lett. 2019, 99, 1–4. [Google Scholar] [CrossRef]
  19. Dheenathayalan, P.; Cuenca, M.C.; Hoogeboom, P.; Hanssen, R.F. Small Reflectors for Ground Motion Monitoring With InSAR. IEEE Trans. Geosci. Remote Sens. 2017, 99, 1–10. [Google Scholar] [CrossRef]
  20. Matthew, G. On the Design of Radar Corner Reflectors for Deformation Monitoring in Multi-Frequency InSAR. Remote Sens. 2017, 9, 648. [Google Scholar] [CrossRef]
  21. Czikhardt, R.; van der Marel, H.; van Leijen, F.J.; Hanssen, R.F. Estimating Signal-to-Clutter Ratio of InSAR Corner Reflectors From SAR Time Series. IEEE Geosci. Remote Sens. Lett. 2021, 99, 1–16. [Google Scholar] [CrossRef]
  22. Wang, S.Y.; Jeng, S.K. A compact RCS formula for a dihedral corner reflector at arbitrary aspect angles. IEEE Trans. Antennas Propag. 1998, 46, 1112–1113. [Google Scholar] [CrossRef]
  23. Griesser, T.; Balanis, C. Backscatter analysis of dihedral corner reflectors using physical optics and the physical theory of diffraction. IEEE Trans. Antennas Propag. 1987, 35, 1137–1147. [Google Scholar] [CrossRef]
  24. Anderson, W. Consequences of nonorthogonality on the scattering properties of dihedral reflectors. IEEE Trans. Antennas Propag. 1987, 35, 1154–1159. [Google Scholar] [CrossRef]
  25. Griesser, T.; Balanis, C.; Liu, K. RCS analysis and reduction for lossy dihedral corner reflectors. Proc. IEEE 1989, 77, 806–814. [Google Scholar] [CrossRef]
  26. Lu, T.; Wang, Y.; Yang, H.; Huang, X.; Zhou, Y.; Wu, J. Absorbing properties of metamaterial dihedral corner reflector. Mater. Res. Express 2020, 7, 025802. [Google Scholar] [CrossRef]
  27. Doerry, A.W. Reflectors for SAR Performance Testing. Reflection; Sandia National Lab.: Albuquerque, NM, USA, 2008; pp. 10–11. [CrossRef]
  28. Czikhardt, R.; Van Der Marel, H.; Papco, J. GECORIS: An Open-Source Toolbox for Analyzing Time Series of Corner Reflectors in InSAR Geodesy. Remote Sens. 2021, 13, 926. [Google Scholar] [CrossRef]
Figure 1. (a) The schematic diagram of the cross-section of the effective scattering area for the dihedral reflector. (b) The 3D schematic diagram of the effective scattering area of the dihedral reflector.
Applsci 14 05054 g001
Figure 2. (a) The schematic diagram of the RCS increase caused by the CR’s side length. (b) The RCS reduction curve caused by the CR’s deviation angle.
Applsci 14 05054 g002
Figure 3. (a) The schematic diagram of the Sentinel and TSX data coverage test area; (b) the schematic diagram of the Huangtupo slope area and the location of the CRs; (c) the photos and installation time of multiple types of corner reflectors.
Applsci 14 05054 g003
Figure 4. The structure of the novel dihedral CR; (a,c) are the dihedral CR with semicircular and square panels; (b,d) are the corresponding trapezoidal structure.
Applsci 14 05054 g004
Figure 5. (a,b) Are the average intensity images of the Sentinel (Track 084) and TSX (ascending track) of the CR array on the Huangtupo slope; (c,d) are the enlarged intensity images of the CRs under the Sentinel and TSX data.
Applsci 14 05054 g005
Figure 6. (a,c) Are the RCS reduction results caused by the deviation angle β in the Sentinel and TSX data; (b,d) are the RCS discrepancy between the model and the measured results in the Sentinel and TSX data.
Applsci 14 05054 g006
Figure 7. The RCS time series of the triangular CR under Sentinel (a) and TSX (b) data.
Applsci 14 05054 g007
Figure 8. The RCS time series of the horizontally placed dihedral reflector under Sentinel (a) and TSX (b) data.
Applsci 14 05054 g008
Figure 9. The RCS time series of the dihedral reflector with a tilt angle of 10°under Sentinel (a) and TSX (b) data.
Applsci 14 05054 g009
Figure 10. The RCS time series of the dihedral reflector with a tilt angle of 15° under Sentinel (a) and TSX (b) data.
Applsci 14 05054 g010
Figure 11. The theoretical deformation monitoring accuracy of the CR array in the Sentinel (a) and TSX (b) data.
Applsci 14 05054 g011
Table 1. The main parameters of the SAR data.
SAR SensorTSXSentinel
band/wave lengthX/3.1 cmC/5.6 cm
orbitAscendingDescendingAscending
(084)
Ascending
(011)
local incident angle38°29°44°32°
range resolution0.92.3
azimuth resolution1.313.9
Table 2. The types of CR and corresponding axis deviation angles.
NumberTypeLength
/Diameter
(m)
Tilt Angle
α (°)
SentinelTSX
β
(084 Track)
β
(011 Track)
Δ β
(°)
β
(ASC)
β
(DES)
Δ β
(°)
First groupDR1~DR2semi-circular panelϕ = 0.60113127169
DR3square panela = 0.40113127169
Second groupDR4~DR5semi-circular panelϕ = 0.610−936−363
DR6semi-circular panelϕ = 0.810−936−363
Third groupDR7semi-circular panelϕ = 0.615−14−212−817
DR8semi-circular panelϕ = 0.815−14−212−817
Fourth groupCR1~CR2Triangular CR (ascending)l = 1.220−936
CR3~CR4Triangular CR (descending)l = 1.220 −363
Disclaimer/Publisher’s Note: The statements, opinions and data contained in all publications are solely those of the individual author(s) and contributor(s) and not of MDPI and/or the editor(s). MDPI and/or the editor(s) disclaim responsibility for any injury to people or property resulting from any ideas, methods, instructions or products referred to in the content.

