1. Introduction
Air pollution is globally recognized as a significant environmental issue that not only affects the quality of the environment but also poses a serious threat to human health [
1]. Studies have indicated that outdoor particulate matter (PM) pollution is a more critical public health risk factor than previously believed. There is a close association between high concentrations of air pollution and mortality rates, a finding that is particularly significant for countries with the highest concentrations of air pollution [
2]. Additionally, fine PM pollution adversely affects the respiratory health of humans and animals. Concentrations of PM, comprising carbonaceous material, elemental carbon, sulphates, nitrates, ammonia, and resuspended particles, are linked to a variety of clinical manifestations of pulmonary and cardiovascular diseases, as well as to the morbidity and mortality associated with respiratory diseases in humans and animals [
3,
4,
5].
In Zhang and Cao’s study on PM at the urban level in China, they discovered that only 25 out of 190 Chinese cities adhered to the national ambient air quality standards. The population-weighted mean concentration of PM2.5 in these cities was reported to be 61 μg/m
3, which is approximately three times the global population-weighted average, underscoring a critical issue of fine particulate pollution in China [
6].
In related research examining the concentrations of PM2.5 and PM10 in relation to traffic characteristics in Macau, Lei and Ma reported that the correlation between hourly traffic flow and concentrations of PM10 and PM2.5 was weak, with coefficients of determination (R
2) ranging from 0.001 to 0.122. Furthermore, the relationship between vehicle types and concentrations of PM10 and PM2.5 was also found to be weak, with R
2 values from 0.000 to 0.043. At the monitoring sites in Macau, there was almost no correlation between local traffic volumes and PM concentrations at roadside stations, leading to the conclusion that PM concentrations are more likely influenced by regional sources and meteorological conditions. Nevertheless, the complex geographical environment of Macau might also play a role in influencing these findings [
7]. Consequently, our study primarily focuses on the impact of meteorological factors on PM in Macau.
Machine learning has been extensively applied in the field of air quality prediction, which encompasses pollutants such as PM, sulfur dioxide (SO
2), nitrogen oxides (NOx), volatile organic compounds (VOCs), ozone (O
3), and carbon monoxide (CO). To forecast the Air Quality Index (AQI) levels in Taiwan, Liang et al. utilized 11 years of data from the Taiwan Environmental Protection Agency and employed several machine learning algorithms, including Adaptive Boosting (AdaBoost), Artificial Neural Networks (ANNs), Random Forest, and Support Vector Machines (SVMs). The study found that AdaBoost and Random Forest exhibited the best predictive performance. Future work should focus on hyperparameter optimization of these models to further enhance their performance [
8]. Research by Díaz-Robles et al. demonstrated that using hybrid models could improve prediction accuracy. Their study on PM10 levels in the Comodoro Rivadavia area using a hybrid model, which leveraged the nonlinear modeling capabilities of ANN and the time series modeling abilities of ARIMA, showed improved prediction accuracy and the ability to capture extreme events. The potential applications of hybrid models are not limited to Chile but can be extended to other regions for air quality forecasting [
9]. In 2019, U. Pak et al. presented a CNN-LSTM model augmented with a Mutual Information (MI) estimator for predicting daily average PM2.5 concentrations in Beijing. This model employs a Spatiotemporal Feature Vector (STFV) to capture both linear and nonlinear correlations among environmental data collected from 384 monitoring stations across China, spanning from 2015 to 2017. By integrating historical air quality and meteorological data into a deep learning framework, the model demonstrates enhanced accuracy and stability in forecasting PM2.5 levels compared to traditional methods such as MLP and LSTM [
10]. In 2021, S. Chae et al. introduced an Interpolated Convolutional Neural Network (ICNN) for real-time prediction of PM10 and PM2.5 concentrations. This model employs interpolation to transform irregular spatial air quality and weather data into a uniform grid for CNN processing. The ICNN demonstrated high accuracy with an R-squared value over 0.97 and a root mean square error (RMSE) around 16% of the standard deviation. It also effectively forecasted high PM concentrations, with detection probabilities and critical success indices both exceeding 0.90 and 0.85, respectively [
11]. In 2023, Y. Zhang and Q. Yan developed a novel spatiotemporal model, the Label Distribution Spatiotemporal Prediction Model (LDSPM), employing the K-Core algorithm concept combined with label distribution learning. This model integrates K-Core techniques with label distribution support vector regression to assess the impact of meteorological factors on PM2.5 levels. Each factor is analyzed using complete ensemble empirical mode decomposition with adaptive noise and predicted through a long short-term memory neural network. The final predictions are refined using a particle swarm optimization extreme learning machine, demonstrating superior performance compared to existing models and offering innovative approaches for PM2.5 prediction [
12].
During the period from 1998 to 2012, there were some studies on air quality forecasting in Macau. In 1998, Mok and Tam utilized machine learning methods to predict future five-day concentrations of SO2 in Macau using ANNs as the prediction model. The results indicated that the accuracy of the ANN models was within 14.45% and 13.71% for two testing periods, suggesting the potential of ANNs in air quality forecasting [
13]. In 2008, Hoi et al. applied the Kalman filter algorithm to predict winter PM10 concentrations in Macau. The algorithm was implemented on AR(2) and AREX models, with the latter incorporating meteorological data such as wind speed and direction as external inputs on the basis of the AR(2) model. The study showed that the Kalman filter algorithm could be used for forecasting and that the AREX model outperformed the AR(2) model in terms of prediction accuracy [
14]. In 2012, Vong et al. constructed five different models, including the linear and radial basis function models of SVM, to predict daily environmental air pollutant concentrations in Macau and compared the prediction accuracy of these models. The study revealed that both the linear and radial basis function models of SVM demonstrated good performance. Future efforts could explore the combination of genetic algorithms with SVM to improve the accuracy and efficiency of the models [
15].
Since 2020, three research papers focusing on the prediction of air quality in Macau have been published, rekindling interest in this area. In 2020, Fong et al. utilized long short-term memory (LSTM) recurrent neural networks to predict future concentrations of air pollution substances (APSs) in Macau. The study also incorporated pre-trained neural networks using transfer learning to assist in constructing high-accuracy neural network models. The results indicated that LSTM networks initialized with pre-trained neural networks achieved a higher level of prediction accuracy and required fewer training iterations [
16]. In 2022, to predict the levels of PM10 and PM2.5 in Macau, Lei et al. employed machine learning methods such as Random Forest (RF), Gradient Boosting (GB), support vector regression (SVR), and Multiple Linear Regression (MLR). The study found that Random Forest (RF) was a reliable method for predicting pollutant concentrations in Macau, especially during periods of dramatic changes in air quality due to large-scale pandemic-related lockdowns [
17]. In 2023, Lei et al. utilized Artificial Neural Networks (ANNs), Random Forest (RF), Extreme Gradient Boosting (GBX), support vector regression (SVR), and Multiple Linear Regression (MLR) to predict 24 h and 48 h concentrations of PM10, PM2.5, and CO in Macau. The results demonstrated that RF and SVM performed best in predicting concentrations of PM10, PM2.5, and CO [
18]. Thus, machine learning research on air quality prediction in Macau is still in its early stages, necessitating further in-depth and extensive exploration.
Our study comprehensively applies historical data analysis, correlation analysis, and machine learning prediction methods to analyze the temporal variations in and meteorological influences on PM2.5 concentrations in the Macau region. Historical statistical methods revealed the temporal characteristics of PM concentrations. Correlation analysis was used to explore the relationships between PM2.5 concentrations and meteorological factors. Furthermore, this paper developed and evaluated several machine learning models including CNN, LSTM, RF, and XGB, and significantly improved prediction performance through a Stacking ensemble learning method that combines predictions from multiple models.
2. Data
2.1. Data Collection
The dataset utilized for this investigation comprises two distinct segments. The initial segment is formed by publicly disclosed reports from the Macau Environmental Protection Bureau, which furnish daily average concentration data for PM2.5 and PM10 spanning the years 2015 to 2023. The subsequent segment originates from the Macau Meteorological Bureau, which supplies hourly pollutant concentration and meteorological data for the period from 2020 to 2022. This dataset includes hourly records of PM2.5, PM10, sea-level air pressure (PSEA), temperature (TEMP), relative humidity (HUMI), wind direction (WDIR), wind speed (WSPD), gusts (WGUS), precipitation (PREC), and sunshine duration (INSO). The comprehensive nature of these records ensures the reliability and accuracy of the data.
2.2. Data Preprocessing
Data preprocessing is a pivotal aspect of the research process. In the initial step, outliers were identified by employing the interquartile range method and incorporating domain knowledge from meteorology. This approach merged quantitative and qualitative methods to guarantee precise outlier detection. Interpolation techniques were subsequently applied to manage missing values within the dataset. Post outlier detection, a forward-filling method was implemented for handling the outliers, wherein outliers were replaced with data from the preceding time point. This approach preserved the coherence and temporal trend of the time series data, thereby minimizing their potential distortion of the subsequent analyses.
The hourly PM2.5 and PM10 data were then transformed into daily averages by computing the mean across each 24 h interval, aligning with the daily mean data collected over the prior eight years. An in-depth analysis on wind speed and direction was also executed, with the establishment of the east–west wind vector as the U wind component (orientated at 90 degrees for due east and 270 degrees for due west), and the north–south wind vector as the V wind component (orientated at 0 degrees for due north and 180 degrees for due south). This bifurcation aimed to dissect the nuanced influences of wind on pollutant dispersion more thoroughly.
In meteorological research, the Pearson correlation coefficient is frequently harnessed to evaluate inter-relations among variables. Accordingly, this study will utilize the Pearson correlation coefficient to elucidate the association between PM2.5 and PM10 concentrations and meteorological parameters. The formula applied for this purpose is delineated below:
The Pearson correlation coefficient, denoted as , quantifies the degree of linear correlation between variables X and Y. The variable represents the sample size, which is the number of data points. The notation denotes the value of variable X for the -th sample, and denotes the value of variable Y for the -th sample.
3. Temporal Variations in and Correlations between PM and Meteorological Factors
3.1. Trend Analysis of Hourly Data from 2020 to 2022 and Daily Average Data from 2015 to 2023
To verify the trend similarity, the hourly PM2.5 and PM10 data from 2020 to 2022 were converted into daily averages by calculating the mean over each 24 h period, ensuring that the data were on a consistent time scale. As shown in
Figure 1, trend lines for the daily data over the years from 2015 to 2023 are plotted alongside the daily average trend lines for the years from 2020 to 2022. These sets of trend lines are displayed in overlay for a visual comparison of the similarity in data trends, thereby demonstrating the usability of the hourly data. The trends of PM2.5 and PM10 between the hourly data from 2020 to 2022 and the daily average data from 2015 to 2023 were indicated to have a high degree of consistency, with Pearson coefficients being 0.884 and 0.868, respectively (
Figure 1). This substantiates the reliability of the hourly dataset, indicating that hourly data can effectively reflect long-term trends and can be utilized for further research and analysis.
A comprehensive analysis of the daily average data from 2015 to 2023 was conducted by calculating the daily average PM2.5 and PM10 levels for each year to study the fluctuations in air quality throughout the year and to determine if there were any significant changes during specific periods. As depicted in
Figure 2, the average concentrations of PM2.5 and PM10 for each month and each quarter were calculated and presented in bar graphs to further understand the variations in air quality between different seasons. Additionally, composite time series graphs were utilized to reveal the trends and potential seasonal patterns in PM2.5 and PM10 concentrations. It was found that PM2.5 and PM10 concentrations exhibited distinct seasonal patterns, as demonstrated in
Figure 2, with higher concentrations in winter and lower concentrations in summer [
19].
3.2. Hourly Variations in Pollutant Concentrations
In the exploration of variations in and distributions of pollutant concentrations throughout the day using hourly data, binning for PM2.5 and PM10 concentrations was conducted with a bin width of 2, and their concentration measurements were allocated to the corresponding intervals. By grouping the observation times with the binned pollutant data, the frequency and probability for each concentration interval were calculated. As depicted in
Figure 3, filled contours were plotted to visualize the probability of each concentration interval occurring during each hour of the day. Furthermore, the hourly average concentration trend lines were overlaid on top of the contour plot to more clearly display the daily trend of pollutant concentrations, thus enhancing the understanding and interpretation of the diurnal pattern of pollutant concentration changes.
The observation results indicated that the concentrations of PM2.5 and PM10 are higher during the day than at night, a pattern that may be associated with increased traffic emissions and human activities during daytime hours. Additionally, an increase in PM10 concentrations was observed during the early morning hours, which could be related to meteorological conditions unfavorable for pollutant dispersion from night until early morning.
3.3. Overall Correlation and Seasonal Analysis of the Relationship between Pollutants and Meteorological Factors
Data provided by the Macau Meteorological and Geophysical Bureau were utilized to analyze the correlation between pollutant concentrations and meteorological factors. The dataset includes measurements of pollutants such as PM2.5 and PM10, alongside meteorological data: temperature (TEMP), relative humidity (HUMI), sea-level atmospheric pressure (PSEA), wind direction (WDIR), and wind speed (WSPD), among other parameters. The Pearson correlation coefficients between the pollutant variables and meteorological variables were calculated, and a heatmap of these coefficients was generated to aid in better understanding the relationship between meteorological factors and air quality.
As meteorological conditions vary with changing seasons, the impact of seasonal weather patterns on the dispersion and deposition of pollutants was also considered. The Pearson correlation coefficients for each season’s data were computed, and corresponding seasonal heatmaps were created. This approach more clearly demonstrates the effect of seasonal variations on the relationship between meteorological conditions and pollutants, which is of significant importance for a deeper understanding of how meteorological conditions impact air quality and of seasonal air quality prediction and management.
The overall correlation analysis indicates that a significant correlation exists between PM2.5 and PM10 and meteorological factors. PM is found to be primarily strongly correlated with sea-level atmospheric pressure (PSEA), temperature (TEMP), and relative humidity (HUMI) [
20]. PM2.5 is observed to exhibit a negative correlation with temperature (TEMP) and relative humidity (HUMI), and a positive correlation with sea-level atmospheric pressure (PSEA) and the U wind component (the east–west wind vector). PM10 is noted to have a negative correlation with relative humidity (HUMI) and a positive correlation with sea-level atmospheric pressure (PSEA), as shown in
Figure 4.
In the seasonal analysis (
Figure 5), the correlations are found to vary across different seasons:
In spring, PM2.5 and PM10 are shown to have a clear relationship with sea-level atmospheric pressure (PSEA). Additionally, PM10 is also notably correlated with the V wind component (the north–south wind vector) and relative humidity (HUMI).
In summer, the correlation of both PM2.5 and PM10 with temperature (TEMP) is found to be significantly stronger.
In autumn, PM2.5 and PM10 are seen to have a strong correlation with relative humidity (HUMI), and also exhibit a certain degree of correlation with the U wind component (east–west wind vector) and sea-level atmospheric pressure (PSEA).
In winter, the correlation between PM2.5 and PM10 and relative humidity (HU-MI) is observed to significantly increase.
3.4. Study on the Correlation between Boundary Layer Height, Atmospheric Stability, and Particulate Matter
Boundary layer height data for Macau (sourced from ERA5 reanalysis data) and atmospheric stability data (sourced from radiosonde data from Hong Kong) were selected for this study to conduct a correlation analysis with the pollutant data. These two datasets were utilized in conjunction with pollutant data for the correlation study. The research findings indicate that a certain relationship is identified between atmospheric stability and PM2.5 and PM10 air pollution levels in Macau, with correlation coefficients being 0.40 and 0.387, respectively [
21]. While boundary layer height is typically somewhat correlated with PM concentrations in many regions [
22], the levels of PM in Macau are found to show little relationship with boundary layer height.
5. Discussion
We conducted an in-depth analysis of the spatiotemporal characteristics of PM2.5 and PM10 concentrations in Macau and their associations with meteorological conditions. The results revealed a distinct seasonal pattern in PM concentrations, particularly during autumn and winter seasons. Relative humidity exhibited a significant positive correlation with PM2.5, which may be attributed to the influence of humidity on photochemical reactions and the promotion of secondary pollutant formation, highlighting the need for controlling precursor pollutants and secondary pollutants. Low-temperature and high-humidity conditions could potentially inhibit pollutant dispersion and promote the formation of secondary organic aerosols, exacerbating haze pollution. On the other hand, there is a negative correlation between temperature and PM levels during spring and autumn, mainly due to regional characteristics and atmospheric stability. In terms of regional characteristics, cold air moving south from the continent lowers temperatures and brings pollutants from northern cities to Macau. Conversely, when maritime airflow is dominant, south winds bring clean air from the ocean. Regarding atmospheric stability, when the ground is colder, a temperature inversion occurs with warmer air above and cooler air below, hindering vertical air dispersion. However, when the ground is warmer, convection is more easily triggered, leading to precipitation that helps disperse and settle air pollutants. Hourly data analysis identified daytime and early morning as peak periods for pollutant concentrations in Macau, which is crucial for implementing monitoring, early warning, and emission reduction measures, with particular emphasis on analyzing the composition of secondary pollutants during the day. The research findings provide baseline data for assessing the impact of air pollution on public health, and subsequent analysis of pollution components to identify major harmful substances will be of significant importance, aiding in the development of appropriate public health protection strategies.
The integration of multiple classifiers through a Stacking ensemble learning methodology demonstrably enhances performance beyond that achieved by the selection of the best individual classifier [
29]. This approach, when juxtaposed with current state-of-the-art techniques, consistently produces lower error rates and attains predictions of higher accuracy [
30]. As a result of these findings, the Stacking ensemble learning strategy has achieved broad acclaim within the scientific community.
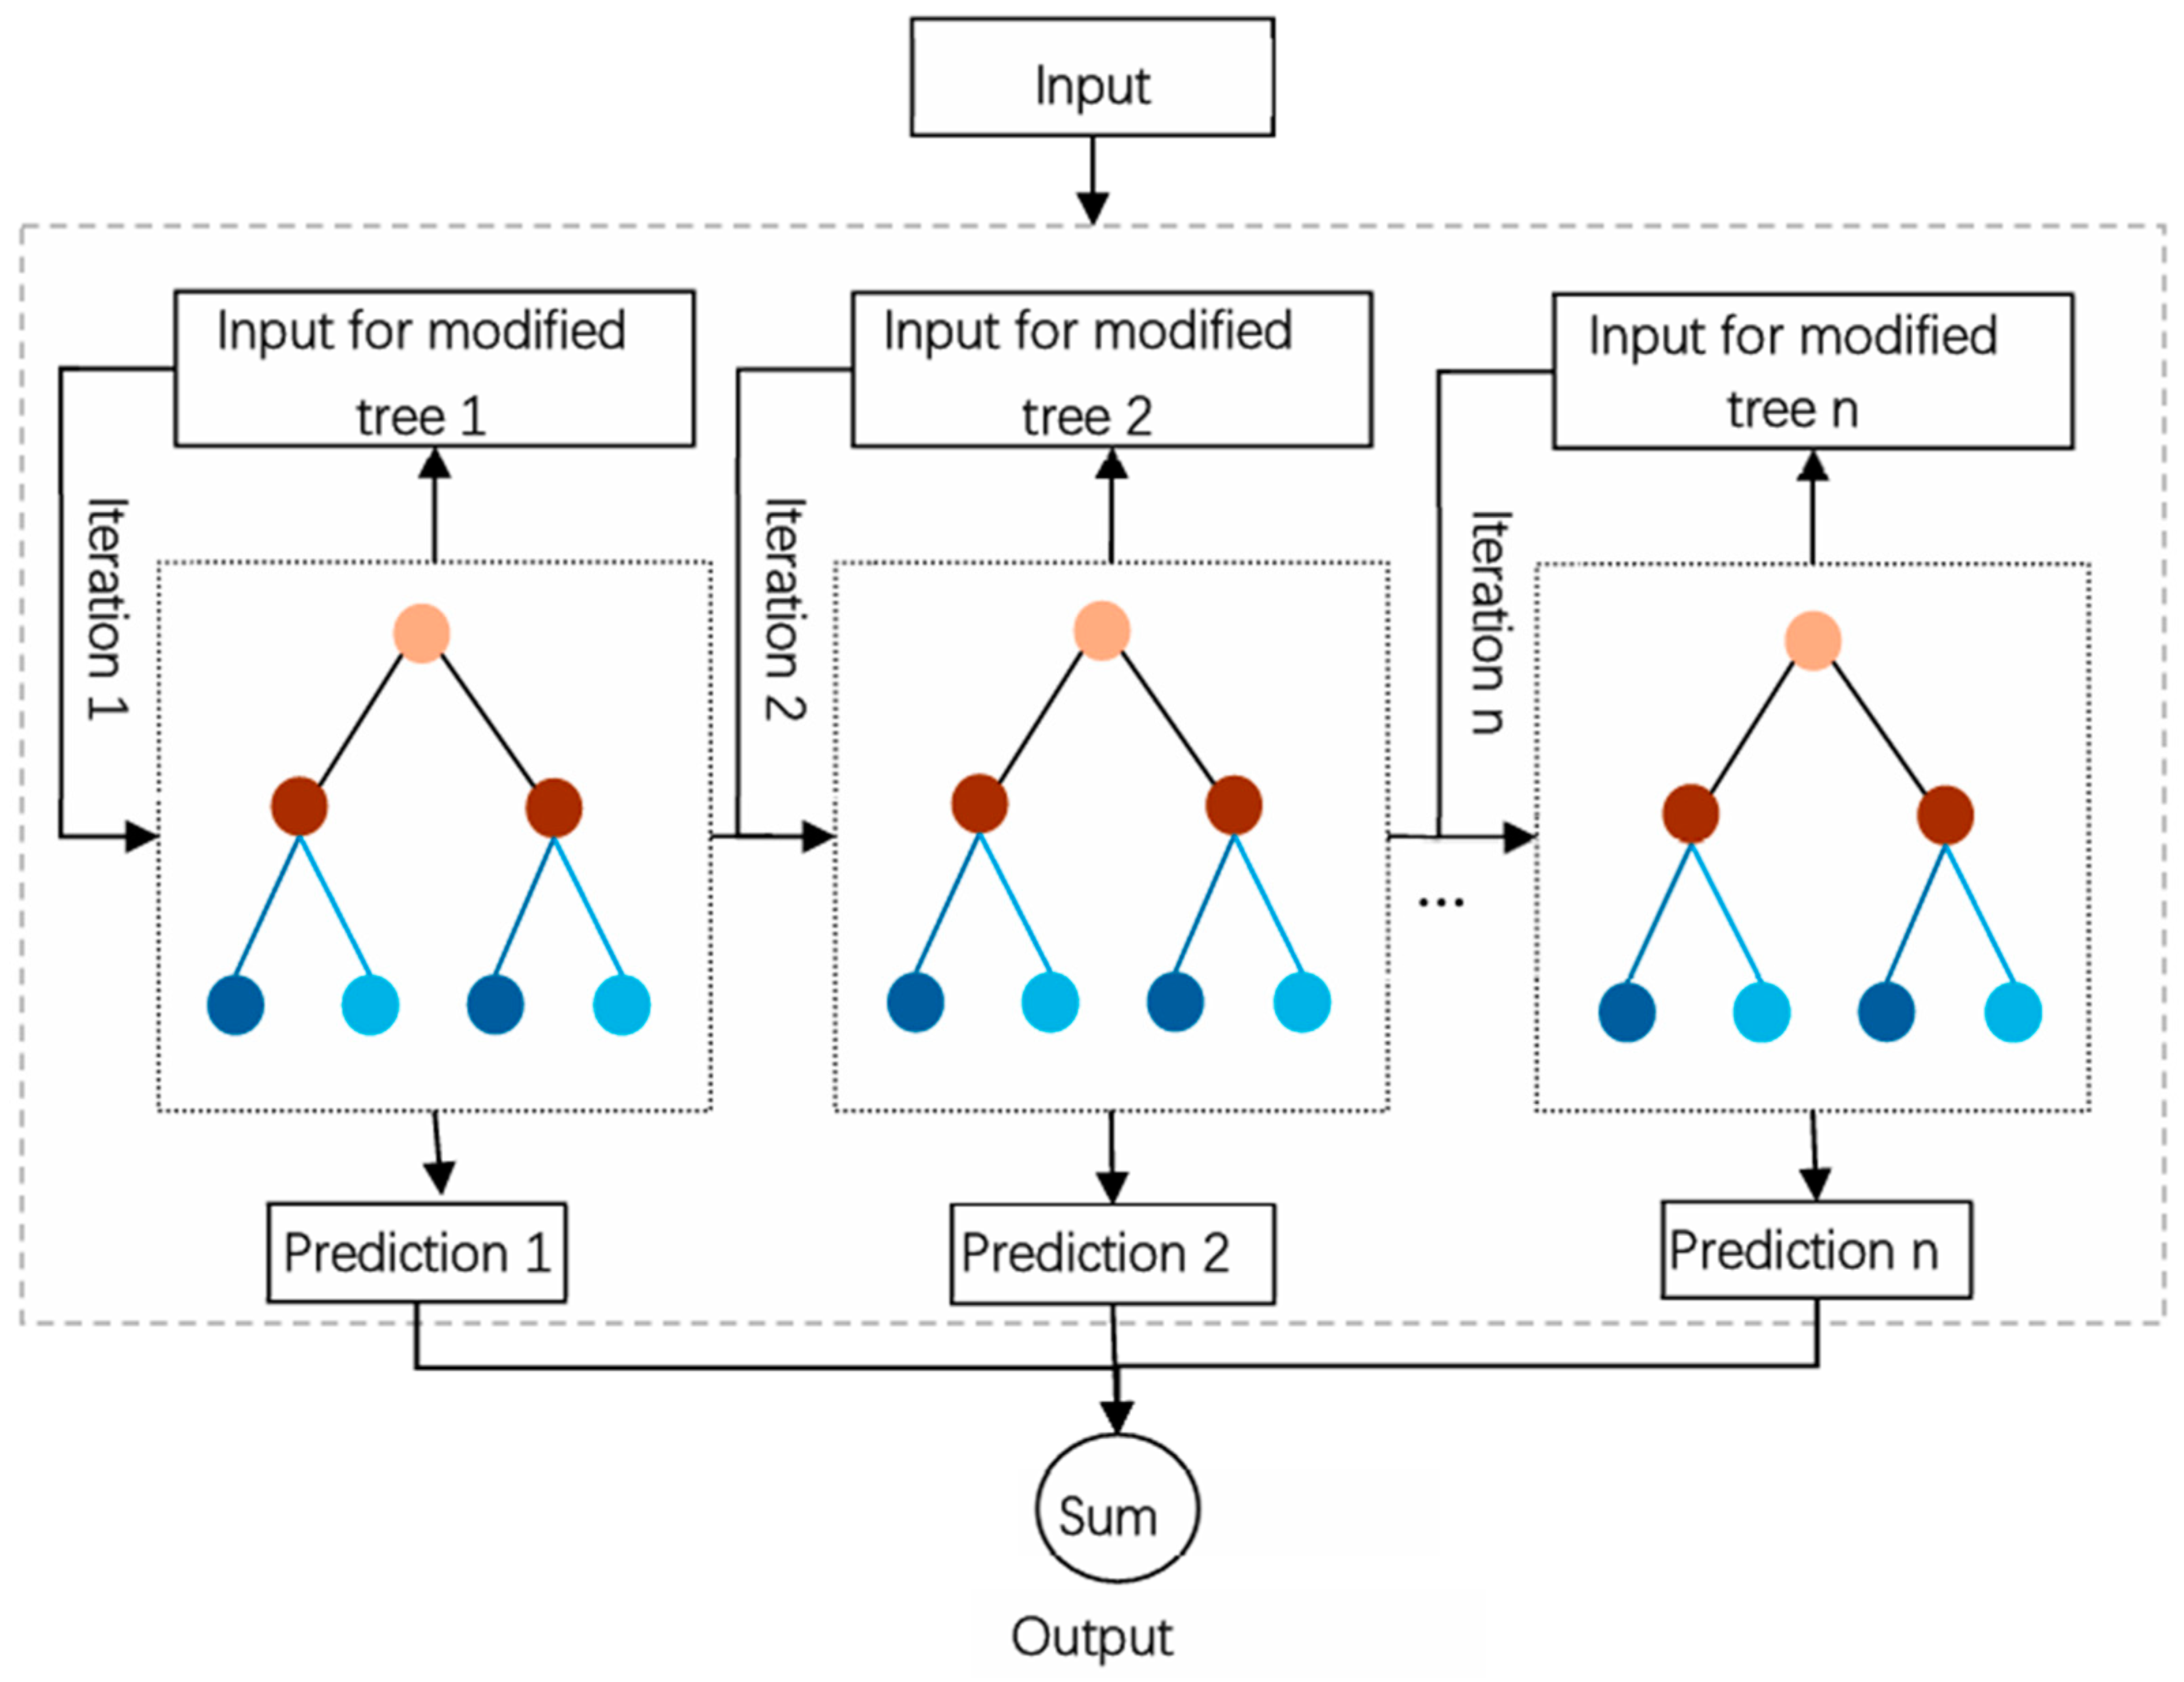
To improve the prediction accuracy of pollutant concentrations, we proposed a model based on Stacking ensemble learning. This model combines LSTM and XGBoost as base learners to capture different patterns in the PM2.5 data, and utilizes LightGBM as a meta-learner to integrate the outputs of the base learners, achieving optimal prediction performance. Empirical results demonstrate that the Stacking model can effectively capture the overall trends and patterns of actual PM2.5 concentrations, exhibiting particularly precise predictions in the tail region of the data. Although there are still some shortcomings in handling peak values and outliers, the model generally exhibits strong robustness and stable predictive ability for PM2.5 fluctuations. The Stacking model outperforms single models (such as CNN, LSTM, RF, XGB) in evaluation metrics such as mean squared error, root mean squared error, and mean absolute error, providing ample evidence that the ensemble learning framework effectively enhances generalization ability and prediction accuracy by integrating the strengths of multiple models. This model architecture reduces the potential biases of any single model and fully leverages the advantages of ensemble learning, offering an efficient solution for air quality prediction in Macau.


